 Anne Richelle
 Brandon Corbett2
 Piyush Agarwal
- 1Sartorius Corporate Research, Brussels, Belgium
- 2Sartorius Corporate Research, Toronto, ON, Canada
- 3Sartorius Corporate Research, Umeå, Sweden
There is a growing interest in continuous processing of the biopharmaceutical industry. However, the technology transfer from traditional batch-based processes is considered a challenge as protocol and tools still remain to be established for their usage at the manufacturing scale. Here, we present a model-based approach to design optimized perfusion cultures of Chinese Hamster Ovary cells using only the knowledge captured during small-scale fed-batch experiments. The novelty of the proposed model lies in the simplicity of its structure. Thanks to the introduction of a new catch-all variable representing a bulk of by-products secreted by the cells during their cultivation, the model was able to successfully predict cellular behavior under different operating modes without changes in its formalism. To our knowledge, this is the first experimentally validated model capable, with a single set of parameters, to capture culture dynamic under different operating modes and at different scales.
1 Introduction
Currently, only one out of every 10,000 new drug candidates reaches the market. It takes on average 10 years from the discovery of a drug compound until its approval by federal agencies. The probability of clinical success is less than 10% (from Phase one to launch) (Dowden and Munro, 2019; Berdigaliyev and Aljofan, 2020). As a consequence, the cost of drug development is constantly increasing, with a current annual expenditure of more than 2 billion euros, while the actual revenues do not follow the same trend (DiMasi et al., 2016; Wouters et al., 2020).
In this context, we observe that biopharmaceutical companies tend to outsource their early activities in order to reduce their costs and to be more agile around potential market disruption (Mallapaty, 2017; Landhuis, 2018). This implies a growing need to accelerate the operational tasks (process development and product manufacturing). The path to acceleration for biopharmaceutical industry relies mostly on digitalization of process information (to fasten process development) and intensification of operations (to increase productivity and enable more flexibility in the production) (Steinwandter et al., 2019; Narayanan et al., 2022).
Digital bioprocessing is expected to provide significant competitive advantage to industry adopters (e.g., rapid process prototyping, improved process performance and product quality, and de-risked transfer to manufacturing) (Portela et al., 2021; Narayanan et al., 2022). This digital transformation requires the computerization of the information used and generated at each step of a product development process. Once all the information is digitized, it needs to be accessible, organized and contextualized (i.e., data management). This structured digital information can therefore be used to feed data analytics and associated modeling tools to generate valuable insights for further process optimization and control, thereby fasten process development (Finelli and Narasimhan, 2020; Banner et al., 2021; Wasalathanthri et al., 2021).
Today, the industry standard for proteins production, such as monoclonal antibodies, is a fed-batch process (Chen et al., 2018; Ha et al., 2022). However, the productivity of such a process can be significantly improved by implementing a continuous culture strategy to intensify the volumetric productivity. Such approach can lead to an increase up to 10-fold of space-time yields, therefore leading to a reduction of production time by 30% (Müller et al., 2022). These improvements enable opportunity for much smaller facilities with similar or larger productivity outputs, limiting the capital investment (for facilities and raw material costs) and providing manufacturing flexibility and sustainability (Bielser et al., 2018; Chen et al., 2018; Müller et al., 2022).
Such transition from traditional (fed)-batch to continuous manufacturing is facilitated by the emergence of various technological enablers (Rathore et al., 2022) and is encouraged by health authorities (i.e., US Food and Drug Administration). However, the adoption is relatively slow as many challenges remain. Indeed, scale-down models, decisional tools, equipment and procedures currently in place, in most companies, have been developed for fed-batch processes and cannot be transposed without significant changes (Chen et al., 2018). Therefore, this transition might be seeming a high cost and time demand investment to modify existing process development protocols (Papathanasiou et al., 2017; Bielser et al., 2018; Müller et al., 2022). In this context, advanced computational tools could be used to elucidate changes in process dynamics and assess the influence of varying operating scenarios. These in-silico tools provide testing platforms for early determination of process bottlenecks at minimum experimental costs and enable the design of advanced optimization strategies that will lead to optimal and stable operation (Papathanasiou et al., 2017; Rathore et al., 2022).
While this burden for digital transition and technology transfer has been observed in the past (and successfully overcome) in other industry sector (e.g., petrochemical companies, aeronautics), biopharma faces the additional challenge of its operation relying on complex biological systems that cannot be easily described with known first principles rules (Strube et al., 2018). Numerous modelling studies successfully characterizing the influence of measurable process conditions on culture dynamic exist in literature (Smiatek et al., 2020; Wang et al., 2020; Tsopanoglou and Jiménez del Val, 2021; Babi et al., 2022; Schwarz et al., 2022). Unfortunately, they often depend on numerous measurements not often available at manufacturing scale and/or complex modeling and optimization procedures requiring important computational expertise. Therefore, these model-based intensification strategies are difficult to transfer at industrial scale in spite of their most likely success (Papathanasiou et al., 2017; Papathanasiou and Kontoravdi, 2020). Here, we focused on the development of a modeling structure enabling the description of upstream bioprocess dynamics and the transfer between operations (specifically, from fed-batch to continuous culture) at different scales (from Ambr® 250 to Univessel® 2L) with a single set of kinetic parameters. We have demonstrated that the growth model identified using fed-batch cell cultures can be used to design intensified culture conditions in a one-step strategy. To our knowledge, this is the first experimentally validated methodology providing simulation capabilities appropriate for optimization and system configuration decisions within biopharmaceutical process development and advanced control activities.
2 Materials and methods
2.1 Cell line, inoculum development, medium and analytical methods
Chinese Hamster Ovary (CHO) DG44 cell line (Sartorius) expressing a monoclonal antibody (mAb, IgG1) was used. All experiments were carried out using the same chemically defined media (Sartorius) and Stock Culture Medium (SCM) for the seed train. The seed train cultures were performed in 5 steps. For the fed-batch processes, these pre culture steps were performed in (unbaffled) shake flasks. For the perfusion culture, the last pre-culture step was performed in a 2L Univessel®. The first and second pre culture steps were performed in SCM with 15nM MTX while the others were without MTX. Cells were seeded at 0.2 × 10⁶ cells/mL and split every 3–4 days. The incubators settings for the shake flasks were: 7.5% CO2, temperature at 36.8°C, 80% humidity, 120 rpm for agitation with an orbital diameter of 50 mm. Fed-batch, intensified and perfusion cultures were performed with a production medium (PM - Sartorius) and with two feed media (FMA and FMB -Sartorius). Cell growth (VCC and viability) were measured using a Flex analyzer (Nova Biomedical).
2.2 Fed-batch and intensified cultures in Ambr® 250
The fed-batch (Experiments 1-4) and intensified cultures (Experiment 5-7) were performed in Ambr® 250 bioreactor with a working volume of 200 and 210 ml respectively for fed-batch and intensified cultures. The cultures were inoculated at 0.3 × 10⁶ cells/mL. The feeding profiles were calculated off-line following the standard applications implemented in Sartorius. For the intensified cultures, the flow rate was adjusted daily from day 3. The culture conditions were controlled at 36.8°C for the temperature, pH 7.1 with CO2, 60% of DO with O2 and air inlets, 855 rpm for the agitation (adjusted during culture to maintain DO at 60%). 30 µL of antifoam (Sigma antifoam C 2%) was automatically added every 12 h and manually added if needed. A daily glucose bolus was performed starting on day 5 of culture if the measured glucose concentration was less than 5 g/L (stock glucose solution of 400 g/L).
2.3 Perfusion cultures in 2L bioreactor
The perfusion culture (Experiment 8) was performed in 2L Univessel® bioreactor with a working volume of 200 ml. The culture was inoculated at 0.3 × 10⁶ cells/mL. The perfusion medium was a mix of 91.2% of PM, 8% FMA, 0.8% FMB and 6mM of l-glutamine. The culture conditions were controlled at 36.8°C for the temperature, pH 6.95 ± 0.05 with CO2 and 1M NaCO3, 60% of DO with O2 and air inlets, 260 rpm for the agitation (adjusted during culture to maintain DO at 60%). 1 ml of antifoam (Sigma antifoam C 2%) was automatically added every day and manually added if needed. The flow rates of media additions and outlet of culture medium are detailed in Section 3.3.
3 Theory/calculation/modeling/theoretical aspects
3.1 Bioprocess description
Chinese Hamster Ovary (CHO) cells are typically cultivated in a bioreactor with controlled environmental conditions. CHO cell culture population can be divided into 3 subgroups: living (
A bioreactor can be operated in different modes by acting on the inlet (feeding medium addition,
- Batch mode: all substrates are added at the beginning of the culture and nothing is added (
- Fed-batch mode: the bioreactor is fed continuously in culture medium (
- Continuous mode: the bioreactor is fed continuously (
Perfusion culture is a type of continuous operation where the viable cell concentration (
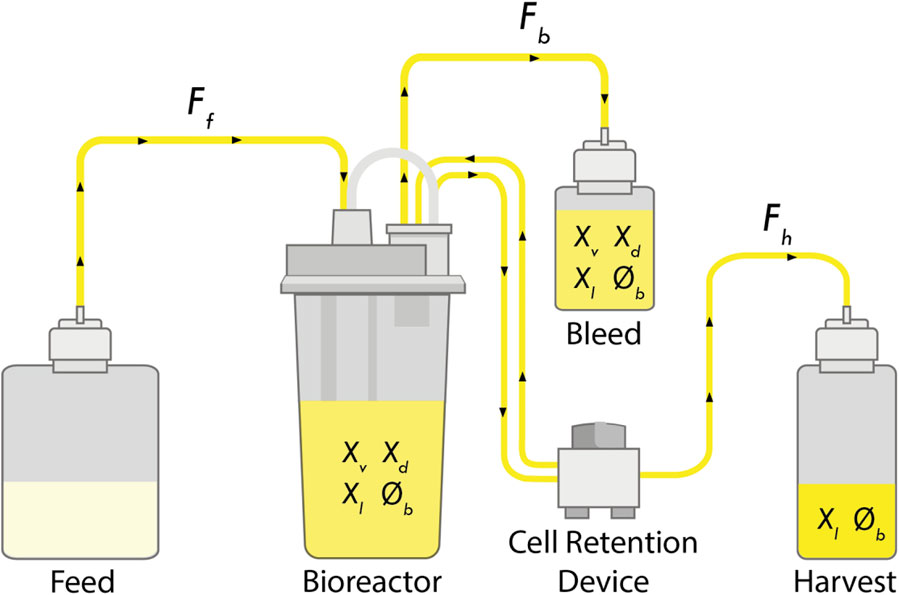
FIGURE 1. Schematic of a perfusion bioreactor. Media is continuously fed into the bioreactor (
3.2 Model development
The general dynamic of a bioprocess can be described by expressing the mass balance of each component (
where the notation
Using this formalism, the dynamic of the 3 cell population subgroups (
where
Here, we assumed that lysed cells
As the term
Doing so, the Eqs 2–5 can be rewritten as follows:
These mass balance equations are developed under the assumption that the bleed stream (
The cell growth rate (
where
Note that the description of the cell growth rate (
where
The effective death rate,
where
Finally, the lysing process was assumed to be governed by
Dead cells amount is evaluated indirectly through cell viability measurement which captures the ratio between viable cells and total cells:
3.3 Perfusion operations
The rate at which the media is exchanged in perfusion culture can be defined either by the cell specific perfusion rate (
Note that contrarily to the perfusion rate, the CSPR is cell and media specific. Therefore, it represents an important performance criterion (Bielser et al., 2018; Bausch et al., 2019).
Typically, a perfusion culture is set in two phases: intensification and steady-state. Firstly, the cells are growing exponentially until a pre-defined target viable cell concentration (
where
The second part of the perfusion culture is called the steady-state phase. It aims to maintain the viable cell concentration in the bioreactor at a predefined target value (
During the steady-state phase, the bleed stream is used as a manipulated process variable to control the viable cell concentration in the bioreactor. In the context of this study, we used a Proportional-Integral (PI) controller to define the bleed rate.
where
Finally, the harvest rate is determined based on the knowledge of the feed and bleed rates such as to maintain a constant volume:
3.4 Parameter identification
Dynamic equations were solved by MATLAB’s ordinary differential equation solver function ode15s. The parameter identification was performed by using the Nelder–Mead simplex optimization algorithm (function fminsearch) in order to minimize a least-squares criterion (sum of squared differences between model predictions and experimental measurements).
where
3.5 Parameter sensitivity analysis and predicted model output uncertainty
The analysis of the sensitivity of the model outputs with respect to the parameters was performed as in Richelle et al. (Richelle et al., 2014). To this end, the four state variables (
for i = 1 to 4, j = 1 to 4 and m = dim(y) = 4 with dyi/dt = fi (y, qj, t) represented by model Eqs 8–11.
These sensitivity functions were used for computing a lower bound of the variance (Cramer-Rao bound) of the parameter estimation errors (
The covariance matrix S could also be used to measure the correlation between the parameters (linear dependencies):
where
For analysing the uncertainty on the model outputs with respect to the parameter estimation errors, a global approach based on Monte Carlo sampling method was used. Contrarily to local approach based on first-order Taylor series approximation, this approach does not assume that the model responds linearly to a perturbation evaluated at a specific point of the parameter space. Instead, this sampling-based method uses a repeated random sampling of parameter values in a defined parameter space. In doing so, the overall model is used to generate the associated predicted model outputs by an iterative process of model simulations.
4 Results
4.1 Model identification using fed-batch cultures
We developed a growth model that tracks density and viability of a cell culture population (living, dead and lysed). The parameters of this model were identified based on 4 replicate fed-batch experiments performed in Ambr® 250 (see Section 2 for details). To circumvent local minima and convergence problems with the optimization algorithm, a multi-start strategy was considered for the initialization of the parameter values. 100 uniformly distributed pseudo-random values over a given range (Table 1) were used for the initialization of the algorithm. For analysing the uncertainty on the model outputs with respect to the parameter estimation errors, a global approach with a Monte Carlo simulation was used, based on 1000 normally distributed pseudo-random sets of parameter values (Figure 2).
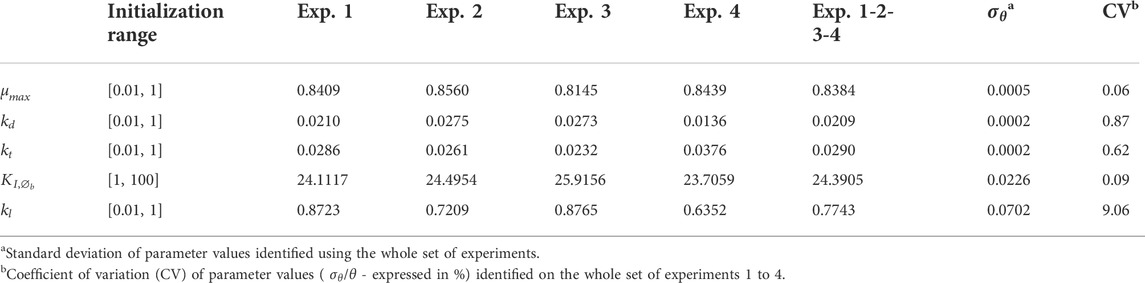
TABLE 1. Parameters values identified for each experiment separately and whole set of experiments 1 to 4.
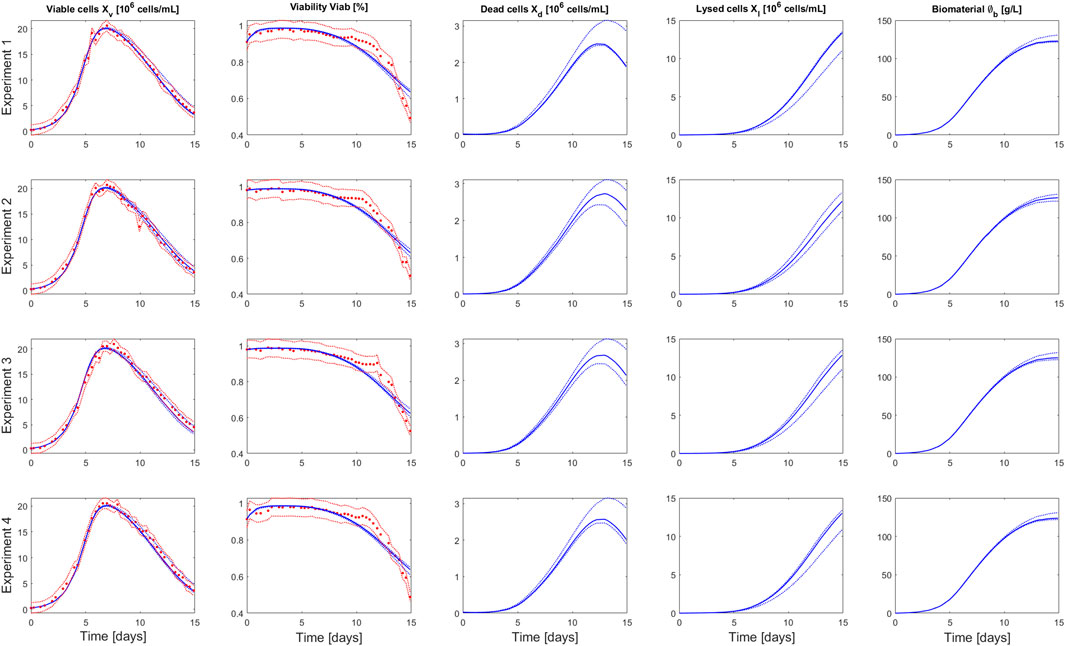
FIGURE 2. Comparison between measurements of Ambr® 250 fed-batch experiments 1–4 (red dots) and the model simulation (blue curve) performed using the parameters value identified on the whole set of experiments. The dashed red lines represent the experimental confidence interval. The dashed blue lines represent the uncertainty in the model predictions—calculated using Monte Carlo simulations (1000 samples) of normally distributed pseudo random parameters values (parameter space defined by
The identified parameter values (based on the 4 experiments) and associated confidence intervals are presented in Table 1 and the correlation matrix (absolute values of the correlation coefficients between parameters) in Table 2. Results obtained for the parameter identification of each experiment separately are also presented in Supplementary Tables S1–S6. The model simulations and associated prediction confidence intervals are presented in Figure 2 and Supplementary Figure S2 along with the experimental data used to identify the model.
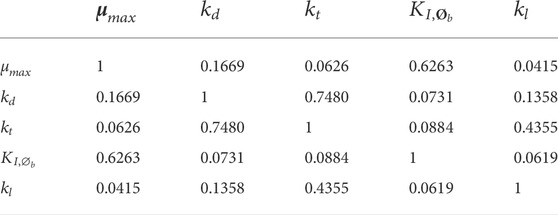
TABLE 2. Correlation matrix (absolute value) of the parameters identified on the whole set of experiment.
The model captures well the evolution of the viable cell density over the culture duration for the 4 experiments. The viability predictions present larger, but still acceptable, residuals than the ones of the viable cell density. We observe a marked transition in the decrease dynamic of the measured viability, at day 11 of the culture, that the model is not able to capture. Such shift in the viability evolution results, most likely, from a strain-specific adaptation to high level of toxic by-products as it was not systematically observed in cell cultures performed with different strains (data not shown). In this context, we decided to not introduce additional complexity to the model to capture this event.
The parameters were identified with good confidence, this was also reflected in the simulation of the model output uncertainty (Table 1 and Figure 2). The highest parameter correlation is observed between
4.2 Model-based prediction of intensified operations performance
The model was further cross-validated using data from Ambr® 250 intensified cultures (Experiments 5, 6 and 7 - see Methods for details). The model simulations successfully predicted the culture dynamic for intensified operations with media exchange. The intensification was achieved by harvesting the culture media at the same rate (
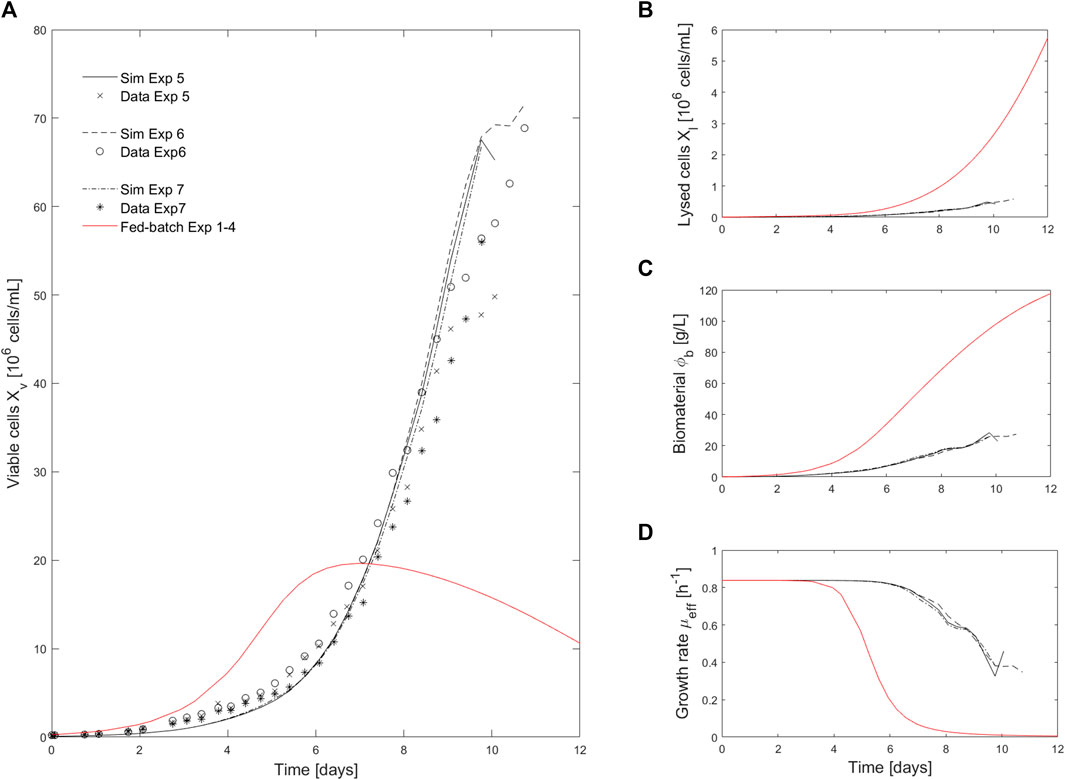
FIGURE 3. Comparison of intensified (media exchange) and fed-batch experiments. (A). Comparison of viable cell density (
The proposed model has a rather simple structure compared to the ones presented in literature. The overall formalism to describe the different cell population subgroups is, most often, conserved across existing models: cell growth and mortality occurs in parallel while dead cells are lysed over time. The main difference in our proposed structure lies in the description of the growth and dead rates. Indeed, it is well known that mammalian cell metabolism can be limited by the depletion of nutrients or by the accumulation of inhibitory metabolites (Lourenço da Silva et al., 1996). Therefore, the death and growth rate are typically described as extended Monod’s law (more than one compound influencing the reaction rate) accounting for diverse activating and inhibiting compounds.
For example, Shirahata et al. (Shirahata et al., 2019) modelled the growth rate in continuous operation with an inhibition by the accumulation of ammonia. Lourenço da Silva et al. (Lourenço da Silva et al., 1996) developed a kinetic model that describes the growth of hybridoma cells in fed-batch culture with decreasing and death enhancing effects of glucose, amino-acids, serum and oxygen depletion, on the one hand, and of ammonia and lactate accumulation on the other. Craven et al. (Craven et al., 2013) accounted in their growth model for the activation by substrates (glucose and glutamine) and inhibition by byproducts (lactate and ammonia). Papathanasiou et al. (Papathanasiou et al., 2017) used five metabolites (glucose, glutamine, arginine, aspartate, asparagine) to describe their activation and inhibition influence on growth and death processes.
The evaluation of the respective influence of these potential limiting factors is a difficult task. Several of these factors are often simultaneously limiting; leading to observed diversity in the model formalism for growth and death rates. Furthermore, the description of such activation and inhibition effects by multiple metabolites quickly complicates the model structure. Indeed, with this formalism, these compounds are introduced as state variables in the model and their associated kinetics need to be described. The main novelty of the proposed model is the introduction of a catch-all “biomaterial” variable (
4.3 Design and analysis of perfusion process conditions
The perfusion operation of a CHO cell culture was simulated with the proposed model structure using the following assumptions:
- The culture was performed in a 2L bioreactor Univessel®
- The initial seeding density and viability were set as for the Ambr® 250 fed-batch experiments
- The lysed cells and inhibitory biomaterial were initialized at 0
- There were no considerations for adjustment in growth changes during the simulation
- It was assumed that the media composition and perfusion rate is sufficient for supplying nutrients
Different events for process operation changes were introduced to test the capabilities of the model and the cell’s response to switch in operations (Table 3):
- The culture began with an intensification phase to reach the cell density target (
- Once the cell density reached 95% of the desired target
- An increase in the perfusion rate (
- A decrease of the perfusion rate (
- Finally, an increase of the cell density target (to
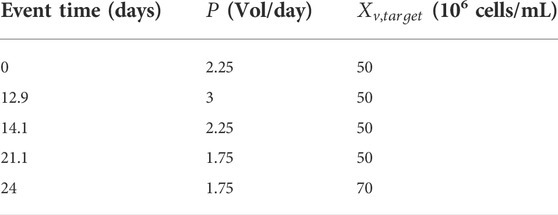
TABLE 3. Details of switch in process operations for perfusion simulation and experimental run.
The simulation of this perfusion experiment is presented in Figure 4 and Figure 5 along with the experimental data collected during a 2L perfusion bioreactor run performed under the same operations (Table 3) and with the same PI controller. Specifically, the PI controller relied on the model prediction of the viable cell density evolution for the simulated run while the viable cell density measured on-line was used when the controller was implemented for the experimental run. The model prediction accurately captured the dynamic of the cell culture in perfusion based on parameter values identified using Ambr® 250 fed-batch experiments. As observed in the model simulations of the fed-batch experiments 1-4 (Figure 2), the viability is associated to larger residuals than the viable cell density, but still holding close to the experimental confidence area. Importantly, the model accurately identified the decrease of cell viability (due to the accumulation of biomaterials) initiated once the perfusion rate was reduced (
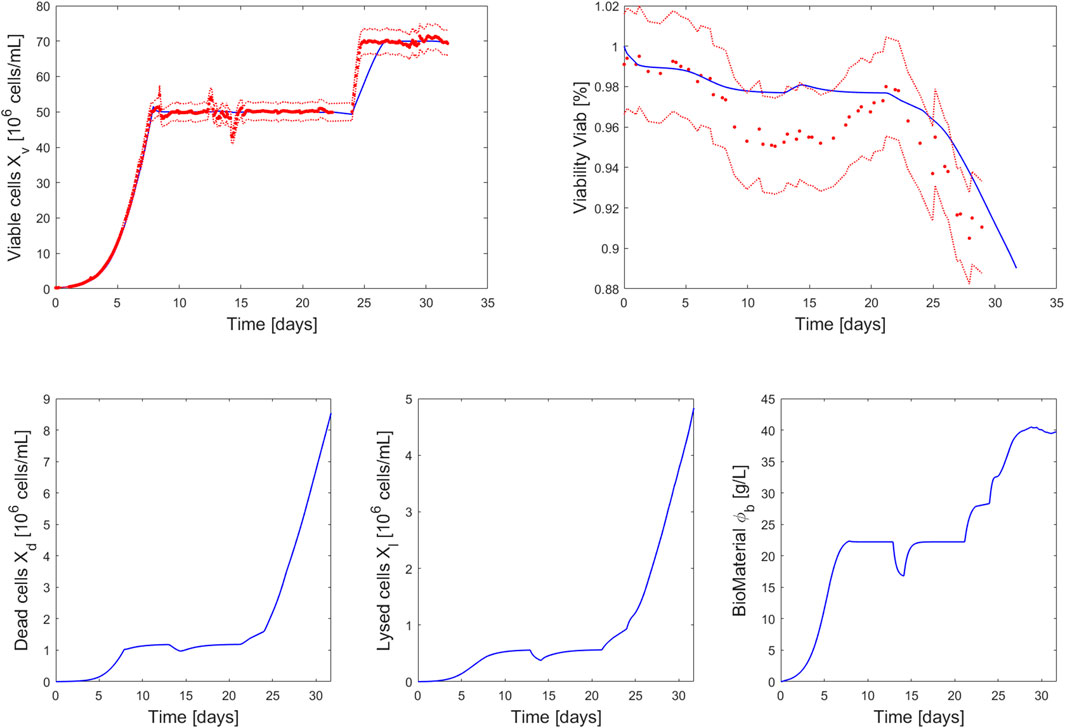
FIGURE 4. Comparison between measurements of 2L perfusion experiment 8 (red dots closed loop PI control of the viable cell density measured on-line at
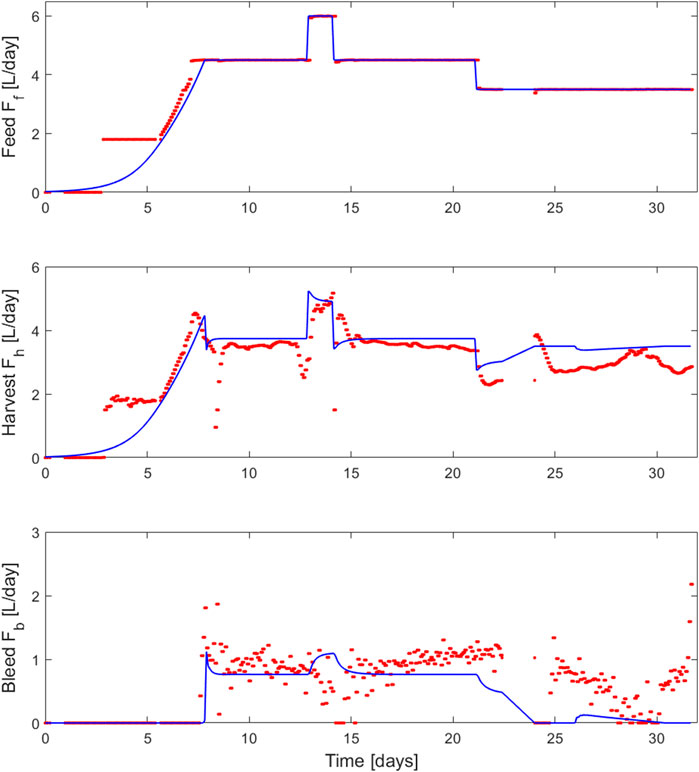
FIGURE 5. Comparison between the feed (
The PI controller adequately adjusted the bleed rate to hold a stable cell density during the simulation and the experimental run. The observed discrepancies between the outflow (
To our knowledge this is the first design of a perfusion culture using a model identified based on fed-batch experiments. Typically, models are developed for one type of culture (batch, fed-batch or continuous) and cannot be transferred to other process operation without changes in the model structure and/or parameter values. Shirahata et al. (Shirahata et al., 2019) modified the formalism of the growth rate function depending on the operation mode. Specifically, in batch mode, they simulated the viable cell dynamic using an activation by glucose and the onset of massive cell death when a glucose depletion occurs. In perfusion mode, the growth rate was no longer modelled in function of substrate consumption but rather with an inhibition due to ammonia accumulation in the culture medium. Lourenço da Silva et al. (Lourenço da Silva et al., 1996) successfully validated a kinetic model for hybridoma fed-batch culture and mentioned that they were capable to simulate experimental results obtained during batch and continuous processes with minor changes of few kinetic parameters. Unfortunately, the data were not shown. Finally, Craven et al. (Craven et al., 2013) developed a unique model structure for CHO cell culture operated under 3 different modes (batch, bolus fed-batch and continuous fed-batch) and grown under 2 scales (3 and 15 L) but the model parameters identified changed with scale and mode of operation.
The presented model-based approach enabled to drastically improves the process performance (Table 4). This represents a reliable alternative to existing experimental procedure such as the ones presented in Janoschek et al. (Janoschek et al., 2018) and Wolf et al. (Wolf et al., 2019). These protocols rely on the evaluation and optimization of different feed, harvest and bleed strategies similar to a Design of Experiments (DoE) approach. While these methods have been proven to be successful, they are experimentally intensive and do not allow the user to test the system response to joint variation of multiple control variables and setpoints.
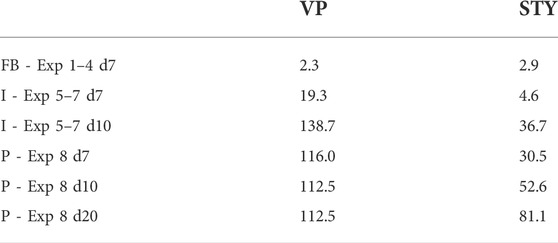
TABLE 4. Volumetric Productivity (VP—106 cells/mL.day) and Space-Time Yield (STY—106 cells/mL.day) associated with the fed-batch (FB), intensified (I) and perfusion (P) experiments at different days of culture (days 7, 10 and 20). Metrics calculated following the standards presented in Bausch et al. (Bausch et al., 2019).
5 Conclusion
The era of digital transformation has reached biopharma. In this context, in-silico computational tools will be essential to help optimize upstream bioprocesses and accelerate product development and production (Luo et al., 2021).
The goal of this study was to propose a model-based strategy to improve upstream cell culture development within biopharmaceutical manufacturing thanks to its process operation transfer capabilities. Often referred to as in-silico experimentation, subject matter experts (SME) can use the proposed framework to digitally test various hypothetical operating policies. Ideas can be honed and proposed before verifying in the lab. The hypothesized model was built from limited data with a focus on core growth kinetics and sensitivity to biomaterials. It can be used to investigate growth trajectories and evaluate media exchange operating modes (intensified growth and perfusion). To demonstrate these capabilities, the model was calibrated with Ambr® 250 fed-batch experiments and successfully used to forecast growth profiles under various operating modes including the cell line’s response to media exchange. The proposed model-based process design strategy was also tested by collaborators from biopharmaceutical companies with other cell lines producing different products (data not shown). While the set of parameters values identified varied for each case study, the proposed model structure was always capable of predicting changes in culture behavior for different operating conditions, as presented in this study.
As more experiments are run and data is collected, this generic model structure can continuously be extended to include additional metabolic information from shifts in pH, temperature, media composition and other important process conditions. Such model could therefore also be used to optimize media composition and recipe decisions to maximize productivity while maintaining Critical Quality Attributes (CQAs) within specification.
However, models describing the influence of spent media composition on productivity and product quality are far more complex and, currently, not as mature as those for growth description. This relates to growth and death kinetics being driven strongly by the extracellular environment, while productivity and CQAs (e.g., glycan profile) are influenced through more subtle shifts in the intracellular metabolism. For the moment, intracellular measurements are expensive and not practical for typical product development workflows or high throughput experimental designs. Therefore, analytical tool such as machine learning and other data driven methods would most likely be used to relate extracellular process measurements to the CQAs.
To conclude, using simulation is common practice in many process industries but a relatively new tool for biopharmaceutical manufacturing. Being able to test operating strategies digitally reduces wet lab experimental needs, speeding up the product development process. The big picture then - and the takeaway for biopharma companies - is to move toward an enhanced, optimized approach for upstream process development that makes use of existing information to bring transformation, optimization and ultimately, profitability. The key dynamic behind all of it is an integration of advanced data analytics, process knowledge and digital tools that transcend the traditional method of process monitoring and move toward digital twins powered by a systems approach of bio-simulation.
Data availability statement
The original contributions presented in the study are included in the article/Supplementary Material, further inquiries can be directed to the corresponding author.
Author contributions
AR, BC, PA, AV, and CM performed the modeling development and analyses. AR, JT, and CC wrote the manuscript. All authors reviewed the manuscript.
Funding
This work was funded by the employer of the authors (Sartorius).
Acknowledgments
We thank Steffi Scholze and others in the Sartorius Corporate Research team for their support in in the development of this study. We also thank Timo Schmidberger and the Sartorius Data Analytics team for their investment in the model evaluation, validation and benchmarking. The US Food and Drug Administration for their support in the development of in-silico process design and optimization strategies. Our collaborators at GSK and Sanofi for testing the proposed model-based process design strategy.
Conflict of interest
All authors are employees of Sartorius AG.
Publisher’s note
All claims expressed in this article are solely those of the authors and do not necessarily represent those of their affiliated organizations, or those of the publisher, the editors and the reviewers. Any product that may be evaluated in this article, or claim that may be made by its manufacturer, is not guaranteed or endorsed by the publisher.
Supplementary material
The Supplementary Material for this article can be found online at: https://www.frontiersin.org/articles/10.3389/fbioe.2022.948905/full#supplementary-material
References
Babi, D. K., Griesbach, J., Hunt, S., Insaidoo, F., Roush, D., Todd, R., et al. (2022). Opportunities and challenges for model utilization in the biopharmaceutical industry: Current versus future state. Curr. Opin. Chem. Eng. 36, 100813. doi:10.1016/j.coche.2022.100813
Banner, M., Alosert, H., Spencer, C., Cheeks, M., Farid, S. S., Thomas, M., et al. (2021). A decade in review: Use of data analytics within the biopharmaceutical sector. Curr. Opin. Chem. Eng. 34, 100758. doi:10.1016/j.coche.2021.100758
Bausch, M., Schultheiss, C., and Sieck, J. B. (2019). Recommendations for comparison of productivity between fed-batch and perfusion processes. Biotechnol. J. 14, 1700721. doi:10.1002/biot.201700721
Berdigaliyev, N., and Aljofan, M. (2020). An overview of drug discovery and development. Future Med. Chem. 12 (10), 939–947. doi:10.4155/fmc-2019-0307
Bielser, J. M., Wolf, M., Souquet, J., Broly, H., and Morbidelli, M. (2018). Perfusion mammalian cell culture for recombinant protein manufacturing – a critical review. Biotechnol. Adv. 36 (4), 1328–1340. doi:10.1016/j.biotechadv.2018.04.011
Chen, C., Wong, H. E., and Goudar, C. T. (2018). Upstream process intensification and continuous manufacturingdoi :10.1016/j.coche.2018.10.006. Curr. Opin. Chem. Eng. 22, 191–198. doi:10.1016/j.coche.2018.10.006
Craven, S., Shirsat, N., Whelan, J., and Glennon, B. (2013). Process model comparison and transferability across bioreactor scales and modes of operation for a mammalian cell bioprocess. Biotechnol. Prog. 29, 186–196. doi:10.1002/btpr.1664
DiMasi, J. A., Grabowski, H. G., and Hansen, R. W. (2016). Innovation in the pharmaceutical industry: New estimates of R&D costs. J. Health Econ. 47, 20–33. doi:10.1016/j.jhealeco.2016.01.012
Dowden, H., and Munro, J. (2019). Trends in clinical success rates and therapeutic focus. Nat. Rev. Drug Discov. 18 (7), 495–496. doi:10.1038/d41573-019-00074-z
Finelli, L. A., and Narasimhan, V. (2020). Leading a digital transformation in the pharmaceutical industry: Reimagining the way we work in global drug development. Clin. Pharmacol. Ther. 108 (4), 756–761. doi:10.1002/cpt.1850
Ha, T. K., Kim, D., Kim, C. L., Grav, L. M., and Lee, G. M. (2022). Factors affecting the quality of therapeutic proteins in recombinant Chinese hamster ovary cell culture. Biotechnol. Adv. 54, 107831. doi:10.1016/j.biotechadv.2021.107831
Janoschek, S., Schulze, M., Zijlstra, G., Greller, G., and Matuszczyk, J. (2018). A protocol to transfer a fed-batch platform process into semi-perfusion mode: The benefit of automated small-scale bioreactors compared to shake flasks as scale-down model. Biotechnol. Prog. 35, e2757. doi:10.1002/btpr.2757
Klein, T., Heinzel, N., Kroll, P., Brunner, M., Herwig, C., Neutsch, L., et al. (2015). Quantification of cell lysis during CHO bioprocesses: Impact on cell count, growth kinetics and productivity. J. Biotechnol. 207, 67–76. doi:10.1016/j.jbiotec.2015.04.021
Kroll, P., Eilers, K., Fricke, J., and Herwig, C. (2016). Impact of cell lysis on the description of cell growth and death in cell culture. Eng. Life Sci. 17 (4), 440–447. doi:10.1002/elsc.201600088
Lourenço da Silva, A., Marc, A., Engasser, J. M., and Goergen, J. L. (1996). Kinetic model of hybridoma cultures for the identification of rate limiting factors and process optimisation. Math. Comput. Simul. 42 (2–3), 197–205. doi:10.1016/0378-4754(96)83703-7
Luo, Y., Kurian, V., and Ogunnaike, B. A. (2021). Bioprocess systems analysis, modeling, estimation, and control. Curr. Opin. Chem. Eng. 33, 100705. doi:10.1016/j.coche.2021.100705
Müller, D., Klein, L., Lemke, J., Schulze, M., Kruse, T., Saballus, M., et al. (2022). Process intensification in the biopharma industry: Improving efficiency of protein manufacturing processes from development to production scale using synergistic approaches. Chem. Eng. Process. - Process Intensif. 171, 108727. doi:10.1016/j.cep.2021.108727
Narayanan, H., Sponchioni, M., and Morbidelli, M. (2022). Integration and digitalization in the manufacturing of therapeutic proteins. Chem. Eng. Sci. 248 (A), 117159. doi:10.1016/j.ces.2021.117159
Papathanasiou, M. M., and Kontoravdi, C. (2020). Engineering challenges in therapeutic protein product and process design. Curr. Opin. Chem. Eng. 27, 81–88. doi:10.1016/j.coche.2019.11.010
Papathanasiou, M. M., Quiroga-Campano, A. L., Steinebach, F., Elviro, M., Mantalaris, A., Pistikopoulos, E. N., et al. (2017). Advanced model-based control strategies for the intensification of upstream and downstream processing in mAb production. Biotechnol. Prog. 33, 966–988. doi:10.1002/btpr.2483
Portela, R. M. C., Varsakelis, C., Richelle, A., Giannelos, N., Pence, J., Dessoy, S., et al. (2021). When is an In Silico representation a digital twin? A biopharmaceutical industry approach to the digital twin concept. Adv. Biochem. Eng. Biotechnol., 176:35–55. doi:10.1007/10_2020_138
Rathore, A. S., Zydney, A. L., Anupa, A., Nikita, S., and Gangwar, N. (2022). Enablers of continuous processing of biotherapeutic products. Trends Biotechnol. 40, 804–815. doi:10.1016/j.tibtech.2021.12.003
Richelle, A., Fickers, P., and Bogaerts, P. (2014). Macroscopic modelling of baker's yeast production in fed-batch cultures and its link with trehalose production. Comput. Chem. Eng. 2014 (61), 220–233. doi:10.1016/j.compchemeng.2013.11.007
Schwarz, H., Mäkinen, M. E., Castan, A., and Chotteau, V. (2022). Monitoring of amino acids and antibody N-glycosylation in high cell density perfusion culture based on Raman spectroscopy. Biochem. Eng. J. 182, 108426. doi:10.1016/j.bej.2022.108426
Shirahata, H., Diab, S., Sugiyama, H., and Gerogiorgis, D. (2019). Dynamic modelling, simulation and economic evaluation of two CHO cell-based production modes towards developing biopharmaceutical manufacturing processes. Chem. Eng. Res. Des. 150, 218–233. doi:10.1016/j.cherd.2019.07.016
Smiatek, J., Jung, A., and Bluhmki, E. (2020). Towards a digital bioprocess replica: Computational approaches in biopharmaceutical development and manufacturing. Trends Biotechnol. 38 (10), 1141–1153. doi:10.1016/j.tibtech.2020.05.008
Steinwandter, V., Borchert, D., and Herwig, C. (2019). Data science tools and applications on the way to Pharma 4.0. Drug Discov. Today 24 (9), 1795–1805. doi:10.1016/j.drudis.2019.06.005
Strober, W. (2015). Trypan blue exclusion test of cell viability. Curr. Protoc. Immunol. 111, A3.B.1–A3.B.3. doi:10.1002/0471142735.ima03bs111
Strube, J., Ditz, R., Kornecki, M., Huter, M., Schmidt, A., Thiess, H., et al. (2018). Process intensification in biologics manufacturing. Chem. Eng. Process. - Process Intensif. 133, 278–293. doi:10.1016/j.cep.2018.09.022
Tsopanoglou, A., and Jiménez del Val, I. (2021). Moving towards an era of hybrid modelling: Advantages and challenges of coupling mechanistic and data-driven models for upstream pharmaceutical bioprocesses. Curr. Opin. Chem. Eng. 32, 100691. doi:10.1016/j.coche.2021.100691
Wang, G., Haringa, C., Noorman, H., Chu, J., and Zhuang, Y. (2020). Developing a computational framework to advance bioprocess scale-up. Trends Biotechnol. 38 (8), 846–856. doi:10.1016/j.tibtech.2020.01.009
Wasalathanthri, D. P., Shah, R., Ding, J., Leone, A., and Li, Z. J. (2021). Process analytics 4.0: A paradigm shift in rapid analytics for biologics development. Biotechnol. Prog. 37 (4), e3177. doi:10.1002/btpr.3177
Wolf, M., Pechlaner, A., Lorenz, V., Karst, D. J., Souquet, J., Broly, H., et al. (2019). A two-step procedure for the design of perfusion bioreactors. Biochem. Eng. J. 151, 107295. doi:10.1016/j.bej.2019.107295
Wouters, O. J., McKee, M., and Luyten, J. (2020). Estimated research and development investment needed to bring a new medicine to market, 2009-2018. JAMA 323 (9), 844. doi:10.1001/jama.2020.1166
Nomenclature
Fb L/h bleed rate
Keywords: bioprocess, mathematical modeling, CHO cells, upstream, intensification, perfusion, fed-batch
Citation: Richelle A, Corbett B, Agarwal P, Vernersson A, Trygg J and McCready C (2022) Model-based intensification of CHO cell cultures: One-step strategy from fed-batch to perfusion. Front. Bioeng. Biotechnol. 10:948905. doi: 10.3389/fbioe.2022.948905
Received: 20 May 2022; Accepted: 06 July 2022;
Published: 22 August 2022.
Edited by:
Eugénio Campos Ferreira, University of Minho, PortugalReviewed by:
Rui M. C. Portela, GlaxoSmithKline, BelgiumDimitrios Gerogiorgis, University of Edinburgh, United Kingdom
Copyright © 2022 Richelle, Corbett, Agarwal, Vernersson, Trygg and McCready. This is an open-access article distributed under the terms of the Creative Commons Attribution License (CC BY). The use, distribution or reproduction in other forums is permitted, provided the original author(s) and the copyright owner(s) are credited and that the original publication in this journal is cited, in accordance with accepted academic practice. No use, distribution or reproduction is permitted which does not comply with these terms.
*Correspondence: Anne Richelle, YW5uZS5yaWNoZWxsZUBzYXJ0b3JpdXMuY29t