Corrigendum: Predicting multiple types of associations between miRNAs and diseases based on graph regularized weighted tensor decomposition
 Dong Ouyang1
 Rui Miao
 Shengli Xie
 Yong Liang
- 1Faculty of Information Technology, Macau University of Science and Technology, Macau, China
- 2School of Mathematics and Statistics, Southwest University, Chongqing, China
- 3Computer Engineering Technical College, Guangdong Polytechnic of Science and Technology, Zhuhai, China
- 4Institute of Intelligent Information Processing, Guangdong University of Technology, Guangzhou, China
- 5Peng Cheng Laboratory, Shenzhen, China
Many studies have indicated miRNAs lead to the occurrence and development of diseases through a variety of underlying mechanisms. Meanwhile, computational models can save time, minimize cost, and discover potential associations on a large scale. However, most existing computational models based on a matrix or tensor decomposition cannot recover positive samples well. Moreover, the high noise of biological similarity networks and how to preserve these similarity relationships in low-dimensional space are also challenges. To this end, we propose a novel computational framework, called WeightTDAIGN, to identify potential multiple types of miRNA–disease associations. WeightTDAIGN can recover positive samples well and improve prediction performance by weighting positive samples. WeightTDAIGN integrates more auxiliary information related to miRNAs and diseases into the tensor decomposition framework, focuses on learning low-rank tensor space, and constrains projection matrices by using the L2,1 norm to reduce the impact of redundant information on the model. In addition, WeightTDAIGN can preserve the local structure information in the biological similarity network by introducing graph Laplacian regularization. Our experimental results show that the sparser datasets, the more satisfactory performance of WeightTDAIGN can be obtained. Also, the results of case studies further illustrate that WeightTDAIGN can accurately predict the associations of miRNA–disease-type.
1 Introduction
MicroRNAs (miRNAs) are small non-coding RNA molecules with a length of about 22–24 nucleotides, which can regulate gene expression and protein synthesis at the post-transcriptional level (Ambros, 2004; Bartel, 2004; Bushati and Cohen, 2007). To be more specific, miRNAs can affect protein synthesis by promoting or inhibiting gene expression, thereby causing the occurrence and development of diseases. In addition, a great number of studies have shown that the mutation or abnormal expression of miRNAs often leads to the occurrence of many complex human diseases. For example, hsa-mir-195 and hsa-mir-497 have been shown to play a key inhibitory role in breast cancer malignancies, which can even become potential diagnostic targets (Li et al., 2011). It is exciting that mir-375 can regulate the secretion of insulin (Poy et al., 2009). Thus, identifying the potential miRNA–disease associations will help us understand the molecular mechanisms of miRNA-related diseases and provide a new way to treat diseases. Moreover, the discovery of disease-related miRNAs will contribute to the study of disease pathological mechanisms from a deeper perspective and the identification of potential disease biomarkers (Chen et al., 2019a). At present, traditional experimental methods used to identify potential miRNA–disease associations mainly include reverse transcription-polymerase chain reaction (Freeman et al., 1999), Northern blotting (Várallyay et al., 2008), and microarray profiling (Baskerville and Bartel, 2005). However, such traditional experimental methods, requiring a lot of time and money investment, are often inefficient and prone to failure easily. Therefore, there is an urgent need for more and more computational methods that can provide supporting pieces of evidence and more efficient predictions to accelerate the diagnosis and treatment of human diseases.
According to previous studies (Zeng et al., 2016), existing calculation methods can be divided into two categories: similarity measure-based methods and machine learning-based methods. Among them, similarity-based methods to predict the potential associations of miRNA–disease are based on the assumption that miRNAs with similar functions are more likely to be related to similar diseases. Chen et al. (2018) discovered potential miRNA–disease associations by integrating the predicted association probability obtained from matrix decomposition and similarity information related to miRNAs and diseases into heterogeneous networks. Cui et al. (2019) designed a method based on a bipartite local model with nearest profile-based association inferring, which can predict the association through its nearest neighbor even without any association. Yin et al. (2020) proposed a method based on network consistency projection and label propagation, which obtains network projection scores by using network consistency projection and label propagation is utilized for association prediction. Li et al. (2021a) used a similarity network fusion algorithm to integrate the similarity of multiple miRNAs and diseases, and graph Laplacian regularization was constrained to matrix factorization to predict miRNA–disease associations. Zhou et al. (2021) utilized multiple kernel learning to construct similarity networks between miRNA and disease, and a regression model was used to learn feature representation based on these networks. Then, these feature representations are input into a deep autoencoder to predict miRNA–disease associations. Machine learning-based methods have been proposed to better extract features, which can more accurately predict the associations between miRNAs and diseases. Chen et al. (2019b) integrated ensemble learning and dimensionality reduction based on principal component analysis for inferring potential miRNA–disease associations. Li et al. (2021b) used a graph convolutional autoencoder to calculate association scores based on the two sub-networks of miRNAs and diseases in a heterogeneous network and adopted an average ensemble method to obtain the final prediction score. Li et al. (2021c) proposed a novel graph autoencoder method named GAEMDA to predict the potential miRNA–disease associations in an end-to-end manner. Tang et al. (2021) utilized a graph convolutional network and attention mechanism to extract and enhance the latent representations of miRNA and disease in multiple views for reconstructing the miRNA–disease association matrix. Yan et al. (2022) developed a new end-to-end deep learning method named PDMDA, which utilizes a fully connected network and graph neural network to extract the feature representations of miRNAs and diseases for deep-level miRNA–disease association prediction.
Based on the previous research works, these methods only focus on miRNA–disease binary association prediction, without considering the specific type of miRNA. However, more and more experimental evidence shows that the mechanism of miRNAs causing diseases is very complex, rather than a simple binary association prediction (Fabbri et al., 2007; Vogt et al., 2011; He et al., 2017). On the one hand, miRNAs are related to diseases, but diseases are only caused by the specific type of miRNA. For example, the mir-29 family (29a, b, c) reverses the abnormal methylation of lung cancer by targeting DNA methyltransferases 3A and 3B (Fabbri et al., 2007). On the other hand, the mechanism of the same miRNA causing the same disease is distinguished in different types. For instance, the occurrence of CpG methylation leads to epigenetic inactivation of mir-34a in breast cancer, meanwhile, circGFRA1 may be a potential target in triple-negative breast cancer by regulating mir-34a (Vogt et al., 2011; He et al., 2017). Therefore, while predicting the potential associations between miRNAs and diseases, we also need to determine which types of miRNAs are related to the diseases.
In the past few years, some researchers have focused on the problem of identifying multiple types of miRNA–disease associations. Chen et al. (2015) are the first to study the problem of multiple types of miRNA–disease associations, which provides a new idea for researchers to understand the pathogenesis of diseases in more detail at the molecular level. In their study, they developed a restricted Boltzmann machine model for multiple types of miRNA–disease association prediction (RBMMMDA). Zhang et al. (2018) proposed a semi-supervised model called a network-based label propagation algorithm to predict multiple types of miRNA–disease association (NLPMMDA), and multiple-view of miRNA and disease information was integrated into a heterogeneous network. However, these models either did not consider the auxiliary information related to miRNAs and diseases or ignored the inherent connection of the multiple-type association matrices. Fortunately, tensor, as a multi-dimensional array, can well represent multiple-type miRNA–disease associations as a triplet. Biological similarity information as decomposition constraints can also be incorporated into the framework of tensor decomposition to explore some unobserved triples by decomposing a tensor. Huang et al. (2021) integrated miRNA functional similarity and disease semantic similarity as auxiliary information into tensor decomposition and proposed a tensor decomposition with relational constraint (TDRC) model. However, TDRC does not recover positive samples well, and its prediction performance has not been effectively improved. Next, although TDRC takes miRNA-miRNA functional similarity and disease-disease semantic similarity information as decomposition constraints, the computing framework cannot easily expand the information related to miRNAs and disease to effectively solve the problem of tensor sparseness and further improve the performance of the model. Moreover, TDRC cannot effectively avoid learning irrelevant information in the training stage. Finally, TDRC does not well preserve the similarity relationships of internal nodes between diseases and between miRNAs.
To address the aforementioned problems, in this article, we propose a computational framework named Weighted Tensor Decomposition with Auxiliary Information, Graph Laplacian regularization, and L2,1 Norm (WeightTDAIGN), which integrates weight, graph Laplacian regularization, L2,1 norm, and more auxiliary information into tensor decomposition to better predict multiple types of miRNA–disease associations. First, WeightTDAIGN can recover positive samples well and improve prediction performance by weighting positive samples. Second, WeightTDAIGN can incorporate more miRNA-related and disease-related auxiliary information through changing the interactive update strategy of factor matrices and biological similarity matrices. Furthermore, features that contain more information can be learned by constraining projection matrices using the L2,1 norm, which can effectively avoid learning the noise information in the biological similarity network. Next, to make better use of the known biological similarity networks, we introduce graph Laplacian regularization to capture the data geometric structure between biological similarity networks. Finally, we optimize the framework using an alternate iteration strategy and adopt the alternating direction method of multipliers (ADMM) algorithm to infer multiple types of miRNA–disease associations. The WeightTDAIGN model we proposed is compared with six benchmark models on four datasets with different sparsities. The experimental results show that the WeightTDAIGN model is superior to these models including the latest model TDRC, especially when datasets are sparse. Additionally, the results of case studies demonstrate that WeightTDAIGN can accurately predict the associations of miRNA–disease-type and discover the potential associations of unconfirmed miRNA–disease that are of biological significance, which further validates the effectiveness of the proposed model.
2 Materials
2.1 Human miRNA–Disease-Type Association Datasets
More miRNA-related disease databases or tools are emerging, which provide convenience for identifying the potential associations between miRNAs and diseases from the perspective of computational methods (Chen et al., 2019a). In this article, we used the HMDD v3.2 and HMDD v2.0 versions of the Human miRNA Disease Database (HMDD) as benchmark datasets for constructing tensors (Wang et al., 2010). HMDD v3.2 and HMDD v2.0 can be downloaded from https://www.cuilab.cn/hmdd. Meanwhile, disease descriptors can be provided from Medical Subject Headings (MeSH). Also, miRNA sequence can be obtained from miRBase (Kozomara and Griffiths-Jones, 2014). HMDD v2.0 is classified into four types based on the evidence from circulation, epigenetics, genetics, and target. Moreover, the recently released HMDD v3.2 provides six generalized types of associations (circulation, epigenetics, genetics, target, tissue, and others). However, the category of miRNA is not clear for the “other” category, so we did not download the data of that category. In addition, we mapped the human miRNA–disease-type associations with experimentally verified into 0 and 1. In detail, if a disease is associated with a miRNA of a certain type, then the value is set as 1, otherwise 0. In order to explore the generalization ability of WeightTDAIGN under different sparsity data, we divided HMDD v3.2 and HMDD v2.0 into four datasets according to the proportion of data sparsity.
Based on previous research (Chen et al., 2016; Pasquier and Gardès, 2016; Liang et al., 2019), we expanded some auxiliary information, such as miRNA sequence similarity and Gaussian interaction profile kernel similarity for miRNAs and diseases, to further improve the prediction performance. For miRNAs, we only retained these miRNAs that can get the sequence from miRBase. For diseases, we deleted the diseases which are not found and whose category is not C for the tree structure in MeSH. The detailed descriptions of the four datasets are shown in Table 1.
TABLE 1
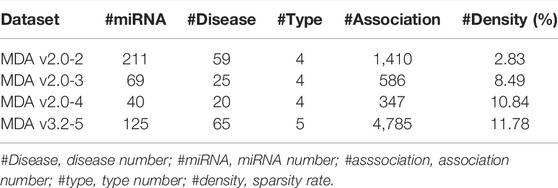
TABLE 1. Statistics of all datasets used in this study.
After aforementioned preprocessing and removing duplications, we finally obtained the following datasets:
• MDA v2.0–2 is obtained from HMDD v2.0 released in 2013. We removed these miRNAs or diseases that involve less than two associations in total across all types.
• MDA v2.0–3 also deleted miRNAs or diseases that include less than three associations in total across all types for HMDD v2.0.
• MDA v2.0–4 is also obtained from HMDD v2.0. We only got miRNAs and diseases that exist in total across all types.
• MDA v3.2–5 is released from HMDD v3.2, which contains five-type (circulation, epigenetics, genetics, target, and tissue) association matrices and only includes miRNAs and diseases that exist in total across all types.
2.2 Tensor Construction
Given a set of miRNA–disease associations
2.3 Disease Semantic Similarity
Based on the research of Wang et al. (2010), disease semantic similarity can be computed by MeSH descriptors, which can be obtained from https://www.ncbi.nlm.nih.gov/. Herein, the relationships of different diseases can be represented by directed acyclic graphs (DAGs). We adopted DAG (di) = (T (di), E (di)) to describe the relationships of all diseases, in which T (di) and E (di) denote the node set and edge set, respectively. For a node di, it represents a disease. Also, a set of edges E (di) represents the relationships between different diseases. Then, we can calculate the semantic contribution of disease dt to di as follows:
where Δ represents the semantic contribution decay factor, and we set Δ = 0.5 according to previous study (Wang et al., 2010). The semantic contribution value of diseases di and dt can be described as the distance between them. Thus, the semantic value of disease di can be defined as follows:
Based on Eqs 1, 2, we can obtain the disease semantic similarity DSS1(di, dj) between diseases di and dj as follows:
Moreover, it is worth noting that diseases may be more common in more DAGs and more specific in fewer DAGs. Therefore, the disease semantic contribution value of the same layer should be different in DAGs. Then, based on a previous study (Pasquier and Gardès, 2016), we applied another method to calculate the semantic contribution of disease dt to di as shown below:
Calculation ideas based on Eqs 3, 4, we can obtain the semantic value SV2(di) of disease di and the disease semantic similarity DSS2(di, dj) between disease di and dj as follows:
In order to acquire a more reasonable semantic similarity of diseases, we can calculate the final disease semantic similarity DSS(di, dj) between disease di and dj according to the following equation:
2.4 MiRNA Functional Similarity
Based on the assumption that miRNAs with similar functions are more likely to induce similar diseases, the miRNA functional similarity score can be calculated by Wang et al. (2010). According to miRNA functional similarity information, we can build an M × M matrix MFS. M refers to the number of miRNAs. MFS(mi, mj) denotes each element in the matrix MFS, which also represents the miRNA functional similarity score between miRNAs mi and mj.
where D (mi) denotes the set of diseases that are associated with mi in at least one association type and |D (mi)| is the number of elements in the set D (mi) and
2.5 MiRNA Sequence Similarity
According to the description of Liang et al. (2019), we utilized the “pairwiseAlignment” function in the R package “Biostrings” to calculate the sequence similarity scores of miRNAs. Finally, we achieved the miRNA sequence similarity matrix MSS by min-max normalization as follows:
where Scoremin and Scoremax represent the maximum and minimum values in the similarity score matrix Score, respectively. The Score can be calculated by using the “pairwiseAlignment” function.
2.6 Gaussian Interaction Profile Kernel Similarity for miRNAs and Diseases
Based on previous research (Van Laarhoven et al., 2011), we assumed that miRNAs with similar functions have similar interaction and non-interaction patterns with diseases and leveraged the Gaussian kernel to extract nonlinear information related to miRNAs and diseases from known miRNA–disease associations as the Gaussian interaction profile kernel similarity. Correspondingly, a binary vector IP(mi) refers to whether miRNA mi is associated with each disease in the known miRNA–disease association datasets. Then, the Gaussian interaction profile kernel similarity between miRNA mi and mj can be calculated as follows:
where the parameter γm controls the bandwidth of kernel. It can be expressed as a normalization of the average number of associations between miRNAs and diseases. The formulation for the calculation of γm is shown below:
where nm represents the number of all miRNAs. Herein, we set
where a binary vector IP(di) refers to whether disease di is associated with each miRNA in the known miRNA–disease associations datasets. nd denotes the number of all diseases, and
3 Methods
3.1 CP Decomposition
CANDECOMP/PARAFAC (CP) decomposition is one of the most common tensor decomposition forms (Kolda and Bader, 2009). Given the miRNA-disease-type tensor
where the symbol ◦ represents the vector outer product, S is a positive integer and
Then, the optimization problem of CP decomposition can be easily considered as follows:
where ‖⋅‖F is the tensor Frobenius norm. In our work,
3.2 Weight Tensor
Based on the research of Huang et al. (2021), the prediction of associated types in the problem of binary association prediction of miRNA–diseases is the focus of our research. However, we observe that the existing methods based on tensor decomposition cannot effectively recover positive samples, which makes it impossible to predict multiple types of miRNA–disease associations more accurately. Therefore, we propose a strategy of weighting positive samples to make them better recovered. Suppose the original tensor is
where
Obviously, the loss value is highly correlated with the result of positive sample reconstruction. To determine which positive samples are weighted by the change of the loss value, we set
where k is the artificially set threshold, which controls the range of weights given to positive samples. The range of k is between 0 and 1 in this article.
We rewrite Eq. 16 element-wise and find that
Herein, w refers to a weight value and w ≥ 1,
3.3 WeightTDAIGN
3.3.1 Model Auxiliary Information
To leverage the existing prior knowledge of miRNA-miRNA and disease-disease similarity networks, we utilize matrix factorization to learn important latent information about the similarity matrix. Inspired by previous research (Chen and Li, 2017, 2018), the multi-view information for miRNAs and diseases should share the same latent structures. Consequently, we change the interactive update strategy of factor matrices and similarity matrices, which can fuse more biological similarity information into the calculation framework. The whole workflow of the proposed WeightTDAIGN model is presented in Figure 1. Given multiple views of miRNAs (or diseases) similarity matrices
where
FIGURE 1
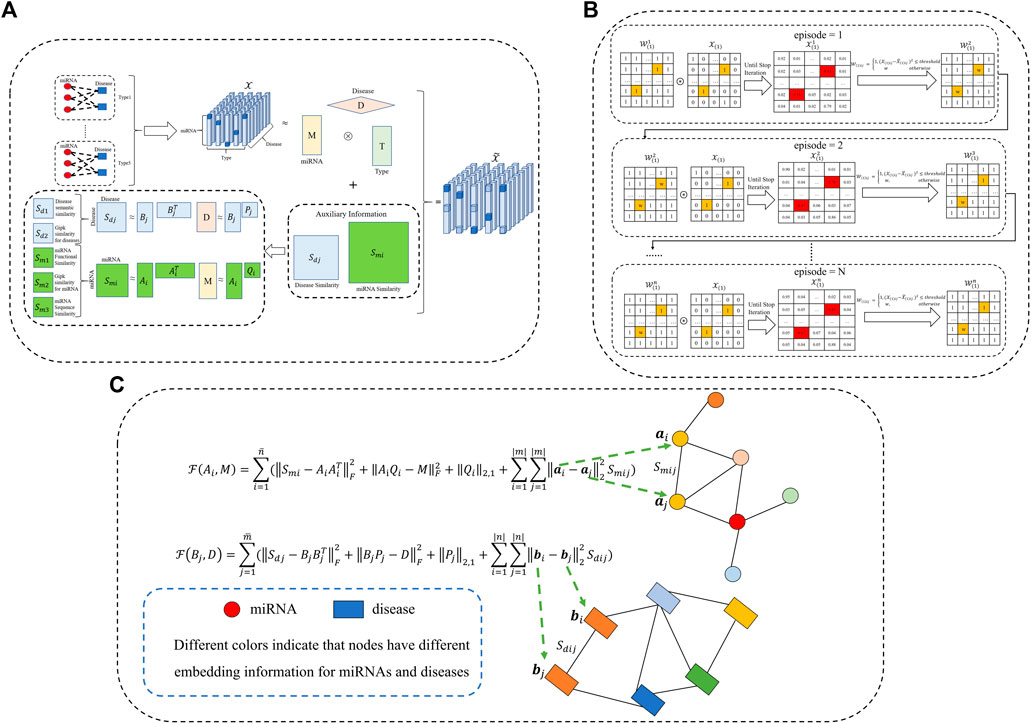
FIGURE 1. The workflow of our proposed WeightTDAIGN model for predicting potential multiple types of miRNA–disease associations. (A) Multi-view miRNA and disease similarity networks are incorporated into tensor decomposition. It is worth noting that Gipk represents the Gaussian interaction profile kernel. (B) We take slice
3.3.2 Model Constraint Information
Recent studies have shown that data distributed in high-dimensional space often contain important local information, and preserving this local structure information of data can improve the performance of the model when high-dimensional data is embedded into low-dimensional subspace (Meng et al., 2018; Shang et al., 2020). Given a miRNA (or disease) similarity matrix Sm, A is defined as the low-dimensional embedding matrix of the high-dimensional data Sm. To preserve the local structure information of high-dimensional data, the objective function to be solved is as follows:
where ai refers to the ith row vector of the low-dimensional embedding matrix A. It can be seen from Eq. 20 that if the similarity Smij between miRNAs i and j is high, the distance between the embedding information ai and aj should be very close. Lm = Dm − Sm and Dm is the degree matrix and
When the information of the multiple views of miRNA (or disease) similarity network is projected to a common latent matrix, the irrelevant feature information is usually included. To discard irrelevant features and make the model select features with more information (Nie et al., 2010), the L2,1 norm is constrained on the projection matrix Q.
where qi denotes the ith row of the projection matrix Q.
3.3.3 WeightTDAIGN: Optimization Formulation
To consider the biological similarity network in the tensor decomposition and preserve the local structural information of this network, we combine Eqs 19 and 20 with the weighted tensor decomposition Eq. 16. Moreover, to alleviate the introduction of noise information and prevent overfitting, we use the L2,1 norm to constrain the projection matrices and add the L2 regularization term for factor matrices. Finally, the objective function can be obtained as follows:
where αi and βj control the impact of auxiliary information.
3.3.4 WeightTDAIGN: Optimization Algorithm
Because the previous objective function in Eq. 22 is non-convex and the variables of the objective function are interdependent, we simplify the optimization problem by using the variable splitting technique. Finally, the optimization problem of Eq. 22 without updating the weight tensor
where
By integrating the equality constraints into the objective function, we can construct the augmented Lagrangian function of Eq. 23 as follows:
where
Next, we develop an alternately updating rule and adopt the ADMM algorithm to optimize the objective function of Eq. 24.
Updating the factor matrices M, D, and T.
According to the idea of alternate iterative update, when the other variables are fixed, the terms in the objective function involving M, D, and T can be updated separately as follows:
where
Since the element-wise product of the tensor is involved in Eq. 25, we solve objective functions in Eq. 25 from the vector level. By letting the derivative of objective functions to zero, we can obtain the updating rules of M, D, and T as shown below:
where
Updating the latent matrices Ai, Ci, Fi, Bj, Ej, and Gj.
Similarly, we can solve other variables using the same solution strategy:
Updating the projection matrices Qi and Pj.
According to previous research (Nie et al., 2010), the updating rules for projection matrices Qi and Pj constrained by the L2,1 norm are as follows:
where
Updating the Lagrange multipliers Yi, Hi, Zj, and Jj.
The updating formulations of Lagrange multipliers using gradient ascent can be defined as follows:
Updating the weight tensor
In this article, we call the training process that reaches the stopping condition as an episode. When the aforementioned parameters are updated in an episode, the model starts to update the weight tensor
Clearly, when M, D, and T are fixed, the optimal
where the loss function lij is
Optimization algorithm.
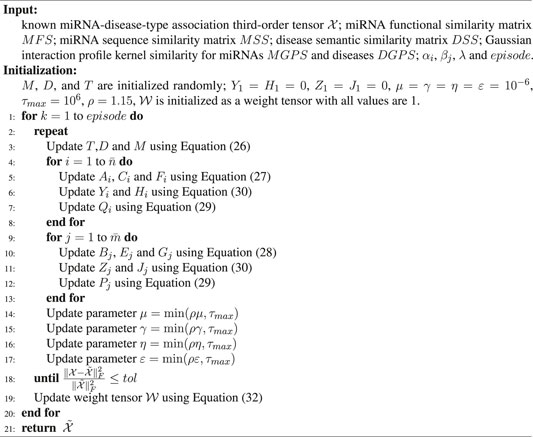
According to the aforementioned alternately updating rules and ADMM algorithm, the final solution process for solving the optimization problem (Eq. 22) is summarized in Algorithm 1.
Algorithm 1. Algorithm for Solving Problem (Eq. 22).
3.4 Complexity Analysis
We now analyze the time complexity of Algorithm 1 step by step as follows. In reality, we find that |t| is relatively small.
• Updating the factor matrix T: One must compute M ⊙ D first whose time complexity is
• Updating the factor matrices M and D: Similar to the previous steps, the time complexities of updating M and D are
• Updating the latent matrices Ai and Bj: According to the calculation of matrix multiplication complexity, the time complexities of updating Ai and Bj are
• Updating the latent matrices Ci, Fi, Ej, and Gj: Similar to the complexities of computing Ai and Bj, the time complexities of computing Ci and Ej are
• Updating the projection matrices Qi and Pj: One needs to compute the projection matrices Qi and Pj, whose time complexities are
• Updating the weight tensor
Finally, as the number of iterations is constant and the time complexity of updating the Lagrange multipliers is
4 Results
4.1 Implementation Details and Evaluation Metrics
In this article, our goal is to more accurately predict positive samples while discovering the potential multiple types of miRNA–disease associations. To evaluate the performance of models more comprehensively from this idea, two different cases are considered under 5-fold cross-validation.
• CVtype: we randomly split all miRNA–disease pairs which include not less than one type of association into five equal-sized subsets. It is worth noting that we must ensure the five equal-sized subsets do not contain each other. In each fold, one subset is served as a testing set in turn, and the rest of the subsets as a training set. According to the predicted score, the prediction results of all association types are ranked for each miRNA–disease pair in the testing set. Then, we use the type with the highest score as the final prediction result for the test sample and calculate the Top-1 precision, Top-1 recall, and Top-1 F1.
• CVtriplet: we divide the training set and testing set in the same way as CVtype. In each turn, we mainly evaluate whether known miRNA–disease-type triplets are well predicted. To better evaluate the ability of models to predict positive samples, the area under the precision-recall (AUPR) curve, the area under the receiver operating characteristic (AUC) curve, and mean square error (MSE) are calculated to evaluate the prediction performance of all models.
Obviously, the problem of predicting the multiple-type associations between miRNAs and diseases is what we are more concerned about. Therefore, we regard CVtype as our primary experimental setting. Moreover, we use Python 3.8.5 and the tensor learning tool “tensorly” to implement comparative experiments between our proposed WeightTDAIGN and all benchmark models.
4.2 Parameters Analysis
Before the training stage, we apply grid search and 5-fold cross-validation to find the optimal hyperparameters on different sparsity datasets. We take the MDA v2.0–4 dataset as an example to show the process of cross-validation. First, we fix the value of λ at 0.001 and search for the optimal values of other parameters. Then, we find the optimal value of α and β from {2–4, 2–3, 2–2, 2–1, 20, 21} and set α = 2–2 and β = 2–2 in our experiment (see Figure 2A). Training tensor rank r within {2, 4, 6, 8, 10, 12} and setting r = 8 (see Figure 2B). Varying matrix rank r′ in the set {2, 8, 14, 20, 26, 32} and setting r′ = 20 in Figure 3A. Moreover, we find that setting different episodes also has a certain impact on the performance of the model. Therefore, we search the optimal episode from {2, 4, 6, 8, 10} and set episode as 4 (see Figure 3B). Obviously, when the value in the weight tensor
FIGURE 2
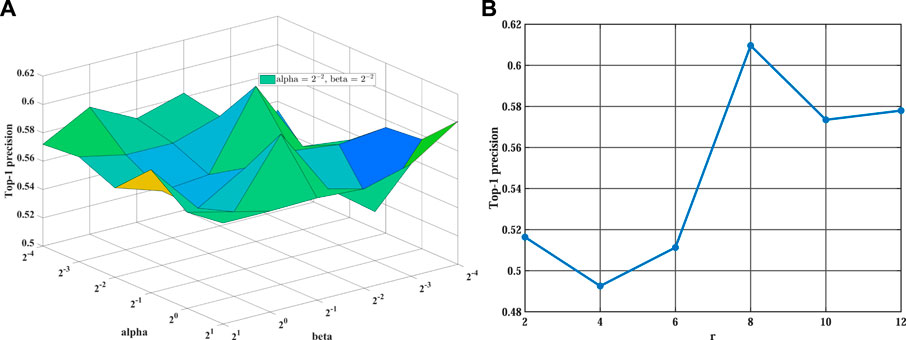
FIGURE 2. The influence of different hyperparameters on WeightTDAIGN based on the MDA v2.0–4 dataset. (A) The impact of hyperparameters α and β WeightTDAIGN and (B) the impact of hyperparameter r on WeightTDAIGN. Note that to facilitate visualization panel (A), we use 2n to represent 2 × 10n when n < 0.
FIGURE 3

FIGURE 3. The influence of different hyperparameters on WeightTDAIGN based on the MDA v2.0–4 dataset. (A) The impact of hyperparameters r′ WeightTDAIGN and (B) the impact of hyperparameter episode on WeightTDAIGN.
FIGURE 4
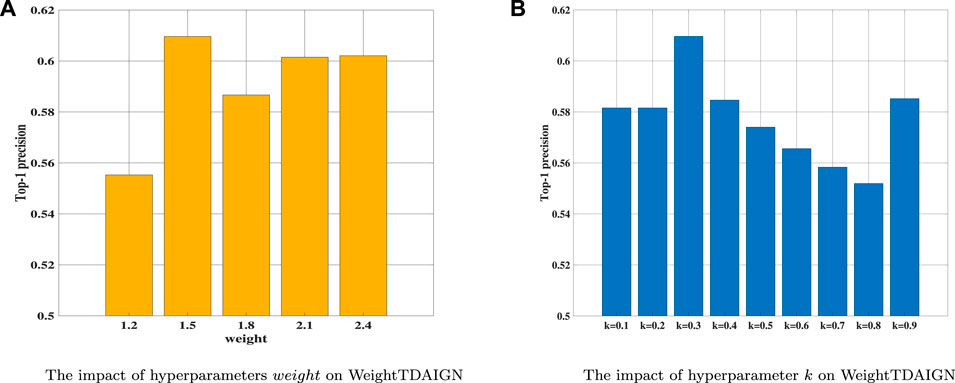
FIGURE 4. The influence of different hyperparameters on WeightTDAIGN based on the MDA v2.0–4 dataset. (A) The impact of hyperparameters weight WeightTDAIGN and (B) the impact of hyperparameter k on WeightTDAIGN.
4.3 Comparison Experiments
To compare the performance of our model more comprehensively, we introduce one representative prediction model RBMMMDA and three tensor decomposition models, CP decomposition (CP), tensor factorization using auxiliary information (TFAI) (Narita et al., 2012), and tensor decomposition with relational constraints (TDRC) as baselines. RBMMMDA is the first model to study the problem of multiple types of miRNA–disease associations. CP model is a standard tensor decomposition method without taking into account biological similarity information. TFAI only considers the inter-data connection relations in biological similarity matrices by introducing graph Laplacian regularization. TDRC only focuses on integrating biological similarity information into the CP decomposition via the strategy of alternately updating factor matrices and projection matrices. At the same time, in order to show that weighting positive samples, the introduction of L2,1 norm, and graph Laplacian regularization can effectively improve the prediction performance of the model, we propose the TDAIGN model without weight and the TDAI model without L2,1 norm and graph Laplacian regularization, respectively. For convenience, we call RBMMMDA, CP, TFAI, TDRC, TDAI, and TDAIGN models as benchmark models. To better demonstrate the optimal performance of benchmark models, we carry out 5-fold cross-validation for TDRC and TDAIGN models to select the optimal hyperparameters α and β. For fairness, we uniformly set the same rank as WeightTDAIGN for benchmark models on different sparsity datasets. Moreover, we use the same convergence criteria for CP, TFAI, TDRC, TDAI, and TDAIGN. Finally, the detailed parameter settings for all benchmark models can be found in Supplementary Comparison Methods for Parameter Analysis.
Due to the imbalance of positive and negative samples on the datasets, we randomly select the same number of unobserved elements and treat them as negative samples. In addition, we compare and analyze the results of different models under 5-fold cross-validation on MDA v2.0–2, MDA v2.0–3, MDA v2.0–4, and MDA v3.2–5 datasets. As shown in Table 2, we find that the WeightTDAIGN model achieves the highest AUC, AUPR, and F1 values compared with benchmark models on all datasets. Moreover, in terms of MSE used to measure the difference between the true value and the predicted value in positive samples, WeightTDAIGN is also significantly smaller than benchmark models on all datasets. The analysis of the previous results indicates that compared with the six benchmark models, WeightTDAIGN can recover positive samples well and improve prediction performance by weighting positive samples.
TABLE 2
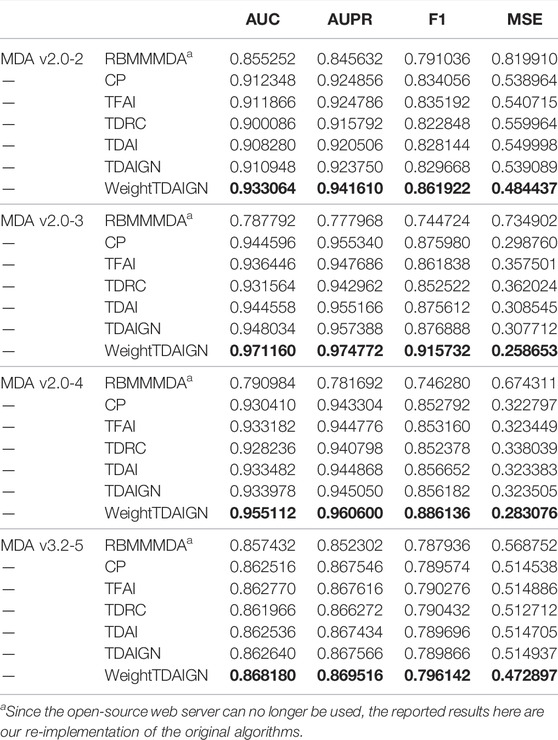
TABLE 2. The performance of all models evaluated by 5-fold cross-validation under CVtriplet.
To comprehensively evaluate the performance of all models in predicting multiple types of miRNA–disease associations, we conduct experiments on different sparsity datasets under CVtype. From Table 3 we can see that the prediction performance of WeightTDAIGN is better than that of the six benchmark models. To be more specific, WeightTDAIGN is significantly better than the latest TDRC model on MDA v2.0–2, MDA v2.0–3, and MDA v2.0–4 datasets. In particular, WeightTDAIGN obtains certain performance gains over TDRC by 8.40% in terms of Top-1 precision, 8.40% in terms of Top-1 recall, and 8.44% in terms of Top-1 F1 on sparsest MDA v2.0–2 dataset. Moreover, even for the relatively dense MDA v3.2–5 dataset, WeightTDAIGN still shows good prediction performance. These indicate that WeightTDAIGN has certain competitiveness, especially when the datasets are relatively sparse, in the task of predicting multiple types of miRNA–disease associations. In addition, we observe that the prediction performance of TDAIGN is better than TDAI on all datasets, which indicates that the introduction of graph Laplacian regularization and L2,1 norm can effectively preserve the local structural information of biological similarity networks and reduce the noise information contained in these networks. Furthermore, we find that the better prediction performance of WeightTDAIGN can be achieved compared with TDAIGN on all datasets. This shows that weighting positive samples can effectively improve the prediction performance of the model. Last but not least, compared with RBMMMDA, CP, and TFAI models, TDAIGN achieves better prediction performance on all datasets. This indicates that more similar information related to miRNAs and diseases is integrated into the model, which can effectively improve the prediction performance of the model and solve the problem of tensor sparseness.
TABLE 3
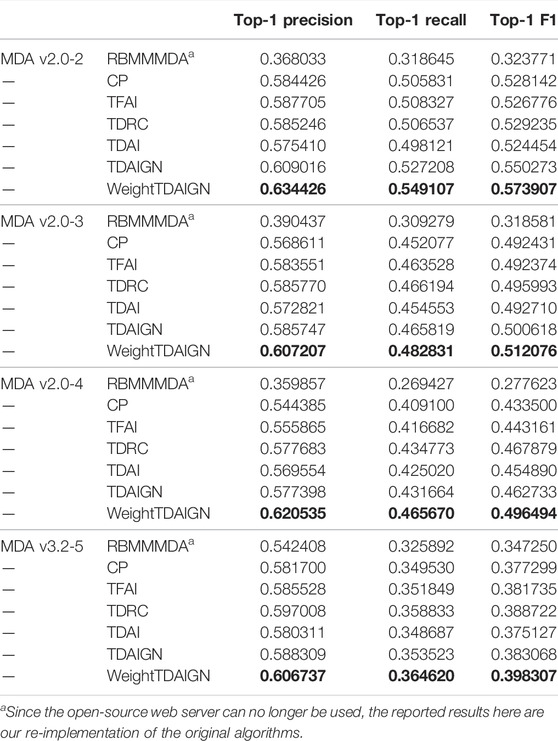
TABLE 3. The performance of all models evaluated by 5-fold cross-validation under CVtype.
4.4 Case Studies
To further evaluate the ability of WeightTDAIGN to predict the potential multiple-type associations between miRNAs and diseases, we build the model by using all four known types of miRNA–disease associations on the HMDD v2.0 dataset and then predict those unknown miRNA–disease-type triplets. Further, we verify the prediction results on the HMDD v3.2 dataset and recent literature. Moreover, in order to comprehensively demonstrate the generalization performance of WeihghtTDAIGN on different sparsity datasets, we conduct case studies on MDA v2.0–2, MDA v2.0–3, and MDA v2.0–4 datasets, respectively. The higher the predictive scores for unobserved miRNA–disease-type triplets, the higher the probability of correct prediction, so we only verify the results using the top predictive scores. The results are shown in Table 4. We can see that all of the top 50 disease-related miRNAs are successfully confirmed by HMDD v3.2 for MDA v2.0–4 dataset. Meanwhile, Supplementary Table S2 shows that 99 of the top 100 are verified by HMDD v3.2 for MDA v2.0–2 dataset. Supplementary Table S3 demonstrates the top 100 predicted results and ninety-seven predictions can be confirmed according to recent literature for MDA v2.0–3 dataset. We also find that miRNAs (or diseases) with very high similarities are predicted to be associated with the same disease (or miRNA), and these miRNAs belong to the same type. For example, in terms of MDA v2.0–4 dataset, hsa-mir-124-1, hsa-mir-124-2, and hsa-mir-124-3 suppress multiple steps of breast cancer metastasis by targeting a cohort of pro-metastatic genes in vitro (Lv et al., 2011). Further, Figure 5 presents the similarity network of miRNAs associated with breast neoplasms in the top 50 association predictions. Clearly, there is a high functional similarity between miRNAs of the same type that are highly associated with breast neoplasms. This further shows that the necessity of incorporating more biological similarity networks and using graph Laplacian regularization can well capture the internal node similarity relations between miRNAs and between diseases.
TABLE 4
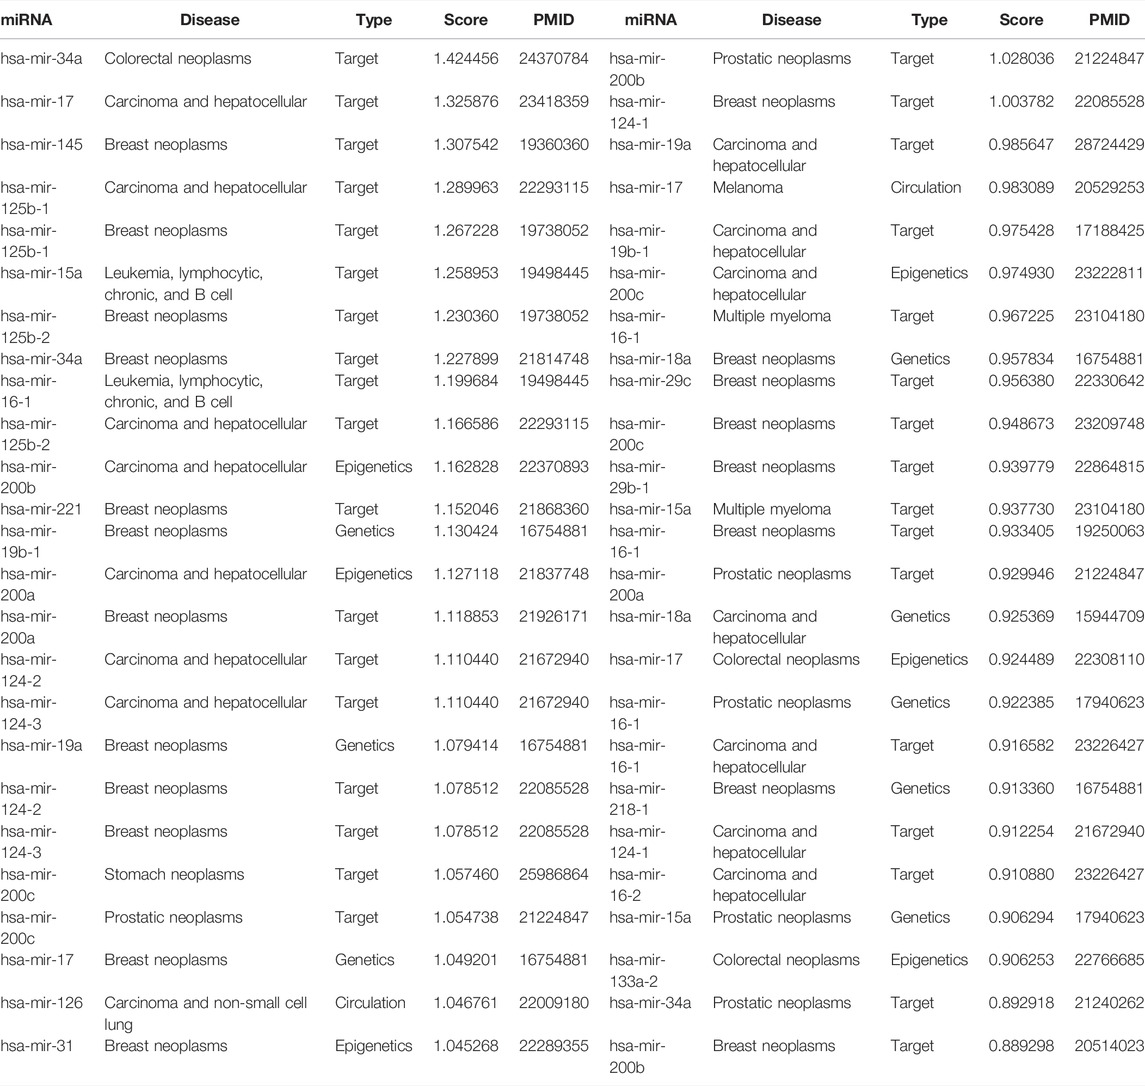
TABLE 4. Top 50 disease-related miRNAs predicted by WeightTDAIGN based on MDA v2.0–4.
FIGURE 5
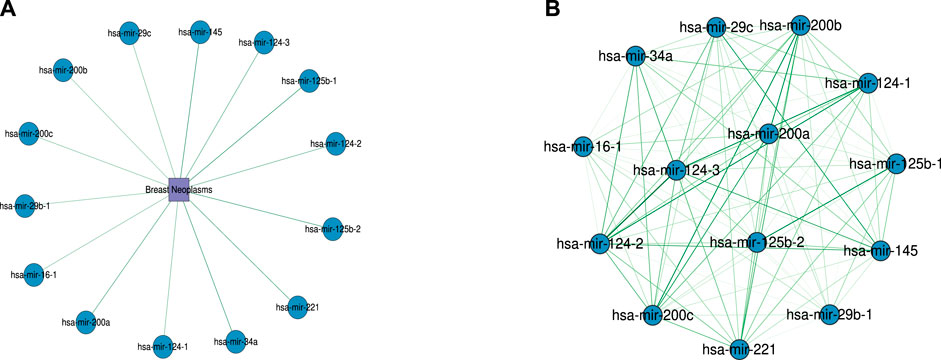
FIGURE 5. The association network of the top 50 predictions for miRNAs with type as the target in breast neoplasms. (A) Predicted association between miRNAs and breast neoplasms. (B) Functional similarity network between miRNAs associated with breast neoplasms. Darker colors indicate higher similarity between miRNAs. The similarity values range from 0.5 to 1.
To further validate the biological significance of the potential miRNA–disease associations discovered by the WeightTDAIGN model, we perform enrichment analysis for gene sets composed of miRNA target genes. The target genes of each miRNA are obtained from miRTarBase (Huang et al., 2020), and Metascape (Zhou et al., 2019) is used to explore whether the obtained target gene sets are related to important pathways or receptor regulating diseases. From Figure 6A, we can see that among the target genes related to hsa-mir-218-1, some target genes are associated with signaling pathways such as MAPK1/MAPK3 signaling, MAPK family signaling cascades and PIP3 activates AKT signaling. Also, many studies have reported that the expression of MAPK is closely related to tumor invasion and metastasis in breast neoplasms, and the activation of AKT signaling will promote tumor initiation and progression (Jiang et al., 2020; He et al., 2021). Similarly, some target genes of hsa-mir-218-2 are associated with toll-like receptor in Figure 6B, while toll-like receptor has an important association with the occurrence and development of breast neoplasms (Shi et al., 2020). In conclusion, hsa-mir-218-1 and hsa-mir-218-2 may be closely related to the occurrence and development of breast neoplasms.
FIGURE 6
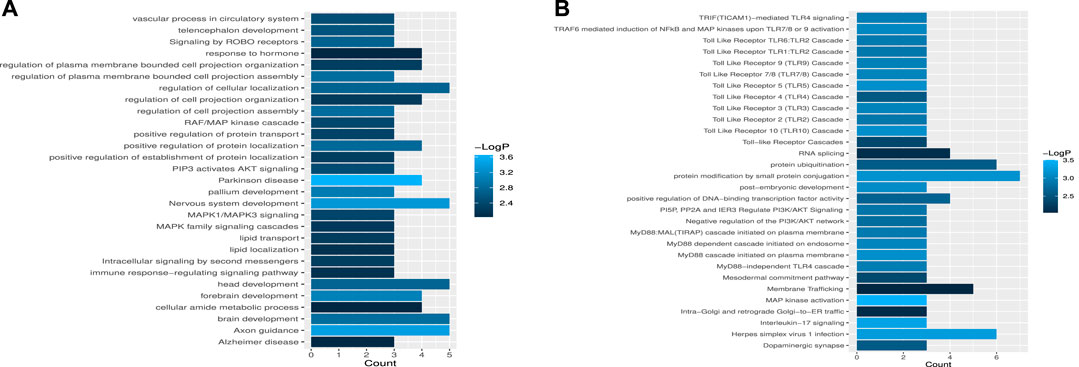
FIGURE 6. The enrichment analysis of miRNA target gene sets. (A) The statistical significance of target gene sets associated with hsa-mir-218-1. (B) The statistical significance of target gene sets associated with hsa-mir-218-2.
5 Discussion
While predicting the associations between miRNAs and diseases, we can also determine the specific type of miRNA, which is very helpful for a more detailed understanding of the pathogenesis of the disease at the molecular level. In this article, we propose the WeightTDAIGN model based on CP decomposition by introducing weight, graph Laplacian regularization, and L2,1 norm, which also incorporates more auxiliary information into the framework of tensor decomposition. Experimental results demonstrate that WeightTDAIGN can recover positive samples well compared with six benchmark models under CVtriplet. Meanwhile, WeightTDAIGN can also achieve satisfactory prediction performance on different sparsity datasets under CVtype. All of the above show that WeightTDAIGN our proposed can effectively improve the performance and robustness of predicting the associations of multiple types of miRNA–disease. In addition, the comparative experiment of TDAI and TDAIGN indicates that the introduction of graph Laplacian regularization and L2,1 norm contributes to preserving the local structure information of similarity networks and reducing the influence of noise in these networks on the model. Also, the comparative experiment of TDAIGN and WeightTDAIGN confirms that weighting positive samples can recover positive samples well and improve the prediction performance of the model. Moreover, the results of the case studies further demonstrate that WeightTDAIGN can accurately predict the associations of multiple types of miRNA–disease and discover the potential associations of unconfirmed miRNA–disease that are of biological significance in enrichment analysis. In conclusion, WeightTDAIGN can serve as a powerful tool to infer the multiple-type associations between miRNAs and diseases rather than simply predicting disease-related miRNAs.
Data Availability Statement
The original contributions presented in the study are included in the article/Supplementary Material; further inquiries can be directed to the corresponding author.
Author Contributions
DO conceived of the presented idea, carried out the experiments, analyzed the result, and wrote the manuscript. RM, NA, and QD helped shape the research, analysis, and manuscript. JW, XL, and SX analyzed the result and revised the manuscript. YL conceived the project and revised the manuscript. All authors read and approved the final manuscript.
Funding
This work was supported in part by the Macau Science and Technology Development Funds Grands No.0056/2020/AFJ from the Macau Special Administrative Region of the People’s Republic of China and the Key Project for the University of Educational Commission of Guangdong Province of China Funds (Natural, Grant No. 2019GZDXM005).
Conflict of Interest
The authors declare that the research was conducted in the absence of any commercial or financial relationships that could be construed as a potential conflict of interest.
Publisher’s Note
All claims expressed in this article are solely those of the authors and do not necessarily represent those of their affiliated organizations, or those of the publisher, the editors, and the reviewers. Any product that may be evaluated in this article, or claim that may be made by its manufacturer, is not guaranteed or endorsed by the publisher.
Acknowledgments
The authors wish to thank editors and reviewers.
Supplementary Material
The Supplementary Material for this article can be found online at: https://www.frontiersin.org/articles/10.3389/fbioe.2022.911769/full#supplementary-material
References
Baskerville, S., and Bartel, D. P. (2005). Microarray Profiling of Micrornas Reveals Frequent Coexpression with Neighboring Mirnas and Host Genes. Rna 11, 241–247. doi:10.1261/rna.7240905
Bushati, N., and Cohen, S. M. (2007). Microrna Functions. Annu. Rev. Cell. Dev. Biol. 23, 175–205. doi:10.1146/annurev.cellbio.23.090506.123406
Chen, H., and Li, J. (2018). “Drugcom: Synergistic Discovery of Drug Combinations Using Tensor Decomposition,” in 2018 IEEE International Conference on Data Mining (ICDM) (IEEE), 899–904. doi:10.1109/icdm.2018.00108
Chen, H., and Li, J. (2017). “Learning Multiple Similarities of Users and Items in Recommender Systems,” in 2017 IEEE International Conference on Data Mining (ICDM) (IEEE), 811–816. doi:10.1109/icdm.2017.97
Chen, X., Yan, C. C., Zhang, X., Li, Z., Deng, L., Zhang, Y., et al. (2015). Rbmmmda: Predicting Multiple Types of Disease-Microrna Associations. Sci. Rep. 5, 13877. doi:10.1038/srep13877
Chen, X., Yan, C. C., Zhang, X., You, Z. H., Deng, L., Liu, Y., et al. (2016). Wbsmda: within and between Score for Mirna-Disease Association Prediction. Sci. Rep. 6, 21106–21109. doi:10.1038/srep21106
Chen, X., Xie, D., Zhao, Q., and You, Z.-H. (2019a). Micrornas and Complex Diseases: from Experimental Results to Computational Models. Briefings Bioinforma. 20, 515–539. doi:10.1093/bib/bbx130
Chen, X., Yin, J., Qu, J., and Huang, L. (2018). Mdhgi: Matrix Decomposition and Heterogeneous Graph Inference for Mirna-Disease Association Prediction. PLoS Comput. Biol. 14, e1006418. doi:10.1371/journal.pcbi.1006418
Chen, X., Zhu, C.-C., and Yin, J. (2019b). Ensemble of Decision Tree Reveals Potential Mirna-Disease Associations. PLoS Comput. Biol. 15, e1007209. doi:10.1371/journal.pcbi.1007209
Cui, Z., Liu, J. X., Gao, Y. L., Zhu, R., and Yuan, S. S. (2019). Lncrna-disease Associations Prediction Using Bipartite Local Model with Nearest Profile-Based Association Inferring. IEEE J. Biomed. Health Inf. 24, 1519–1527. doi:10.1109/JBHI.2019.2937827
Fabbri, M., Garzon, R., Cimmino, A., Liu, Z., Zanesi, N., Callegari, E., et al. (2007). Microrna-29 Family Reverts Aberrant Methylation in Lung Cancer by Targeting Dna Methyltransferases 3a and 3b. Proc. Natl. Acad. Sci. U.S.A. 104, 15805–15810. doi:10.1073/pnas.0707628104
Freeman, W. M., Walker, S. J., and Vrana, K. E. (1999). Quantitative Rt-Pcr: Pitfalls and Potential. Biotechniques 26, 112–125. doi:10.2144/99261rv01
He, R., Liu, P., Xie, X., Zhou, Y., Liao, Q., Xiong, W., et al. (2017). circgfra1 and Gfra1 Act as Cernas in Triple Negative Breast Cancer by Regulating Mir-34a. J. Exp. Clin. Cancer Res. 36, 145. doi:10.1186/s13046-017-0614-1
He, Y., Sun, M. M., Zhang, G. G., Yang, J., Chen, K. S., Xu, W. W., et al. (2021). Targeting Pi3k/akt Signal Transduction for Cancer Therapy. Signal Transduct. Target Ther. 6, 425. doi:10.1038/s41392-021-00828-5
Huang, F., Yue, X., Xiong, Z., Yu, Z., Liu, S., and Zhang, W. (2021). Tensor Decomposition with Relational Constraints for Predicting Multiple Types of Microrna-Disease Associations. Brief. Bioinform 22, bbaa140. doi:10.1093/bib/bbaa140
Huang, H. Y., Lin, Y. C., Li, J., Huang, K. Y., Shrestha, S., Hong, H. C., et al. (2020). miRTarBase 2020: Updates to the Experimentally Validated microRNA-Target Interaction Database. Nucleic Acids Res. 48, D148–D154. doi:10.1093/nar/gkz896
Jiang, W., Wang, X., Zhang, C., Xue, L., and Yang, L. (2020). Expression and Clinical Significance of Mapk and Egfr in Triple-Negative Breast Cancer. Oncol. Lett. 19, 1842–1848. doi:10.3892/ol.2020.11274
Kolda, T. G., and Bader, B. W. (2009). Tensor Decompositions and Applications. SIAM Rev. 51, 455–500. doi:10.1137/07070111x
Kozomara, A., and Griffiths-Jones, S. (2014). Mirbase: Annotating High Confidence Micrornas Using Deep Sequencing Data. Nucl. Acids Res. 42, D68–D73. doi:10.1093/nar/gkt1181
Li, D., Zhao, Y., Liu, C., Chen, X., Qi, Y., Jiang, Y., et al. (2011). Analysis of Mir-195 and Mir-497 Expression, Regulation and Role in Breast Cancer. Clin. Cancer Res. 17, 1722–1730. doi:10.1158/1078-0432.ccr-10-1800
Li, L., Gao, Z., Wang, Y.-T., Zhang, M.-W., Ni, J.-C., Zheng, C.-H., et al. (2021a). Scmfmda: Predicting Microrna-Disease Associations Based on Similarity Constrained Matrix Factorization. PLoS Comput. Biol. 17, e1009165. doi:10.1371/journal.pcbi.1009165
Li, L., Wang, Y.-T., Ji, C.-M., Zheng, C.-H., Ni, J.-C., and Su, Y.-S. (2021b). Gcaemda: Predicting Mirna-Disease Associations via Graph Convolutional Autoencoder. PLoS Comput. Biol. 17, e1009655. doi:10.1371/journal.pcbi.1009655
Li, Z., Li, J., Nie, R., You, Z. H., and Bao, W. (2021c). A Graph Auto-Encoder Model for Mirna-Disease Associations Prediction. Brief. Bioinform 22, bbaa240. doi:10.1093/bib/bbaa240
Liang, C., Yu, S., and Luo, J. (2019). Adaptive Multi-View Multi-Label Learning for Identifying Disease-Associated Candidate Mirnas. PLoS Comput. Biol. 15, e1006931. doi:10.1371/journal.pcbi.1006931
Lv, X.-B., Jiao, Y., Qing, Y., Hu, H., Cui, X., Lin, T., et al. (2011). mir-124 Suppresses Multiple Steps of Breast Cancer Metastasis by Targeting a Cohort of Pro-metastatic Genes In Vitro. Chin. J. Cancer 30, 821–830. doi:10.5732/cjc.011.10289
Meng, Y., Shang, R., Jiao, L., Zhang, W., Yuan, Y., and Yang, S. (2018). Feature Selection Based Dual-Graph Sparse Non-negative Matrix Factorization for Local Discriminative Clustering. Neurocomputing 290, 87–99. doi:10.1016/j.neucom.2018.02.044
Narita, A., Hayashi, K., Tomioka, R., and Kashima, H. (2012). Tensor Factorization Using Auxiliary Information. Data Min. Knowl. Disc 25, 298–324. doi:10.1007/s10618-012-0280-z
Nie, F., Huang, H., Cai, X., and Ding, C. (2010). Efficient and Robust Feature Selection via Joint L2,1-Norms Minimization. Adv. neural Inf. Process. Syst. 23.
Pasquier, C., and Gardès, J. (2016). Prediction of Mirna-Disease Associations with a Vector Space Model. Sci. Rep. 6, 27036. doi:10.1038/srep27036
Poy, M. N., Hausser, J., Trajkovski, M., Braun, M., Collins, S., Rorsman, P., et al. (2009). miR-375 Maintains Normal Pancreatic α- and β-cell Mass. Proc. Natl. Acad. Sci. U.S.A. 106, 5813–5818. doi:10.1073/pnas.0810550106
Shang, R., Xu, K., Shang, F., and Jiao, L. (2020). Sparse and Low-Redundant Subspace Learning-Based Dual-Graph Regularized Robust Feature Selection. Knowledge-Based Syst. 187, 104830. doi:10.1016/j.knosys.2019.07.001
Shi, S., Xu, C., Fang, X., Zhang, Y., Li, H., Wen, W., et al. (2020). Expression Profile of Toll-like R-eceptors in H-uman B-reast C-ancer. Mol. Med. Rep. 21, 786–794. doi:10.3892/mmr.2019.10853
Tang, X., Luo, J., Shen, C., and Lai, Z. (2021). Multi-view Multichannel Attention Graph Convolutional Network for miRNA-Disease Association Prediction. Brief. Bioinform 22, bbab174. doi:10.1093/bib/bbab174
Van Laarhoven, T., Nabuurs, S. B., and Marchiori, E. (2011). Gaussian Interaction Profile Kernels for Predicting Drug-Target Interaction. Bioinformatics 27, 3036–3043. doi:10.1093/bioinformatics/btr500
Várallyay, É., Burgyán, J., and Havelda, Z. (2008). Microrna Detection by Northern Blotting Using Locked Nucleic Acid Probes. Nat. Protoc. 3, 190–196. doi:10.1038/nprot.2007.528
Vogt, M., Munding, J., Grüner, M., Liffers, S.-T., Verdoodt, B., Hauk, J., et al. (2011). Frequent Concomitant Inactivation of Mir-34a and Mir-34b/c by Cpg Methylation in Colorectal, Pancreatic, Mammary, Ovarian, Urothelial, and Renal Cell Carcinomas and Soft Tissue Sarcomas. Virchows Arch. 458, 313–322. doi:10.1007/s00428-010-1030-5
Wang, D., Wang, J., Lu, M., Song, F., and Cui, Q. (2010). Inferring the Human Microrna Functional Similarity and Functional Network Based on Microrna-Associated Diseases. Bioinformatics 26, 1644–1650. doi:10.1093/bioinformatics/btq241
Yan, C., Duan, G., Li, N., Zhang, L., Wu, F.-X., and Wang, J. (2022). PDMDA: Predicting Deep-Level miRNA-Disease Associations with Graph Neural Networks and Sequence Features. Bioinformatics 38, 2226–2234. doi:10.1093/bioinformatics/btac077
Yin, M.-M., Liu, J.-X., Gao, Y.-L., Kong, X.-Z., and Zheng, C.-H. (2020). Ncplp: a Novel Approach for Predicting Microbe-Associated Diseases with Network Consistency Projection and Label Propagation. IEEE Trans. Cybern. doi:10.1109/tcyb.2020.3026652
Zeng, X., Zhang, X., and Zou, Q. (2016). Integrative Approaches for Predicting Microrna Function and Prioritizing Disease-Related Microrna Using Biological Interaction Networks. Brief. Bioinform 17, 193–203. doi:10.1093/bib/bbv033
Zhang, X., Yin, J., and Zhang, X. (2018). A Semi-supervised Learning Algorithm for Predicting Four Types Mirna-Disease Associations by Mutual Information in a Heterogeneous Network. Genes. 9, 139. doi:10.3390/genes9030139
Zhou, F., Yin, M.-M., Jiao, C.-N., Zhao, J.-X., Zheng, C.-H., and Liu, J.-X. (2021). Predicting Mirna-Disease Associations through Deep Autoencoder with Multiple Kernel Learning. IEEE Trans. Neural Netw. Learn. Syst. doi:10.1109/tnnls.2021.3129772
Keywords: multiple types of miRNA–disease associations, weighted tensor decomposition, graph Laplacian regularization, L2, 1 norm, multi-view biological similarity network
Citation: Ouyang D, Miao R, Wang J, Liu X, Xie S, Ai N, Dang Q and Liang Y (2022) Predicting Multiple Types of Associations Between miRNAs and Diseases Based on Graph Regularized Weighted Tensor Decomposition. Front. Bioeng. Biotechnol. 10:911769. doi: 10.3389/fbioe.2022.911769
Received: 03 April 2022; Accepted: 04 May 2022;
Published: 04 July 2022.
Edited by:
Qi Zhao, University of Science and Technology Liaoning, ChinaCopyright © 2022 Ouyang, Miao, Wang, Liu, Xie, Ai, Dang and Liang. This is an open-access article distributed under the terms of the Creative Commons Attribution License (CC BY). The use, distribution or reproduction in other forums is permitted, provided the original author(s) and the copyright owner(s) are credited and that the original publication in this journal is cited, in accordance with accepted academic practice. No use, distribution or reproduction is permitted which does not comply with these terms.
*Correspondence: Yong Liang, yongliangresearch@gmail.com