- 1Department of Mechanical Engineering, University of British Columbia, Vancouver, BC, Canada
- 2ICORD, University of British Columbia, Vancouver, BC, Canada
- 3Department of Electrical and Computer Engineering, University of British Columbia, Vancouver, BC, Canada
- 4Department of Human Health and Nutritional Sciences, University of Guelph, Guelph, ON, Canada
- 5Department of Orthopaedics, University of British Columbia, Vancouver, BC, Canada
Paraspinal muscles are vital to the functioning of the spine. Changes in muscle physiological cross-sectional area significantly affect spinal loading, but the importance of other muscle biomechanical properties remains unclear. This study explored the changes in spinal loading due to variation in five muscle biomechanical properties: passive stiffness, slack sarcomere length (SSL), in situ sarcomere length, specific tension, and pennation angle. An enhanced version of a musculoskeletal simulation model of the thoracolumbar spine with 210 muscle fascicles was used for this study and its predictions were validated for several tasks and multiple postures. Ranges of physiologically realistic values were selected for all five muscle parameters and their influence on L4-L5 intradiscal pressure (IDP) was investigated in standing and 36° flexion. We observed large changes in IDP due to changes in passive stiffness, SSL, in situ sarcomere length, and specific tension, often with interesting interplays between the parameters. For example, for upright standing, a change in stiffness value from one tenth to 10 times the baseline value increased the IDP only by 91% for the baseline model but by 945% when SSL was 0.4 μm shorter. Shorter SSL values and higher stiffnesses led to the largest increases in IDP. More changes were evident in flexion, as sarcomere lengths were longer in that posture and thus the passive curve is more influential. Our results highlight the importance of the muscle force-length curve and the parameters associated with it and motivate further experimental studies on in vivo measurement of those properties.
1 Introduction
Paraspinal muscles are vital to the functionality of the spine and their dysfunction is deemed a major risk factor for a variety of spinal disorders including spinal deformity (Sinaki et al., 1996; Roghani et al., 2017), adjacent segment disease (Kim et al., 2016; Malakoutian et al., 2016a), and lower back pain (Nicolaisen and Jorgensen, 1985; Mannion, 1999; Goubert et al., 2017; Masaki et al., 2017). To what extent muscle dysfunction is involved in the development of these conditions is unknown. Musculoskeletal models of the spine provide estimates of muscle and spinal loading for various conditions and daily activities and thus provide unique insight into the biomechanical performance of the system since direct measurement of in vivo spinal forces and moments is not feasible with current technology. This knowledge could enhance our understanding of the etiology of spinal conditions and help in the development of better treatment or prevention strategies.
Spinal loading depends upon the biomechanical properties of the paraspinal muscles. These properties include physiological cross-sectional area (PCSA), passive stiffness, slack sarcomere length (SSL, beyond which passive force starts to develop), in situ sarcomere length (i.e., sarcomere length measured inside the body for a certain posture), pennation angle, and specific tension (defined as the maximum force per unit area produced by contractile elements) (Figure 1). For example, muscle PCSA has been shown to affect both spinal loading magnitudes (Jamshidnejad and Arjmand, 2015; Malakoutian et al., 2016a) and muscle activation patterns (Bresnahan et al., 2010). The importance of many other muscle parameters to the spine remains unknown, even though they have great importance to the biomechanical functioning of the individual muscles.
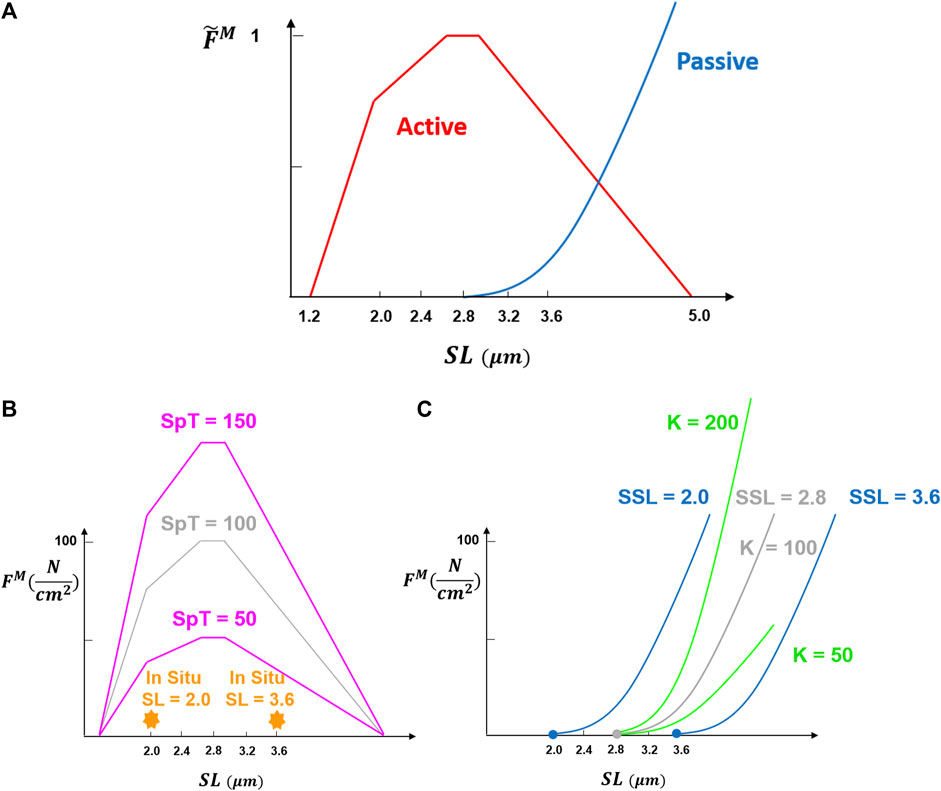
FIGURE 1. Fundamental muscle force-length curve was adopted from Millard et al. (2013). Normalized muscle force
The well-known force-length relation of muscle (Figure 1) is included appropriately in only a relatively few optimization-based biomechanical models of the spine [e.g., (Christophy et al., 2012; Bruno et al., 2015; Malakoutian et al., 2016b; Senteler et al., 2016)]. Even in these models, most of the required muscle parameters are either assumed or taken from cadaveric studies. For example, the passive elastic modulus, slack sarcomere length, and specific tension are assumed to be the same for all muscles in these models, while those have been shown to differ between muscle groups or between pathologies (Ward et al., 2009c; Lieber et al., 2003; Smith et al., 2011; Luden et al., 2008; Noonan et al., 2021). Due to the ethical and technical challenges, only a few and limited in vivo measurements of these parameters have been made to date (Ward et al., 2009c; Malakoutian, 2021). This might be because the significance of these parameters in spine modeling is not yet fully understood. In fact, there are no studies that have assessed the effect of these different muscle properties on spinal loading within these different models (Christophy et al., 2012; Bruno et al., 2015; Malakoutian et al., 2016b; Senteler et al., 2016).
Therefore, the objective of this study was to explore changes in spinal loading due to variation in the paraspinal muscle parameters, specifically slack sarcomere length, passive stiffness, in situ sarcomere length, specific tension, and pennation angle.
2 Materials and Methods
We used a recent detailed model of the lumbar spine developed by our group (Malakoutian et al., 2016b), which was based on the model introduced by Christophy et al. (2012) and used ArtiSynth (www.artisynth.org) for physical simulation (Lloyd et al., 2012). In this study, the solution method was enhanced to extend the validation to several activities and postures as described in the following sections.
2.1 Geometric Model
The geometry and mechanical properties of the spine model were the same as reported previously (Malakoutian et al., 2016b). The model consisted of five mobile lumbar vertebrae, L1–L5, with the entire thorax rigidly fixed to L1. The sacrum and pelvis were fixed to the ground and the segmental weights of the upper body along with the weights of the head, neck, and arms were all incorporated. The adjacent lumbar vertebrae were connected through massless 6-DOF springs (i.e., six degrees of freedom including three translation and three rotation) with a 6 × 6 stiffness matrix for each lumbar functional spinal unit (FSU, defined as a pair of adjacent vertebrae with connecting ligaments, facet joints, and intervertebral disc). Relative displacements and rotations between two adjacent vertebrae generate restoring forces and moments by the 6-DOF springs which are applied equally but in opposite directions at the centers of the two vertebrae. Due to the paucity of the data in the literature, only diagonal terms of the stiffness matrix were included: translational terms were taken from one study (Gardner-Morse and Stokes, 2004) while the nonlinear formulations for the rotational terms were adopted from another (Heuer et al., 2007b). The effect of Intra-abdominal pressure was modeled as a force applied on the thorax inserted at the center of the diaphragm remaining normal to the diaphragm surface at all postures (Han et al., 2012).
Muscles in the model comprised 210 fascicles, each modeled as a Hill-type musculotendon actuator. PCSA, supine/prone in situ sarcomere length, pennation angle, and fiber to tendon ratios were defined for all muscles, as was done by Christophy et al. (2012). These anatomic and biomechanical properties are all involved in muscle force computation as:
where
The normalized force-length and force-velocity curves were taken from the study by Millard et al. (2013) and tendons were assumed to be rigid. The baseline value
2.2 Solution Method
Our spine model in ArtiSynth used forward dynamics assisted data tracking and optimization to solve the muscle redundancy problem (Malakoutian et al., 2016b; Sagl et al., 2019; Erdemir et al., 2007). The optimization predicts muscle activations to achieve an input trajectory for one or more target points (Figure 2A). In the current model, we set the thorax rotation as an input into the optimization cost function of the model, while the other mobile rigid bodies (i.e., L2–L5) were all able to move freely (Figures 2B–D). This is a better approach than our previous strategy of prescribing the position of a specific set of target points, as it eliminates the sensitivity of the spinal forces to the translational component of the prescribed trajectory observed in other models (Malakoutian et al., 2016b; Eskandari et al., 2019; Dehghan-Hamani et al., 2019; Byrne et al., 2020). The cost function for the optimization was a weighted summation of four terms: the kinematics tracking error, the sum of muscle activations squared, the sum of the square of the difference between the activations of two consecutive time steps, and the sum of FSUs (6-DOF springs) forces squared. The fourth term was added to the optimization cost function to minimize the intervertebral loads (Schultz et al., 1982; Stokes and Gardner-Morse, 2001; Arjmand and Shirazi-Adl, 2006b), and was different from our previous model. Quadratic programming was used to solve for the set of muscle activations that would minimize the total cost function. The weighting terms were determined through the calibration process.
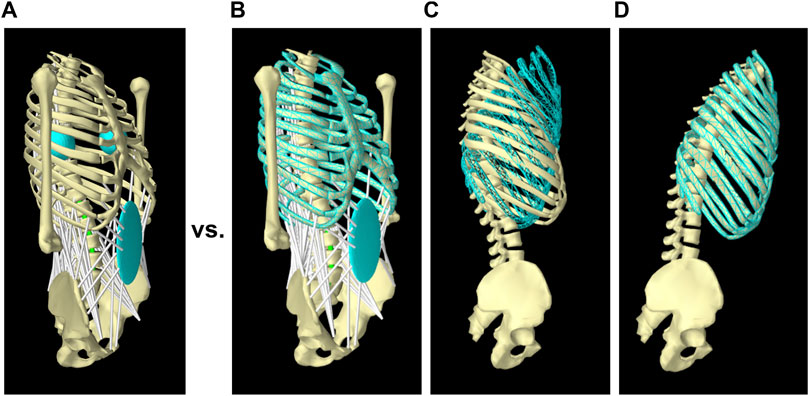
FIGURE 2. Tracking target frames instead of target points in the new solution method. In the previous model (Malakoutian et al., 2016b), the full trajectory of two symmetric target points located at the right and left of the thorax was assigned as input and tracked by the model (A); while in the new solution method, only rotation of the thorax was given as input (B and C) and followed by the model (D).
2.3 Calibration
The purpose of model calibration is to choose the four weighting terms used for summing the optimization cost functions and to determine the muscle-specific tension. For the computation of muscle forces, the normalized force-length curve and force-velocity curve are scaled by the specific tension, which is defined as the maximum contractile force per unit area a muscle can produce at its optimum length; and is typically assumed to be the same for all muscles in a musculoskeletal model. The specific tension along with the weighting terms for the first three cost functions was determined in our previous model through the simulation of two postures (10° extension and 10° flexion) of an in vivo study (Daggfeldt and Thorstensson, 2003). Adopting the same values, we followed a similar calibration approach including two additional postures (−20° extension, 30° flexion) and determined the weighting term for the new FSU load term in the cost function (see Supplementary Material S2 for the details of our calibration approach). Among the three values of 80, 90, and 100
2.4 Validation
For validation of the new solution method, we compared the prediction of our model for L4-L5 IDP to the L4-L5 IDP measured in vivo for five symmetric activities (Wilke et al., 2001): 1) 19° extension, 2) upright standing, 3) and 4) holding a crate of 190 N close and far from the chest (25 and 55 cm anterior to the L5-S1 disc), and 5) 36° flexion. The output of our model was the forces and moments on each FSU (6-DOF spring). We performed a post-analysis to compute the IDP values as the sum of IDP resulting from the compressive force and the IDP from the flexion/extension moment. We assumed that shear force did not influence IDP (Frei et al., 2001). The IDP associated with the compressive force,
where 0.85 is considered as the intervertebral disc share of the compressive force on the FSU,
where
The predicted paraspinal muscle activation for the upright standing and 36° flexion postures were additionally contrasted against the in vivo electromyographic (EMG) findings in the literature (Peach et al., 1998; McGill et al., 1999).
Two postures of 10° extension and 40° flexion were also simulated to compare the predicted rotations of the vertebrae against those measured for 50 healthy men (Wong et al., 2004).
2.5 Study Design for Investigating Impact of Muscle Parameters
The model used for validation (Section 2.4) was considered as the baseline model and all values for muscle parameters in that model were considered baseline values. Using that model, we examined the changes in L4-L5 IDP in response to variation in each of the following five muscle parameters (one parameter at a time): slack sarcomere length, passive stiffness, supine/prone in situ sarcomere length, specific tension, and pennation angle. For two of the parameters, specifically passive stiffness and supine/prone in situ sarcomere length, an extra set of simulations was performed when the slack sarcomere length was 0.4 μm shorter than its baseline value (to explore possible interplays between these parameters). All simulations were performed for two postures of upright standing and 36° flexion.
Baseline values for three of the muscle parameters were the same in all muscles: SSL 2.8 μm, scaling factor for the normalized passive stiffness curve (K) 100
The baseline value for the slack sarcomere length in the curves used (Millard et al., 2013) was the optimum sarcomere length, which is assumed to be 2.8 μm in humans (Delp et al., 2001). Although a slack sarcomere length value at the whole muscle level is desired, that has never been measured for paraspinal muscles. The slack sarcomere length values measured for human paraspinal muscles range between 1.8 and 2.8 μm microns for individual muscle fibers and fiber bundles (Malakoutian, 2021) and thus for our study, we tested five different values of 2.0, 2.4, 2.8 (baseline), 3.2, and 3.6
The normalized passive curve was scaled by a constant
The supine/prone in situ sarcomere length and pennation angle of the muscles in our baseline model were taken from both in vivo and cadaveric studies in the literature and differed between muscle groups [see Table 3-3 in Malakoutian, 2014]. In situ sarcomere length for human paraspinal samples measured in supine/prone posture exhibits values between 1.9 and 3.6 μm (Malakoutian, 2021; Ward et al., 2009a; Bayoglu et al., 2017); thus, we tested five different values of 2.0, 2.4, 2.8, 3.2, 3.6
The specific tension measured experimentally for human single fibers rarely exceeds an average value of ∼40
The changes in each muscle parameter were applied in four different scenarios: scenario 1, MUL, involved changes only applied to the multifidus; scenario 2, EXT, involved changes applied to extensor muscles including multifidus, longissimus thoracis, iliocostalis lumborum, and quadratus lumborum; scenario 3, EXT + PS, involved changes applied to extensor muscles as well as psoas; and scenario 4, ALL, involved changes made to all 210 muscle fascicles in the model. These scenarios were defined as simulating plausible scenarios related to a certain pathology or surgical intervention. For example, with genetic pathologies, all muscles may be affected and present higher stiffness values; while for changes after spinal surgeries only multifidus or all those directly attached to the spine (i.e., extensors and psoas) may be involved.
3 Results
3.1 Validation
The resultant compressive and shear forces along with the flexion moments for all lumbar vertebral levels are presented for the five symmetric activities performed by the baseline model (Table 1). The corresponding IDP with forces and moments at the level L4-L5 compared well with the in vivo IDPs (Figure 3), such that a linear fit to the predicted L4-L5 IDPs by the model and those measured in vivo resulted in a coefficient of determination of 0.98.
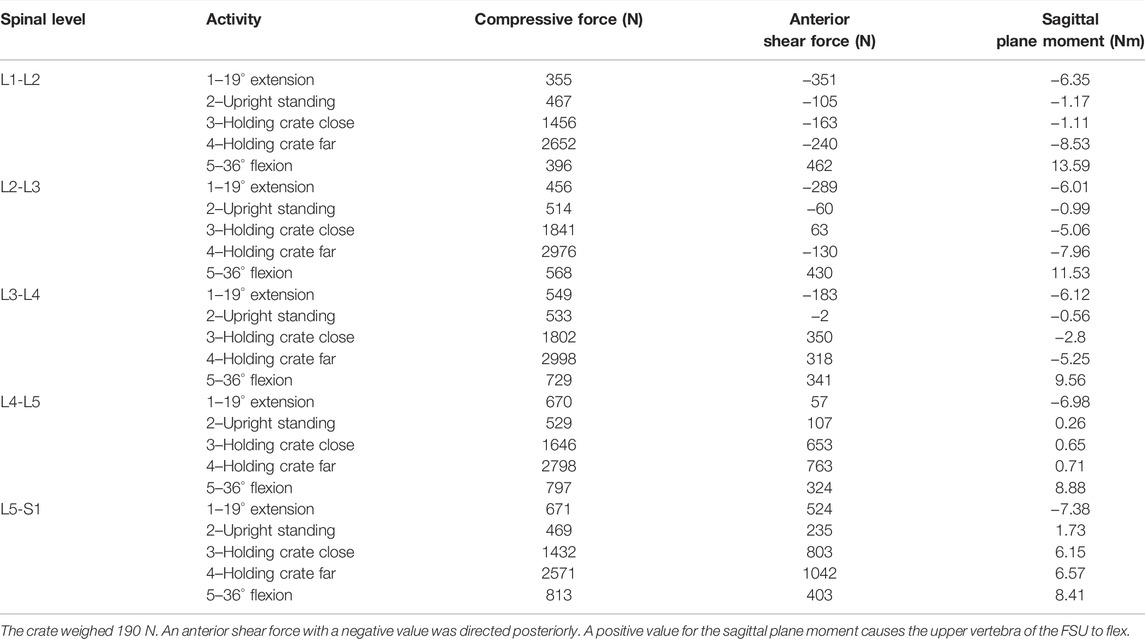
TABLE 1. Predicted compressive forces, shear forces, and sagittal plane moments at all vertebral levels by the model for the five different activities performed by the subject of the in vivo study (Wilke et al., 2001).
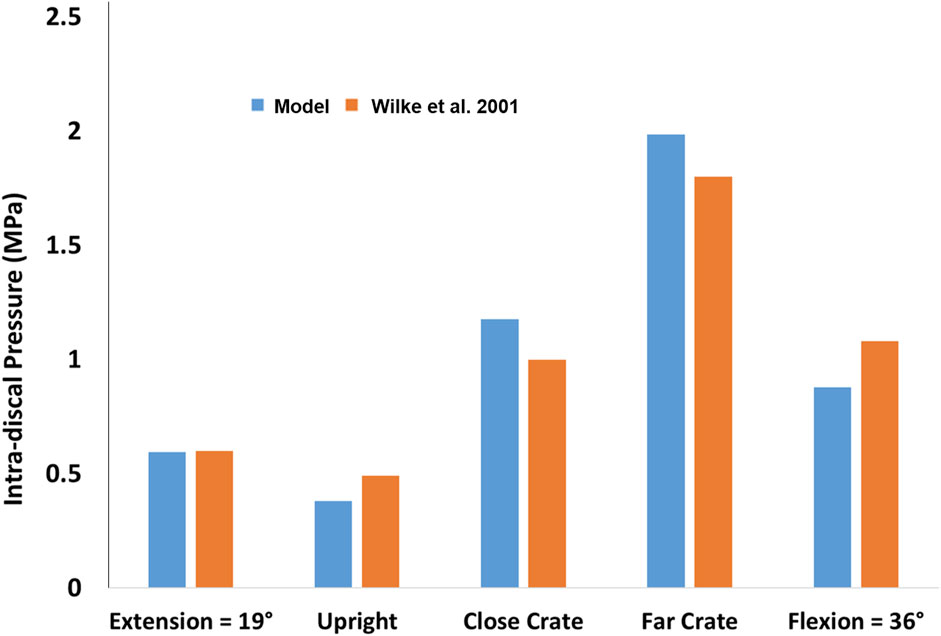
FIGURE 3. Comparison between the predicted L4-L5 IDP by the model and those measured in vivo for five different activities (Wilke et al., 2001).
The activity of the extensor and abdominal muscles also compared well with the EMG findings in the literature. In 36° flexion, the activation level of extensor muscles dropped such that the sum of active forces in extensor muscles was 44 N in our model compared to 206 N in upright standing, mimicking the well-known flexion-relaxation phenomenon (Colloca and Hinrichs, 2005; Peach et al., 1998; McGill et al., 1999). The occurrence of this phenomenon is attributed to the development of forces in passive tissues including the extensor muscles (from 0 N in standing to 334 N in 36° flexion in our model), as suggested in previous studies (Colloca and Hinrichs, 2005). On the other hand, the active forces in abdominal muscles increased from 4 N in upright standing to 371 N in 36° flexion, which is also in harmony with the recorded increase in EMG of human abdominal muscles in flexion (Peach et al., 1998; McGill et al., 1999).
The rotation of the thorax was dictated by the user, but the trajectories of the other vertebrae were free (i.e., were not determined with a predefined function). The intervertebral rotations from upright standing for both 10° extension and 40° flexion fell within the range observed for 50 healthy men (Wong et al., 2004; Figure 4).
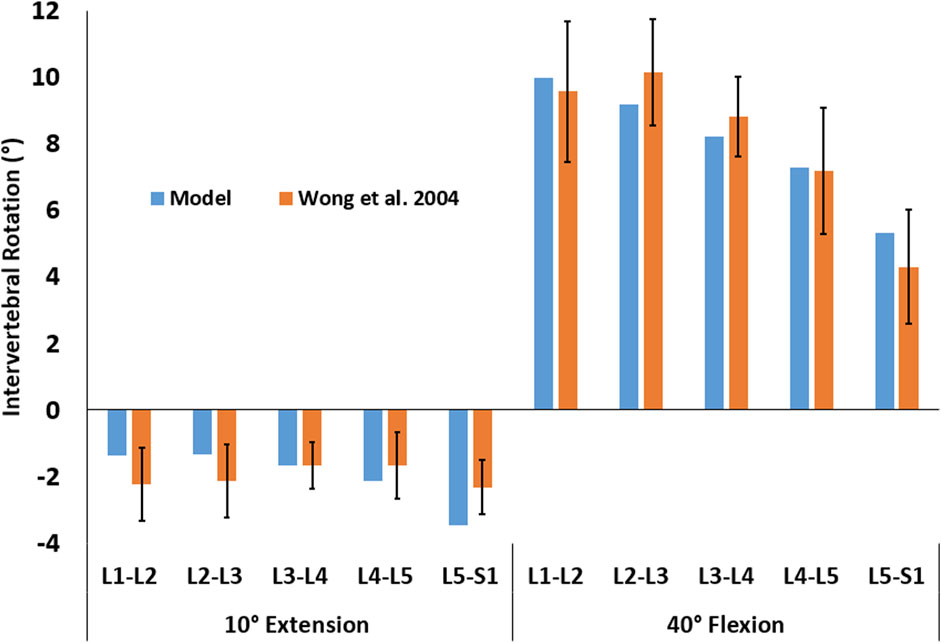
FIGURE 4. Intervertebral rotations for two activities of 10° extension and 40° flexion were predicted by the model (blue) and observed in 50 male subjects (orange, Wong et al., 2004). The error bars represent the mean ± one standard deviation.
3.2 Impact of Muscle Parameters on L4-L5 Intradiscal Pressure
All muscle parameters except the pennation angle had a dramatic impact on the predicted L4-L5 IDP in both standing and flexion activities.
3.2.1 Slack Sarcomere Length
The influence of slack sarcomere length on the IDP was greatest when it was set to 2.0 μm or 2.4 μm (Figure 5, note that slack sarcomere length of 2.8 μm is the baseline value). For example, changing the slack sarcomere length of the multifidus to 2.0 μm and keeping the slack sarcomere length equal to 2.8 μm for the other muscles, doubled the IDP in standing. This occurrence was due to the development of passive forces in the multifidus, whose sarcomere length was 2.27 μm in standing. The IDP was seven times and 10 times larger in standing when the slack sarcomere length of EXT and EXT + PS were also set to 2.0 μm, respectively. The model was not able to reach 36° flexion for any of these cases due to substantial passive forces that would have been developed in that posture. The same but milder trend was observed when slack sarcomere length was set to 2.4 μm in standing; while in flexion, the IDP even tripled (increased from a baseline value of 0.88–2.6 MPa). For slack sarcomere length values larger than 2.8 μm, the total IDP did not change, although the distribution between the IDP from the compressive force and the IDP from flexion/extension moment changed somewhat.
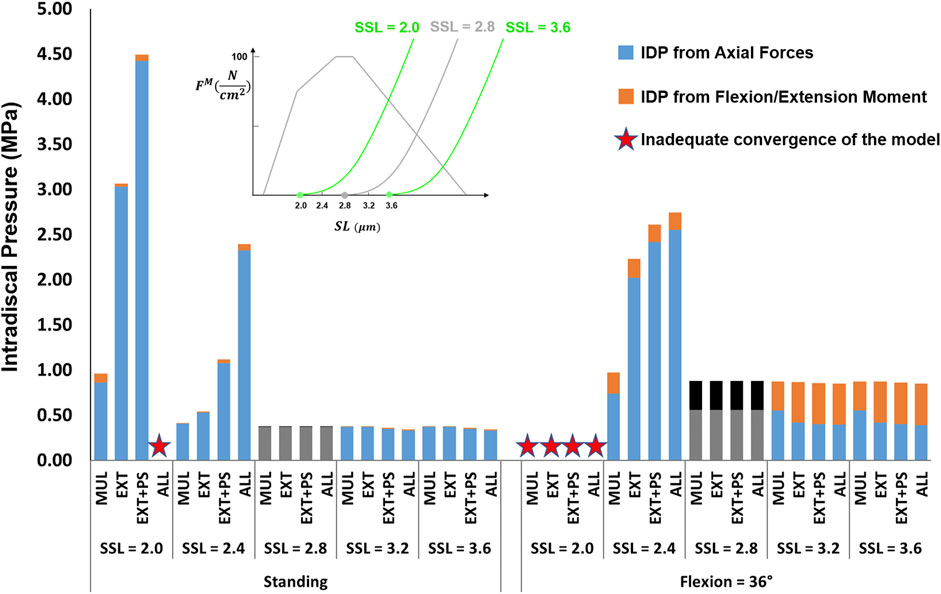
FIGURE 5. The effect of different slack sarcomere length (SSL) values on L4-L5 IDP in upright standing and 36° flexion for four scenarios: changes applied to multifidus (MUL), extensor muscles (EXT), extensor muscles, and psoas (EXT + PS), and all 210 muscles in the model (ALL). Grey/black bars represent the baseline values.
3.2.2 Passive Stiffness
The effects of passive stiffness and supine/prone in situ sarcomere length on IDP were both dependent on the slack sarcomere length. When slack sarcomere length was 2.8 μm, reducing the passive stiffness to half or even one-tenth of the baseline value did not change the IDP by more than 20% (Figure 6). However, when passive stiffnesses were increased to five times or 10 times greater than the baseline, the IDP increased considerably for most scenarios, especially in flexion (Figure 6). When slack sarcomere length was set to 2.4 μm for the targeted muscles whose stiffness also changed, for all stiffness scaling factors the IDP changed dramatically both in standing and flexion and its extent depending on what muscles were manipulated (Figure 7). For example, a five or 10 fold increase in multifidus stiffness, combined with setting its slack sarcomere length to 2.4 μm, elevated the IDP in flexion from ∼1 to ∼2 or ∼3 MPa. This IDP increase was a result of multifidus passive forces developed after its sarcomeres lengthened from 2.27 μm (on average) in standing, passed the slack sarcomere length (i.e., 2.4 μm) in 11° flexion and reached 3.01 μm (leading to ∼25% strain in multifidus) in 36° flexion.
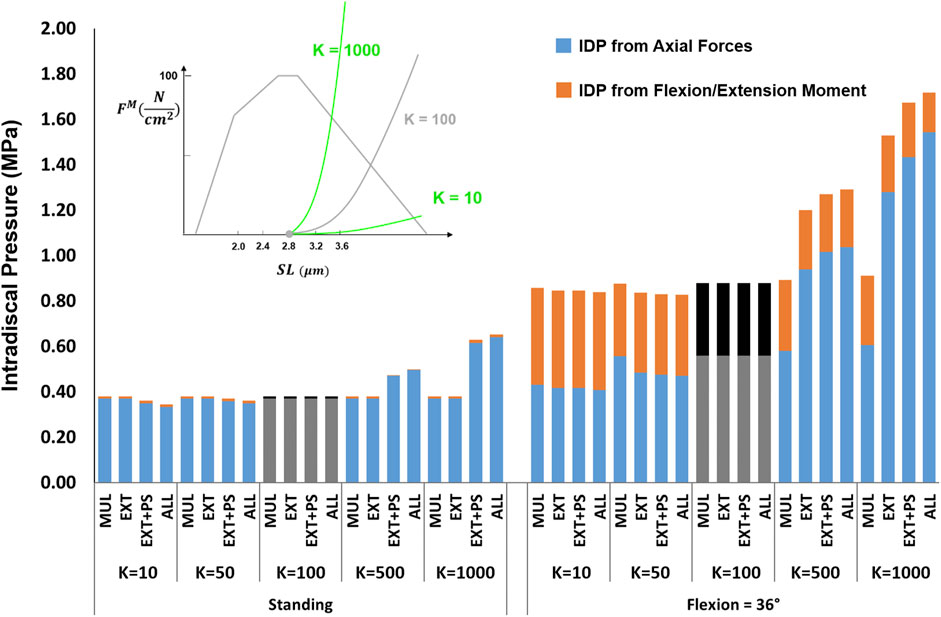
FIGURE 6. The effect of different passive force-length curve scaling constants (K in
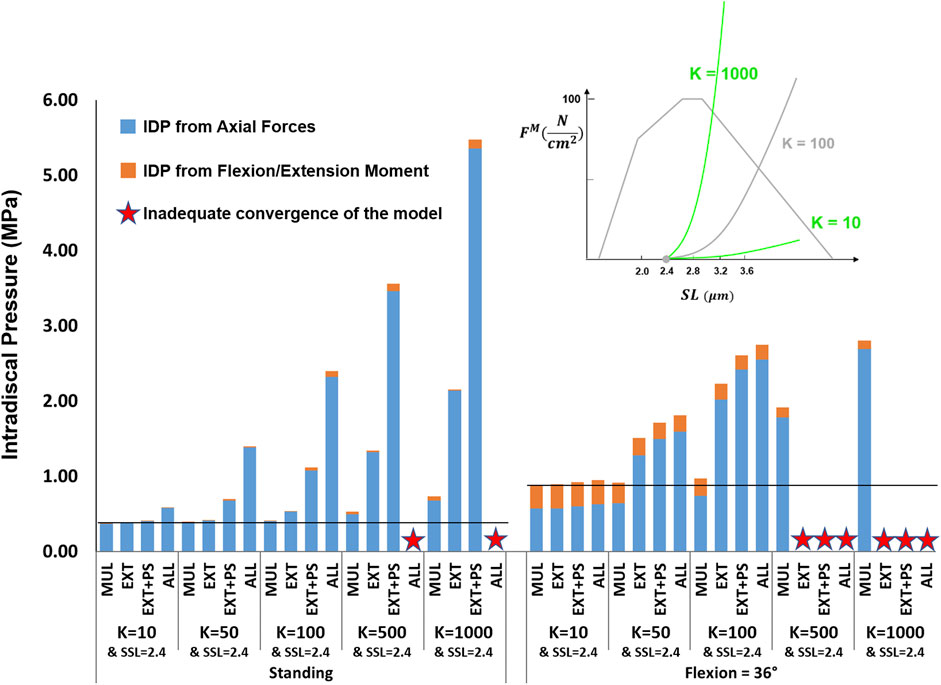
FIGURE 7. The effect of different passive force-length curve scaling constants (K in
3.2.3 In Situ Sarcomere Length
For the supine/prone in situ sarcomere length values of 2.0 and 2.4 μm when slack sarcomere length was 2.8 μm, only small differences in IDP were observed (Figure 8). For greater supine/prone in situ sarcomere lengths, however, the increase in the IDP was large, especially in flexion, where sarcomere lengths exceeded the slack sarcomere length. For example, when the supine/prone in situ sarcomere length of the entire group of extensor muscles was 3.6 μm, the IDP increased by 79% (reaching 0.68 MPa from 0.38 MPa) in standing and by 380% (reaching 3.34 MPa from 0.88 MPa) in flexion. When slack sarcomere length was set to 2.4 μm for the targeted muscles whose supine/prone in situ sarcomere length was also changed, much larger increases in IDP occurred for all supine/prone in situ sarcomere length values (Figure 9). For example, when multifidus was manipulated alone to a slack sarcomere length of 2.4 μm and a supine/prone in situ sarcomere length of 3.6 μm compared to when it is set to 2.0 μm, the IDP doubles in both standing and flexion.
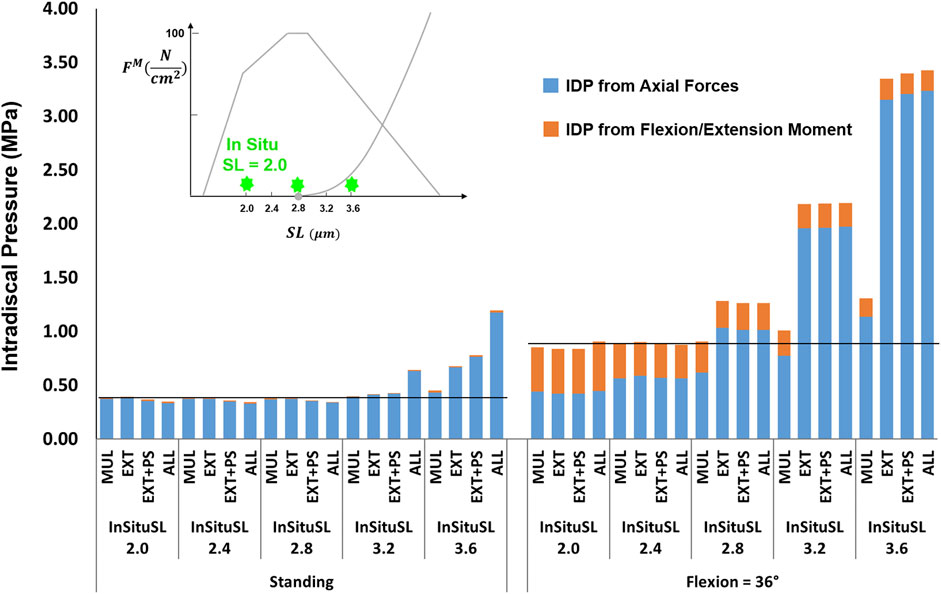
FIGURE 8. The effect of different supine/prone in situ sarcomere length on L4-L5 IDP in upright standing and 36° flexion for four scenarios: changes applied to multifidus (MUL), extensor muscles (EXT), extensor muscles, and psoas (EXT + PS), and all 210 muscles in the model (ALL). The black horizontal lines represent the baseline values.
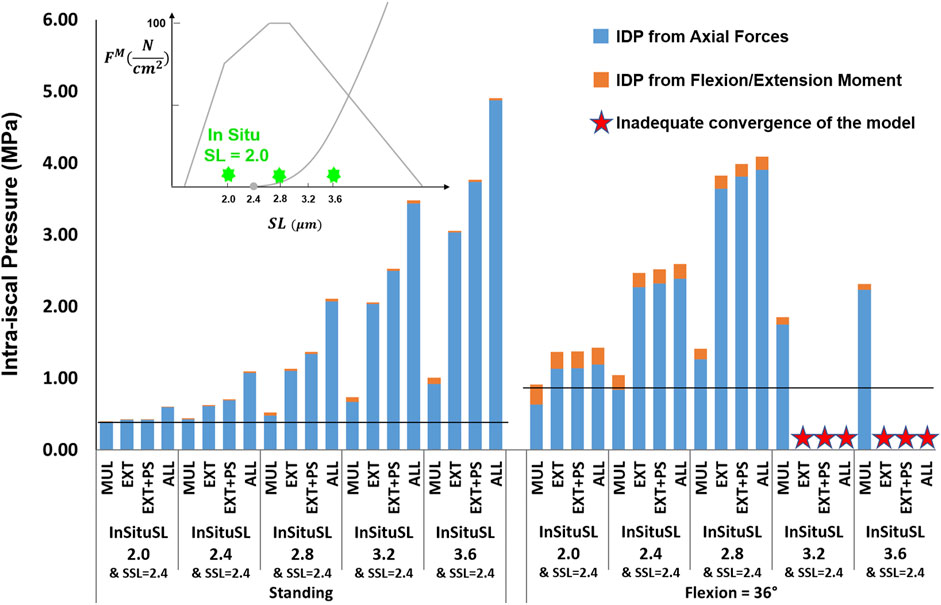
FIGURE 9. The effect of different supine/prone in situ sarcomere lengths combined with a slack sarcomere length (SSL) of 2.4 μm to the targeted muscles on L4-L5 IDP in upright standing and 36° flexion for four scenarios: changes applied to multifidus (MUL), extensor muscles (EXT), extensor muscles and psoas (EXT + PS), and all 210 muscles in the model (ALL). The black horizontal lines represent the baseline values.
3.2.4 Specific Tension
The studied values for the specific tension had a minimal influence on the IDP in flexion, except for the scenario where the changes were applied to all muscles, which increased the IDP by 39% when the specific tension was set to one-tenth of its baseline value (Figure 10). For upright standing, the increase in specific tension also had little effect on the IDP. However, when the specific tension was reduced to half or a quarter of its baseline value, the IDP manifested an increasing trend, with the largest increases occurring when the changes were made to the extensor muscles only. The model was not able to achieve the upright posture when the specific tension was decreased for the extensor muscles to 10% of the baseline value, or 5% of the baseline value for all scenarios, except for when the change was made to multifidus only.
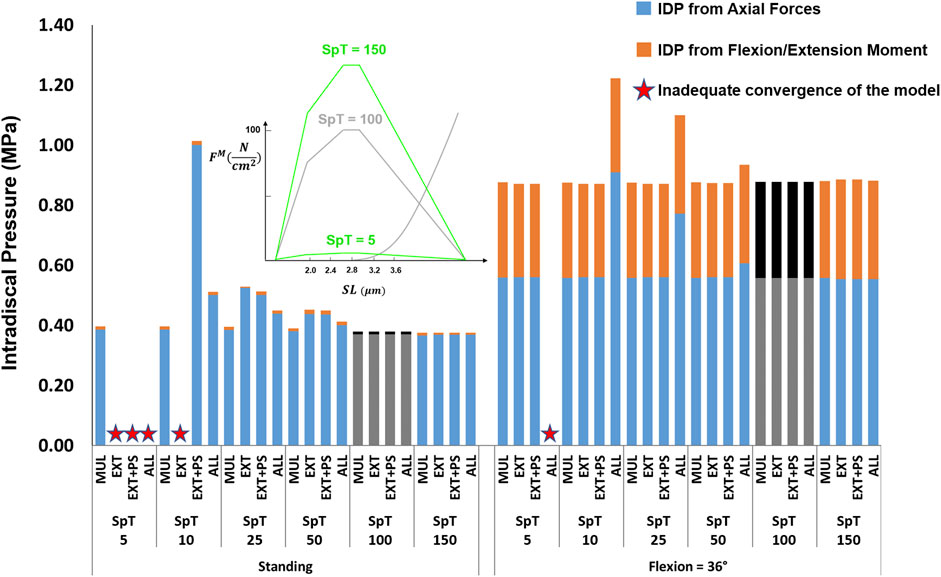
FIGURE 10. The effect of different specific tension (SpT) values on L4-L5 IDP in upright standing and 36° flexion for four scenarios: changes applied to multifidus (MUL), extensor muscles (EXT), extensor muscles and psoas (EXT + PS), and all 210 muscles in the model (ALL). Grey bars represent the baseline values.
3.2.5 Pennation Angle
The influence of pennation angle on the overall IDP for both standing and flexion was negligible (Figure 11).
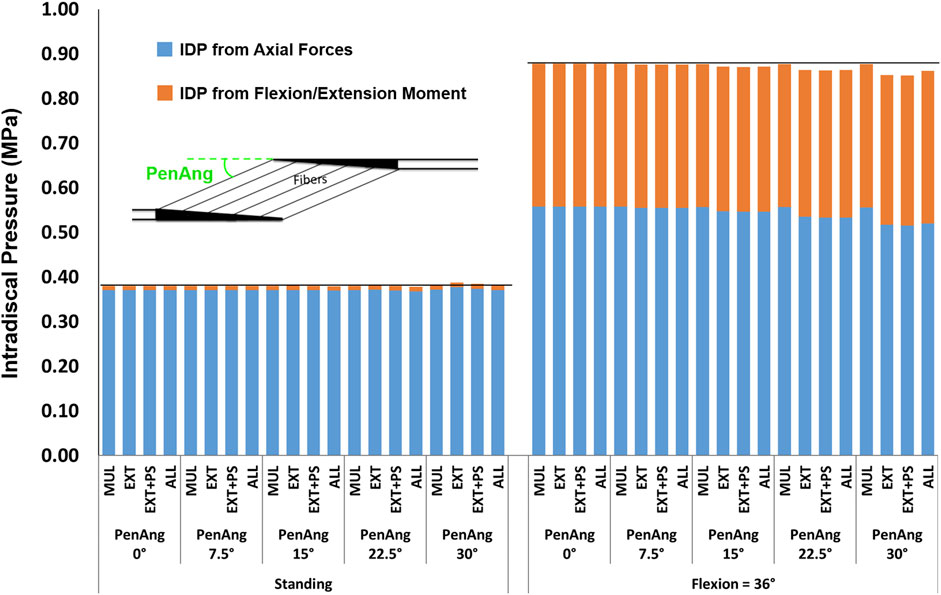
FIGURE 11. The effect of different pennation angles on L4-L5 IDP in upright standing and 36° flexion for four scenarios: changes applied to multifidus (MUL), extensor muscles (EXT), extensor muscles, and psoas (EXT + PS), and all 210 muscles in the model (ALL). The black horizontal lines represent the baseline values.
4 Discussion
Musculoskeletal models serve as promising tools for gaining knowledge of spinal loading during various daily activities. The accuracy of their predictions, however, relies on the input variables, including the biomechanical properties of the muscle. The significance of the muscle force-length curve and the parameters associated with it is not yet clearly known for spinal loading, which is probably why only a relatively few optimization-based models have included that appropriately in their solution methods [e.g., (Christophy et al., 2012; Bruno et al., 2015; Malakoutian et al., 2016b; Senteler et al., 2016)]. The predicted muscle activity, intervertebral rotations, and the L4-L5 IDP in our improved model were in excellent agreement with the corresponding in vivo measurements (Wilke et al., 2001; Wong et al., 2004; Peach et al., 1998; McGill et al., 1999). The validated model was used to investigate the variation of the L4-L5 IDP to a range of muscle parameters. The predictions revealed the strong influence of the slack sarcomere length, passive stiffness, in situ sarcomere length, and specific tension on spinal loading. The reasons for these observations and their implications will be explored in the following paragraphs in the discussion.
The analysis performed in this study revealed the importance of the muscle force-length curve, including both passive and active components, on spinal loading. We observed a substantial influence of slack sarcomere length, passive stiffness, supine/prone in situ sarcomere length, and specific tension on spinal loading, often with interesting interplays between the parameters. For example, in upright standing the values less than 100
The simulated values for all muscle parameters studied herein–slack sarcomere length, supine/prone in situ sarcomere length, passive stiffness, specific tension, and pennation angle were relevant based upon the limited human muscle measurements and the biomechanical models in the literature. For example, the supine/prone in situ sarcomere lengths for most paraspinal muscles in spine models are taken from cadaveric studies (Ward et al., 2009a; Delp et al., 2001; Bayoglu et al., 2017). While the large variation between these measurements in individuals (Table 2) may be an artifact of the postures in which the cadavers were embalmed, it may reflect natural differences between humans or their pathologies. Prone in situ sarcomere length of multifidus and longissimus have been measured in vivo with observed ranges for individual measurements between 1.9 and 3.4 μm (Ward et al., 2009b; Malakoutian, 2021). Those measurements were obtained through specialized biopsy clamps and were taken from patients undergoing spinal surgery. Less invasive measurement of this parameter in healthy individuals has become feasible recently (Sanchez et al., 2015) but has not yet been used for paraspinal muscles.

TABLE 2. Difference in lumbar spine models with regard to the sources of supine/prone in situ sarcomere length values taken from the literature.
Experimental measurement of slack sarcomere length, passive stiffness, and specific tension requires fresh muscle tissue. slack sarcomere length and passive stiffness of human paraspinal muscles were measured through biopsies collected intraoperatively (Ward et al., 2009c; Malakoutian, 2021). Those measurements were performed on muscle single fibers and fiber bundles (∼10–20 fibers ensheathed in their connective tissue), with the slack sarcomere length exhibiting a range between 1.8 to 2.8 μm for the individual data points. The slack sarcomere length of interest for modeling studies should be measured at the fascicle (∼500 fibers) or whole muscle level. Due to technical challenges, measurement of slack sarcomere length or even passive stiffness and specific tension in spine muscles has never been done for humans or any other species at the fascicle or whole muscle level. Given these data, the slack sarcomere length range studied herein of 2.0 μm through 3.6 μm seems relevant when considering the possibility of larger values if measurements were made at the whole muscle level or for spine pathologic patients.
A similar argument can be made for passive stiffness. In a recent study on rabbits (Ward et al., 2020), it was demonstrated for elastic modulus of lower extremity muscles to increase nonlinearly from smaller scales to larger ones. For example, at 30% strain, the elastic modulus of the extensor digitorum was ∼30, ∼40, ∼260, and ∼7500 kPa, at the fiber, fiber bundle, fascicle, and whole muscle levels, respectively. No study to date has measured the whole muscle stiffness of paraspinal muscles. Interestingly, however, it was observed that at the bundle level for humans (Malakoutian, 2021), individual measurements for stiffness varied between 6 kPa to above ∼2,000 kPa.
Measurement of specific tension is less challenging as it may suffice to be measured at the fiber level only (Winters et al., 2011; Noonan et al., 2021), but it has never been done for human paraspinal muscles. The specific tension for human single fibers in muscles tested to date ranges between ∼10 and ∼40
Inclusion of muscle dynamics and force-length properties is more straightforward for optimization-based models using a forward dynamics approach (Erdemir et al., 2007), but it can be done for those using inverse dynamics also, through the addition of further constraints on muscle forces (Happee, 1994). Using the inverse dynamics approach, input kinematics and external forces are used to calculate the moments at each vertebral level. The moment at each level is distributed between the muscles crossing that level commonly through an optimization technique where the sum of muscle forces/stresses to a certain power is minimized. While passive muscle forces are ignored by some models, those including them subtract the passive component of muscle force (generated depending on model position) from the predicted muscle force to obtain the active force component. These active forces should never exceed the maximum force that a given muscle can generate. This maximum active force is dependent on the length of the muscle. For low moment-demand activities (e.g., upright standing), where muscle activations do not approach their maximum, there is little risk of a model predicting a muscle force to exceed its maximum. However, for activities with larger moment demands, not constraining the force values to within their length-dependent maximum could lead to unrealistic predictions (Erdemir et al., 2007). Without knowledge of the in situ sarcomere length for a certain posture, the normalized force-length curve cannot be used appropriately to obtain the length-dependent muscle maximum isometric force (see Supplementary Material S1). Those models that incorporated the force-length curve without knowledge of the in situ sarcomere length had to make assumptions, usually implying that the in situ sarcomere length at a certain neutral posture (supine, prone, or upright standing) for all muscles was the same or equal to the slack length, while recent cadaveric and in vivo studies have revealed large variations for supine/prone in situ sarcomere length between spine muscles, and also that optimal length does not correspond to the passive slack sarcomere length.
For most models of the lumbar spine, the kinematics are an input to the model either from subject-specific vertebral motion measurements (Arjmand and Shirazi-Adl, 2006a; Dehghan-Hamani et al., 2019), or as predefined functions that distribute the overall lumbar spine rotation between the moving vertebrae (Christophy et al., 2012; Bruno et al., 2015; Ignasiak et al., 2016). This approach may not be ideal as the spinal forces and moments have been shown to be highly sensitive to input trajectories (Malakoutian et al., 2016b; Eskandari et al., 2019; Dehghan-Hamani et al., 2019; Byrne et al., 2020). For translation specifically, even an error of 0.1 mm is considered too large (Eskandari et al., 2019), whereas such a level of accuracy is not feasible with the current modalities (Malakoutian et al., 2015). Even models that neglect translation and use a predefined, rhythm-based, function for rotation of the vertebrae have been shown to over-predict the joint forces by up to ∼40% (Byrne et al., 2020). In our model, only the rotation (and not the translation) of the thorax was assigned while the other rigid bodies were allowed to move freely with no predefined function. Therefore, the spinal forces/moments in our model were not affected by subjectivity or inaccuracies of the intervertebral input kinematics.
The IDP in this study was calculated as the sum of the IDP resulting from the compressive force and the IDP from the flexion-extension moment both borne by the FSU. Surprisingly, most studies in the literature only relate the compressive forces to IDP and do not consider the IDP from flexion-extension moments (Schultz et al., 1982; Han et al., 2012; Bruno et al., 2015; Senteler et al., 2016; Ignasiak et al., 2016; Bayoglu et al., 2019). Pure flexion and extension moments applied to FSUs increase the IDP such that a 10 Nm moment leads to an IDP of ∼0.36 MPa in flexion and 0.18 MPa in extension (Heuer et al., 2007a; Wilke et al., 2020). Addition of a compressive load to a pure flexion/extension moment has been shown to result in an IDP equal to the summation of the IDPs from each load when applied separately (Schmidt et al., 2007). In our model for 36° flexion, the contribution of IDP from the sagittal plane moment was 36% of total IDP when baseline muscle parameters were chosen but reached 54% when muscle parameters were changed. Therefore, the predictions of those models that ignore the IDP from flexion-extension moments should be reconsidered particularly for activities simulating a flexed posture.
There were a number of limitations in this study. The load sharing between the intervertebral disc and the posterior elements under a compressive force was considered to be 85% for all postures. However, this value has been shown to vary between postures and to be greater in flexion compared to upright standing or extension (Nachemson, 1960; Ghezelbash et al., 2020). The effect of intra-abdominal pressure was modeled as a single force acting on the thorax (normal to the diaphragm surface), which was a simplification. Mechanical stability of the spine was not considered in our solution method. Inclusion of that criterion leads to co-contraction of abdominal muscles, which most optimization models fail to predict (Hajihosseinali et al., 2014). Although inclusion of the stability criterion results in higher forces for upright standing or other light activities, for heavy work activities or postures like flexion where passive structures are more involved, the inclusion of the stability criterion appears not to make a difference (Stokes and Gardner-Morse, 2001; Dreischarf et al., 2016). Adding the stability criterion to our solution method remains a future step. However, even without such a criterion, it is noteworthy that co-contraction of abdominal muscles was evident in our model, especially when passive properties of more muscles (i.e., beyond multifidus) were varied and changed to shorter slack sarcomere lengths or larger stiffness values.
The validation of the model in this study was limited to symmetric tasks and positions within the sagittal plane. In addition, to explore the influence of variation in muscle properties on IDP only two tasks of upright standing and flexing to 36° were simulated. While such analysis on asymmetric tasks would also be of interest, the two tasks considered for this study clearly demonstrated the significant effect of muscle parameters on predicted spinal loading and hence were sufficient for serving the purpose of this study.
The results of this study highlighted the significance of the muscle force-length curve and the parameters associated with it in the prediction of spinal loading; therefore, motivating future models to incorporate those parameters in their model for more accurate results. The results also encourage further experimental studies for measurement of these parameters in vivo, especially given the reported wide variations in these parameters.
Data Availability Statement
The original contributions presented in the study are included in the article/Supplementary Material; further inquiries can be directed to the corresponding author.
Author Contributions
The study was designed by MM. MM developed the musculoskeletal model, improved its solution methods, and enhanced its validation. CS and SF provided insight and assisted MM in using ArtiSynth software package for development of the model. JS provided the clinical perspective. TO supervised the entire study. TO and SB provided biomechanical and musculoskeletal modeling insight and edited the manuscript.
Funding
This study received support and funding from Medtronic Canada and Natural Sciences and Engineering Research Council of Canada (Grant No. CRDPJ 515076-17).
Conflict of Interest
The authors declare that the research was conducted in the absence of any commercial or financial relationships that could be construed as a potential conflict of interest.
Publisher’s Note
All claims expressed in this article are solely those of the authors and do not necessarily represent those of their affiliated organizations, or those of the publisher, the editors, and the reviewers. Any product that may be evaluated in this article, or claim that may be made by its manufacturer, is not guaranteed or endorsed by the publisher.
Acknowledgments
The authors would like to acknowledge the support and funding received from Medtronic Canada and Natural Sciences and Engineering Research Council of Canada. In addition, the authors wish to thank John Lloyd for his invaluable technical support for using ArtiSynth.
Supplementary Material
The Supplementary Material for this article can be found online at: https://www.frontiersin.org/articles/10.3389/fbioe.2022.852201/full#supplementary-material
References
Arjmand, N., and Shirazi-Adl, A. (2006a). Model and In Vivo Studies on Human Trunk Load Partitioning and Stability in Isometric Forward Flexions. J. Biomechanics 39, 510–521. doi:10.1016/j.jbiomech.2004.11.030
Arjmand, N., and Shirazi-Adl, A. (2006b). Sensitivity of Kinematics-Based Model Predictions to Optimization Criteria in Static Lifting Tasks. Med. Eng. Phys. 28, 504–514. doi:10.1016/j.medengphy.2005.10.001
Bayoglu, R., Galibarov, P. E., Verdonschot, N., Koopman, B., and Homminga, J. (2019). Twente Spine Model: A Thorough Investigation of the Spinal Loads in a Complete and Coherent Musculoskeletal Model of the Human Spine. Med. Eng. Phys. 68, 35–45. doi:10.1016/j.medengphy.2019.03.015
Bayoglu, R., Geeraedts, L., Groenen, K. H. J., Verdonschot, N., Koopman, B., and Homminga, J. (2017). Twente Spine Model: A Complete and Coherent Dataset for Musculo-Skeletal Modeling of the Lumbar Region of the Human Spine. J. Biomechanics 53, 111–119. doi:10.1016/j.jbiomech.2017.01.009
Bresnahan, L., Fessler, R. G., and Natarajan, R. N. (2010). Evaluation of Change in Muscle Activity as a Result of Posterior Lumbar Spine Surgery Using a Dynamic Modeling System. Spine 35, E761–E767. doi:10.1097/BRS.0b013e3181e45a6e
Bruno, A. G., Bouxsein, M. L., and Anderson, D. E. (2015). Development and Validation of a Musculoskeletal Model of the Fully Articulated Thoracolumbar Spine and Rib Cage. J. Biomech. Eng. 137. doi:10.1115/1.4030408
Burkhart, K. A., Bruno, A. G., Bouxsein, M. L., Bean, J. F., and Anderson, D. E. (2018). Estimating Apparent Maximum Muscle Stress of Trunk Extensor Muscles in Older Adults Using Subject-specific Musculoskeletal Models. J. Orthop. Res. 36, 498–505. doi:10.1002/jor.23630
Byrne, R. M., Aiyangar, A. K., and Zhang, X. (2020). Sensitivity of Musculoskeletal Model-Based Lumbar Spinal Loading Estimates to Type of Kinematic Input and Passive Stiffness Properties. J. Biomechanics 102, 109659. doi:10.1016/j.jbiomech.2020.109659
Christophy, M., Faruk Senan, N. A., Lotz, J. C., and O’Reilly, O. M. (2012). A Musculoskeletal Model for the Lumbar Spine. Biomech. Model. Mechanobiol. 11, 19–34. doi:10.1007/s10237-011-0290-6
Colloca, C. J., and Hinrichs, R. N. (2005). The Biomechanical and Clinical Significance of the Lumbar Erector Spinae Flexion-Relaxation Phenomenon: a Review of Literature. J. Manip. Physiological Ther. 28, 623–631. doi:10.1016/j.jmpt.2005.08.005
Cristea, A., Korhonen, M. T., Häkkinen, K., Mero, A., Alén, M., Sipilä, S., et al. (2008). Effects of Combined Strength and Sprint Training on Regulation of Muscle Contraction at the Whole-Muscle and Single-Fibre Levels in Elite Master Sprinters. Acta Physiol. 193, 275–289. doi:10.1111/j.1748-1716.2008.01843.x
Daggfeldt, K., and Thorstensson, A. (2003). The Mechanics of Back-Extensor Torque Production about the Lumbar Spine. J. Biomechanics 36, 815–825. doi:10.1016/S0021-9290(03)00015-0
de Zee, M., Hansen, L., Wong, C., Rasmussen, J., and Simonsen, E. B. (2007). A Generic Detailed Rigid-Body Lumbar Spine Model. J. Biomechanics 40, 1219–1227. doi:10.1016/j.jbiomech.2006.05.030
Dehghan‐Hamani, I., Arjmand, N., and Shirazi‐Adl, A. (2019). Subject‐specific Loads on the Lumbar Spine in Detailed Finite Element Models Scaled Geometrically and Kinematic‐driven by Radiography Images. Int. J. Numer. Meth Biomed. Engng 35, e3182. doi:10.1002/cnm.3182
Delp, S. L., Suryanarayanan, S., Murray, W. M., Uhlir, J., and Triolo, R. J. (2001). Architecture of the Rectus Abdominis, Quadratus Lumborum, and Erector Spinae. J. Biomechanics 34, 371–375. doi:10.1016/S0021-9290(00)00202-5
Dreischarf, M., Rohlmann, A., Zhu, R., Schmidt, H., and Zander, T. (2013). Is it Possible to Estimate the Compressive Force in the Lumbar Spine from Intradiscal Pressure Measurements? A Finite Element Evaluation. Med. Eng. Phys. 35, 1385–1390. doi:10.1016/j.medengphy.2013.03.007
Dreischarf, M., Shirazi-Adl, A., Arjmand, N., Rohlmann, A., and Schmidt, H. (2016). Estimation of Loads on Human Lumbar Spine: A Review of In Vivo and Computational Model Studies. J. Biomechanics 49, 833–845. doi:10.1016/j.jbiomech.2015.12.038
Erdemir, A., McLean, S., Herzog, W., and van den Bogert, A. J. (2007). Model-based Estimation of Muscle Forces Exerted during Movements. Clin. Biomech. 22, 131–154. doi:10.1016/j.clinbiomech.2006.09.005
Eskandari, A. H., Arjmand, N., Shirazi-Adl, A., and Farahmand, F. (2019). Hypersensitivity of Trunk Biomechanical Model Predictions to Errors in Image-Based Kinematics when Using Fully Displacement-Control Techniques. J. Biomechanics 84, 161–171. doi:10.1016/j.jbiomech.2018.12.043
Frei, H., Oxland, T. R., Rathonyi, G. C., and Nolte, L.-P. (2001). The Effect of Nucleotomy on Lumbar Spine Mechanics in Compression and Shear Loading. Spine 26, 2080–2089. doi:10.1097/00007632-200110010-00007
Gardner-Morse, M. G., and Stokes, I. A. F. (2004). Structural Behavior of Human Lumbar Spinal Motion Segments. J. Biomechanics 37, 205–212. doi:10.1016/j.jbiomech.2003.10.003
Ghezelbash, F., Schmidt, H., Shirazi-Adl, A., and El-Rich, M. (2020). Internal Load-Sharing in the Human Passive Lumbar Spine: Review of In Vitro and Finite Element Model Studies. J. Biomechanics 102, 109441. doi:10.1016/j.jbiomech.2019.109441
Goubert, D., De Pauw, R., Meeus, M., Willems, T., Cagnie, B., Schouppe, S., et al. (2017). Lumbar Muscle Structure and Function in Chronic versus Recurrent Low Back Pain: a Cross-Sectional Study. Spine J. 17, 1285–1296. doi:10.1016/j.spinee.2017.04.025
Hajihosseinali, M., Arjmand, N., Shirazi-Adl, A., Farahmand, F., and Ghiasi, M. S. (2014). A Novel Stability and Kinematics-Driven Trunk Biomechanical Model to Estimate Muscle and Spinal Forces. Med. Eng. Phys. 36, 1296–1304. doi:10.1016/j.medengphy.2014.07.009
Han, K.-S., Zander, T., Taylor, W. R., and Rohlmann, A. (2012). An Enhanced and Validated Generic Thoraco-Lumbar Spine Model for Prediction of Muscle Forces. Med. Eng. Phys. 34, 709–716. doi:10.1016/j.medengphy.2011.09.014
Happee, R. (1994). Inverse Dynamic Optimization Including Muscular Dynamics, a New Simulation Method Applied to Goal Directed Movements. J. Biomechanics 27, 953–960. doi:10.1016/0021-9290(94)90267-4
Heuer, F., Schmidt, H., Claes, L., and Wilke, H.-J. (2007a). Stepwise Reduction of Functional Spinal Structures Increase Vertebral Translation and Intradiscal Pressure. J. Biomechanics 40, 795–803. doi:10.1016/j.jbiomech.2006.03.016
Heuer, F., Schmidt, H., Klezl, Z., Claes, L., and Wilke, H.-J. (2007b). Stepwise Reduction of Functional Spinal Structures Increase Range of Motion and Change Lordosis Angle. J. Biomechanics 40, 271–280. doi:10.1016/j.jbiomech.2006.01.007
Holzbaur, K. R. S., Murray, W. M., and Delp, S. L. (2005). A Model of the Upper Extremity for Simulating Musculoskeletal Surgery and Analyzing Neuromuscular Control. Ann. Biomed. Eng. 33, 829–840. doi:10.1007/s10439-005-3320-7
Ignasiak, D., Dendorfer, S., and Ferguson, S. J. (2016). Thoracolumbar Spine Model with Articulated Ribcage for the Prediction of Dynamic Spinal Loading. J. Biomechanics 49, 959–966. doi:10.1016/j.jbiomech.2015.10.010
Jamshidnejad, S., and Arjmand, N. (2015). Variations in Trunk Muscle Activities and Spinal Loads Following Posterior Lumbar Surgery: A Combined In Vivo and Modeling Investigation. Clin. Biomech. 30, 1036–1042. doi:10.1016/j.clinbiomech.2015.09.010
Kim, J. Y., Ryu, D. S., Paik, H. K., Ahn, S. S., Kang, M. S., Kim, K. H., et al. (2016). Paraspinal Muscle, Facet Joint, and Disc Problems: Risk Factors for Adjacent Segment Degeneration after Lumbar Fusion. Spine J. 16, 867–875. doi:10.1016/j.spinee.2016.03.010
Lieber, R. L., Runesson, E., Einarsson, F., and Fridén, J. (2003). Inferior Mechanical Properties of Spastic Muscle Bundles Due to Hypertrophic but Compromised Extracellular Matrix Material. Muscle Nerve 28, 464–471. doi:10.1002/mus.10446
Lloyd, J. E., Stavness, I., and Fels, S. (2012). “ArtiSynth: A Fast Interactive Biomechanical Modeling Toolkit Combining Multibody and Finite Element Simulation,” in Soft Tissue Biomechanical Modeling for Computer Assisted Surgery (Springer), 355–394. doi:10.1007/8415_2012_126
Luden, N., Minchev, K., Hayes, E., Louis, E., Trappe, T., and Trappe, S. (2008). Human Vastus Lateralis and Soleus Muscles Display Divergent Cellular Contractile Properties. Am. J. Physiology-Regulatory, Integr. Comp. Physiology 295, R1593–R1598. doi:10.1152/ajpregu.90564.2008
Malakoutian, M. (2021). Biomechanical Properties of Paraspinal Muscles and Their Influence on Spinal Loading - an Experimental and Computational Investigation. PhD Thesis, Univ. of British Columbia. doi:10.14288/1.0398230
Malakoutian, M. (2014). Degeneration and Mechanics of the Segment Adjacent to a Lumbar Spine Fusion : a Biomechanical Analysis. MASc. Thesis. Univ. of British Columbia. doi:10.14288/1.0165948
Malakoutian, M., Street, J., Wilke, H.-J., Stavness, I., Dvorak, M., Fels, S., et al. (2016a). Role of Muscle Damage on Loading at the Level Adjacent to a Lumbar Spine Fusion: a Biomechanical Analysis. Eur. Spine J. 25, 2929–2937. doi:10.1007/s00586-016-4686-y
Malakoutian, M., Street, J., Wilke, H.-J., Stavness, I., Fels, S., and Oxland, T. (2016b). A Musculoskeletal Model of the Lumbar Spine Using ArtiSynth - Development and Validation. Comput. Methods Biomechanics Biomed. Eng. Imaging & Vis. 6, 483–490. doi:10.1080/21681163.2016.1187087
Malakoutian, M., Volkheimer, D., Street, J., Dvorak, M. F., Wilke, H.-J., and Oxland, T. R. (2015). Do In Vivo Kinematic Studies Provide Insight into Adjacent Segment Degeneration? A Qualitative Systematic Literature Review. Eur. Spine J. 24, 1865–1881. doi:10.1007/s00586-015-3992-0
Mannion, A. F. (1999). Fibre Type Characteristics and Function of the Human Paraspinal Muscles: Normal Values and Changes in Association with Low Back Pain. J. Electromyogr. Kinesiol. 9, 363–377. doi:10.1016/S1050-6411(99)00010-3
Masaki, M., Aoyama, T., Murakami, T., Yanase, K., Ji, X., Tateuchi, H., et al. (2017). Association of Low Back Pain with Muscle Stiffness and Muscle Mass of the Lumbar Back Muscles, and Sagittal Spinal Alignment in Young and Middle-Aged Medical Workers. Clin. Biomech. 49, 128–133. doi:10.1016/j.clinbiomech.2017.09.008
McGill, S. M., Yingling, V. R., and Peach, J. P. (1999). Three-dimensional Kinematics and Trunk Muscle Myoelectric Activity in the Elderly Spine - A Database Compared to Young People. Clin. Biomech. 14, 389–395. doi:10.1016/S0268-0033(98)00111-9
Millard, M., Uchida, T., Seth, A., and Delp, S. L. (2013). Flexing Computational Muscle: Modeling and Simulation of Musculotendon Dynamics. J. Biomech. Eng. 135, 21005. doi:10.1115/1.4023390
Nachemson, A. (1960). Lumbar Intradiscal Pressure: Experimental Studies on Post-Mortem Material. Acta Orthop. Scand. 31, 1–104. doi:10.3109/ort.1960.31.suppl-43.01
Nicolaisen, T., and Jørgensen, K. (1985). Trunk Strength, Back Muscle Endurance and Low-Back Trouble. Scand. J. Rehabil. Med. 17, 121–127. doi:10.1016/0268-0033(86)90118-x
Noonan, A. M., Séguin, C. A., and Brown, S. H. M. (2020). Paraspinal Muscle Contractile Function Is Impaired in the ENT1 Deficient Mouse Model of Progressive Spine Pathology. Spine (Phila. pa., E710–E718. doi:10.1097/BRS.0000000000003882
Peach, J. P., Sutarno, C. G., and McGill, S. M. (1998). Three-dimensional Kinematics and Trunk Muscle Myoelectric Activity in the Young Lumbar Spine: A Database. Archives Phys. Med. Rehabilitation 79, 663–669. doi:10.1016/S0003-9993(98)90041-7
Roghani, T., Zavieh, M. K., Manshadi, F. D., King, N., and Katzman, W. (2017). Age-related Hyperkyphosis: Update of its Potential Causes and Clinical Impacts-Narrative Review. Aging Clin. Exp. Res. 29, 567–577. doi:10.1007/s40520-016-0617-3
Sagl, B., Dickerson, C. R., and Stavness, I. (2019). Fast Forward-Dynamics Tracking Simulation: Application to Upper Limb and Shoulder Modeling. IEEE Trans. Biomed. Eng. 66, 335–342. doi:10.1109/TBME.2018.2838020
Sanchez, G. N., Sinha, S., Liske, H., Chen, X., Nguyen, V., Delp, S. L., et al. (2015). In Vivo Imaging of Human Sarcomere Twitch Dynamics in Individual Motor Units. Neuron 88, 1109–1120. doi:10.1016/j.neuron.2015.11.022
Schmidt, H., Kettler, A., Heuer, F., Simon, U., Claes, L., and Wilke, H.-J. (2007). Intradiscal Pressure, Shear Strain, and Fiber Strain in the Intervertebral Disc under Combined Loading. Spine 32, 748–755. doi:10.1097/01.brs.0000259059.90430.c2
Schultz, A., Andersson, G., Ortengren, R., Haderspeck, K., and Nachemson, A. (1982). Loads on the Lumbar Spine. Validation of a Biomechanical Analysis by Measurements of Intradiscal Pressures and Myoelectric Signals. J. Bone & Jt. Surg. 64, 713–720. doi:10.2106/00004623-198264050-00008
Senteler, M., Weisse, B., Rothenfluh, D. A., and Snedeker, J. G. (2016). Intervertebral Reaction Force Prediction Using an Enhanced Assembly of OpenSim Models. Comput. Methods Biomechanics Biomed. Eng. 19, 538–548. doi:10.1080/10255842.2015.1043906
Sinaki, M., Itoi, E., Rogers, J. W., Bergstralh, E. J., and Wahner, H. W. (1996). Correlation of Back Extensor Strength with Thoracic Kyphosis and Lumbar Lordosis in Estrogen-Deficient Women1. Am. J. Phys. Med. Rehabilitation 75, 370–374. doi:10.1097/00002060-199609000-00013
Smith, L. R., Lee, K. S., Ward, S. R., Chambers, H. G., and Lieber, R. L. (2011). Hamstring Contractures in Children with Spastic Cerebral Palsy Result from a Stiffer Extracellular Matrix and Increasedin Vivosarcomere Length. J. Physiol. 589, 2625–2639. doi:10.1113/jphysiol.2010.203364
Stokes, I. A. F., and Gardner-Morse, M. (2001). Lumbar Spinal Muscle Activation Synergies Predicted by Multi-Criteria Cost Function. J. Biomechanics 34, 733–740. doi:10.1016/S0021-9290(01)00034-3
Van Dieën, J. H., and Kingma, I. (1999). Total Trunk Muscle Force and Spinal Compression Are Lower in Asymmetric Moments as Compared to Pure Extension Moments. J. Biomech. 32, 681–687. doi:10.1016/S0021-9290(99)00044-5
Ward, S. R., Eng, C. M., Smallwood, L. H., and Lieber, R. L. (2009a). Are Current Measurements of Lower Extremity Muscle Architecture Accurate? Clin. Orthop. Relat. Res. 467, 1074–1082. doi:10.1007/s11999-008-0594-8
Ward, S. R., Kim, C. W., Eng, C. M., Gottschalk, L. J., Tomiya, A., Garfin, S. R., et al. (2009b). Architectural Analysis and Intraoperative Measurements Demonstrate the Unique Design of the Multifidus Muscle for Lumbar Spine Stability. J. Bone Jt. Surgery-American Volume 91, 176–185. doi:10.2106/JBJS.G.01311
Ward, S. R., Tomiya, A., Regev, G. J., Thacker, B. E., Benzl, R. C., Kim, C. W., et al. (2009c). Passive Mechanical Properties of the Lumbar Multifidus Muscle Support its Role as a Stabilizer. J. Biomechanics 42, 1384–1389. doi:10.1016/j.jbiomech.2008.09.042
Ward, S. R., Winters, T. M., O’Connor, S. M., and Lieber, R. L. (2020). Non-linear Scaling of Passive Mechanical Properties in Fibers, Bundles, Fascicles and Whole Rabbit Muscles. Front. Physiol. 11, 211. doi:10.3389/fphys.2020.00211
Wilke, H.-J., Herkommer, A., Werner, K., and Liebsch, C. (2020). In Vitro Analysis of the Intradiscal Pressure of the Thoracic Spine. Front. Bioeng. Biotechnol. 8, 614. doi:10.3389/fbioe.2020.00614
Wilke, H.-J., Neef, P., Hinz, B., Seidel, H., and Claes, L. (2001). Intradiscal Pressure Together with Anthropometric Data - A Data Set for the Validation of Models. Clin. Biomech. 16, S111–S126. doi:10.1016/s0268-0033(00)00103-0
Winters, T. M., Takahashi, M., Lieber, R. L., and Ward, S. R. (2011). Whole Muscle Length-Tension Relationships Are Accurately Modeled as Scaled Sarcomeres in Rabbit Hindlimb Muscles. J. Biomechanics 44, 109–115. doi:10.1016/j.jbiomech.2010.08.033
Keywords: musculoskeletal model, lumbar spine, biomechanics, intradiscal pressure, muscle, sarcomere, passive stiffness
Citation: Malakoutian M, Sanchez CA, Brown SHM, Street J, Fels S and Oxland TR (2022) Biomechanical Properties of Paraspinal Muscles Influence Spinal Loading—A Musculoskeletal Simulation Study. Front. Bioeng. Biotechnol. 10:852201. doi: 10.3389/fbioe.2022.852201
Received: 10 January 2022; Accepted: 15 April 2022;
Published: 02 June 2022.
Edited by:
Marwan El-Rich, Khalifa University, United Arab EmiratesReviewed by:
Dominika Ignasiak, ETH Zürich, SwitzerlandTito Bassani, Galeazzi Orthopedic Institute (IRCCS), Italy
Copyright © 2022 Malakoutian, Sanchez, Brown, Street, Fels and Oxland. This is an open-access article distributed under the terms of the Creative Commons Attribution License (CC BY). The use, distribution or reproduction in other forums is permitted, provided the original author(s) and the copyright owner(s) are credited and that the original publication in this journal is cited, in accordance with accepted academic practice. No use, distribution or reproduction is permitted which does not comply with these terms.
*Correspondence: Thomas R. Oxland, dG94bGFuZEBtYWlsLnViYy5jYQ==
 Masoud Malakoutian
 C. Antonio Sanchez3
 Stephen H. M. Brown
 John Street
 Sidney Fels
 Thomas R. Oxland