 Swe Soe Maung Ye
 Sangho Kim
- Department of Biomedical Engineering, National University of Singapore, Singapore, Singapore
Red blood cells (RBCs) clump together under low flow conditions in a process called RBC aggregation, which can alter RBC perfusion in a microvascular network. As elevated RBC aggregation is commonly associated with cardiovascular and inflammatory diseases, a better understanding of aggregation is essential. Unlike RBC aggregation in polymer solutions which can be well explained by polymer depletion theory, plasma-mediated RBC aggregation has features that best match explanations with cross-bridging mechanisms. Previous studies have demonstrated the dominant role of fibrinogen (Fg) in promoting aggregate formation and recent cell-force spectroscopy (CFS) experiments on interacting RBC doublets in plasma have reported an inverse relationship between disaggregation force and the adhesive contact area between RBCs. This has led investigators to revisit the hypothesis of inter-RBC cross-bridging which involves cross-bridge migration under interfacial tension during the forced disaggregation of RBC aggregates. In this study, we developed the cross-bridge migration model (CBMM) in plasma that mechanistically represents the migrating cross-bridge hypothesis. Transport of mobile Fg cross-bridges (mFg) was calculated using a convection-diffusion transport equation with our novel introduction of convective cross-bridge drift that arises due to intercellular friction. By parametrically transforming the diffusivity of mFg in the CBMM, we were able to match experimental observations of both RBC doublet formation kinematics and RBC doublet disaggregation forces under optical tweezers tension. We found that non-specific cross-bridging promotes spontaneous growth of adhesion area between RBC doublets whereas specific cross-bridging tends to prevent adhesion area growth. Our CBMM was also able to correlate Fg concentration shifts from healthy population blood plasma to SLE (lupus) condition blood plasma with the observed increase in doublet disaggregation forces for the RBC doublets in SLE plasma.
Introduction
An important feature of red blood cells (RBCs) in micro-hemorheology is their tendency to clump into tightly packed clusters under low flow conditions. This reversible adhesion state where cluster formation is balanced by shear-induced dispersion between RBCs is defined as RBC aggregation (Fåhraeus, 1929; Schmid-Schonbein et al., 1968; Somer and Meiselman, 1993). Through collective resistance of aggregate clusters against flow, increased hematocrit partitioning asymmetry at pre-capillary bifurcations (Yin et al., 2013) can reduce effective perfusion of RBCs in capillary and venular networks (Kim et al., 2006; Namgung et al., 2015). Furthermore, RBC aggregation may promote fluid extravasation in capillaries (Knisely et al., 1947) by increasing blood viscosity and pressure in post-capillary regions (Somer and Meiselman, 1993; Johnson et al., 1999; Fedosov et al., 2011b). In pathology, elevated RBC aggregation (hyper-aggregation) is a commonly reported condition in patients suffering from cardiovascular disease (Lee et al., 2007; Arbel et al., 2012), inflammatory disease (Ami et al., 2001), diabetes (van Haeringen et al., 1973; Schmid-Schonbein and Volger, 1976) and hypertension (Lominadze et al., 1998). Hyper-aggregation is also a predictor for fatal complications in the post-surgery management of myocardial infarction (Sargento et al., 2005). As such, the pathophysiological impact of RBC aggregation is significant. Clinical interventions for arresting hyper-aggregation and its compounding effect on circulatory disorders may benefit from a deeper understanding of the fundamental mechanisms separating benign aggregation from hyper-aggregation.
RBC aggregation is mediated by hydrodynamic factors such as shear stress which inhibit stable aggregate formation (Schmid-Schonbein et al., 1968; Ami et al., 2001) and the local hematocrit for which aggregation rate has been found to occur optimally at physiological hematocrits (Deng et al., 1994). Plasma and suspension factors also influence aggregation through cross-bridging or depletion interactions arising from macromolecules in the suspending medium and their interactions with the RBC surface (Ami et al., 2001; Neu and Meiselman, 2002; Lee et al., 2016b). In this regard, one trend in the development of mechanistic models of RBC aggregation has been focused on depletion theory. Depletion theory for RBC aggregation suggests that a polymer chemical potential (osmotic pressure gradient) is established between the polymer-poor depletion zone on the RBC surface and the surrounding polymer-rich bulk solution. The resulting expulsion of water from the intercellular gap gives rise to an attractive force between cells which is balanced against the intercellular electrostatic repulsion at nanometer separation distances (Neu and Meiselman, 2002). The depletion model for RBC aggregation has been extensively developed to include effects of the glycocalyx structure (Rad et al., 2014), solution isotonicity and RBC aging (Neu et al., 2003), and polymer molecular weight (Rad et al., 2009). Consequently, the depletion model for RBC aggregation forms the basis of RBC aggregation induction in microrheological experiments using polymer simulants like dextran in phosphate buffered saline (PBS) solution.
Unlike polymer simulants however, RBC aggregation in blood plasma may not be dominated by depletion mechanics. Indeed, one study has highlighted that while RBC aggregation readily occurs between two RBCs in blood plasma, RBCs in PBS suspensions containing only physiological concentrations of Fibrinogen (Fg) and Albumin (Alb) do not form stable aggregates (Lee et al., 2016b). Another study examining the erythrocyte sedimentation rate (ESR) of RBC populations in various permutations of blood plasma constituents concluded that cooperativity between Fg, Alb and immunoglobins in plasma was required for physiological levels of aggregation to occur. Plasma with Alb alone or in binary solution with dextran actually inhibited aggregation (Reinhart and Nagy, 1995). Hence these phenomena in plasma variants cannot be explained by depletion theory alone.
Contrary to the effort in developing depletion models of RBC aggregation, researchers for cross-bridging theory have instead focused on experimental verification of possible cross-bridging mechanisms and forces. Supporting specific cross-bridging are observations that Fg can specifically bind with receptors on the RBC (Lominadze and Dean, 2002; De Oliveira et al., 2012; Sokolova et al., 2014) and also specifically bind to other Fg with bond strengths up to 10 pN (Litvinov et al., 2007). Conversely many studies support non-specific bridging interactions to be primary coordinators of RBC aggregation in plasma. Firstly, Fg receptors are too sparsely distributed to be primary coordinators of physiological aggregation (Lominadze and Dean, 2002). Secondly, Fg to RBC specific bonds (FgR) are 20–80 pN strong (Carvalho et al., 2010; Carvalho et al., 2011) and this exceeds the ∼30 pN disaggregation forces measured in plasma-suspended RBC aggregates (Khokhlova et al., 2012; Lee et al., 2016b). While these findings give piecemeal insight into Fg physiochemistry on the RBC surface, there has been no coordinated effort to update the cross-bridge model of RBC aggregation based on a holistic debate about these findings.
Recently, cell force spectroscopy (CFS) techniques have developed a deeper mechanistic understanding of doublet-level aggregation through measurement of the forces of disaggregation under varying stress application scenarios and suspending media constituents (Bronkhorst et al., 1997; Khokhlova et al., 2012; Steffen et al., 2013; Lee et al., 2016a; Lee et al., 2016b; Lee et al., 2017). In addition to quantifying the dominant contribution of Fg in promoting RBC aggregation (Lee et al., 2016a), CFS studies on RBC doublet disaggregation have reported an increase in adhesive force between RBCs despite the gradual loss of contact area when a doublet is forcibly sheared apart (Khokhlova et al., 2012; Lee et al., 2016b). This phenomenon cannot be explained by depletion theory or existing models of cross-bridge induced RBC aggregation. The authors of (Lee et al., 2016a) have hypothesized that RBC doublet disaggregation in plasma may pull cross-bridge tethers towards the doublet contact regions via membrane elastic tension, similar to a T-cell and target cell adhesion scenario (Tozeren et al., 1989). Instead, in this work, we propose that intercellular friction causes weakly interacting mobile Fg bridges on RBC surfaces to drift in the direction of intercellular friction. Accordingly, we have developed a tunable cross-bridge migration model (CBMM) of RBC aggregation in plasma that mechanistically elucidates the necessary conditions and assumptions for the migrating cross-bridge hypothesis. This model was tuned to directly match 1) aggregate formation kinematics in and doublet formation experiments and 2) doublet disaggregation forces measured in CFS experiments.
Materials and methods
To study the interfacial forces mediating inter-RBC adhesion in plasma-mediated RBC aggregation, we performed numerical simulations of a two-cell RBC doublet system under doublet formation and forced disaggregation scenarios. The construction of the numerical model entails the RBC deformation model with the coarse-grained particle model of the RBC membrane, the adhesion potential and intercellular friction model for inter-RBC interaction and development of the cross-bridge migration model for adhesion potential modulation in the interface dynamics.
Adhesion force schemes for specific and non-specific cross-bridges
We have focused our attention on Fg as the key aggregation-inducing protein due to its dominant role in mediating the speed and mechanism of RBC aggregate formation in blood plasma (Maeda et al., 1987; Lee et al., 2016a). Collating the literature on possible Fg-interactions in the plasma scenario, we summarized three types of possible Fg-based cross bridges in Figure 1A,B. The first, iFgRB is a specific cross-bridging generalization that encompasses three subtypes: FgR2 cross-bridge, where Fg is specifically bound to two receptors from pairing RBCs (Figure 1Bi); FgR-FgR cross-bridge where two receptor bound Fg (FgR) from pairing RBCs bind to one another at specific Fg domains (Figure 1Bii); and the FgR-Fg-FgR cross-bridge is a specific binding between non-receptor-bound Fg and two FgR to form a multi-Fg cross-bridging complex (Figure 1Biii). The immobile non-specific iFgB is a cross-bridge which involves non-specific and weak interactions between FgR and Fg-associating glycocalyx surface groups (glyc) on the neighboring RBC surface (Figure 1Biv). The mFgB cross-bridges are weak mobile cross-bridges (FgR-mFg-FgR, glyc-mFg-glyc, FgR-mFg-glyc) in the form of mFg weakly associating with FgR and glyc (Figure 1Bv). Please note that in our consideration, only mFgB cross-bridges are mobile.
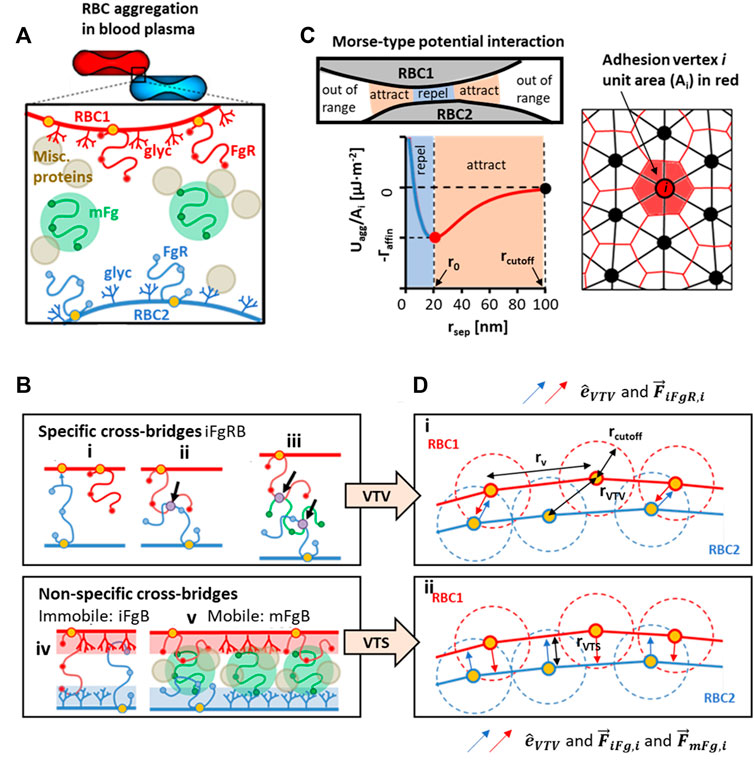
FIGURE 1. Conceptualization and modeled representation of cross-bridging possibilities in RBC aggregation. (A) Contributors to plasma-mediated RBC aggregation is likely to require cooperativity between receptor-bound Fg (FgR), surface adsorbed Fg (mFg) and other plasma proteins and factors. (B) Schematics of possible Fg to RBC surface interactions that can categorically be summarized into specific cross-bridges (iFgRB) and non-specific cross-bridges that are immobile (iFgB) and mobile (mFgB). (C) The Morse-type potential model used for calculating interaction energy at adhesion vertices and the median-dual area element around vertex i used to calculate local adhesion area (D) i)The specific interaction scenarios in Ci, Cii , Ciii are represented by the vertex-to-vertex (VTV) scheme. ii) The non-specific bridging scenarios in Civ and Cv are represented by the vertex-to-surface (VTS) scheme for distance and force calculation.
For the aggregation model construction, we begin with the Morse-type potential model (MP) (Liu and Liu, 2006):
where
We recast the MP (Eq. 1) for mechanistic representation of three general categories of cross-bridging in the cross-bridge migration model (CBMM). Affinity contribution from iFgRB immobile specific cross-bridges is given by
where
Forces of aggregation arising from the three different cross-bridges are as follows:
Note that we see the different application of direction vectors
Mobile cross-bridge transport in the cross-bridge migration model
The distribution of
where
where
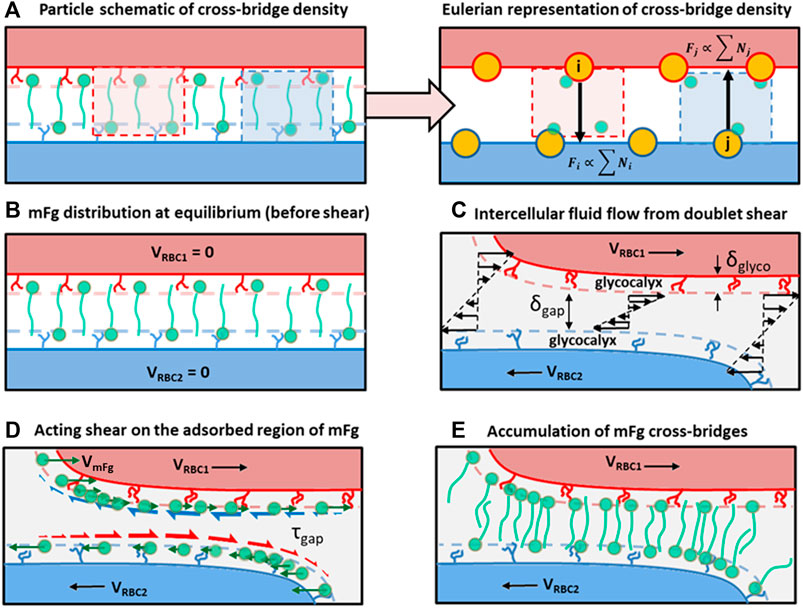
FIGURE 2. Schematics of the cross-bridge migration model (CBMM) and its conceptual development. (A) A particle to Eulerian depiction of the cross-bridge density represented at the adhesion vertices. (B) Homogenous distribution of cross-bridges at the adhesion interface at doublet formation equilibrium, which represents the initial condition in our doublet formation/disaggregation simulations. (C) Intercellular Couette flow that develops due to the applied displacement on RBCs in the doublet. (D) Shear stress acting on adsorbed regions of mFg causing relative velocity drift between mFg and the RBC surface adsorbing mFg. Green arrows represent the mFg velocity that deviates from RBC velocity due to friction. Red half arrows represent the frictional drag force acting on mFg adsorbed on RBC2 surface. Blue half arrows represent the frictional drag force acting on mFg adsorbed on RBC1 surface. (E) The resulting cross-bridge accumulation in the intercellular adhesion region from weak association between the non-adsorbed mFg tails and pairing RBC surfaces.
We also considered the effect of normal fluxes contributing to surface concentration of adsorbed Fg through the
where
Intercellular friction model
To study the role of intercellular friction in aggregation mechanics, we defined a vertex to surface friction level which was mediated in our friction model by the intercellular gap plasma viscosity (
where
Viscoelastic RBC model
For representation of RBC deformation mechanics, we employed the coarse-grained particle model (CGPM) developed by (Pivkin and Karniadakis, 2008; Fedosov et al., 2010). Membrane strain energy in the CGPM was calculated on a triangular surface mesh where constitutive expressions for areal deformation energy
where
In addition to the internal elastic forces, the rate of RBC deformation was modulated by the membrane viscosity. Membrane viscosity was represented by the dissipative particle formulation (Allen and Tildesley, 1987; Español, 1998; Fedosov et al., 2010):
where
Displacement of RBC mesh vertices was performed according to Newton’s second law motion:
where
The simulation parameters defining RBC deformability are summarized in Table 1.
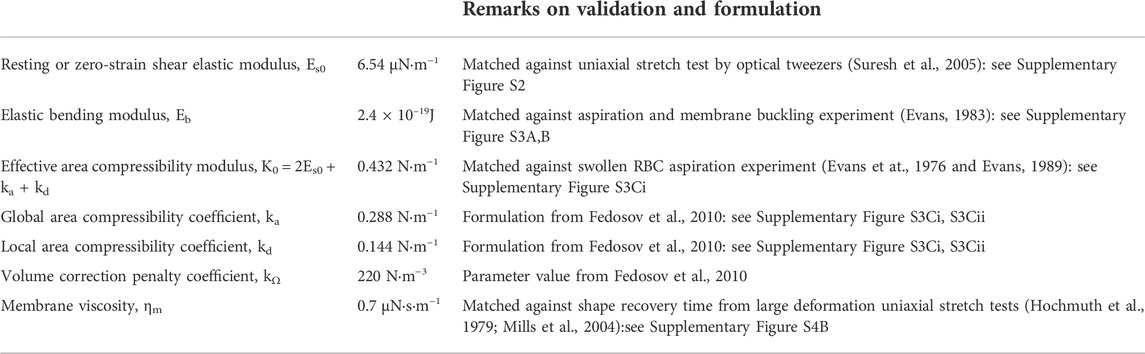
TABLE 1. Mechanical properties of the RBC employed in simulation models.
Results and discussion
Following the construction of the CBMM and the UAM, we performed two types of simulations to study 1) the mechanics of cross-bridge types in RBC doublet formation and 2) the role of cross-bridge migration in doublet disaggregation. The sequence of procedures for these two simulations is summarized in Figure 3.
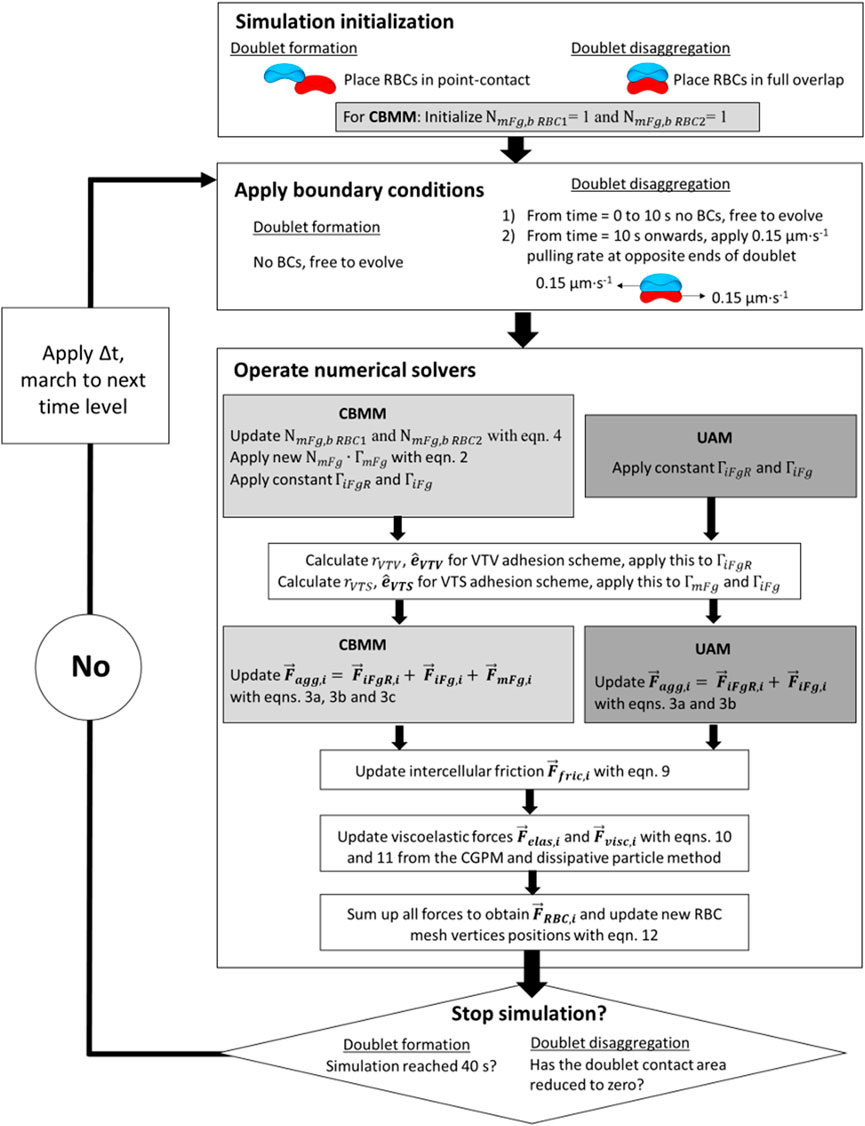
FIGURE 3. Block diagram for flow of simulation procedures in the aggregate formation simulations and doublet disaggregation simulations.
Role of cross-bridge adhesion scheme and intercellular friction in modulating adhesion area for RBC doublet formation
At the two-cell aggregate (doublet) level, doublet formation in plasma undergoes three distinct phases of organization: the initial local contact phase, sliding phase of rapid contact area growth and the final creeping phase of slow contact growth (Dunlop et al., 1984). In reconstituted media containing only Fg and Alb, doublet formation under zero-flow conditions exhibited only the local contact phase (Lee et al., 2016b). We examined the case of adhesive contact area growth between initially point-contacted RBC pairs, in order to describe the cross-bridge scenarios that best match the kinematics observed in experiments (Dunlop et al., 1984; Khokhlova et al., 2012) and provide a mechanistic explanation of the plasma-constituent dependent aggregation. For this, we performed 5 groups of doublet formation simulations employing different permutations of the adhesion scheme. Each group employed three levels of total affinity
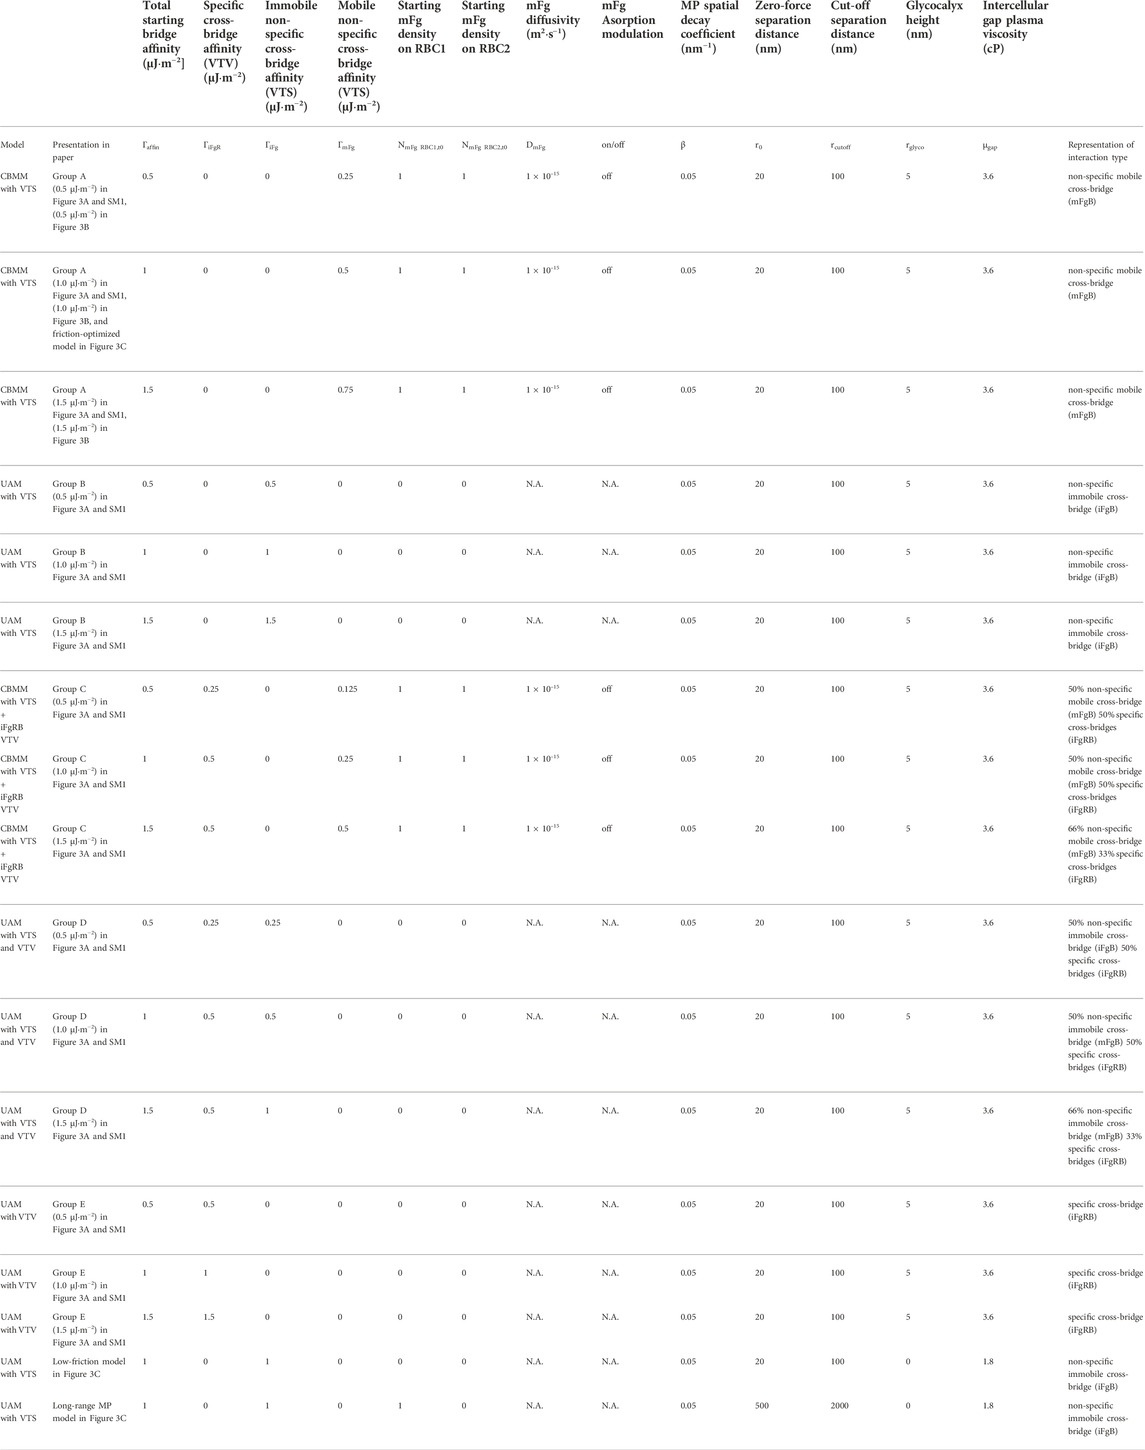
TABLE 2. Simulation parameters for doublet formation simulations.
Figure 4A shows the results of our doublet formation models for the 5 groups (simulation movie of this result can be seen in SM1). Groups employing any permutation of the VTV scheme saw strong adhesive locking where the conjugation of pairing adhesion vertices between the two cells restricted further locomotion between RBCs. Consequently, groups C, D and E displayed no spontaneous increase in the cell overlap area beyond the initial point contact. The failure to generate spontaneous adhesion area growth from VTV arose due to the distance between adhesion vertices (receptors) naturally exceeding the
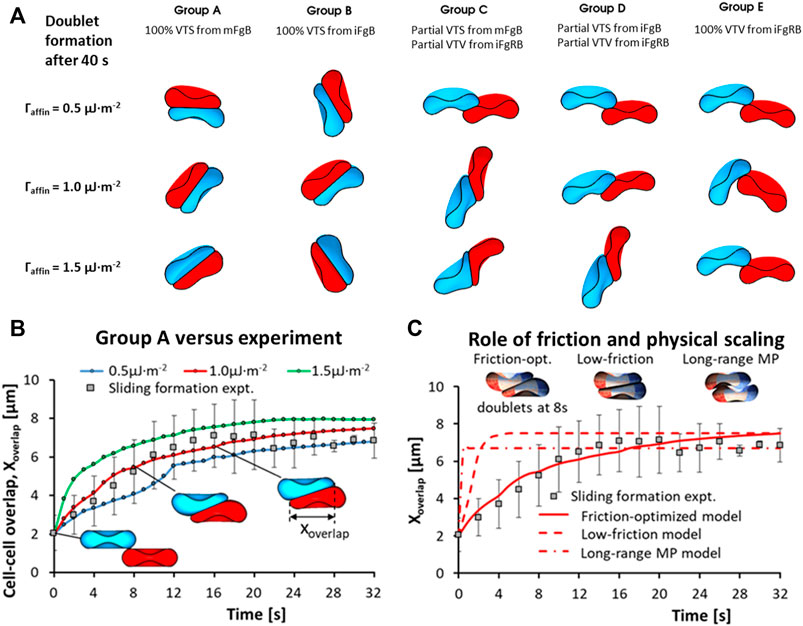
FIGURE 4. RBC-doublet formation kinematics simulations. (A) Simulation results of the doublet formation equilibrium at 40 s after initial point contact, under various adhesion affinity
In contrast to Groups C to E, Groups A and B with pure VTS schemes showed the sliding and creeping stages of doublet contact area increase. Essentially, the VTS results matched the experimental doublet formation kinematics in plasma where sliding and adhesion contact area increase has been observed (Khokhlova et al., 2012). It may be that the presence of other blood proteins in plasma appears to shift the dominant cross-bridging mechanism towards weaker non-specific cross-bridging mechanisms. In summary, non-specific interactions iFgB and mFgB were found to promote spontaneous adhesion area growth during doublet formation.
Next, we studied the role of intercellular friction which was mediated in our RBC interaction simulation by the intercellular gap plasma viscosity (
A full description of simulation parameters for the models studying frictional effects on doublet formation kinematics can be found in Table 2.
Conditional validity of the cross-bridge migration hypothesis for RBC doublet disaggregation in plasma
In the preceding results section, we demonstrated the VTS scheme representing iFgB and mFgB to be more representative of RBC doublet formation kinematics in blood plasma and from here on we only employ the VTS. Here, we will discuss the parametric optimization required for the cross-bridge migration model (CBMM) to support experiment. We will also highlight the deficiencies of the uniform affinity model (UAM) that lacks the critical adhesion strength modulation feature required to match experiments. To compare the two models, we followed the experimental protocol for doublet disaggregation with optical tweezers (OT) where the distal ends of each RBC were displaced in opposite directions at a fixed rate of 0.15 μm∙s−1. The simulated trap tension to doublet displacement profile was compared against the tension-displacement behavior in the OT experiment prior to trap escape tension at 29 ± 3 pN. The mechanics of doublet disaggregation in the OT experiment can be understood as a force-balance between the component of adhesion force,
Doublet disaggregation simulations employing the UAM (see simulation movie in SM4) obtained disaggregation force trends that were a poor match with the empirical results (Khokhlova et al., 2012). A consistent two-stage trend was observed in the force-displacement curve in the UAM performed with
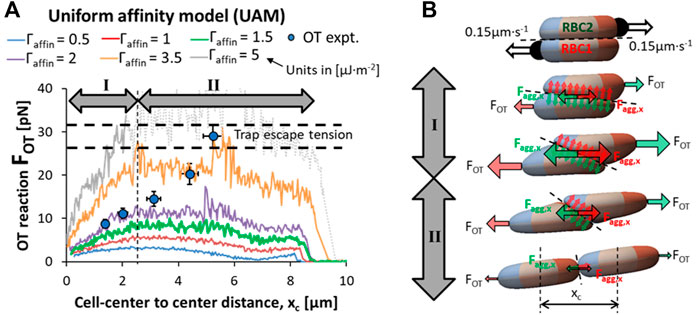
FIGURE 5. Failure of the UAM to recapitulate optical tweezers (OT) experiment results. (A) Comparison of the force-displacement response in OT-driven doublet disaggregation predicted by the uniform affinity model (UAM) against the experimental results highlights the failure of UAM to match experimental phenomenon (simulation movie in SM4) (B) A force-balance schematic of the RBC doublet disaggregation with OT showing the simultaneous reorientation of the adhesion plane and contact area loss contributing to the increasing tension stage (stage I) and reducing tension stage (stage II) of the disaggregation.
Applying our CBMM to the same OT protocol for dissociating doublets, we found the level of cross-bridge accumulation required for an increase in adhesivity matching the experiment (Khokhlova et al., 2012) was achieved when the diffusivity of the surface-adsorbed mobile Fg (

FIGURE 6. Validation of CBMM against RBC-doublet disaggregation optical tweezers (OT) experiments. (A) Comparison of the cross-bridge migration model (CBMM) under varying mFg diffusivity, DmFg [1x10⁻¹⁵ m2∙s-1] against the experimental results. (B) Augmented surface affinity of the RBC doublet adhesion due to an increase in the average cross-bridge density in the intercellular gap prescribed by convection-diffusion mechanisms in the CBMM. (C) Distribution maps of surface-adsorbed Fg during doublet disaggregation predicted by the parametric simulation study. High mFg diffusivity effect: Fast lateral diffusion of mFg ensured homogenous mFg distribution. Low mFg diffusivity effect: Slow rate of mFg diffusion allowed frictional drift to accumulate mFg in contact rim; Normal flux effect: Depleted regions were replenished by out-of-plane diffusion (Simulation movie in SM5). (D,E) Models with surface-normal diffusion under varying resting bulk to surface concentration ratios (
The
We also examined the role of normal fluxes and bulk to surface concentration gradients through the
A summary of the simulations performed in this section and their parameter settings can be found in Table 3.
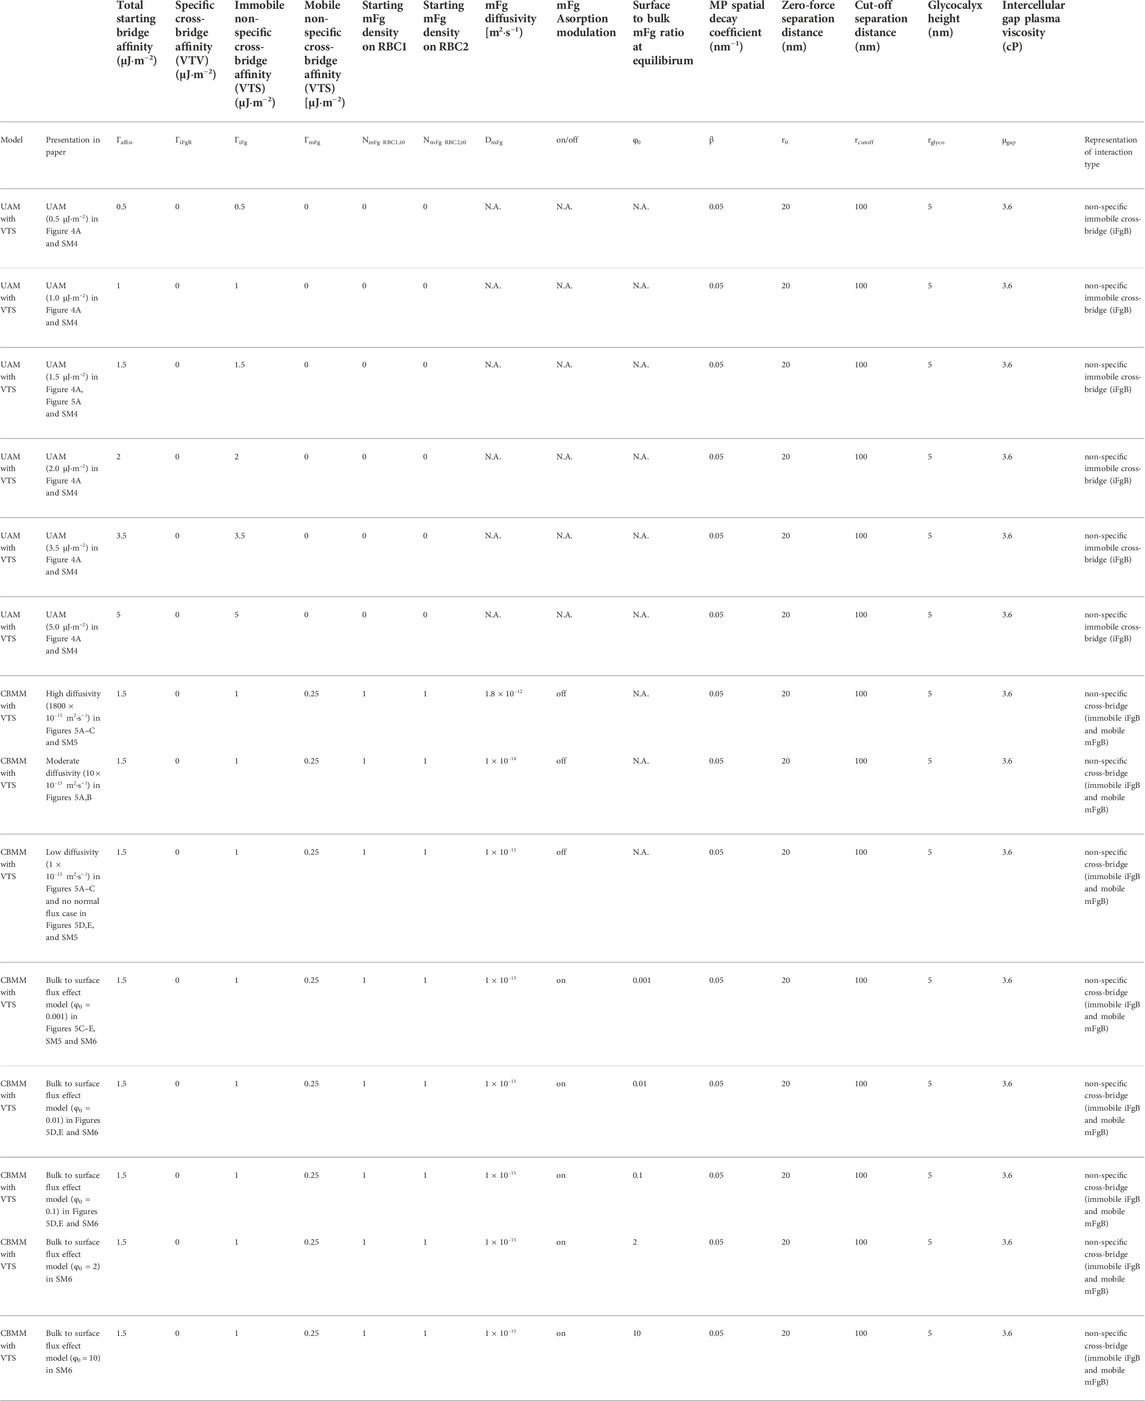
TABLE 3. Simulation parameters for CBMM and UAM in doublet disaggregation simulations.
Representation of pathophysiological aggregability ranges within the CBMM
With the baseline CBMM parameters (
Following the baseline CBMM established in the earlier section, the baseline concentrations of mFg on RBC1 and RBC2 at equilibrium before doublet disaggregation was initiated were set at
First, we set out to describe the apparent relation between bulk concentration of Fg in plasma and the surface concentration of adsorbed Fg for doublets and plasma from healthy patients. There appeared to be a direct correspondence between the clinical range for systemic Fg levels in normal plasma from healthy samples and the surface concentration range of adsorbed Fg in the CBMM employed to fit the empirical variation in OT doublet disaggregation forces (Figure 7A). From the lower fit (blue curve in Figure 7A:
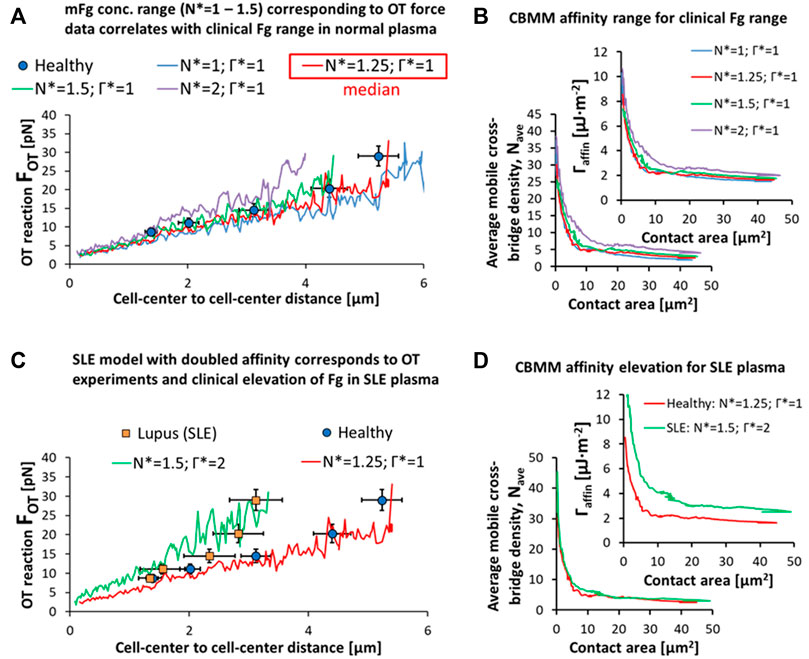
FIGURE 7. Pathophysiological representations of RBC doublet disaggregation. (A,B) Variation in the OT experimental data can be explained in the CBMM by variation in the surface adsorption of Fg in accordance with the clinical variation in Fg levels in plasma from healthy samples. (C,D) SLE samples results in OT can be explained by a dual-effect of elevation in surface adsorbed Fg (N* = 1.25 for median level in healthy RBCs and plasma to N* = 1.5 for median level in SLE RBCs in SLE plasma) and an increase in mFg mediated affinity (Γ* = 1 for healthy to Γ* = 2 in SLE). Simulation movies of the parametric variations in N* and Γ* can be seen in SM7.
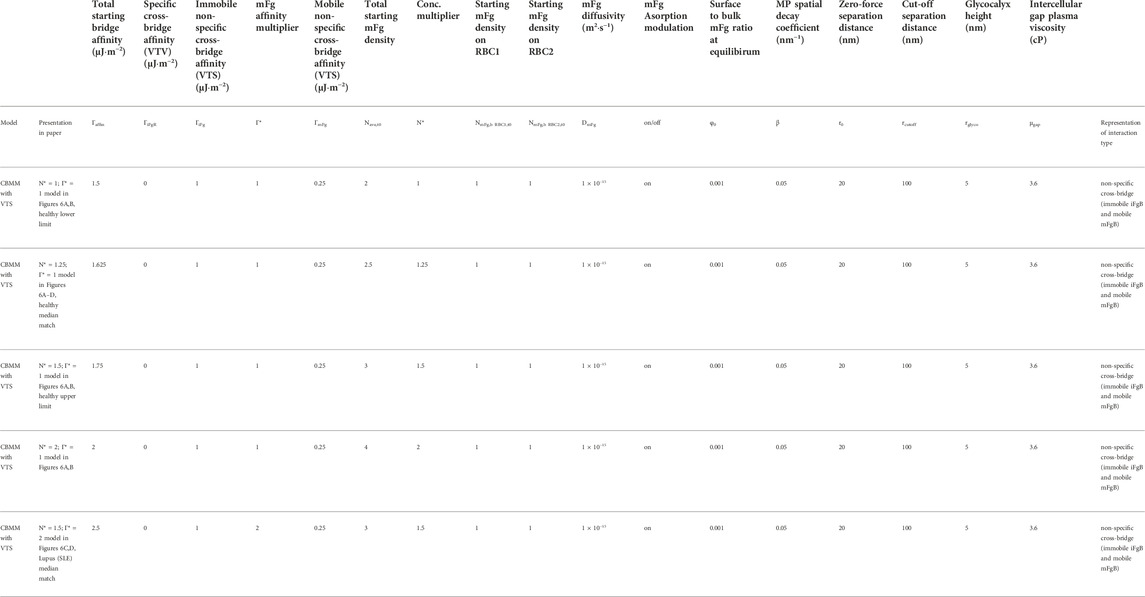
TABLE 4. Simulation parameters for CBMM investigation of pathophysiological aggregation.
Similarly, the hyper-stabilized state of the RBC doublet in SLE can be explained by an increase in the surface adsorption rate and surface concentration of bridging proteins like Fg in response to the increased levels of the proteins in blood plasma. The SLE doublet hyper-stability data in the disaggregation experiment was matched to a 20% increase in the surface concentration of Fg in the CBMM (
A summary of the simulations performed in this section and their parameter settings can be found in Table 4.
CBMM limitations
Because the elementary contributors to the inter-RBC interactions are diverse in plasma, we can only provide a framework of the cross-bridge migration hypothesis around Fg. The present CBMM therefore does not explicitly model the roles of other blood proteins which may play integral roles in mediating the affinity of Fg with the RBC surface or directly contribute to aggregation as demonstrated with serum-mediated RBC aggregation (Lee et al., 2016a). Despite this, our investigation into the underlying cross-bridging mechanisms in doublet formation with VTV and VTS adhesion schemes has been useful in demonstrating the doublet formation kinematics resulting from specific cross-bridges (iFgRB) versus non-specific cross-bridges (mFgB and iFgB). Beyond this, the model cannot elucidate on a deeper theoretical level the mechanistic interactions of other blood factors with Fg and how they may regulate the equilibrium levels of iFgR, iFgB and mFgB. For further development, we may prescribe the contributions of other blood factors on the action of the cross-bridging elements by transforming the adhesion energy potential, CBMM transport characteristics and employing a mixed scheme approach with both VTS and VTV conditionally present in the aggregation model. These further developments can only be done when the CFS experiments measuring the kinematics and force characteristics contributed by other plasma factors have been performed.
Another key aspect missing from the present CBMM is a consideration of a time-dependent cross-bridge formation which has been suggested to be on the order of seconds (Bronkhorst et al., 1997). We have assumed in our CBMM that both specific cross-bridging scenarios (iFgR) and non-specific cross-bridging scenarios iFgB and mFgB to be spontaneous and invariant to the timescales considered in our study. While the CBMM has been parametrically tweaked to match the empirical data, this does not suggest our time-invariance assumption to be true. For example, if we represented the surface affinity of a mobile bridging unit (
Finally, while this is not a direct limitation of the CBMM, our current work is limited in its scope of application. We have only characterized the RBC aggregate disaggregation under Couette flow shearing conditions but have not presented the scenarios of blood flow in vessel lumens. In such rheological scenarios, there will be weak shear in the lumen center and very high shear rates near the vessel walls. We expect RBC aggregate disaggregation mechanisms in the near-wall regions to be similar to the OT-based shearing mechanisms. Flow pulsatility is also another aspect of physiological flows that cannot be discussed in the present study since we have only applied doublet disaggregation at one constant pulling rate (0.15 μm·s−1). While these two aspects are invaluable features of physiological blood flow, we feel that without experimental data the model predictions in such scenarios may be pure speculation. As such we have limited the scope of this paper to data available from present CFS experiments.
Conclusion
In summary, we have developed a theoretical framework for describing cross-bridge dynamics in plasma-mediated RBC aggregation through our cross-bridge migration model. By combining the observations from Fg proteomic studies and RBC-doublet level force spectroscopy techniques, we have demonstrated the parametric workings of a spatially non-uniform adhesion dynamics model that prescribes a surface convection-diffusion transport of a mobile cross-bridging Fg complex. Our simulation results for doublet formation indicate that RBC-RBC adhesion mechanisms in plasma are likely weak and non-specific based on the kinematics of inter-RBC motion required for contact area growth. Our doublet disaggregation simulations show that the inverse force to contact area relationship reported by doublet disaggregation experiments can be predicted by the CBMM under the condition of an mFg diffusivity that is three orders of magnitude lower than aqueous Fg diffusivity (1.8x10⁻¹¹ → 1 × 10⁻¹⁵ m2∙s−1). As we have not explicitly included bridge formation reaction kinetics in the CBMM, the effective diffusivity may be a qualitative representation of the diffusion-limiting effects of local cross-bridge formation and disassembly. Furthermore, the finding at least qualitatively demonstrates the important role of RBC surface interactions with mFg in mediating cross-bridge migration and inter-RBC affinity. We also demonstrated how the CBMM can be staged to qualitatively represent clinical ranges of healthy and diseased RBC aggregation and disaggregation dynamics.
Data availability statement
The original contributions presented in the study are included in the article/Supplementary Material, further inquiries can be directed to the corresponding author.
Author contributions
SM and SK contributed to the conception of this study. SM developed the computational models and performed the numerical simulations. SM and SK analyzed the results and contributed to the discussion. SM wrote the first draft of the manuscript and SK edited and wrote sections of the manuscript. All authors contributed to manuscript revision, read and approved the submitted version.
Funding
This research was supported and made possible by Academic Research Fund Tier-2 (MOE-T2EP50121-0015).
Conflict of interest
The authors declare that the research was conducted in the absence of any commercial or financial relationships that could be construed as a potential conflict of interest.
Publisher’s note
All claims expressed in this article are solely those of the authors and do not necessarily represent those of their affiliated organizations, or those of the publisher, the editors and the reviewers. Any product that may be evaluated in this article, or claim that may be made by its manufacturer, is not guaranteed or endorsed by the publisher.
Supplementary material
The Supplementary Material for this article can be found online at: https://www.frontiersin.org/articles/10.3389/fbioe.2022.1049878/full#supplementary-material
References
Ames, P. R., Alves, J., Pap, A. F., Ramos, P., Khamashta, M. A., and Hughes, G. R. (2000). Fibrinogen in systemic lupus erythematosus: More than an acute phase reactant? J. Rheumatol. 27 (5), 1190–1195.
Ami, R. B., Barshtein, G., Zeltser, D., Goldberg, Y., Shapira, I., Roth, A., et al. (2001). Parameters of red blood cell aggregation as correlates of the inflammatory state. Am. J. Physiology-Heart Circulatory Physiology 280 (5), H1982–H1988. doi:10.1152/ajpheart.2001.280.5.H1982
Arbel, Y., Banai, S., Benhorin, J., Finkelstein, A., Herz, I., Halkin, A., et al. (2012). Erythrocyte aggregation as a cause of slow flow in patients of acute coronary syndromes. Int. J. Cardiol. 154 (3), 322–327. doi:10.1016/j.ijcard.2011.06.116
Booth, S., Chohan, S., Curran, J. C., Karrison, T., Schmitz, A., and Utset, T. O. (2007). Whole blood viscosity and arterial thrombotic events in patients with systemic lupus erythematosus. Arthritis Rheum. 57 (5), 845–850. doi:10.1002/art.22766
Bronkhorst, P. J., Grimbergen, J., Brakenhoff, G. J., Heethaar, R. M., and Sixma, J. J. (1997). The mechanism of red cell (dis)aggregation investigated by means of direct cell manipulation using multiple optical trapping. Br. J. Haematol. 96 (2), 256–258. doi:10.1046/j.1365-2141.1997.d01-2036.x
Carvalho, F. A., Connell, S., Miltenberger-Miltenyi, G., Pereira, S. V., Tavares, A., Ariens, R. A., et al. (2010). Atomic force microscopy-based molecular recognition of a fibrinogen receptor on human erythrocytes. ACS Nano 4 (8), 4609–4620. doi:10.1021/nn1009648
Carvalho, F. A., de Oliveira, S., Freitas, T., Gonçalves, S., and Santos, N. C. (2011). Variations on fibrinogen-erythrocyte interactions during cell aging. PLOS ONE 6 (3), e18167. doi:10.1371/journal.pone.0018167
Chien, S. (1973). Electrochemical and ultrastructural aspects of red cell aggregation. Bibl. Anat. 11, 244–250.
De Oliveira, S., de Almeida, V. V., Calado, A., Rosário, H. S., and Saldanha, C. (2012). Integrin-associated protein (CD47) is a putative mediator for soluble fibrinogen interaction with human red blood cells membrane. Biochimica Biophysica Acta (BBA) - Biomembr. 1818 (3), 481–490. doi:10.1016/j.bbamem.2011.10.028
Deng, L. H., Barbenel, J. C., and Lowe, G. D. (1994). Influence of hematocrit on erythrocyte aggregation kinetics for suspensions of red blood cells in autologous plasma. Biorheology 31 (2), 193–205. doi:10.3233/bir-1994-31207
Dunlop, M. J., Lee, M. M., Canham, P. B., and Taylor, C. P. (1984). Kinetics of adhesive interaction in vitro of human erythrocytes in plasma. Microvasc. Res. 28 (1), 62–74. doi:10.1016/0026-2862(84)90029-3
Español, P. (1998). Fluid particle model. Phys. Rev. E 57 (3), 2930–2948. doi:10.1103/physreve.57.2930
Evans, E. A. (1983). Bending elastic modulus of red blood cell membrane derived from buckling instability in micropipet aspiration tests. Biophysical journal 43, 27–30.
Evans, E. A. (1989). “[1] Structure and deformation properties of red blood cells: Concepts and quantitative methods,” in Methods in enzymology (Academic Press), 3–35.
Fåhraeus, R. (1929). The suspension stability of the blood. Physiol. Rev. 9 (2), 241–274. doi:10.1152/physrev.1929.9.2.241
Fedosov, D. A., Caswell, B., and Karniadakis, G. E. (2010). A multiscale red blood cell model with accurate mechanics, rheology, and dynamics. Biophys. J. 98 (10), 2215–2225. doi:10.1016/j.bpj.2010.02.002
Fedosov, D. A., Lei, H., Caswell, B., Suresh, S., and Karniadakis, G. E. (2011a). Multiscale modeling of red blood cell mechanics and blood flow in malaria. PLoS Comput. Biol. 7 (12), e1002270. doi:10.1371/journal.pcbi.1002270
Fedosov, D. A. (2010). Multiscale modeling of blood flow and soft matter. Doctor of Philosophy PhD. Brown University.
Fedosov, D. A., Pan, W., Caswell, B., Gompper, G., and Karniadakis, G. E. (2011b). Predicting human blood viscosity in silico. Proc. Natl. Acad. Sci. U. S. A. 108 (29), 11772–11777. doi:10.1073/pnas.1101210108
Hazelton, R., Lowe, G. D., Forbes, C. D., and Sturrock, R. D. (1985). Increased blood and plasma viscosity in systemic lupus erythematosus (SLE). J. Rheumatol. 12 (3), 616–617.
Hochmuth, R. M., Worthy, P. R., and Evans, E. A. (1979). Red cell extensional recovery and the determination of membrane viscosity. Biophysical journal 26, 101–114.
Johnson, P. C., Bishop, J. J., Popel, S., and Intaglietta, M. (1999). Effects of red cell aggregation on the venous microcirculation. Biorheology 36 (5-6), 457–460.
Katanov, D., Gompper, G., and Fedosov, D. A. (2015). Microvascular blood flow resistance: Role of red blood cell migration and dispersion. Microvasc. Res. 99, 57–66. doi:10.1016/j.mvr.2015.02.006
Khokhlova, M. D., Lyubin, E. V., Zhdanov, A. G., Rykova, S. Y., Sokolova, I. A., and Fedyanin, A. A. (2012). Normal and system lupus erythematosus red blood cell interactions studied by double trap optical tweezers: Direct measurements of aggregation forces. J. Biomed. Opt. 17 (2), 025001. doi:10.1117/1.JBO.17.2.025001
Kim, S., Popel, A. S., Intaglietta, M., and Johnson, P. C. (2006). Effect of erythrocyte aggregation at normal human levels on functional capillary density in rat spinotrapezius muscle. Am. J. Physiology-Heart Circulatory Physiology 290 (3), H941–H947. doi:10.1152/ajpheart.00645.2005
Knisely, M. H., Bloch, E. H., Eliot, T. S., and Warner, L. (1947). Sludged blood. Science 106 (2758), 431–440. doi:10.1126/science.106.2758.431
Kollman, J. M., Pandi, L., Sawaya, M. R., Riley, M., and Doolittle, R. F. (2009). Crystal structure of human fibrinogen. Biochemistry 48 (18), 3877–3886. doi:10.1021/bi802205g
Larsson, U., Blombäck, B., and Rigler, R. (1987). Fibrinogen and the early stages of polymerization to fibrin as studied by dynamic laser light scattering. Biochimica Biophysica Acta (BBA) - Protein Struct. Mol. Enzym. 915 (2), 172–179. doi:10.1016/0167-4838(87)90297-4
Lee, B. K., Alexy, T., Wenby, R. B., and Meiselman, H. J. (2007). Red blood cell aggregation quantitated via Myrenne aggregometer and yield shear stress. Biorheology 44 (1), 29–35.
Lee, K., Danilina, A., Potkin, A., Kinnunen, M., Priezzhev, A., and Meglinski, I. (2016a). RBC aggregation dynamics in autologous plasma and serum studied with double-channel optical tweezers. SPIE.
Lee, K., Kinnunen, M., Khokhlova, M. D., Lyubin, E. V., Priezzhev, A. V., Meglinski, I., et al. (2016b). Optical tweezers study of red blood cell aggregation and disaggregation in plasma and protein solutions. J. Biomed. Opt. 21 (3), 035001. doi:10.1117/1.JBO.21.3.035001
Lee, K., Wagner, C., and Priezzhev, A. V. (2017). Assessment of the "cross-bridge"-induced interaction of red blood cells by optical trapping combined with microfluidics. J. Biomed. Opt. 22 (9), 091516. doi:10.1117/1.JBO.22.9.091516
Li, H., Ye, T., and Lam, K. (2014). Computational analysis of dynamic interaction of two red blood cells in a capillary. Cell. biochem. Biophys. 69 (3), 673–680. doi:10.1007/s12013-014-9852-4
Litvinov, R. I., Yakovlev, S., Tsurupa, G., Gorkun, O. V., Medved, L., and Weisel, J. W. (2007). Direct evidence for specific interactions of the fibrinogen αc-domains with the central E region and with each other. Biochemistry 46 (31), 9133–9142. doi:10.1021/bi700944j
Liu, Y. L., and Liu, W. K. (2006). Rheology of red blood cell aggregation by computer simulation. J. Comput. Phys. 220 (1), 139–154. doi:10.1016/j.jcp.2006.05.010
Lominadze, D., and Dean, W. L. (2002). Involvement of fibrinogen specific binding in erythrocyte aggregation. FEBS Lett. 517 (1-3), 41–44. doi:10.1016/s0014-5793(02)02575-9
Lominadze, D., Joshua, I. G., and Schuschke, D. A. (1998). Increased erythrocyte aggregation in spontaneously hypertensive rats. Am. J. Hypertens. 11 (7), 784–789. doi:10.1016/s0895-7061(98)00056-9
Maeda, N., Seike, M., Kume, S., Takaku, T., and Shiga, T. (1987). Fibrinogen-induced erythrocyte aggregation: Erythrocyte-binding site in the fibrinogen molecule. Biochimica Biophysica Acta - Biomembr. 904 (1), 81–91. doi:10.1016/0005-2736(87)90089-7
Mills, J. P., Qie, L., Dao, M., Lim, C. T., and Suresh, S. (2004). elastic and viscoelastic deformation of the human red blood cell with optical tweezers. Molecular & Cellular Biomechanics.1.
Namgung, B., Ng, Y. C., Nam, J., Leo, H. L., and Kim, S. (2015). Alteration of blood flow in a venular network by infusion of dextran 500: Evaluation with a laser speckle contrast imaging system. PloS one 10 (10), e0140038. doi:10.1371/journal.pone.0140038
Neu, B., and Meiselman, H. J. (2002). Depletion-mediated red blood cell aggregation in polymer solutions. Biophysical J. 83 (5), 2482–2490. doi:10.1016/s0006-3495(02)75259-4
Neu, B., Sowemimo-Coker, S. O., and Meiselman, H. J. (2003). Cell-cell affinity of senescent human erythrocytes. Biophys. J. 85 (1), 75–84. doi:10.1016/S0006-3495(03)74456-7
Pivkin, I. V., and Karniadakis, G. E. (2008). Accurate coarse-grained modeling of red blood cells. Phys. Rev. Lett. 101 (11), 118105. doi:10.1103/physrevlett.101.118105
Rad, S., Gao, J., Meiselman, H. J., Baskurt, O. K., and Neu, B. (2009). Depletion of high molecular weight dextran from the red cell surface measured by particle electrophoresis. Electrophoresis 30 (3), 450–456. doi:10.1002/elps.200800318
Rad, S., Meiselman, H. J., and Neu, B. (2014). Impact of glycocalyx structure on red cell-red cell affinity in polymer suspensions. Colloids Surfaces B Biointerfaces 123, 106–113. doi:10.1016/j.colsurfb.2014.09.001
Reid, H. L., and De Ceulaer, K. (1999). Abnormal plasma and serum viscosity in systemic lupus erythematosus (SLE): A Jamaican study. Clin. Hemorheol. Microcirc. 20 (3), 175–180.
Reinhart, W. H., and Nagy, C. (1995). Albumin affects erythrocyte aggregation and sedimentation. Eur. J. Clin. Invest. 25 (7), 523–528. doi:10.1111/j.1365-2362.1995.tb01739.x
Rosenson, R. S., Shott, S., and Katz, R. (2001). Elevated blood viscosity in systemic lupus erythematosus. Seminars Arthritis Rheumatism 31 (1), 52–57. doi:10.1053/sarh.2001.24876
Sargento, L., Saldanha, C., Monteiro, J., Perdigao, C., and e Silva, J. M. (2005). Long-term prognostic value of protein C activity, erythrocyte aggregation and membrane fluidity in transmural myocardial infarction. Thromb. Haemost. 94 (2), 380–388. doi:10.1160/TH04-12-0791
Schmid-Schonbein, H., Gaehtgens, P., and Hirsch, H. (1968). On the shear rate dependence of red cell aggregation in vitro. J. Clin. Invest. 47 (6), 1447–1454. doi:10.1172/JCI105836
Schmid-Schonbein, H., and Volger, E. (1976). Red-cell aggregation and red-cell deformability in diabetes. Diabetes 25 (2), 897–902.
Skutelsky, E., Danon, D., Wilchek, M., and Bayer, E. A. (1977). Localization of sialyl residues on cell surfaces by affinity cytochemistry. J. Ultrastruct. Res. 61 (3), 325–335. doi:10.1016/s0022-5320(77)80057-9
Sokolova, I. A., Muravyov, A. V., Khokhlova, M. D., Rikova, S. Y., Lyubin, E. V., Gafarova, M. A., et al. (2014). An effect of glycoprotein IIb/IIIa inhibitors on the kinetics of red blood cells aggregation. Clin. Hemorheol. Microcirc. 57 (3), 291–302. doi:10.3233/CH-131774
Somer, T., and Meiselman, H. J. (1993). Disorders of blood viscosity. Ann. Med. 25 (1), 31–39. doi:10.3109/07853899309147854
Steffen, P., Verdier, C., and Wagner, C. (2013). Quantification of depletion-induced adhesion of red blood cells. Phys. Rev. Lett. 110 (1), 018102. doi:10.1103/physrevlett.110.018102
Suganuma, T., Ohta, T., Tsuyama, S., Kamada, T., Otsuji, S., and Murata, F. (1985). Qualitative and quantitative analysis of erythrocyte surface membrane sialyl residues using affinity cytochemistry with special reference to diabetic patients. Virchows Arch. B Cell. Pathol. Incl. Mol. Pathol. 49 (1), 1–11. doi:10.1007/bf02912080
Suresh, S., Spatz, J., Mills, J. P., Micoulet, P., Dao, M., Lim, C. T., et al. (2005). Connections between single-cell biomechanics and human disease states: gastrointestinal cancer and malaria. Acta Biomaterialia
Tarallo, P., Henny, J., Gueguen, R., and Siest, G. (1992). Reference limits of plasma fibrinogen. Eur. J. Clin. Chem. Clin. Biochem. 30 (11), 745–751. doi:10.1515/cclm.1992.30.11.745
Tozeren, A., Sung, K. L., and Chien, S. (1989). Theoretical and experimental studies on cross-bridge migration during cell disaggregation. Biophys. J. 55 (3), 479–487. doi:10.1016/S0006-3495(89)82841-3
van Haeringen, N. J., Oosterhuis, J. A., Terpstra, J., and Glasius, E. (1973). Erythrocyte aggregation in relation to diabetic retinopathy. Diabetologia 9 (1), 20–24. doi:10.1007/bf01225995
Vincent, B., Edwards, J., Emmett, S., and Jones, A. (1986). Depletion flocculation in dispersions of sterically-stabilised particles (“soft spheres”). Colloids Surfaces 18 (2–4), 261–281. doi:10.1016/0166-6622(86)80317-1
von Bülow, S., Siggel, M., Linke, M., and Hummer, G. (2019). Dynamic cluster formation determines viscosity and diffusion in dense protein solutions. Proc. Natl. Acad. Sci. U. S. A. 116 (20), 9843–9852. doi:10.1073/pnas.1817564116
Wang, T., Pan, T.-W., Xing, Z., and Glowinski, R. (2009). Numerical simulation of rheology of red blood cell rouleaux in microchannels. Phys. Rev. E 79 (4), 041916. doi:10.1103/physreve.79.041916
Wang, T., and Xing, Z. (2014). A fluid-particle interaction method for blood flow with special emphasis on red blood cell aggregation. Bio-medical Mater. Eng. 24 (6), 2511–2517. doi:10.3233/bme-141065
Xu, Y.-Q., Tian, F.-B., and Deng, Y.-L. (2013). An efficient red blood cell model in the frame of IB-LBM and its application. Int. J. Biomath. 6 (01), 1250061. doi:10.1142/s1793524512500611
Ye, T., Peng, L., and Li, G. (2019). Red blood cell distribution in a microvascular network with successive bifurcations. Biomech. Model. Mechanobiol. 18 (6), 1821–1835. doi:10.1007/s10237-019-01179-5
Ye, T., and Peng, L. (2019). Motion, deformation, and aggregation of multiple red blood cells in three-dimensional microvessel bifurcations. Phys. Fluids 31 (2), 021903. doi:10.1063/1.5079836
Ye, T., Phan-Thien, N., Khoo, B. C., and Lim, C. T. (2014b). A file of red blood cells in tube flow: A three-dimensional numerical study. J. Appl. Phys. 116 (12), 124703. doi:10.1063/1.4896358
Ye, T., Phan-Thien, N., Khoo, B. C., and Lim, C. T. (2014a). Dissipative particle dynamics simulations of deformation and aggregation of healthy and diseased red blood cells in a tube flow. Phys. Fluids 26 (11), 111902. doi:10.1063/1.4900952
Yin, X., Thomas, T., and Zhang, J. (2013). Multiple red blood cell flows through microvascular bifurcations: Cell free layer, cell trajectory, and hematocrit separation. Microvasc. Res. 89, 47–56. doi:10.1016/j.mvr.2013.05.002
Zhang, J., Johnson, P. C., and Popel, A. S. (2009). Effects of erythrocyte deformability and aggregation on the cell free layer and apparent viscosity of microscopic blood flows. Microvasc. Res. 77 (3), 265–272. doi:10.1016/j.mvr.2009.01.010
Zhang, J., Johnson, P. C., and Popel, A. S. (2008). Red blood cell aggregation and dissociation in shear flows simulated by lattice Boltzmann method. J. biomechanics 41 (1), 47–55. doi:10.1016/j.jbiomech.2007.07.020
Keywords: red blood cell (RBC), fibrinogen bridging, RBC aggregation, RBC disaggregation, RBC doublet, bridging theory, cross-bridge migration, cell adhesion
Citation: Maung Ye SS and Kim S (2022) A mechanistic model of cross-bridge migration in RBC aggregation and disaggregation. Front. Bioeng. Biotechnol. 10:1049878. doi: 10.3389/fbioe.2022.1049878
Received: 21 September 2022; Accepted: 21 November 2022;
Published: 06 December 2022.
Edited by:
Josue Sznitman, Technion Israel Institute of Technology, IsraelReviewed by:
Joseph van Batenburg-Sherwood, Imperial College London, United KingdomDong-Guk Paeng, Jeju National University, South Korea
Copyright © 2022 Maung Ye and Kim. This is an open-access article distributed under the terms of the Creative Commons Attribution License (CC BY). The use, distribution or reproduction in other forums is permitted, provided the original author(s) and the copyright owner(s) are credited and that the original publication in this journal is cited, in accordance with accepted academic practice. No use, distribution or reproduction is permitted which does not comply with these terms.
*Correspondence: Sangho Kim, Ymlla3NAbnVzLmVkdS5zZw==