 Jordan Pennells*
 Darren J. Martin
- School of Chemical Engineering, The University of Queensland, St Lucia, QLD, Australia
With the rise of biomass-based materials such as nanocellulose, there is a growing need to develop statistical methods capable of leveraging inter-dependent experimental data to improve material design, product development, and process optimisation. Statistical approaches are essential given the multifaceted nature of variability in lignocellulosic biomass, which includes a range of different biomass feedstock types, a combinative arrangement of different biomass processing routes, and an array of different product formats depending on the focal application. To account for this large degree of variability and to extract meaningful patterns from research studies, there is a requirement to generate larger datasets of biomass-derived material properties through well-designed experimental systems that enable statistical analysis. To drive this trend, this article proposes the cross-disciplinary utilisation of statistical modelling approaches commonly applied within the field of statistical genetics to evaluate data generated in the field of biomass-based material research and development. The concepts of variance partitioning, heritability, hierarchical clustering, and selection gradients have been explained in their native context of statistical genetics and subsequently applied across the disciplinary boundary to evaluate relationships within a model experimental study involving the production of sorghum-derived cellulose nanofibres and their subsequent fabrication into nanopaper material. Variance partitioning and heritability calculates the relative influence of biomass vs. processing factors on material performance, while hierarchical clustering highlights the obscured similarity between experimental samples or characterisation metrics, and selection gradients elucidate the relationships between characterisation metrics and material quality. Ultimately, these statistical modelling approaches provide more depth to the investigation of biomass-processing-structure-property-performance relationships through outlining a framework for product characterisation, quality evaluation, and data visualisation, not only applicable to nanocellulose production but for all biomass-based materials and products.
1 Introduction
Biomass-derived nanocellulose is a highly versatile material currently under investigation across a wide range of burgeoning material applications, including paper and packaging, adsorbents, cosmetics, catalysts, construction, biomedicine, and electronic devices (Pennells et al., 2020). The bio-based origin of lignocellulosic biomass significantly contributes to the sustainability of nanocellulose materials. However, lignocellulose variability is a significant challenge for the development of bio-based nanocellulose products (Zhu et al., 2016). The multifaceted nature of lignocellulose variability involves: 1) The inherent biological variability of lignocellulose from different genetic sources (plant species) and environmental growth conditions; 2) Biological variability across different tissue types within the same plant; 3) The hierarchical complexity of both the feedstock material and final product structure; and 4) Material variability attributed to differences in biomass handling, storage, processing, and product fabrication (Ciesielski et al., 2020). This variability is reflected in the versatility of nanocellulose materials, which are able to be produced from a wide variety of biomass sources (i.e., from aquatic and terrestrial biomass or through bacterial biosynthesis), generated through a range of different processing routes (i.e., enzymatic, thermal, chemical, and mechanical treatments), or fabricated into a range of different product formats (i.e., aqueous suspension or paste, dried into a networked film, spray dried into solid particles, compounded in a polymer matrix, freeze dried into an aerogel structure, or carbonized at high temperatures). Hence, this complex nature of variability must be considered when investigating biomass-derived nanocellulose materials.
Experimental system design and statistical modelling approaches that account for these sources of variability are a significantly underdeveloped aspect of the nanocellulose research field (Ramakrishna et al., 2019). Statistical approaches are most commonly utilised in nanocellulose research for process optimisation (Rojsitthisak et al., 2017; Rodrigues et al., 2019; Baruah et al., 2020; Hisham et al., 2020; Nardi et al., 2020; Mairpady et al., 2021; Lim et al., 2022; Prabu et al., 2022; Soleimanzadeh et al., 2022; Zubair et al., 2022), property evaluation (Chinga-Carrasco, 2013; Lin et al., 2014; Desmaisons et al., 2017; Kriechbaum et al., 2018; Schenker et al., 2018; Motohashi and Hanasaki, 2019; Espinosa et al., 2020; de Carvalho Benini et al., 2021; Sankhla et al., 2021), predictive modelling (Hayes, 2012; García-Gonzalo et al., 2016; Lengowski et al., 2016; Ramachandran et al., 2017; Malucelli et al., 2018; Gao et al., 2019; Ferdous et al., 2021; Demir et al., 2022), and fibre morphology estimation (Postek et al., 2011; Legland and Beaugrand, 2013; Aguado et al., 2016; Arcari et al., 2019; Ang et al., 2020; Campano et al., 2020; Uetani et al., 2021). However, statistical approaches also have the potential to be employed in alternative and creative ways. A well-structured experimental design and sample characterisation methodology can help to answer questions relating to both which biomass source and/or processing conditions generate the highest performing material, as well as the mechanisms by which high performance is achieved. This article offers a statistical approach to deal with the challenge of lignocellulose variability, through co-opting a handful of concepts from the field of statistical genetics. These statistical methodologies—including variance partitioning, heritability, hierarchical clustering, and selection gradients—have conventionally been utilised to decipher phenotypic and/or genetic variance between organisms within a species population. However, these concepts have been re-applied across disciplinary boundaries to demonstrate their utility in material research and development.
This work utilizes data from an experimental system outlined in an existing research study, involving the generation of cellulose nanofibres (CNFs) from sorghum agricultural byproducts and the subsequent fabrication of nanopaper material (Pennells et al., 2021). The factors within the experimental dataset include nanofibre samples from different: 1) sorghum varieties; 2) plant sections; 3) energy levels for mechanical fibrillation; which were subsequently fabricated into multiple 4) nanopaper material duplicates; and 5) nanopaper strip replicates per duplicate for mechanical testing. A summary of this experimental system is outlined in the Supplementary Material (Supplementary Figure S1).
The key characterisation metrics used in this study included the nanofibre-water interaction properties of sedimentation behavior and water retention value, and the mechanical properties of nanopaper material, specifically nanopaper tensile index. Sedimentation behavior was based on the sediment height of a series of diluted cellulose nanofibre samples after settling over a period of 48 h. The derivative of the sediment height trendline over the dilution series is used to calculate the estimated average nanofibre aspect ratio based on the Effective Medium Theory (Varanasi et al., 2013). The water retention value metric was based on the solids content of cellulose nanofibre samples after a standardised centrifugation process at 3,000 rpm for 10 min, which indicated the capacity for the sample to entrain water within the nanofibre network as a proxy for the specific surface area (Gu et al., 2018). Subsequent fabrication of cellulose nanofibres into nanopaper material was achieved with a Rapid Köthen handsheet former (Xell, Austria) according to ISO 5269–2:2004 (International Organization for Standardization, 2004). The mechanical properties of nanopaper material were assessed through tensile testing of multiple nanopaper strips with the Instron model 5,543 universal testing machine (Instron Pty Ltd., Melbourne, Australia), using a 500 N load cell, a crosshead speed of 1 mm/min, and a gauge length of 100 mm (Pennells et al., 2021).
2 Variance partitioning & heritability
In statistics, variance partitioning (or partitioning of the sums of squared deviations) involves estimating the spread of observations from the mean value for different sources of variability (or “componentsˮ) within the data set. Interestingly, the development of this field of statistics was largely driven by its application in quantitative genetics. In quantitative genetics, this concept is used to partition the variance in a phenotypic trait based on the effect of genetic and environmental components, as well as the interaction between these components. In other words, variance partitioning in this field estimates the influence of genetic and environmental factors on the phenotypic outcome of interest, a concept that is also known as heritability. In common parlance, this is the technical aspect of the “nature vs. nurture” debate. Based on the variance partitioning results, heritability can be calculated as the proportion of phenotype variance attributed to genetic factors out of the total phenotype variance for a specific trait (i.e., height).
In the context of the current biomass-based material study, the genetic component is attributed to the type of biomass feedstock utilised for CNF preparation. On the other hand, the environmental component is not attributed to the growth conditions of the biomass, as would typically be the case in heritability studies. In this case, the variance due to the growth conditions is assumed to be negligible, as the biomass was grown in the same geographical location over the same period of time. Instead, the environmental component is attributed to the laboratory processing conditions, which act as a pseudo-environment encompassing everything from biomass grinding, pulping, nanofibrillation, and nanopaper fabrication. Therefore, heritability in the context of biomass-based material engineering is a measure of the relative influence of biomass factors (i.e., sorghum variety and plant section) compared to the influence of processing conditions on the phenotypic trait value. The phenotypic trait can be selected as any property measured for the CNF or nanopaper material samples, such as a metric of nanofibre morphology, or the nanopaper tensile strength or toughness. The methodology required to partition the variance of biomass and processing components within the experimental system initially involves application of a statistical model to fit the data. In this case, a linear mixed-effects model was developed to fit the data, with the sorghum variety, plant section, and processing energy level comprising the fixed effects and the nanopaper duplicate and nanopaper strip replicates comprising the random effects. The experimental factors included within this Biomass-to-Nanopaper model are outlined in Table 1.
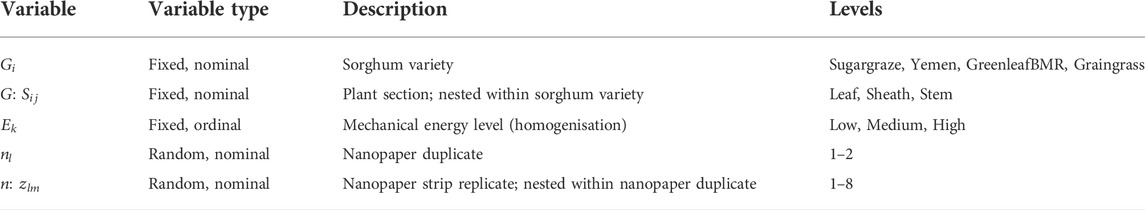
TABLE 1. Experimental factors within the Biomass-to-Nanopaper model.
The response variable of the model was initially selected as the nanopaper tensile index (TI), as this metric generally indicates the quality of CNF samples for nanocomposite reinforcement applications. Therefore, the mixed-effects model is required to determine which experimental factors significantly influence the value of nanopaper tensile index value (i.e., through analysis of variance) and allow the statistical ranking of samples based on this metric (i.e., through pairwise comparison testing). However, determination of the variance attributed to the biomass factors in relation to the processing factors required the conversion of the mixed effects model into a purely random effects model. The structure of the random effects model that was implemented within the R software workspace is outlined in Eq. 1, using the lme4 package (Bates et al., 2015).
Subsequently, an analysis of variance (ANOVA) was performed on the random effects model, with the outcome yielding component variance values. The heritability scores for each component were calculated as a proportion of the overall variance, as outlined in Eq. 2, where
The break down of results for the partitioning of variance analysis are presented in Table 2. This statistical genetics-inspired analysis highlights that the “heritabilityˮ of the variety factor is a low as 2.2%, indicating that the type of sorghum variety had minimal relative impact on the nanopaper tensile index in comparison to the other experimental factors. On the other hand, the mechanical treatment energy level (HPH) had a significantly greater influence on the nanopaper tensile index (35.3%), highlighting the predominant effect that processing has on nanofibre and nanopaper mechanical properties. Meanwhile, the residual variance (43.8%) outweighed all other factors, emphasizing the significant degree of unaccounted for variance in the outcome of nanopaper mechanical strength.

TABLE 2. Partitioning of factor variance for the Biomass-to-Nanopaper random effects model for the response variable of nanopaper tensile index.
In a similar manner, the response variable for the random effects model, which in the case above was the nanopaper tensile index, can be changed to any other CNF or nanopaper characterisation metric within the experimental system. To demonstrate an example of this, the response variable was changed to each one of the fibre morphology metrics assessed on CNF suspension samples using an automated fibre analysis device (MorFi, Techpap, France). Refer to the Supplementary Material for a full description of each of the fibre morphology parameters (Supplementary Table S1). In this case, the variance score of components (variety, section, energy level) were calculated for each of the fibre morphology parameters, as shown in the Supplementary Material (Supplementary Table S2). Utilizing these component variance scores, the ‘heritability’ of each morphology parameter was calculated as the proportion of the genetic variance scores of Section:Variety and Variety over the total parameter variance, as demonstrated in Eq. 3.
In this sense, a higher heritability value indicates a fibre morphology parameter that is more influenced by biomass factors related to different sorghum varieties or plant sections, while a lower heritability value indicates a fibre morphology parameter that is more influenced by the processing factor related to the mechanical treatment energy level. Figure 1 presents the ranked heritability score of each fibre morphology parameter. Overall, this methodology of experimental design and statistical modelling is effective at untangling intertwined relationships between different factors within the experimental system and can be applied across different bio-based material research studies given a well-structured experimental design.
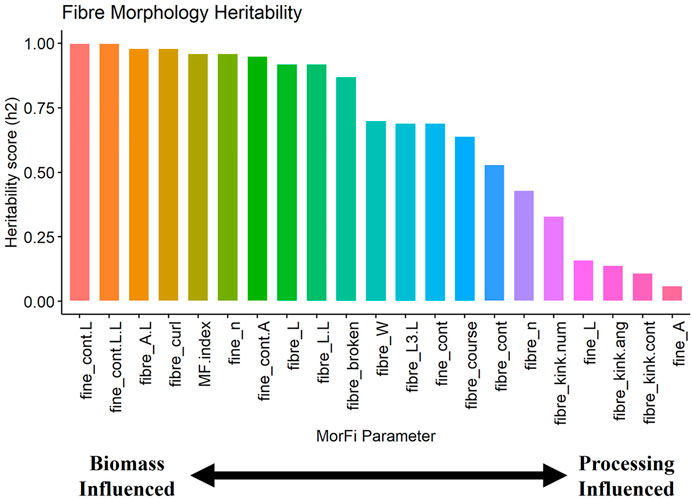
FIGURE 1. Ranking of heritability scores for each fibre morphology parameter.
3 Phylogenetic clustering
In phylogenetics, hierarchical clustering is a statistical method used to evaluate the genetic similarity between a set of different genes, species, or other taxa, typically visualized in the form of a branching tree diagram. The data used to generate the relationship between samples in the form of phylogenetic trees (i.e., dendrograms) is typically measured phenotypic data, or more recently on the nucleotide sequence of genes. However, this statistical method of measuring similarity between samples can be applied to a wide variety of different data set types, including for CNF morphology generated in the experimental system visually outlined in the Supplementary Material (Supplementary Figure S1). In this case, hierarchical clustering can be used to evaluate the similarity between each CNF sample within the experimental series based on the amalgamation of all fibre morphology parameters (Supplementary Figure S2a), or alternatively to evaluate the similarity of different fibre morphology parameters based on all CNF samples (Supplementary Figure S2b).
Interestingly, the groupings generated for both the biomass sample and fibre morphology parameter clustering were highly intuitive and presented informative groups. For biomass sample clustering, this approach readily distinguishes the variability in fibre morphology for the leaf section of sorghum biomass (Supplementary Figure S2a, Cluster 2 + 4). In addition, the characterisation metric clustering convincingly delineates the different types of fibre morphology characteristics, such as the fine content parameters (Supplementary Figure S2b, Cluster 1), fibre kink parameters (Supplementary Figure S2b, Cluster 2), and fibre length parameters (Supplementary Figure S2b, Cluster 3). Therefore, this methodology has the potential to provide deeper insights into the relationships between different experimental samples, in addition to drawing links between the relationship of different characterisation methods or sample properties.
4 Selection gradients & predictive evolution
In statistical genetics, the Breeder’s equation is a statistical tool utilised to predict natural microevolution or the inter-generational effects of selective breeding. The multivariate form of the equation can include a collection of phenotypic traits of a species population, mapping the relationship between traits to the fitness score for the population from generation to generation. This information is sufficient to predict the evolutionary shift in the average value of each measured phenotype over one generation of reproduction or breeding. The Breeder’s equation, also known as the Lande Equation, is shown in Eq. 4 below.
In expanded form, the multivariate Breeder’s equation can also be written as in Eq. 5, where
While the production of CNF from biomass feedstock is not an evolving system, which prevents the complete application of the Breeder’s equation in this context, some aspects of this methodology can be applied for biomass-derived material research. For example, while each row within Eq. 5 would typically represent a different phenotypic trait of the species population, in the case of material processing each row can represent a different characterisation metric for the CNF sample population. The variance of each metric (
This methodology becomes interesting when considering the role of the selection gradient
Utilizing this tunable property of quality in the context of material engineering, multiple selection gradient values can be generated for each characterisation metric as specified by different quality definitions. The utility of this approach for CNF quality evaluation is demonstrated in Figure 2, where the selection gradient values for each fibre morphology metric are compared across two different quality definitions. Quality 1 (Q1) represents the sole definition of the nanopaper tensile index as the quality indicator, while Quality 5 (Q5) represents the nanofibre-water interaction properties of CNF sedimentation ratio and water retention value (Pennells et al., 2022). Each “box plotˮ within Figure 2 consists of two data points, which represent the Q1 and Q5 selection gradient values for each fibre morphology parameter. Refer to the Supplementary Material for a full description of each of the fibre morphology parameters.
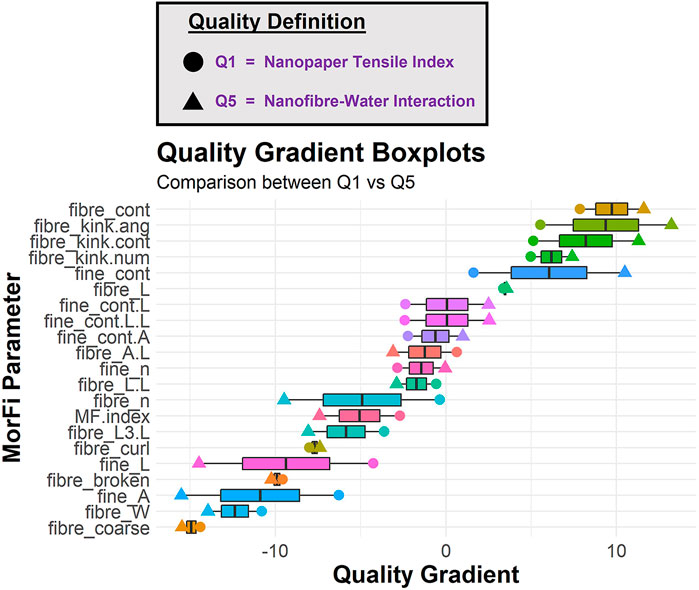
FIGURE 2. Comparison of biomass fibre morphology selection gradients across the Q1 (nanopaper tensile index) and Q5 (CNF sedimentation aspect ratio and WRV) quality definitions.
This diagram presents three key pieces of information: 1) The ascending order of the mean value between the selection gradient values for the two quality definitions (represented as the middle line of each box plot) signifies how the fibre morphology parameter influences quality on average across the two contexts. For example, fibre coarseness (fibre_coarse) has a strong negative selection gradient (i.e., a negative relationship with sample quality) for both the Q1 and Q5 definitions, indicating that a high fibre coarseness generates a low quality material in both the fibre-fibre and fibre-water interaction strength situations. On the other hand, a high fibre content (fibre_cont) generates a high quality material for both of these situations; 2) The fibre morphology parameters that are situated in the middle of the diagram (i.e., fibre_L.L, fine_n, fibre_A.L, fine_cont.A, fine_cont.L.L, fine_cont.L) exhibit a minimal impact on product quality for both situations; and 3) The spread of the box plot indicates how much the selection gradient value changes across the two quality definitions. For example, fibre length (fibre_L) has a very similar influence on product quality for both fibre-fibre and fibre-water interaction applications, whereas the fine content (fine_cont) has a divergent influence on product quality depending on the application, such that a high fine content sample generates a high quality material for the fibre-water interaction application but significantly less so for the nanopaper strength application.
Overall, this quantitative genetics-inspired methodology provides a new approach to visualizing the effect of characterisation metrics on nanocellulose material quality across multiple focal applications. Utilizing the selection gradient values in concert with the metric variance and covariance values, as outlined in Eq. 5,
5 Conclusion
This article outlines a novel approach to experimental data analysis and visualisation for biomass-based material processing, utilizing a combination of statistical methods commonly applied in quantitative genetics. Variance partitioning and heritability estimation (of the experimental system) presents the opportunity to uncover the relative influence of biomass or processing factors on the final material performance, given a well-structured experimental design. Furthermore, the relative influence of biomass or processing factors can be estimated for each CNF characterisation metric, which in this case was demonstrated for the fibre morphology parameters. The relationships between characterisation metrics can also be assessed through a phylogenetics approach, which estimated the relative similarity of samples or characterisation metrics within the data set and exhibited intuitive clustering of the fibre morphology parameters. Lastly, a statistical approach commonly employed for predictive evolution and selective breeding studies was utilised to generate selection gradient values outlining the relationship between each characterisation metric and the quality score of samples within the experimental population, which serves as a proxy for evolutionary fitness. This approach enables visualisation of the characterisation metric influence on sample quality, when quality can be defined in different ways depending on the product type or focal application. The importance of these statistical approaches resides in their versatility across different material types—these methods are not limited to nanocellulose materials but can be applied across different studies that involve the processing of biomass feedstock for the production of various bio-based materials or products. Overall, integration of statistical genetics concepts into the field of biomass-based material engineering has the potential to increase the depth of investigation into the factors that influence sample quality, the relationships between characterisation metrics, and creates the opportunity for incorporation of genetic data of biomass feedstock in sustainable material investigation, all of which are essential for the industrial scale-up of highly variable and difficult to quantify, and qualify, nanocellulose materials.
Data availability statement
The datasets presented in this study can be found in an online repository. The name of the repository can be found below: https://github.com/jordanpennells/PhD-sorghum.git.
Author contributions
JP: Conceptualization, Methodology, Software, Investigation, Writing - Original Draft, Writing - Reviewing and Editing, Visualization, Project administration, Funding acquisition. DM: Supervision, Funding acquisition, Writing - Reviewing and Editing.
Funding
This research was supported by the Australian Government Grains Research and Development Corporation (GRDC) Research Scholarship (Ref: UOQ1903-005RSX). The funding source had no involvement in the preparation, writing or submission of this article.
Acknowledgments
The authors gratefully acknowledge the Australian Government for their provision of a Research Training Program (RTP) scholarship, the University of Queensland for their provision of a living allowance scholarship and continental scholarship, and the Grains Research and Development Corporation (GRDC) for their support of this research through the provision of their GRDC Research Scholarship (GRS). The authors also acknowledge the contribution of Dugalunji Aboriginal Corporation (DAC) on behalf of the Indjalandji-Dhidhanu peoples through use of their equipment and in-kind support.
Conflict of interest
The authors declare that the research was conducted in the absence of any commercial or financial relationships that could be construed as a potential conflict of interest.
Publisher’s note
All claims expressed in this article are solely those of the authors and do not necessarily represent those of their affiliated organizations, or those of the publisher, the editors and the reviewers. Any product that may be evaluated in this article, or claim that may be made by its manufacturer, is not guaranteed or endorsed by the publisher.
Supplementary material
The Supplementary Material for this article can be found online at: https://www.frontiersin.org/articles/10.3389/fbioe.2022.1022948/full#supplementary-material.
References
Aguado, R., Moral, A., López, P., Mutje, P., and Tijero, A. (2016). Morphological analysis of pulps from orange tree trimmings and its relation to mechanical properties. Meas. (. Mahwah. N. J). 93, 319–326. doi:10.1016/j.measurement.2016.06.063
Ang, S., Narayanan, J. R., Kargupta, W., Haritos, V., and Batchelor, W. (2020). Cellulose nanofiber diameter distributions from microscopy image analysis: Effect of measurement statistics and operator. Cellulose 27, 4189–4208. doi:10.1007/s10570-020-03058-0
Arcari, M., Zuccarella, E., Axelrod, R., Adamcik, J., Sanchez-Ferrer, A., Mezzenga, R., et al. (2019). Nanostructural properties and twist periodicity of cellulose nanofibrils with variable charge density. Biomacromolecules 20, 1288–1296. doi:10.1021/acs.biomac.8b01706
Baruah, J., Deka, R. C., and Kalita, E. (2020). Greener production of microcrystalline cellulose (MCC) from Saccharum spontaneum (Kans grass): Statistical optimization. Int. J. Biol. Macromol. 154, 672–682. doi:10.1016/j.ijbiomac.2020.03.158
Bates, D., Mächler, M., Bolker, B., and Walker, S. (2015). Fitting linear mixed-effects models using lme4. J. Stat. Softw. 67, 1–48. doi:10.18637/jss.v067.i01
Campano, C., Balea, A., Blanco, Á., and Negro, C. (2020). A reproducible method to characterize the bulk morphology of cellulose nanocrystals and nanofibers by transmission electron microscopy. Cellulose 27, 4871–4887. doi:10.1007/s10570-020-03138-1
Chinga-Carrasco, G. (2013). Optical methods for the quantification of the fibrillation degree of bleached MFC materials. Micron 48, 42–48. doi:10.1016/j.micron.2013.02.005
Ciesielski, P. N., Pecha, M. B., Lattanzi, A. M., Bharadwaj, V. S., Crowley, M. F., Bu, L., et al. (2020). Advances in multiscale modeling of lignocellulosic biomass. ACS Sustain. Chem. Eng. 8, 3512–3531. doi:10.1021/acssuschemeng.9b07415
de Carvalho Benini, K. C. C., Ornaghi, H. L., Pereira, P. H. F., Maschio, L. J., Voorwald, H. J. C., and Cioffi, M. O. H. (2021). Survey on chemical, physical, and thermal prediction behaviors for sequential chemical treatments used to obtain cellulose from Imperata Brasiliensis. J. Therm. Anal. Calorim. 143, 73–85. doi:10.1007/s10973-019-09221-5
Demir, E. C., Benkaddour, A., Aldrich, D. R., McDermott, M. T., Kim, C. I., and Ayranci, C. (2022). A predictive model towards understanding the effect of reinforcement agglomeration on the stiffness of nanocomposites. J. Compos. Mat. 56, 1591–1604. doi:10.1177/00219983221076639
Desmaisons, J., Boutonnet, E., Rueff, M., Dufresne, A., and Bras, J. (2017). A new quality index for benchmarking of different cellulose nanofibrils. Carbohydr. Polym. 174, 318–329. doi:10.1016/j.carbpol.2017.06.032
Espinosa, E., Rol, F., Bras, J., and Rodríguez, A. (2020). Use of multi-factorial analysis to determine the quality of cellulose nanofibers: Effect of nanofibrillation treatment and residual lignin content. Cellulose 27, 10689–10705. doi:10.1007/s10570-020-03136-3
Ferdous, T., Ni, Y., Quaiyyum, M. A., Uddin, M. N., and Jahan, M. S. (2021). Non-Wood fibers: Relationships of fiber properties with pulp properties. ACS Omega 6, 21613–21622. doi:10.1021/acsomega.1c02933
Gao, Y., Hua, J., and Chen, G., (2019). Bi-directional prediction of wood fiber production using the combination of improved particle swarm optimization and support vector machine. BioResources 14, 7229–7246. doi:10.15376/biores.14.31.7229-7246
García-Gonzalo, E., Santos, A. J. A., Martínez-Torres, J., Pereira, H., Simoes, R., Garcia-Nieto, P. J., et al. (2016). Prediction of five softwood paper properties from its density using support vector machine regression techniques. BioResources 11, 1892–1904. doi:10.15376/biores.11.1.1892-1904
Gu, F., Wang, W., Cai, Z., Xue, F., Jin, Y., and Zhu, J. Y. (2018). Water retention value for characterizing fibrillation degree of cellulosic fibers at micro and nanometer scales. Cellulose 25, 2861–2871. doi:10.1007/s10570-018-1765-8
Hayes, D. J. M. (2012). Development of near infrared spectroscopy models for the quantitative prediction of the lignocellulosic components of wet Miscanthus samples. Bioresour. Technol. 119, 393–405. doi:10.1016/j.biortech.2012.05.137
Hisham, S., Kadirgama, K., Ramasamy, D., Samykano, M., Harun, W. S. W., and Saidur, R. (2020). Statistical approach for prediction of thermal properties of CNC and CNC-CuO nanolubricant using Response Surface Methodology (RSM). IOP Conf. Ser. Mat. Sci. Eng. 788, 012016. doi:10.1088/1757-899X/788/1/012016
International Organization for Standardization (2004). ISO 5269-2:2004 Pulps — preparation of laboratory sheets for physical testing — Part 2: Rapid-Köthen method. Geneva, Switzerland: International Organization for Standardization.
Kriechbaum, K., Munier, P., Apostolopoulou-Kalkavoura, V., and Lavoine, N. (2018). Analysis of the porous architecture and properties of anisotropic nanocellulose foams - a novel approach to assess the quality of cellulose nanofibrils (CNFs). ACS Sustain. Chem. Eng. 6, 11959–11967. doi:10.1021/acssuschemeng.8b02278
Legland, D., and Beaugrand, J. (2013). Automated clustering of lignocellulosic fibres based on morphometric features and using clustering of variables. Ind. Crops Prod. 45, 253–261. doi:10.1016/j.indcrop.2012.12.021
Lengowski, E. C., Magalhães, W. L. E., Nisgoski, S., Muniz, G. I. B. d., Satyanarayana, K. G., and Lazzarotto, M. (2016). New and improved method of investigation using thermal tools for characterization of cellulose from eucalypts pulp. Thermochim. Acta 638, 44–51. doi:10.1016/j.tca.2016.06.010
Lim, W. L., Gunny, A. A. N., Kasim, F. H., and Gopinath, S. C. B. (2022). Cellulose nanocrystal production from bleached rice straw pulp by combined alkaline and acidic deep eutectic solvents treatment: Optimization by response surface methodology. Biomass Convers. biorefin. 12, 25–33. doi:10.1007/s13399-021-01654-z
Lin, B., He, B., Liu, Y., and Ma, L. (2014). Correlation analysis for fiber characteristics and strength properties of softwood kraft pulps from different stages of a bleaching fiber line. BioResources 9, 5024–5033. doi:10.15376/biores.9.3.5024-5033
Mairpady, A., Mourad, A. H. I., and Mozumder, M. S. (2021). Statistical and machine learning-driven optimization of mechanical properties in designing durable hdpe nanobiocomposites. Polym. (Basel) 13, 3100. doi:10.3390/polym13183100
Malucelli, L. C., Matos, M., Jordão, C., Lacerda, L. G., Carvalho Filho, M. A. S., and Magalhaes, W. L. E. (2018). Grinding severity influences the viscosity of cellulose nanofiber (CNF) suspensions and mechanical properties of nanopaper. Cellulose 25, 6581–6589. doi:10.1007/s10570-018-2031-9
Motohashi, R., and Hanasaki, I. (2019). Characterization of aqueous cellulose nanofiber dispersions from microscopy movie data of Brownian particles by trajectory analysis. Nanoscale Adv. 1, 421–429. doi:10.1039/c8na00214b
Nardi, R., Silveira, M. H. L., and Siqueira, G. (2020). Understanding important aspects of spray drying microfibrillated cellulose through statistical analysis. Cellulose 27, 10707–10717. doi:10.1007/s10570-020-03392-3
Pennells, J., Cruickshank, A., Godwin, I. D., and Martin, D. J. (2021). Sorghum as a novel biomass for the sustainable production of cellulose nanofibers. Ind. Crops Prod. 171, 113917. doi:10.1016/j.indcrop.2021.113917
Pennells, J., Godwin, I. D., Amiralian, N., and Martin, D. J. (2020). Trends in the production of cellulose nanofibers from non-wood sources. Cellulose 27, 575–593. doi:10.1007/s10570-019-02828-9
Pennells, J., Mellor, V., and Martin, D. J. (2022). Novel methodology to visualize biomass processing sustainability & cellulose nanofiber product quality. ACS Sustain. Chem. Eng. 10, 3623–3632. doi:10.1021/acssuschemeng.1c08476
Postek, M. T., Vladár, A., Dagata, J., Farkas, N., Ming, B., Wagner, R., et al. (2011). Development of the metrology and imaging of cellulose nanocrystals. Meas. Sci. Technol. 22, 024005. doi:10.1088/0957-0233/22/2/024005
Prabu, G. T. V., Guruprasad, R., Sundaramoorthy, C., and Vigneshwaran, N. (2022). Process optimization and modelling the BET surface area of electrospun cellulose acetate nanofibres using response surface methodology. Bull. Mat. Sci. 45, 133–137. doi:10.1007/s12034-022-02712-6
Ramachandran, K., Kadirgama, K., Ramasamy, D., Azmi, W., and Tarlochan, F. (2017). Investigation on effective thermal conductivity and relative viscosity of cellulose nanocrystal as a nanofluidic thermal transport through a combined experimental – statistical approach by using Response Surface Methodology. Appl. Therm. Eng. 122, 473–483. doi:10.1016/j.applthermaleng.2017.04.049
Ramakrishna, S., Zhang, T. Y., Lu, W. C., Qian, Q., Low, J. S. C., Yune, J. H. R., et al. (2019). Materials informatics. J. Intell. Manuf. 30, 2307–2326. doi:10.1007/s10845-018-1392-0
Rodrigues, A. C., Fontão, A. I., Coelho, A., Leal, M., Soares da Silva, F. A., Wan, Y., et al. (2019). Response surface statistical optimization of bacterial nanocellulose fermentation in static culture using a low-cost medium. N. Biotechnol. 49, 19–27. doi:10.1016/j.nbt.2018.12.002
Rojsitthisak, P., Khunthon, S., Noomun, K., and Limpanart, S. (2017). Response surface method to optimize the preparation of carboxymethyl cellulose from corn peel agricultural waste. ScienceAsia 43, 8–14. doi:10.2306/scienceasia1513-1874.2017.43.008
Sankhla, S., Sardar, H. H., and Neogi, S. (2021). Greener extraction of highly crystalline and thermally stable cellulose micro-fibers from sugarcane bagasse for cellulose nano-fibrils preparation. Carbohydr. Polym. 251, 117030. doi:10.1016/j.carbpol.2020.117030
Schenker, M., Schoelkopf, J., Gane, P., and Mangin, P. (2018). Quantification of flow curve hysteresis data - a novel tool for characterising microfibrillated cellulose (MFC) suspensions. Appl. Rheol. 28, 1–13. doi:10.3933/ApplRheol-28-22945
Soleimanzadeh, H., Mirzaee, F., Samaneh, B., Salari, D., Olad, A., and Ostadrahimi, A. (2022). Optimization of cellulose extraction process from sugar beet pulp and preparation of its nanofibers with choline chloride – lactic acid deep eutectic solvents. Biomass Convers. biorefin. doi:10.1007/s13399-022-02885-4
Uetani, K., Kasuya, K., Koga, H., and Nogi, M. (2021). Direct determination of the degree of fibrillation of wood pulps by distribution analysis of pixel-resolved optical retardation. Carbohydr. Polym. 254, 117460. doi:10.1016/j.carbpol.2020.117460
Varanasi, S., He, R., and Batchelor, W. (2013). Estimation of cellulose nanofibre aspect ratio from measurements of fibre suspension gel point. Cellulose 20, 1885–1896. doi:10.1007/s10570-013-9972-9
Zhu, H., Luo, W., Ciesielski, P. N., Fang, Z., Zhu, J. Y., Henriksson, G., et al. (2016). Wood-derived materials for green electronics, biological devices, and energy applications. Chem. Rev. 116, 9305–9374. doi:10.1021/acs.chemrev.6b00225
Keywords: cellulose nanofibres, nanopaper, statistical modelling, statistical genetics, heritability, hierarchical clustering, selection gradient
Citation: Pennells J and Martin DJ (2022) Statistical genetics concepts in biomass-based materials engineering. Front. Bioeng. Biotechnol. 10:1022948. doi: 10.3389/fbioe.2022.1022948
Received: 19 August 2022; Accepted: 12 September 2022;
Published: 04 October 2022.
Edited by:
Han-Min Wang, Tianjin University of Science and Technology, ChinaReviewed by:
Qinghua Meng, National Center for Nanoscience and Technology (CAS), ChinaXianzhi Meng, The University of Tennessee, United States
Copyright © 2022 Pennells and Martin. This is an open-access article distributed under the terms of the Creative Commons Attribution License (CC BY). The use, distribution or reproduction in other forums is permitted, provided the original author(s) and the copyright owner(s) are credited and that the original publication in this journal is cited, in accordance with accepted academic practice. No use, distribution or reproduction is permitted which does not comply with these terms.
*Correspondence: Jordan Pennells, am9yZGFuLnBlbm5lbGxzQHVxLm5ldC5hdQ==