 Giuseppe C. A. Caridi†
 Elena Torta†
 Valentina Mazzi
 Claudio Chiastra
 Alberto L. Audenino
 Umberto Morbiducci
 Diego Gallo*
- PoliToBIOMed Lab, Department of Mechanical and Aerospace Engineering, Politecnico di Torino, Turin, Italy
An experimental set-up is presented for the in vitro characterization of the fluid dynamics in personalized phantoms of healthy and stenosed coronary arteries. The proposed set-up was fine-tuned with the aim of obtaining a compact, flexible, low-cost test-bench for biomedical applications. Technically, velocity vector fields were measured adopting a so-called smart-PIV approach, consisting of a smartphone camera and a low-power continuous laser (30 mW). Experiments were conducted in realistic healthy and stenosed 3D-printed phantoms of left anterior descending coronary artery reconstructed from angiographic images. Time resolved image acquisition was made possible by the combination of the image acquisition frame rate of last generation commercial smartphones and the flow regimes characterizing coronary hemodynamics (velocities in the order of 10 cm/s). Different flow regimes (Reynolds numbers ranging from 20 to 200) were analyzed. The smart-PIV approach was able to provide both qualitative flow visualizations and quantitative results. A comparison between smart-PIV and conventional PIV (i.e., the gold-standard experimental technique for bioflows characterization) measurements showed a good agreement in the measured velocity vector fields for both the healthy and the stenosed coronary phantoms. Displacement errors and uncertainties, estimated by applying the particle disparity method, confirmed the soundness of the proposed smart-PIV approach, as their values fell within the same range for both smart and conventional PIV measured data (≈5% for the normalized estimated displacement error and below 1.2 pixels for displacement uncertainty). In conclusion, smart-PIV represents an easy-to-implement, low-cost methodology for obtaining an adequately robust experimental characterization of cardiovascular flows. The proposed approach, to be intended as a proof of concept, candidates to become an easy-to-handle test bench suitable for use also outside of research labs, e.g., for educational or industrial purposes, or as first-line investigation to direct and guide subsequent conventional PIV measurements.
1 Introduction
In the last two decades, particle image velocimetry (PIV) has become a standard technique for the reliable in vitro quantitative characterization of fluid dynamics in implantable devices such as prosthetic heart valves (Manning et al., 2003; Leo et al., 2006; Dasi et al., 2007; Kaminsky et al., 2007; Dasi et al., 2008; Ge et al., 2008; Hasler et al., 2016; Hasler and Obrist, 2018; Becsek et al., 2020) and stents (Charonko et al., 2009; Charonko et al., 2010; Raben et al., 2015; Brindise et al., 2017; Freidoonimehr et al., 2021a), in blood recirculating devices such as extracorporeal membrane oxygenators, mechanical circulatory supports, blood pumps and hemodialysis systems (Giridharan et al., 2011; Raben et al., 2016; Malinauskas et al., 2017), as well as in idealized and realistic phantoms of healthy and diseased vessels (Bluestein et al., 1997; Brunette et al., 2008; Ford et al., 2008; Kefayati and Poepping, 2013; Büsen et al., 2017; Shintani et al., 2018; DiCarlo et al., 2019; Salman et al., 2019; Medero et al., 2020; Freidoonimehr et al., 2021b).
Despite the proven capability of conventional PIV test benches in characterizing internal flows, their adoption in both research and industrial laboratories is hampered by the cost of the components (rough order of magnitude estimate of 100 k€). In recent years, attempts have been made to propose alternative PIV solutions based on low-cost components, thus overcoming cost-related barriers (Cierpka et al., 2016; Aguirre-Pablo et al., 2017; Käufer et al., 2021; Minichiello et al., 2021). In this respect, the imaging system embedded in smartphones have captured the attention of researchers as potential substitute of high-speed cameras adopted in conventional PIV, leveraging the latest smartphone technological advancements and their relatively low cost. The first generalized attempt of a smartphone-based PIV approach defined the set-up requirements in terms of acquisition frequency and optical magnification as a function of the flow velocity, limiting the applicability to low velocity flows or coarse spatial resolutions (Cierpka et al., 2016). Subsequently, the use of smartphone-based PIV systems was extended to 3D measurements, synchronizing the acquisition from four smartphones in tomo-PIV configuration (Aguirre-Pablo et al., 2017).
Further drawbacks affecting conventional PIV systems are related to the use of a high-power (double-) pulsed laser to illuminate the volume of interest, usually characterized by high costs, high energy consumption and burdensome maintenance. Moreover, such lasers require complex and expensive set-ups to guarantee synchronization (Chételat and Kim, 2002; Willert et al., 2010, among others) and safety requirements (EN 207 in EU; ANSI z136 in US). Regarding the latter, among the most commonly adopted energy sources for flow fields illumination in conventional PIV systems are 200 mJ pulsed lasers, belonging to Class 4, which is the most hazardous class of laser according to the international standard IEC 60825-1. These limiting factors motivated the adoption of less expensive and less hazardous low-energy light sources, such as high-performance LEDs (Willert et al., 2010; Aguirre-Pablo et al., 2017) or continuous wave (cw) lasers (Cierpka et al., 2016).
Taken together, these considerations underline the theoretical benefits offered by a PIV system relying on the combined use of smartphone cameras and low-energy light sources in terms of costs, simplicity, and safety. In the followings, we will refer to such a PIV system as “smart-PIV”, as introduced in a recent study presenting a smartphone-based PIV dedicated software application (Cierpka et al., 2021). To date, the practical feasibility, range of applicability and related performances of a smart-PIV approach in biomedical applications have not yet been clearly defined. Whilst Cierpka et al., 2016 demonstrated the feasibility of PIV measurements of planar velocity vector fields generated by a free water jet using a smartphone camera with acquisition rate of 240 Hz and a cw laser in absence of synchronization systems, the adoption of a smart-PIV approach for cardiovascular flows-related applications is still unexplored. The rapid development of modern smartphone cameras has recently led to an increase in the frame rate up to 1.920 Hz, thus enabling their use for velocities in the order of 80–100 cm/s (Nichols et al., 2011). Accordingly, the objective of the present work was to demonstrate the feasibility of a smart-PIV approach to the characterization of arterial flows in realistic physical models. To this aim, a last generation commercial smartphone was used as image acquisition device in combination with a low-power cw laser to measure the velocity vector field in realistic phantoms of healthy and stenosed coronary arteries at various flow regimes. The fluid dynamics characterization obtained adopting the smart-PIV system was then compared with the results obtained by adopting conventional PIV, which is considered the gold-standard experimental technique for bioflows characterization. The study was completed by the analysis of the uncertainty affecting the measured flow fields.
2 Materials and methods
2.1 PIV measurements of coronary flows: Reference framework
A survey of the literature on PIV characterizations of coronary flows was preliminarily conducted to delineate the reference framework for the operating conditions to be set in the present study. The results of the survey on conventional PIV measurements in coronary artery phantoms are summarized in Table 1, where basic information on flow regimes, adopted PIV settings, and indication whether the studies were carried out relying on a scale factor according to the Buckingham theorem of fluid dynamics similitude (Buckingham, 1914) are detailed. From Table 1, it emerges that previous investigations considered coronary flow regimes characterized by Reynolds numbers at the inflow section of the coronary phantoms
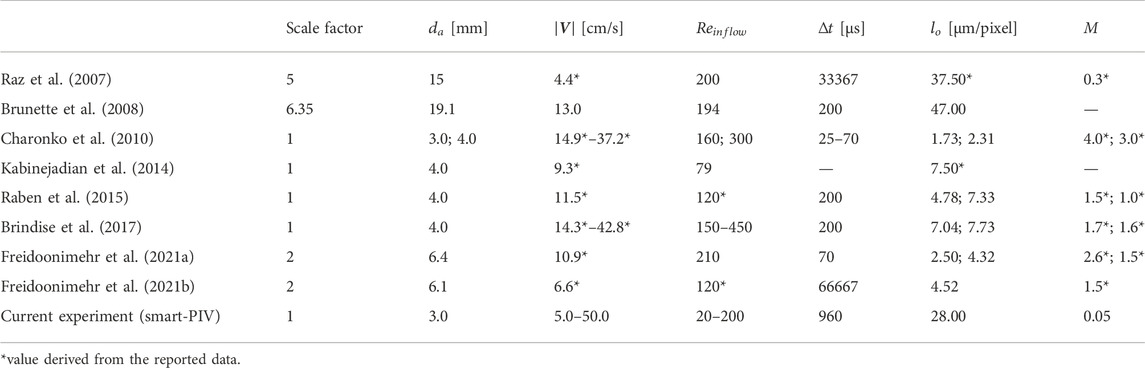
TABLE 1. Flow parameters and PIV spatial and temporal resolutions adopted in in vitro PIV experiments on coronary flows.
2.2 Basic principles of conventional PIV and smart-PIV
According to the principle of PIV, the measured velocity is determined by the ratio of the ensemble particle displacement in the object plane in physical space,
A value of 10–15 pixel has been recommended in the literature for the image particle displacement (Raffel et al., 2018). Therefore, in the dual-frame modality at the basis of conventional PIV,
Unlike conventional PIV, the smart-PIV system is based on a continuous single-frame modality for image acquisition similar to the one adopted for high-speed camera acquisitions (Hain and Kähler, 2007). In single-frame modality, particle displacement in the physical space is given by
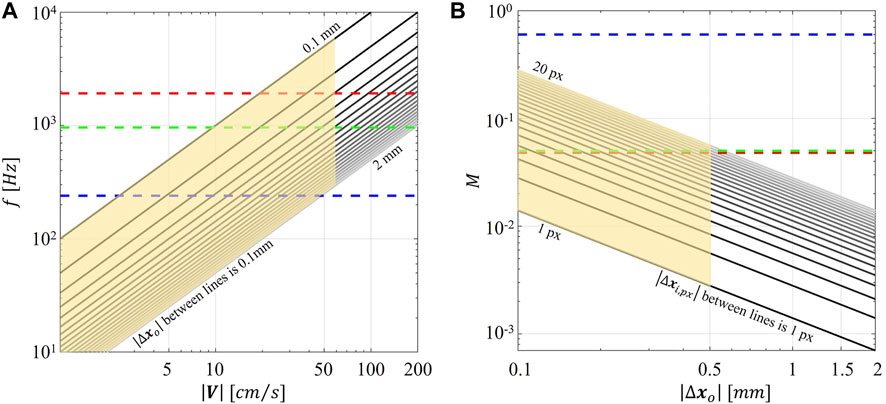
FIGURE 1. (A) Magnitude of particle displacement in the object plane (
2.3 Smart-PIV and conventional PIV set-ups
PIV measurements were performed in two flexible silicone phantoms manufactured by Elastrat (Geneva, Switzerland). The first phantom represented a patient specific replica of a 3 mm healthy left anterior descending (LAD) coronary artery (Figure 2A), reconstructed from angiographic images, as detailed elsewhere (Lodi Rizzini et al., 2020). The second phantom was obtained starting from the healthy LAD geometry, where a 67% diameter stenosis was artificially generated by imposing a local reshaping of the lumen geometry through the open-source tool morphMan (Kjeldsberg et al., 2019) (Figure 2B). The two phantoms were in scale 1:1. The refractive index of the adopted material was equal to 1.43.
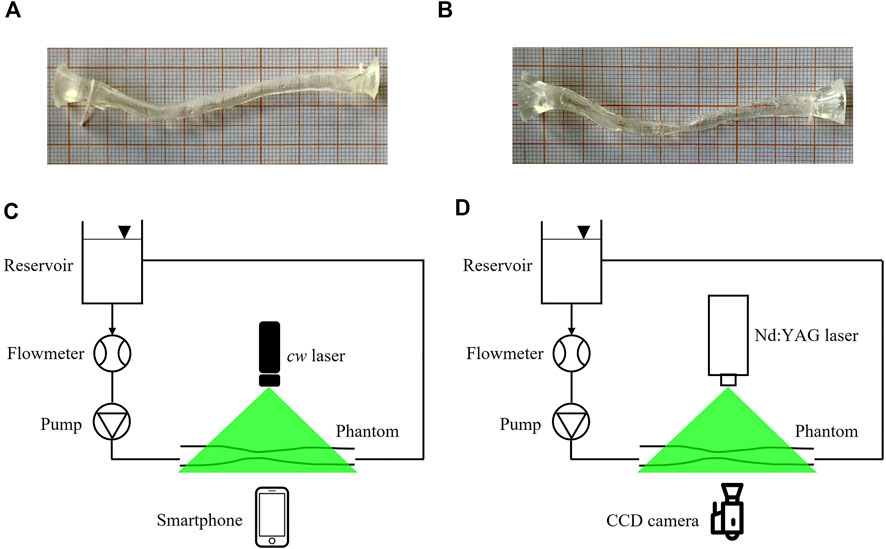
FIGURE 2. (A,B) pictures of the healthy LAD (A) and stenosed LAD (B) phantoms, scale 1:1. (C,D) experimental set-up for smart-PIV (C) and conventional PIV (D) experiments. cw: continuous wave; CCD: charge-coupled device.
The sketch of the two experimental set-up configurations used for flow visualizations and PIV measurements is presented in Figures 2C, D. The two configurations adopted the same hydraulic circuit, where 500 ml of working fluid was handled by a DC current pump (RS Components, Corby, United Kingdom) with a nominal power of 1.62 W controlled by a power supply to assure a constant flow rate. One reservoir at atmospheric pressure decoupled the upstream pumping system from the phantom. Flow rate measurements were obtained by an in-line ultrasound flowmeter (Transonic, Ithaca, United States) characterized by an accuracy of ±10% (Figures 2C, D). The adopted working fluid was a glycerol-water (40:60 in volume) solution with a dynamic viscosity of 3.7 cP (Segur and Oberstar, 1951). Polyamide poly (methyl methacrylate) particles (density 1030 kg/m3, diameter 60 µm) were used.
PIV measurements were carried out in steady-state conditions at different flow regimes in both healthy and stenosed LAD phantoms (Doucette et al., 1992; Kessler et al., 1998; Johnson et al., 2008). The investigated flow regimes are summarized in Table 2, where the Reynolds numbers evaluated at the inflow section of the phantoms (
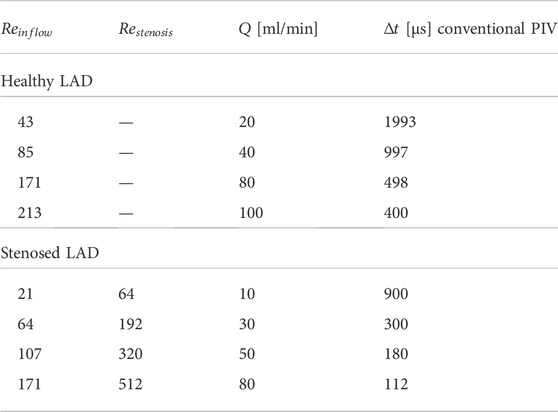
TABLE 2. Inlet flow rate (
In the smart-PIV set-up, the smartphone Samsung Galaxy S9+ was adopted as image capture system because of its acquisition frame rate (
In the conventional PIV set-up, the image capture system was composed by a HiSense Zyla camera (CMOS, 2560 × 2160 pixels) with a macro-objective Zeiss Milvus 50 mm (
For comparison purposes, the imaging parameters in smart-PIV and conventional PIV measurements were selected to guarantee the same investigated field of view (Table 3).
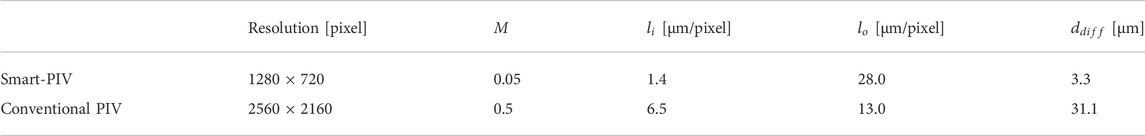
TABLE 3. Imaging parameters of smart and conventional PIV: resolution, magnification factor (
2.4 Image processing
Smart-PIV and conventional PIV acquired raw images were preliminarily pre-processed in MATLAB environment (MathWorks, Natick, MA, United States) to remove background noise by subtracting the mean intensity value of the PIV image sequence. For flow visualization purposes, seeding particle trajectories were reconstructed over 180 consecutive frames acquired with the smart-PIV approach. Since seeding particle motion between two consecutive acquired frames is sufficiently small, the reconstruction of particle trajectories can be done by calculating the root mean square intensity values of the pre-processed images along the frame series. This method allowed to obtain similar results to those given by the common technique based on long exposure imaging (Merzkirch, 2012).
The velocity vector fields were extracted applying the ensemble correlation method to the pre-processed images, a method indicated for analyzing sparsely seeded steady flows (Santiago et al., 1998; Meinhart et al., 2000). Technically, the ensemble correlation is based on the analysis of a series of sparsely seeded images and on the calculation of their correlation matrices. These matrices are then averaged to give a high-resolution velocity vector field characterized by a signal-to-noise ratio which can be obtained by the standard cross-correlation only through a coarser resolution (Meinhart et al., 2000). The ensemble correlation was performed adopting the toolbox PIVlab (Thielicke and Stamhuis, 2014). Interrogation windows (IWs) of 16 and 24 pixels were considered on smart-PIV and on conventional PIV acquired images, respectively, thus obtaining IWs in the object plane of approximately the same dimension (0.50 and 0.51 mm, respectively). A 50% window overlapping was applied.
2.5 Error and uncertainty estimation
PIV measurements are affected by uncertainty. The sources of such an uncertainty can be identified in 1) the components of the acquisition system, 2) the peculiar features of the analyzed flow field (e.g., high velocity gradients and out-of-plane motion), and 3) the image processing strategy. For a comprehensive discussion, the reader is referred to Raffel et al., 2018 and Sciacchitano, 2019, among others. Since the field of view and adopted processing strategy were the same in smart-PIV and in conventional PIV approaches, the analysis performed in this study is intended to highlight the uncertainty associated with those smart-PIV components that are not part of the conventional PIV system.
In this study, the particle disparity method (Sciacchitano et al., 2013) was employed to evaluate and compare the budget of estimated error and uncertainty affecting smart-PIV and conventional PIV measurements in the LAD phantoms. Technically, particle disparity is an a posteriori method that quantifies from images the uncertainty affecting particles displacement, i.e. the major contributor to the velocity uncertainty (Sciacchitano, 2019). In detail, the budget of uncertainty associated with PIV velocity measurements can be estimated adopting a Taylor series expansion for evaluating the single contributions to uncertainty given by the quantities expressing fluid velocity (Sciacchitano, 2019). As detailed in Section 2.2, these are the ensemble displacement of a group of tracing particles measured in the image plane
Let us consider two consecutive frames
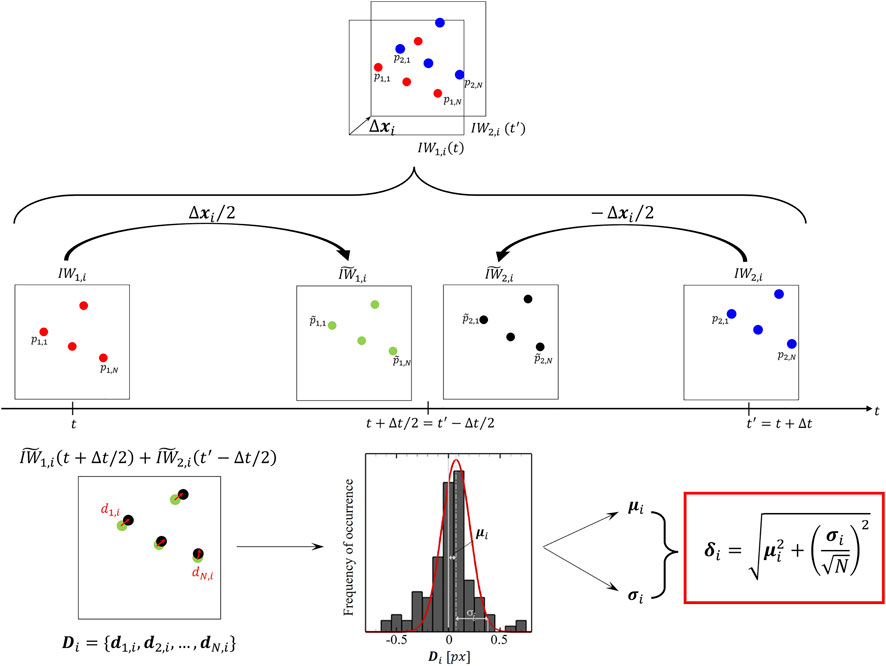
FIGURE 3. Schematic of the particle disparity method applied to the i-th couple of interrogation window
After repeating the above-described procedure over the F interrogation windows, an estimated error field with the same dimensions of the input velocity field can be obtained. Furthermore, here the displacement uncertainty
where k is a coverage factor whose value is around 2.1, to achieve 95% confidence level for small N values as occurring in PIV interrogation boxes (Coleman and Steele, 2009).
3 Results
3.1 Flow visualizations
Two examples of pre-processed images acquired with smart-PIV and conventional PIV are displayed in Figure 4.
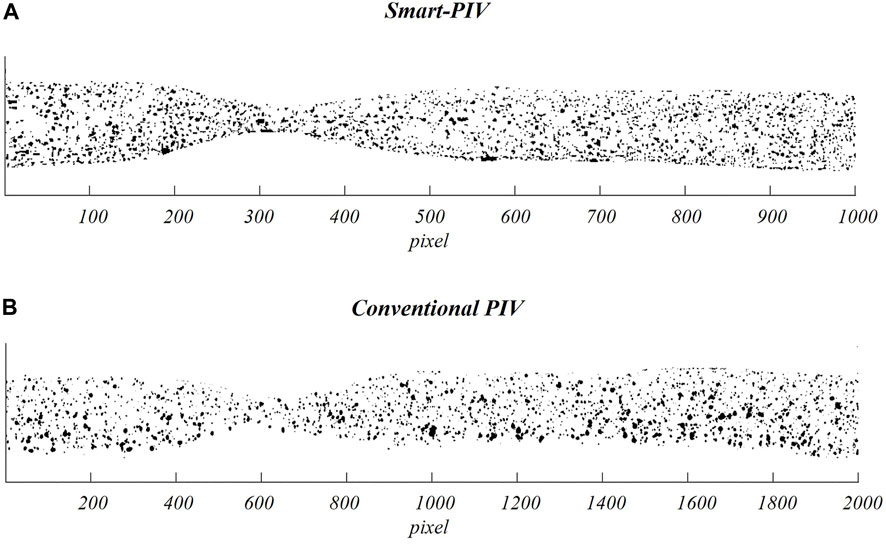
FIGURE 4. Examples of pre-processed images (i.e., after subtraction of the mean intensity value of the PIV image sequence) acquired on the stenosed LAD phantom adopting smart-PIV (A) and conventional PIV (B) systems.
The smart-PIV images were processed for flow visualization purposes. The reconstructed trajectories of seeding particles unveil the main flow features within the healthy and stenosed LAD phantoms. In detail, particle trajectories evolved unperturbed in the healthy LAD phantom at all investigated flow regimes, as expected (Figure 5). For this reason, Figure 5 depicts only the cases at
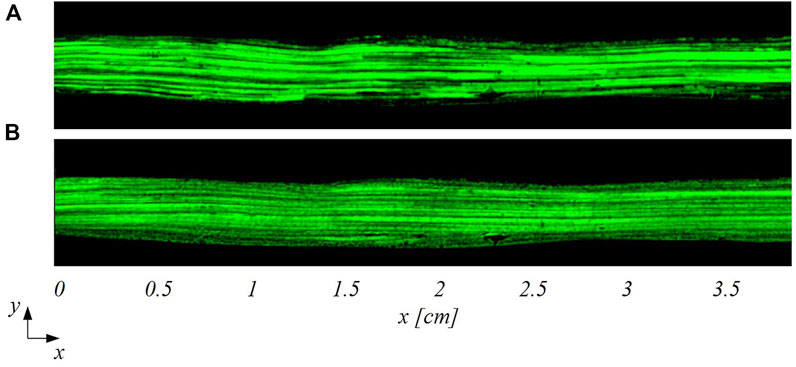
FIGURE 5. Particle trajectories-based visualization of the flow patterns in the healthy LAD at two different inflow Reynolds numbers: (A)
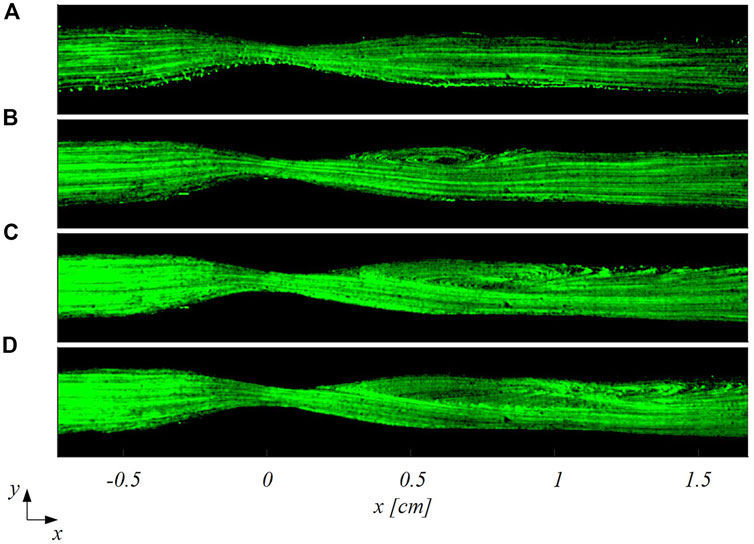
FIGURE 6. Particle trajectories-based visualization of the flow patterns in the stenosed LAD at four different inflow Reynolds numbers: (A)
3.2 Comparison between smart-PIV and conventional PIV velocity measurements
In all models, the streamwise velocity component (
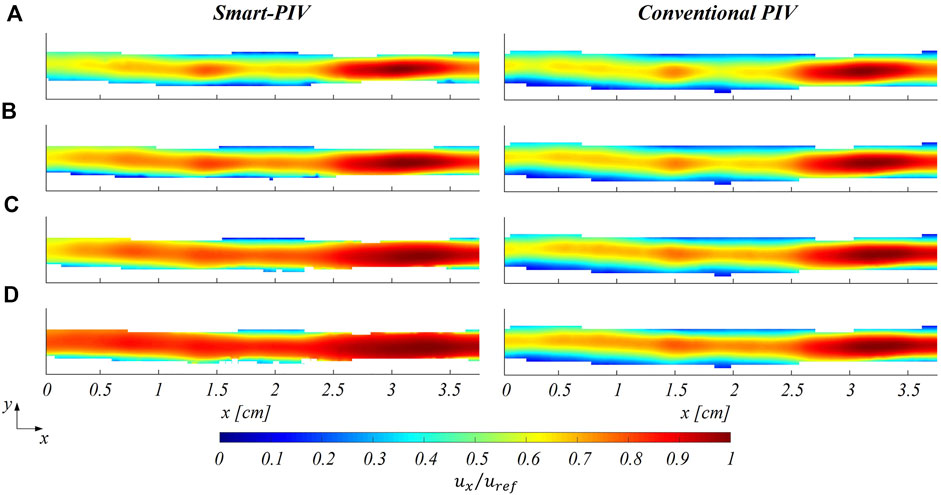
FIGURE 7. Normalized mean streamwise velocity contours for smart (left panel) and conventional (right panel) PIV at four different flow regimes: (A)
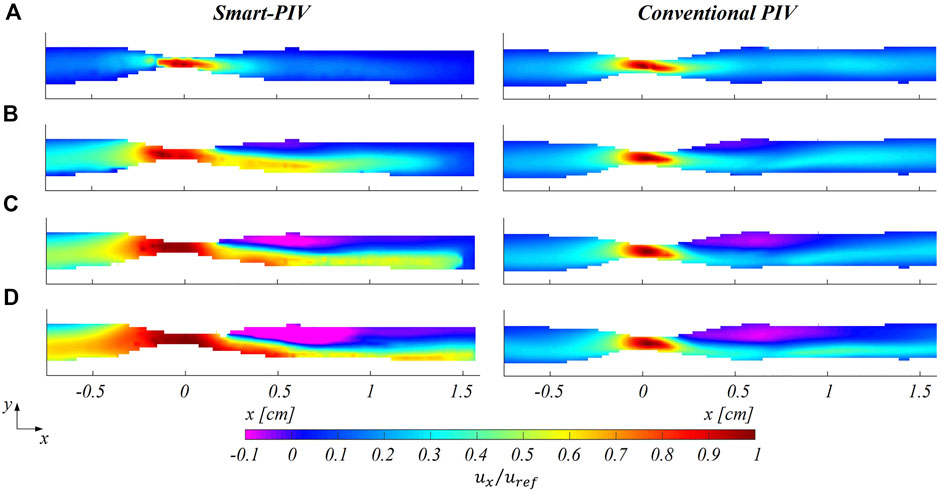
FIGURE 8. Normalized mean streamwise velocity contours for smart (left panel) and conventional (right panel) PIV at four different flow regimes: (A)
As expected, an underestimation of the highest velocity values affected smart-PIV measurements, when compared to conventional PIV: in the healthy phantom and in the proximal segment of the stenosed phantom, such an underestimation was bounded below the 20% and increased with the
3.3 Error and uncertainty estimation
The distribution of the estimated displacement errors along the streamwise direction
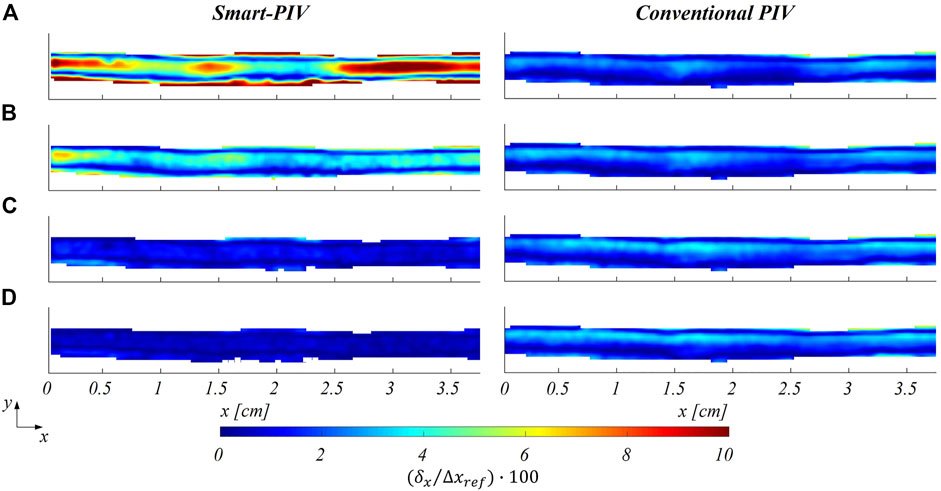
FIGURE 9. Color maps of smart (left panel) and conventional (right panel) PIV displacement errors along the streamwise flow direction
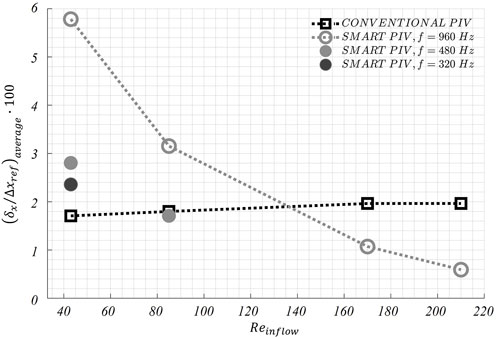
FIGURE 10. Variations of the average displacement error along the streamwise direction
The distribution of normalized estimated displacement errors along the streamwise direction in the stenosed LAD phantom is reported in Figure 11. Smart-PIV measurements presented normalized estimated displacement errors lower than conventional PIV, with the only exception of
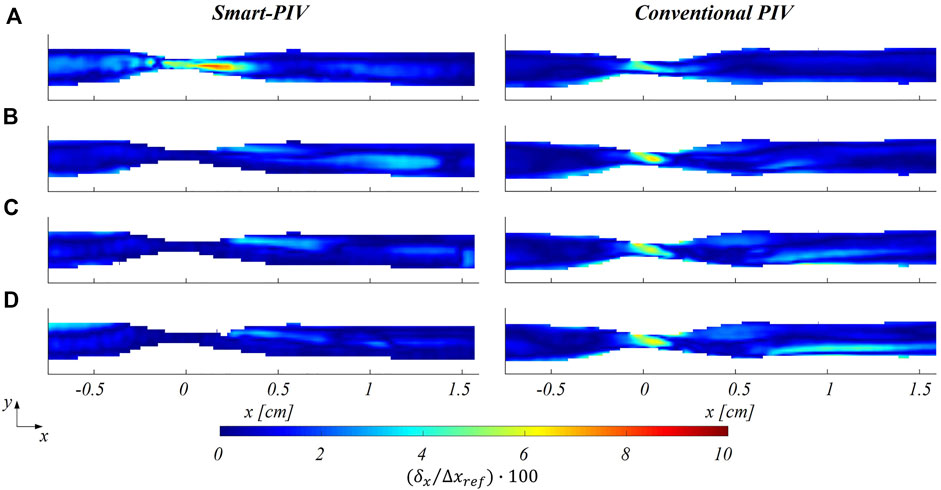
FIGURE 11. Color maps of smart (left panel) and conventional (right panel) PIV displacement error along the streamwise direction
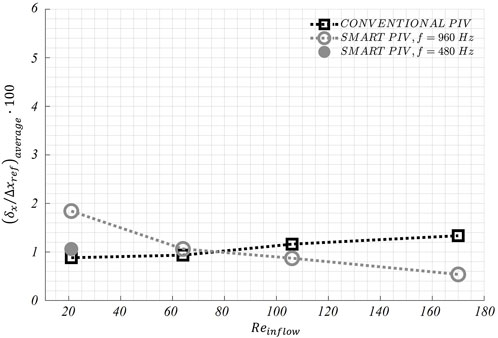
FIGURE 12. Variations of the average displacement error along the streamwise direction
In addition, the uncertainty affecting particle displacements
The analysis of the normalized estimated displacement errors for the spanwise velocity component is reported in Supplementary Figures S10, S11. Normalized estimated displacement errors exhibit similar distribution as for the streamwise velocity, but they reach higher values, mainly due to the small displacements occurring along this flow direction for both healthy and stenosed LAD phantoms.
4 Discussion
4.1 Summary and implications of the findings
The developed smart-PIV set-up successfully lowered the barriers of PIV measurements in cardiovascular applications in terms of energy consumption, costs, maintenance, and safety. Leveraging cameras embedded inside commercial smartphones and low-power light sources, 2D PIV measurements were previously performed on a free water jet by Cierpka et al., 2016 recording images at 240 Hz with a 1280 × 720 pixels resolution: all factors limiting the application to moderate flow velocities and coarse spatial resolutions. Here we demonstrated that PIV measurements performed with a test bench adopting cameras embedded inside commercial smartphones and low-power cw light sources can be successfully extended to cardiovascular applications. The proposed set-up decreased drastically the hardware investment from roughly one hundred thousand euros of the conventional PIV set-up, where high speed cameras, a high-energy laser source and a synchronization unit were adopted, to a few thousand euros for the smart-PIV. As a further advantage, the cw laser used in the smart-PIV system is safer and less hazardous than pulsed lasers of conventional PIV systems, requiring less precautions to be adopted for its use as it belongs to Class 3B according to the classification of the international standard IEC 60825-1. These advantages make the smart-PIV approach more portable and usable in a wider context, enabling its use for low-cost and practical investigations for educational, industrial and research purposes. Moreover, it may prove useful as a first-line investigation, to direct and guide subsequent conventional PIV measurements.
The findings of this study proved the ability of smart-PIV technique in capturing the main coronary flow features, such as stenotic jets and post-stenotic recirculation regions (Figure 5 and Figure 8). The performance of the proposed approach, its requirements and range of applicability were defined and evaluated against conventional PIV measurements. Smartphone cameras with image acquisition frequency of 960 Hz were able to provide qualitative flow pattern visualizations and quantitative 2D velocity vector fields in realistic coronary artery phantoms in substantial agreement with conventional PIV measurements.
The normalized estimated displacement errors affecting smart-PIV and conventional PIV measurements, evaluated with the particle disparity method, were comparable at the flow regime with the highest
4.2 Current technical constraints of smart-PIV set-up and future outlook
Our findings suggest that two main technical constraints must be taken into account when planning smart-PIV measurements.
First, the maximum magnification of the field of view is fixed, impacting the size of the interrogation area and the size of the flow structures to be resolved. Because of the fixed focal length lenses embedded in commercial smartphones, the only way to increase the magnification M of the field of view when higher resolutions are needed is by reducing the distance between the smartphone camera and the measurement plane, until the out-of-focus limit. In comparing the performance of smart-PIV vs. conventional PIV, it should be mentioned that even though in the former the magnification M can be more than one order of magnitude smaller than the one usually encountered in the latter, the final image resolution was comparable for both PIV systems, due to the larger pixel size in the conventional PIV camera, ranging from 5 to 10 µm (Table 3).
Second, the combination of the (fixed) maximum acquisition frame rate of the smartphone camera and the use of a continuous light source resulted in particle blurring in correspondence of the stenosis (Supplementary Figures S4, S7), with the consequence of underestimating local velocity values (Figure 8) starting from 40 cm/s. To reduce particle blurring, a possibility could be offered by the adoption of a cw laser pulsed by a frequency generator, as suggested by Cierpka et al., 2021, or a pulsed low-power light source (Aguirre-Pablo et al., 2017; Käufer et al., 2021; Minichiello et al., 2021) to illuminate the image sensor for a short time, although this solution would require a synchronization unit. Particle blurring (Oh et al., 2021) could potentially be reduced also by decreasing the exposure time. Although it was not possible to manually adjust the exposure time in the “super slow modality” of the smartphone adopted in this study, it is expected it will become an available option in the near future, possibly through the adoption of specific smartphone apps. In addition, the rapid speed up in smartphone cameras technologies has recently pushed the camera image acquisition rate at 1920 Hz (e.g., Xiaomi 12 Pro, Huawei Mate 40 Pro). This technical improvement by itself is expected to positively impact the quality of the smart-PIV measurements, minimizing gradients effect and consequently reducing the noise affecting the measurements. Moreover, this would expand the range of applicability of smart-PIV measurements to flow fields characterized by high velocity (Figure 1). In this sense, in the last 6 years the image acquisition frame rate of smartphone cameras increased by a factor 8 (Cierpka et al., 2016), thus giving the possibility of scaling down of the same factor the minimum measurable displacement for a given flow velocity magnitude.
The impact of the discussed technical constraints on the measurements of high flow velocity could be mitigated by adopting scaled-up phantoms in the smart-PIV approach. As reported in Table 1, this is a common solution in the design of in vitro experiments in coronary arteries, with the practical advantage of decreasing the fluid velocity to be measured by virtue of the fluid dynamics similitude. As an example, we report here that realizing a stenosed coronary artery phantom in a scale 3:1 will result in peak velocities within the stenosis of 30 cm/s for the case at higher flow regime (
To sum up, these current technical constraints of the smart-PIV set-up should be accurately assessed to determine the flow velocity range that can be investigated and establish a priori the applicability of the smart-PIV approach, in relation to its context of use (qualitative or quantitative cardiovascular flow visualizations). Nevertheless, the findings of the present study and the current scenario in terms of expected technological development serve as a stimulus for further adoption of the smart-PIV approach in a larger variety of cardiovascular applications in the very near future. In this sense, the here adopted ensemble correlation method (Santiago et al., 1998) for velocity vector field measurement and particle disparity method (Sciacchitano et al., 2013) for the estimation of particle displacement errors and the related uncertainty has proven to be appropriate for smart-PIV applications to the characterization of steady cardiovascular flows.
4.3 Limitations
The main limitation of the developed set-up regards the fact that the shutter speed (and thus exposure time) cannot be adjusted in the “super slow motion” modality adopted here. Moreover, systematic errors can be caused by the rolling shutter of the smartphone camera, especially in regions of high velocity (Käufer et al., 2021).
5 Conclusion
This study explores for the first time the feasibility of smart-PIV measurements for the in vitro characterization of cardiovascular flows, with a focus on coronary flows. The sustainable, easy-to-manage, safe and low-cost proposed solution allows to perform qualitative and quantitative flow measurements for biomedical applications. The limited maximum image acquisition frame rate of smartphone cameras should be considered a priori to assess the applicability of the smart-PIV approach. However, the speed up in the evolution of smartphones technology is expected to overcome such limitations in the very near future, promoting a growing use of smart-PIV measurements for research, educational, and industrial purposes.
Data availability statement
The raw data supporting the conclusions of this article will be made available by the authors, without undue reservation.
Author contributions
GCAC, UM, and DG conceived and designed the study. GCAC and ET performed the experiments. GCAC, ET, VM, CC, AA, UM, and DG performed the analysis of the results. GCAC, ET, UM, and DG wrote the manuscript. All authors contributed to manuscript revision, read, and approved the submitted version.
Funding
This work has been supported by the Italian Ministry of Education, University and Research (FISR 2019_03221, CECOMES).
Acknowledgments
The authors would like to acknowledge Andrea Sciacchitano (Delft University of Technology, Delft, Netherlands) for providing support in the uncertainty analysis of the PIV measurements.
Conflict of interest
The authors declare that the research was conducted in the absence of any commercial or financial relationships that could be construed as a potential conflict of interest.
Publisher’s note
All claims expressed in this article are solely those of the authors and do not necessarily represent those of their affiliated organizations, or those of the publisher, the editors and the reviewers. Any product that may be evaluated in this article, or claim that may be made by its manufacturer, is not guaranteed or endorsed by the publisher.
Supplementary material
The Supplementary Material for this article can be found online at: https://www.frontiersin.org/articles/10.3389/fbioe.2022.1011806/full#supplementary-material
References
Aguirre-Pablo, A. A., Alarfaj, M. K., Li, E. Q., Hernández-Sánchez, J. F., and Thoroddsen, S. T. (2017). Tomographic particle image velocimetry using smartphones and colored shadows. Sci. Rep. 7, 3714. doi:10.1038/s41598-017-03722-9
Bardet, P. M., André, M. A., and Neal, D. R. (2013). “Systematic timing errors in laser-based transit-time velocimetry,” in 10th Int. Symp. On Particle Image Velocimetry PIV13, 1-3 July 2013 (Netherlands: IEEE), 1–5.
Becsek, B., Pietrasanta, L., and Obrist, D. (2020). Turbulent systolic flow downstream of a bioprosthetic aortic valve: Velocity spectra, wall shear stresses, and turbulent dissipation rates. Front. Physiol. 11, 577188. doi:10.3389/fphys.2020.577188
Bluestein, D., Niu, L., Schoephoerster, R. T., and Dewanjeet, M. K. (1997). Fluid mechanics of arterial stenosis: Relationship to the development of mural thrombus. Hobolen, NJ: Wiley.
Brindise, M. C., Chiastra, C., Burzotta, F., Migliavacca, F., and Vlachos, P. P. (2017). Hemodynamics of stent implantation procedures in coronary bifurcations: An in vitro study. Ann. Biomed. Eng. 45, 542–553. doi:10.1007/s10439-016-1699-y
Brunette, J., Mongrain, R., Laurier, J., Galaz, R., and Tardif, J. C. (2008). 3D flow study in a mildly stenotic coronary artery phantom using a whole volume PIV method. Med. Eng. Phys. 30, 1193–1200. doi:10.1016/j.medengphy.2008.02.012
Buckingham, E. (1914). On physically similar systems; illustrations of the use of dimensional equations. Phys. Rev. 4, 345–376. doi:10.1103/PhysRev.4.345
Büsen, M., Arenz, C., Neidlin, M., Liao, S., Schmitz-Rode, T., Steinseifer, U., et al. (2017). Development of an in vitro PIV setup for preliminary investigation of the effects of aortic compliance on flow patterns and hemodynamics. Cardiovasc. Eng. Technol. 8, 368–377. doi:10.1007/s13239-017-0309-y
Charonko, J., Karri, S., Schmieg, J., Prabhu, S., and Vlachos, P. (2010). In vitro comparison of the effect of stent configuration on wall shear stress using time-resolved particle image velocimetry. Ann. Biomed. Eng. 38, 889–902. doi:10.1007/s10439-010-9915-7
Charonko, J., Karri, S., Schmieg, J., Prabhu, S., and Vlachos, P. (2009). In vitro, Time-resolved PIV comparison of the effect of stent design on wall shear stress. Ann. Biomed. Eng. 37, 1310–1321. doi:10.1007/s10439-009-9697-y
Chételat, O., and Kim, K. C. (2002). Miniature particle image velocimetry system with LED in-line illumination. Meas. Sci. Technol. 13, 306–1013. doi:10.1088/0957-0233/13/7/306
Cierpka, C., Hain, R., and Buchmann, N. A. (2016). Flow visualization by mobile phone cameras. Exp. Fluids 57, 108. doi:10.1007/s00348-016-2192-y
Cierpka, C., Otto, H., Poll, C., Hüther, J., Jeschke, S., and Mäder, P. (2021). SmartPIV: Flow velocity estimates by smartphones for education and field studies. Exp. Fluids 62, 172. doi:10.1007/s00348-021-03262-z
Coleman, H. W., and Steele, W. G. (2009). Experimentation, validation, and uncertainty analysis for engineers. Hobolen, NJ: Wiley.
Dasi, L. P., Ge, L., Simon, A. H., Sotiropoulos, F., and Yoganathan, P. A. (2007). Vorticity dynamics of a bileaflet mechanical heart valve in an axisymmetric aorta. Phys. Fluids 19, 067105. doi:10.1063/1.2743261
Dasi, L. P., Murphy, D. W., Glezer, A., and Yoganathan, A. P. (2008). Passive flow control of bileaflet mechanical heart valve leakage flow. J. Biomech. 41, 1166–1173. doi:10.1016/j.jbiomech.2008.01.024
DiCarlo, A. L., Holdsworth, D. W., and Poepping, T. L. (2019). Study of the effect of stenosis severity and non-Newtonian viscosity on multidirectional wall shear stress and flow disturbances in the carotid artery using particle image velocimetry. Med. Eng. Phys. 65, 8–23. doi:10.1016/j.medengphy.2018.12.023
Ding, G., Choi, K. S., Ma, B., Kato, T., and Yuan, W. (2021). Transitional pulsatile flows with stenosis in a two-dimensional channel. Phys. Fluids 33, 034115. doi:10.1063/5.0042753
Doucette, J. W., Corl, P. D., Payne, H. M., Flynn, A. E., Goto, M., Nassi, M., et al. (1992). Validation of a Doppler guide wire for intravascular measurement of coronary artery flow velocity. Circulation 85, 1899–1911. doi:10.1161/01.CIR.85.5.1899
Ford, M. D., Nikolov, H. N., Milner, J. S., Lownie, S. P., DeMont, E. M., Kalata, W., et al. (2008). PIV-measured versus CFD-predicted flow dynamics in anatomically realistic cerebral aneurysm models. J. Biomech. Eng. 130, 021015. doi:10.1115/1.2900724
Freidoonimehr, N., Arjomandi, M., Zander, A., and Chin, R. (2021a). A novel technique towards investigating wall shear stress within the stent struts using particle image velocimetry. Exp. Fluids 62, 133. doi:10.1007/s00348-021-03230-7
Freidoonimehr, N., Chin, R., Zander, A., and Arjomandi, M. (2021b). Effect of shape of the stenosis on the hemodynamics of a stenosed coronary artery. Phys. Fluids 33, 081914. doi:10.1063/5.0058765
Ge, L., Dasi, L. P., Sotiropoulos, F., and Yoganathan, A. P. (2008). Characterization of hemodynamic forces induced by mechanical heart valves: Reynolds vs. viscous stresses. Ann. Biomed. Eng. 36, 276–297. doi:10.1007/s10439-007-9411-x
Geoghegan, P. H., Buchmann, N. A., Soria, J., and Jermy, M. C. (2013). Time-resolved PIV measurements of the flow field in a stenosed, compliant arterial model. Exp. Fluids 54, 1528. doi:10.1007/s00348-013-1528-0
Giridharan, G. A., Lederer, C., Berthe, A., Goubergrits, L., Hutzenlaub, J., Slaughter, M. S., et al. (2011). Flow dynamics of a novel counterpulsation device characterized by CFD and PIV modeling. Med. Eng. Phys. 33, 1193–1202. doi:10.1016/j.medengphy.2011.05.008
Hain, R., and Kähler, C. J. (2007). Fundamentals of multiframe particle image velocimetry (PIV). Exp. Fluids 42, 575–587. doi:10.1007/s00348-007-0266-6
Hasler, D., Landolt, A., and Obrist, D. (2016). Tomographic PIV behind a prosthetic heart valve. Exp. Fluids 57, 80. doi:10.1007/s00348-016-2158-0
Hasler, D., and Obrist, D. (2018). Three-dimensional flow structures past a bioprosthetic valve in an in-vitro model of the aortic root. PLoS One 13, e0194384. doi:10.1371/journal.pone.0194384
Johnson, K., Sharma, P., and Oshinski, J. (2008). Coronary artery flow measurement using navigator echo gated phase contrast magnetic resonance velocity mapping at 3.0 T. J. Biomech. 41, 595–602. doi:10.1016/j.jbiomech.2007.10.010
Kabinejadian, F., Ghista, D. N., Su, B., Kaabi Nezhadian, M., Chua, L. P., Yeo, J. H., et al. (2014). In vitro measurements of velocity and wall shear stress in a novel sequential anastomotic graft design model under pulsatile flow conditions. Med. Eng. Phys. 36, 1233–1245. doi:10.1016/j.medengphy.2014.06.024
Kaminsky, R., Morbiducci, U., Rossi, M., Scalise, L., Verdonck, P., and Grigioni, M. (2007). Time-resolved PIV technique for high temporal resolution measurement of mechanical prosthetic aortic valve fluid dynamics. Int. J. Artif. Organs 30 (2), 153–162. doi:10.1177/039139880703000210
Käufer, T., König, J., and Cierpka, C. (2021). Stereoscopic PIV measurements using low-cost action cameras. Exp. Fluids 62, 57. doi:10.1007/s00348-020-03110-6
Kefayati, S., and Poepping, T. L. (2013). Transitional flow analysis in the carotid artery bifurcation by proper orthogonal decomposition and particle image velocimetry. Med. Eng. Phys. 35, 898–909. doi:10.1016/j.medengphy.2012.08.020
Kessler, W., Moshage, W., Galland, A., Zink, D., Achenbach, S., Nitz, W., et al. (1998). Assessment of coronary blood flow in humans using phase difference MR imaging Comparison with intracoronary Doppler flow measurement. Hobolen, NJ: Wiley.
Kjeldsberg, H., Bergersen, A., and Valen-Sendstad, K. (2019). morphMan: Automated manipulation of vascular geometries. J. Open Source Softw. 4, 1065. doi:10.21105/joss.01065
Lazar, E., de Blauw, B., Glumac, N., Dutton, C., and Elliot, G. (2010). “A practical approach to PIV uncertainty analysis,” in 27th AIAA Aerodynamic Measurement Technology and Ground Testing Conf, 01 July 2010 (Chicago, Illinois: IEEE), 1–10.
Leo, H. L., Dasi, L. P., Carberry, J., Simon, H. A., and Yoganathan, A. P. (2006). Fluid dynamic assessment of three polymeric heart valves using particle image velocimetry. Ann. Biomed. Eng. 34, 936–952. doi:10.1007/s10439-006-9117-5
Lodi Rizzini, M., Gallo, D., de Nisco, G., D’Ascenzo, F., Chiastra, C., Bocchino, P. P., et al. (2020). Does the inflow velocity profile influence physiologically relevant flow patterns in computational hemodynamic models of left anterior descending coronary artery? Med. Eng. Phys. 82, 58–69. doi:10.1016/j.medengphy.2020.07.001
Malinauskas, R. A., Hariharan, P., Day, S. W., Herbertson, L. H., Buesen, M., Steinseifer, U., et al. (2017). FDA benchmark medical device flow models for CFD validation. ASAIO J. 63, 150–160. doi:10.1097/MAT.0000000000000499
Manning, K. B., Kini, V., Fontaine, A. A., Deutsch, S., and Tarbell, J. M. (2003). Regurgitant flow field characteristics of the St. Jude bileaflet mechanical heart valve under physiologic pulsatile flow using particle image velocimetry. Artif. Organs 27, 840–846. doi:10.1046/j.1525-1594.2003.07194.x
Medero, R., Ruedinger, K., Rutkowski, D., Johnson, K., and Roldán-Alzate, A. (2020). In vitro assessment of flow variability in an intracranial aneurysm model using 4D flow MRI and tomographic PIV. Ann. Biomed. Eng. 48, 2484–2493. doi:10.1007/s10439-020-02543-8
Meinhart, C. D., Wereley, S. T., and Santiago, J. G. (2000). A PIV algorithm for estimating time-averaged velocity fields. J. Fluids Eng. 122, 285–289. doi:10.1115/1.483256
Minichiello, A., Armijo, D., Mukherjee, S., Caldwell, L., Kulyukin, V., Truscott, T., et al. (2021). Developing a mobile application-based particle image velocimetry tool for enhanced teaching and learning in fluid mechanics: A design-based research approach. Comput. Appl. Eng. Educ. 29, 517–537. doi:10.1002/cae.22290
Nichols, W. W., O’Rourke, M., and Vlachopoulos, C. (2011). McDonald’s blood flow in arteries: Theoretical, experimental and clinical principles. Boca Raton, Florida, United States: CRC Press.
Oh, J. S., Lee, H., and Hwang, W. (2021). Motion blur treatment utilizing deep learning for time-resolved particle image velocimetry. Exp. Fluids 62 (234). doi:10.1007/s00348-021-03330-4
Peng, C., Wang, X., Xian, Z., Liu, X., Huang, W., Xu, P., et al. (2016). The impact of the geometric characteristics on the hemodynamics in the stenotic coronary artery. PLoS One 11, e0157490. doi:10.1371/journal.pone.0157490
Raben, J. S., Hariharan, P., Robinson, R., Malinauskas, R., and Vlachos, P. P. (2016). Time-resolved particle image velocimetry measurements with wall shear stress and uncertainty quantification for the FDA nozzle model. Cardiovasc. Eng. Technol. 7, 7–22. doi:10.1007/s13239-015-0251-9
Raben, J. S., Morlacchi, S., Burzotta, F., Migliavacca, F., and Vlachos, P. P. (2015). Local blood flow patterns in stented coronary bifurcations: An experimental and numerical study. J. Appl. Biomater. Funct. Mat. 13, E116–E126. doi:10.5301/jabfm.5000217
Raffel, M., Willert, C. E., Scarano, F., Kähler, C. J., Wereley, S. T., and Kompenhans, J. (2018). Particle image velocimetry. Cham: Springer International Publishing. doi:10.1007/978-3-319-68852-7
Raz, S., Einav, S., Alemu, Y., and Bluestein, D. (2007). DPIV prediction of flow induced platelet activation-comparison to numerical predictions. Ann. Biomed. Eng. 35, 493–504. doi:10.1007/s10439-007-9257-2
Salman, H. E., Ramazanli, B., Yavuz, M. M., and Yalcin, H. C. (2019). Biomechanical investigation of disturbed hemodynamics-induced tissue degeneration in abdominal aortic aneurysms using computational and experimental techniques. Front. Bioeng. Biotechnol. 7, 111. doi:10.3389/fbioe.2019.00111
Santiago, J. G., Beebe, D. J., Wereley, S. T., Meinhart, C. D., and Adrian, R. J. (1998). A particle image velocimetry system for microfluidics. Berlin, Germany: Springer-Verlag.
Sciacchitano, A. (2019). Uncertainty quantification in particle image velocimetry. Meas. Sci. Technol. 30, 092001. doi:10.1088/1361-6501/ab1db8
Sciacchitano, A., Wieneke, B., and Scarano, F. (2013). PIV uncertainty quantification by image matching. Meas. Sci. Technol. 24, 045302. doi:10.1088/0957-0233/24/4/045302
Segur, J. B., and Oberstar, H. E. (1951). Viscosity of glycerol and its aqueous solutions. Ind. Eng. Chem. 43, 2117–2120. doi:10.1021/ie50501a040
Shintani, Y., Iino, K., Yamamoto, Y., Kato, H., Takemura, H., and Kiwata, T. (2018). Analysis of computational fluid dynamics and particle image velocimetry models of distal-end side-to-side and end-to-side anastomoses for coronary artery bypass grafting in a pulsatile flow. Circ. J. 82, 110–117. doi:10.1253/circj.CJ-17-0381
Thielicke, W., and Stamhuis, E. J. (2014). PIVlab – towards user-friendly, affordable and accurate digital particle image velocimetry in MATLAB. J. Open Res. Softw. 2, b1. doi:10.5334/jors.bl
Keywords: Hemodynamics, PIV, stenosis, flow visualization, in vitro experiment
Citation: Caridi GCA, Torta E, Mazzi V, Chiastra C, Audenino AL, Morbiducci U and Gallo D (2022) Smartphone-based particle image velocimetry for cardiovascular flows applications: A focus on coronary arteries. Front. Bioeng. Biotechnol. 10:1011806. doi: 10.3389/fbioe.2022.1011806
Received: 04 August 2022; Accepted: 24 November 2022;
Published: 08 December 2022.
Edited by:
Philippe Sucosky, Kennesaw State University, United StatesReviewed by:
Zifeng Yang, Wright State University, United StatesBryan Schmidt, Case Western Reserve University, United States
Copyright © 2022 Caridi, Torta, Mazzi, Chiastra, Audenino, Morbiducci and Gallo. This is an open-access article distributed under the terms of the Creative Commons Attribution License (CC BY). The use, distribution or reproduction in other forums is permitted, provided the original author(s) and the copyright owner(s) are credited and that the original publication in this journal is cited, in accordance with accepted academic practice. No use, distribution or reproduction is permitted which does not comply with these terms.
*Correspondence: Diego Gallo, ZGllZ28uZ2FsbG9AcG9saXRvLml0
†These authors have contributed equally to this work and share first authorship