 Haoliang Fan
 Qiqian Xie
 Zheng Zhang
 Xuncai Chen
 Pingming Qiu
94% of researchers rate our articles as excellent or good
Learn more about the work of our research integrity team to safeguard the quality of each article we publish.
Find out more
ORIGINAL RESEARCH article
Front. Bioeng. Biotechnol., 24 January 2022
Sec. Biosafety and Biosecurity
Volume 9 - 2021 | https://doi.org/10.3389/fbioe.2021.819991
This article is part of the Research TopicMachine Learning Used in Biomedical Computing and Intelligence Healthcare, Volume IIView all 11 articles
Epigenetic clock, a highly accurate age estimator based on DNA methylation (DNAm) level, is the basis for predicting mortality/morbidity and elucidating the molecular mechanism of aging, which is of great significance in forensics, justice, and social life. Herein, we integrated machine learning (ML) algorithms to construct blood epigenetic clock in Southern Han Chinese (CHS) for chronological age prediction. The correlation coefficient (r) meta-analyses of 7,084 individuals were firstly implemented to select five genes (ELOVL2, C1orf132, TRIM59, FHL2, and KLF14) from a candidate set of nine age-associated DNAm biomarkers. The DNAm-based profiles of the CHS cohort (240 blood samples differing in age from 1 to 81 years) were generated by the bisulfite targeted amplicon pyrosequencing (BTA-pseq) from 34 cytosine-phosphate-guanine sites (CpGs) of five selected genes, revealing that the methylation levels at different CpGs exhibit population specificity. Furthermore, we established and evaluated four chronological age prediction models using distinct ML algorithms: stepwise regression (SR), support vector regression (SVR-eps and SVR-nu), and random forest regression (RFR). The median absolute deviation (MAD) values increased with chronological age, especially in the 61–81 age category. No apparent gender effect was found in different ML models of the CHS cohort (all p > 0.05). The MAD values were 2.97, 2.22, 2.19, and 1.29 years for SR, SVR-eps, SVR-nu, and RFR in the CHS cohort, respectively. Eventually, compared to the MAD range of the meta cohort (2.53–5.07 years), a promising RFR model (ntree = 500 and mtry = 8) was optimized with an MAD of 1.15 years in the 1–60 age categories of the CHS cohort, which could be regarded as a robust epigenetic clock in blood for age-related issues.
Aging is an inevitable, universal and natural phenomenon that occurs with age, characterized by progressive decline in organismal function and more susceptible to irreversible degenerative disease and even death (Sen et al., 2016). Accumulating studies have linked aging to epigenetic alterations (Grönniger et al., 2010; Sen et al., 2016; Horvath and Raj, 2018). As such, aging denotes an elementary epigenetic phenomenon, and epigenetic changes are widely considered to play a crucial role in aging (Fraga et al., 2005; Boks et al., 2009). Epigenetics is often defined by changes in gene function that do not involve any changes in DNA sequence, and epigenetic changes during aging mainly include histone modification and DNA methylation (DNAm) (Parson, 2018; Unnikrishnan et al., 2019).
DNAm is a chemical modification that mainly occurs in cytosine-phosphate-guanine (CpG) loci, especially in the CpG islands. In fact, an initial study of age-associated methylation in normal tissue was motivated by the study of methylation in cancer (Esteller, 2002). Cancer is well recognized as a disease of aging. For example, Christensen et al. verified this by proposing that variations in age- and exposure-related methylation may significantly contribute to increased susceptibility to several diseases (Christensen et al., 2009). Emerging studies are beginning to work on the associations between methylation profiles and human tissues; however, most of them have focused on therapeutic targets for pathological tissues (Suzuki et al., 2006; Portela and Esteller, 2010; Gao et al., 2019).
In forensics, DNAm biomarkers mainly focus on normal tissues, and employing methylation levels of strongly age-related CpGs (AR-CpGs) into construction of age predictive models has become a mainstream of age-estimation strategies (i.e., epigenetic clock) (Horvath and Raj, 2018). Epigenetic clock, which measures alterations in specific CpGs, is a synonym of a highly accurate age estimator based on DNAm levels (Unnikrishnan et al., 2019). As the most promising molecular age estimator, epigenetic clock can not only accurately predict age, mortality, or morbidity but also help to disentangle the role of DNAm in the mechanisms of aging, therefore facilitating anti-aging interventions (Jylhävä et al., 2017; Horvath and Raj, 2018; Unnikrishnan et al., 2019). Moreover, the epigenetic clocks can be utilized in other non-clinical areas, such as 1) forensic DNA phenotyping, including scenes in criminal investigation or catastrophic disaster (Gršković et al., 2013; Vidaki et al., 2013; Parson, 2018); 2) potentially determination of age of criminal responsibility for judgement (Gršković et al., 2013); and 3) children and youth growth monitoring, athlete selection, and social welfare recognition in our social life (Weidner et al., 2014).
To date, even though the relationship between aging and CpG methylation is complicated (Tra et al., 2002), large series of AR-CpGs were applicable for age prediction from methylation analysis, and quite a few epigenetic clocks of different populations were generated, providing references for distinct forensic scenarios. For example, Hannum et al. (2013) identified 71 AR-CpGs using the Illumina Infinium HumanMethylation450 BeadChip assay and built an age calculator with a correlation of 96% and a median absolute deviation (MAD) value of 3.9 years. Naue et al. chose 15 AR-CpGs for methylation analysis using the massive parallel sequencing method and proposed a regression model with an MAD value of 3.21 years (Naue et al., 2017). Smeers et al. investigated 16 AR-CpGs by pyrosequencing method and constructed three statistical prediction models with MAD values of 3.21, 3.20, and 3.26 years, respectively (Smeers et al., 2018). Dias et al. tested 5 AR-CpGs using the multiplex SNaPshot assay and developed an age prediction model based on 4 of them, with an MAD value of 4.97, which explains 92.5% variation in age (Dias et al., 2020).
As mentioned above, the MAD values for most DNAm-based age prediction models were more than 3 years (Zbieć-Piekarska et al., 2015b; Cho et al., 2017; Naue et al., 2017; Vidaki et al., 2017; Aliferi et al., 2018; Smeers et al., 2018; Dias et al., 2020), and also many factors have influences on age prediction accuracy, which limited its practical application. For example, different human body fluids (blood, semen, saliva, etc.) exhibit distinct methylation patterns (Jung et al., 2019), and in different populations/genders, the same DNAm biomarkers show diverse methylation levels in the same age category (Zbieć-Piekarska et al., 2015b; Cho et al., 2017; Dias et al., 2020). In addition, there are various alternative approaches (genome-wide DNAm, Illumina BeadChip, bisulfite pyrosequencing, etc.) for DNAm detection, while the bisulfite targeted amplicon pyrosequencing (BTA-pseq) technology supports standardized and cost-effective high-throughput analysis, which is generally relatively accurate. Except for the selection of population-/gender-/tissue-specific DNAm biomarkers and detection methods, the algorithm also has an impact on the age-prediction accuracy. Aliferi et al. (2018) compared the efficiency of 17 machine learning (ML) models based on the same MPS data and suggested that multiple linear regression (MLR) models did not outperform the generalized regression neural network (GRNN) model and several non-linear approaches showed increased accuracy, especially for support vector machine polynomial (SVMp). Xu et al. (2015) found that the MAD values reduced in the models of nonlinear regression, BP neural network, and support vector regression (SVR) by using the same CpGs when comparing with the MLR model. Garali et al. compared six different statistical models with the MLR model of Zbiec-Pierkarska (Zbieć-Piekarska et al., 2015b), and the results suggested that multiple quadratic regression (MQR), SVM, gradient boosting regressor (GBR), and MissMDA (mMDA) models outperformed the MLR model for age prediction from ELOVL2 (Garali et al., 2020).
Hence, in order to establish robust age prediction ML models for Southern Han Chinese (CHS), a candidate set of nine DNAm biomarkers was collected by meta-analyses of 7,084 individuals. Among them, five promising age-related genes (34 CpGs) were selected according to the correlation coefficient (r) ranking and Gene Expression Omnibus (GEO) data mining by AgeGuess (Gao et al., 2020). The DNAm-based profiles of the CHS cohort (240 blood samples with ages of 1–81 years) were generated by BTA-pseq. In addition, four different ML algorithms, stepwise regression (SR), SVR (including eps- and nu-regression), and random forest regression (RFR), were used to establish the age-prediction models based on AR-CpGs (|r|≥0.7). The samples were randomly divided into different datasets according to different genders and chronological ages, and we evaluated the model efficiencies in Training and Validation sets by MAD and root mean square error (RMSE) values, to find the best-performing ML model of CHS to estimate the chronological ages in practice.
The bibliographic search strategies were developed according to the DNAm-based age prediction studies with MAD values less than 5 years between 2014 and 2021, and we collected a cohort of 7,084 individuals from 16 countries or populations (Weidner et al., 2014; Bekaert et al., 2015; Xu et al., 2015; Zbieć-Piekarska et al., 2015a; Zbieć-Piekarska, et al., 2015b; Park et al., 2016; Zubakov et al., 2016; Cho et al., 2017; Feng et al., 2018; Alsaleh and Haddrill, 2019; Daunay et al., 2019; Jung et al., 2019; Li et al., 2019; Dias et al., 2020; Garali et al., 2020; Lau and Fung, 2020; Pan et al., 2020; Piniewska-Róg et al., 2021; Sukawutthiya et al., 2021; Woźniak et al., 2021; Xiao et al., 2021). The correlation coefficient (r) ranking of nine age-associated genes was obtained by meta-analyses (Figure 1 and Supplementary Figure S1). We selected four promising DNAm biomarkers (ELOVL2, C1orf132, FHL2, and TRIM59) according to the correlation coefficient ranking (|r|≥0.8) and the KLF14 gene by GEO data mining using a three-step feature selection algorithm AgeGuess (Gao et al., 2020), including a total of 34 CpGs (details in Supplementary Table S1). The PCR primers of five age-related DNAm biomarkers (Supplementary Table S2) were designed by PyroMark Assay Design Software 2.0 (Qiagen, Hilden, Germany).
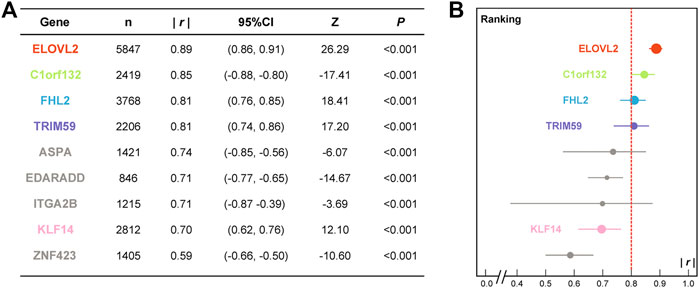
FIGURE 1. Detailed meta-analysis results (A) and correlation coefficient ranking (B) of the candidate age-associated gene set. (n, sample size; |r|, absolute value of correlation coefficient; CI, confidence interval; p, significance of Z test.)
A total of 240 unrelated healthy individuals were recruited from Han Chinese, who had settled in south China for at least three generations. Peripheral blood samples (2 ml) and accurate information (including age, gender, nationality) were collected from all participants of the CHS cohort. All volunteers had signed the informed consent forms (the underage children were signed by their guardians in accordance with Chinese laws and regulations), and the study was approved by the Biomedical Ethical Committee of Southern Medical University (No. 2021-015) following the standards of Declaration of Helsinki.
Genomic DNA was extracted from 200 μl peripheral blood by QIAamp Blood Mini Kit (Qiagen, Hilden, Germany) according to the manufacturer’s protocol. The extracted DNA samples were then quantified using Qubit® 4.0 Fluorometer instrument (Thermo Fisher Scientific, Waltham, MA, United States) with Qubit® dsDNA HS Assay Kit (Thermo Fisher Scientific, Waltham, MA, United States) according to the manufacturer’s instructions.
The conversion of unmethylated cytosines to uracils in DNA samples was carried out with the EpiTect Fast DNA Bisulfite Kit (Qiagen, Hilden, Germany), following the manufacturer’s instruction. With the input of 300 ng DNA, the bisulfite DNA conversion was performed using a thermal cycler that comprised: two cycles of initial denaturation at 95°C for 5 min and incubation at 60°C for 10 min followed by a hold at 20°C for up to 20 h in the thermal cycler. The converted DNA was then eluted into 15 μl of the elution buffer (EB) obtained from the same kit, normalized to 20 ng/μl as the DNA template, and subsequently stored at −20°C until use.
After bisulfite conversion, 100 ng of each converted DNA was submitted into a multiplex polymerase chain reaction (PCR) amplification with PyroMark PCR Kit (Qiagen, Hilden, Germany). Each multiplex reaction was performed in a final volume of 25 μl containing 12.5 μl of 2✕ PyroMark PCR Master Mix (providing a concentration of 1.5 mM MgCl2), 2.5 μl of 10✕ CoralLoad Concentrate, 9 μl of primer mix, and 1 μl of template DNA. The multiplex reaction was amplified under the following conditions: 1) initial PCR activation at 95°C for 15 min; 2) 45 cycles consisting of denaturation at 94°C for 30 s, annealing at 56°C for 30 s, and extension at 72°C for 30 s; and 3) final extension at 72°C for 10 min followed by a hold at 4°C. Negative control without DNA template was prepared in each PCR process.
Following amplification, all PCR products were sequenced using PyroMark Gold Q24 Reagents (Qiagen, Hilden, Germany) in combination with PyroMark Q24 platform (Qiagen, Hilden, Germany) according to the manufacturer’s instructions. The generated pyrogram traces with sharp and distinct peaks were subsequently analyzed, and the methylation levels at different CpGs were calculated by the peak heights observed in PyroMark Q24 Advanced software v3.0.1 (Qiagen, Hilden, Germany). The missing methylation percentage values have been filled in with the median (Supplementary Table S3).
The Spearman correlation coefficient (r) was calculated by IBM® SPSS® Statistics 26 (IBM Corporation, Armonk, NY, United States), SAS® 9.4 software (SAS Institute Inc., Cary, NC, United States), and R (version 3.6.1). The r values are used to assess the strength and direction of the linear relationships between pairs of variables (predicted and chronological ages). According to Mukaka (2012), the r values followed the rule of thumb for interpreting size of a correlation coefficient: 1) 0.9≤|r|≤1.0, very high correlation; 2) 0.7≤|r|<0.9, high correlation; 3) 0.5≤|r|<0.7, moderate correlation; and 4) |r|≤0.5, low correlation. The AR-CpGs (|r|≥0.7) were selected to establish different ML models.
As shown in Figure 2A, the CHS cohort was randomly divided into a Training set (70%, n = 170, 93 females and 77 males) and a Validation set (30%, n = 70, 39 females and 31 males). The obtained methylation levels of Training set and the corresponding chronological ages were used for model training. Parameter tunning was performed by leave-one-out (k-fold) cross-validation, during which a set of samples (a fold) is removed from the dataset as the Validation set and the remaining samples were assigned as a Training set. In addition, for the evaluation of gender differences and aging effects, both Training and Validation sets were divided into three different gender datasets (female, male, and combined datasets, details in Figure 2A) and four age categories (1–20, 21–40, 41–60, and 61–81 years, details in Supplementary Table S4), respectively.
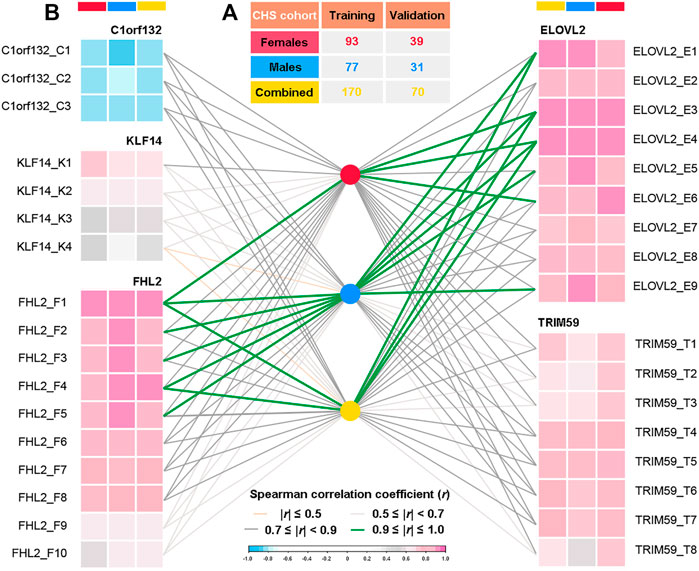
FIGURE 2. Spearman correlation analyses between DNA methylation levels of 34 CpGs located at five genes and chronological ages of three different datasets in the CHS cohort (n = 240, blood samples). (A) Detailed population sizes of different datasets (in the CHS cohort, randomly 70%/30% for Training and Validation sets, detailed information in Supplementary Table S4). (B) Spearman correlations between chronological ages and DNA methylation levels at each CpG in three different gender datasets (r, correlation coefficient; 0.9≤|r|≤1.0, very high correlation; 0.7≤|r|<0.9, high correlation; 0.5≤|r|<0.7, moderate correlation; |r|≤0.5, low correlation, details in Supplementary Table S5).
Model performance was compared in terms of MAD and RMSE values, which are calculated by IBM® SPSS® Statistics 26 and R (version 3.6.1). The MAD value is defined as the average distance between each data value and the mean, a way to describe variation in a dataset, while the RMSE value is widely used to compute the error distance between the estimated values. Both of them are the main metrics used to measure the quality of the regression output models. To measure the overall performance of each model, the MAD and RMSE values were calculated for the whole CHS cohort. Subsequently, to evaluate the generalization and the actual prediction performance of the final model, and to evaluate gender or aging effects, MAD values for different datasets needed to be analyzed.
For multivariate linear regression analysis, the model selection procedure SR was performed using IBM® SPSS® Statistics 26 (IBM Corporation, Armonk, NY, United States) for model building together with 0.05 significance criteria for inclusion in the final model. Specifically, by excluding all previously selected variables with a p-value of 0.05 or greater until no variables can be eliminated nor new variables can be introduced in the regression equation, stepwiselm can create a linear model and automatically add to or trim the model, thus improving the selection of important variables in relatively small datasets (Núñez et al., 2011). Overall, the essence of these steps is to establish an “Optimal” MLR equation. The accuracy of age prediction with those tested CpGs was assessed by the goodness-of-fit (R2), which is a parameter establishing the discrepancy between the observed values (chronological ages) and the expected values (predicted ages) under an applicable model, and generally used in regression to evaluate the performance of the model. Therefore, model equations with the greatest R2 were selected as the candidate predictors based on the multivariant regression analysis.
For SVR analysis, SVR model was carried out by R (e1071 package). As reported, support vector machine (SVM) is a powerful technique for classification, regression, and outlier detection, and a correct choice of kernel parameters is crucial for a promising result. So, we constructed and refined regression models by following methods: 1) select support vector machines with radial (SVMr) function as kernel, 2) employ eps-regression and nu-regression for comparison, and 3) adjust the parameters “cost, gamma, and epsilon” for eps-regression and “cost and nu” for nu-regression. Eventually, two optimized SVR models with best-performing parameters were obtained.
For random forest regression analysis, random forest exploiting classification trees were constructed based on Breiman’s random forest algorithm (on the basis of Breiman and Cutler’s original Fortran code) using randomForest R package. Random forests represent an effective tool in prediction, and RFR algorithm that based on decision trees plays an important role in selecting the “optimal” markers for model building. To reduce bias and operate effectively in regression, optimization of the RFR model was carried out by tuning the parameters mtry and ntree. mtry refers to the number of variables randomly sampled as candidates at each split, and ntree is defined as the number of trees to grow. By multiple rounds of optimization, a final mtry of 8 was chosen, the ntree was set at 500, and the optimal RFR model was established. The value (% Var explained) represents the overall explanatory rate for the variances of the response variables by the predictive variables. We used the value (%IncMSE, increase in mean squared error) to measure the importance of predictive variables, which means that by randomly assigning a value to each predictive variable, if the predictive variable is more important, the model prediction error will increase after its value is randomly replaced.
At first, a cohort of 7,084 individuals from 16 countries or populations related to DNAm-based age prediction studies was collected by bibliographic search to conduct meta-analyses (details in Supplementary Figure S1). Figure 1A presents the results of a meta-analysis of the detailed correlation coefficients for candidate age-associated genes in the meta cohort. The absolute values of correlation coefficients (|r|) for nine DNAm biomarkers ranged from 0.59 (ZNF423) to 0.89 (ELOVL2). There are eight of nine DNA biomarkers with |r|≥0.7 (Figure 1), and the |r| ranking of the candidate genes is visualized in Figure 1B. According to the self-defined threshold value (|r|≥0.8), four promising genes (ELOVL2, C1orf132, FHL2, and TRIM59) were selected for further validation in the CHS cohort. In addition, the KLF14 gene that was screened by a three-step feature selection algorithm AgeGuess (Gao et al., 2020) was also selected. Supplementary Tables S1, S2 present the detailed 34 CpGs and PCR primers of five aforementioned DNAm biomarkers, respectively.
The detailed DNAm levels of 34 CpGs and the corresponding personal information (chronological ages and genders) in the CHS cohort are presented in Supplementary Table S3. In addition, according to gender stratification (Figure 2A and Supplementary Table S4), the Spearman correlation analyses were conducted between the DNAm levels and the chronological ages in three different datasets, which is visualized in Figure 2B (detailed results in Supplementary Table S5). Except for C1orf132 where DNAm decreases with age, other genes have positive correlations with chronological ages. In total, we identified 25 AR-CpGs out of the 34 CpGs in the CHS cohort (29 AR-CpGs for female dataset, 24 AR-CpGs for male dataset), which are highly related (|r|≥0.7, p < 0.05) with the chronological ages of CHS. In addition, the KLF14 has no apparent strong correlation with the chronological ages (all r < 0.7), except for KLF14_K1 in males (r = 0.7082). Meanwhile, three different AR-CpGs (ELOVL2_E3, ELOVL2_E4, and FHL2_F1) have high correlations with the chronological ages in all gender datasets of the CHS cohort. Detailed results of Spearman analyses are visualized in Supplementary Figures S2–S6 for ELOVL2, C1orf132, FHL2, TRIM59, and KLF14, respectively.
The AR-CpGs with |r|≥0.7 of different datasets were regarded as alternative stepwise variables. A stepwise variable selection was conducted to select the best possible combination of predictors from the candidate highly associated CpGs for the SR model, which guaranteed the explained variability without overfitting the data. Based on different gender datasets, we built three distinct SR equations and calculated corresponding statistics for female (MAD = 3.00 and RMSE = 4.07), male (MAD = 2.64 and RMSE = 3.45), and combined (MAD = 2.97 and RMSE = 3.89) datasets corresponding to the age prediction models (details in Table 1, all adjusted R2 ≥ 0.93). There was no significant difference between females and males in the CHS cohort (t = 0.59, p = 0.61).
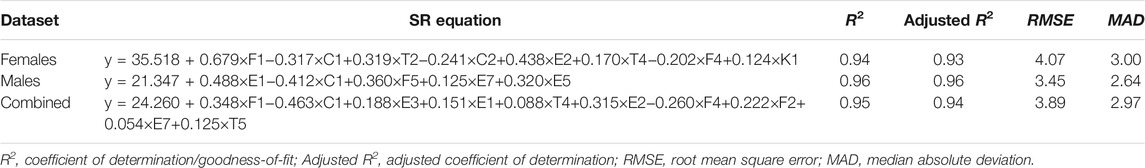
TABLE 1. Stepwise regression (SR) equations and system efficiencies in three different datasets of the CHS cohort (n = 240, blood samples).
Furthermore, we evaluated the prediction accuracy of the SR models in Training (MAD = 3.04, n = 170) and Validation (MAD = 2.80, n = 70) sets, respectively (Supplementary Table S6). The MAD values between Training and Validation sets had no significant difference (t = −1.06, p = 0.31). In total, the MAD values of different CHS datasets ranged from 2.14 (1–20 age category of Training set, n = 41) to 5.12 (61–81 age category of Validation set, n = 3). In addition, in the female dataset, the MAD values spanned from 2.25 (1–20 age category of Training set, n = 20) to 8.39 (61–81 age category of Validation set, n = 1). In the male dataset, the MAD values varied from 1.91 (1–20 age category of Validation set, n = 9) to 6.73 (61–81 age category of Validation set, n = 2). For different age categories, the lowest MAD value (1.91) was found at male validation dataset (1–20 age category, n = 9), while the highest MAD value (8.39) was identified at female validation dataset (61–81 age category, n = 1). The MAD values between females and males had no significant difference in both Training (t = 1.06, p = 0.35) and Validation (t = 0.25, p = 0.54) sets. Apparently, the MAD values rise with advancing ages (especially in the 61–81 age category), which indicated that the methylation-based SR model prediction accuracy decreases due to biological and physiological changes involved in the aging process, especially for the aged.
Here, we constructed SVR models with two different methods (eps- and nu-regression) using correspondingly AR-CpG loci (|r|≥0.7) of distinct gender groups.
As shown in Table 2, we found 163 support vectors in the CHS cohort with an MAD value of 2.22 (RMSE = 2.95). In addition, the MAD values were 2.09 and 2.12 for female (n = 132, RMSE = 2.84) and male (n = 108, RMSE = 2.93) datasets, respectively, with no significant difference (t = 0.51, p = 0.13). The best performance (with the lowest MAD value) of SVR eps-regression was obtained with the optimized parameters (cost = 1, gamma = 0.04, epsilon = 0.1). The detailed MAD values for Training and Validation sets are presented in Supplementary Table S7. The MAD values were 2.33 and 1.87 for Training and Validation sets, respectively, with no significant difference (t = 1.68, p = 0.12).
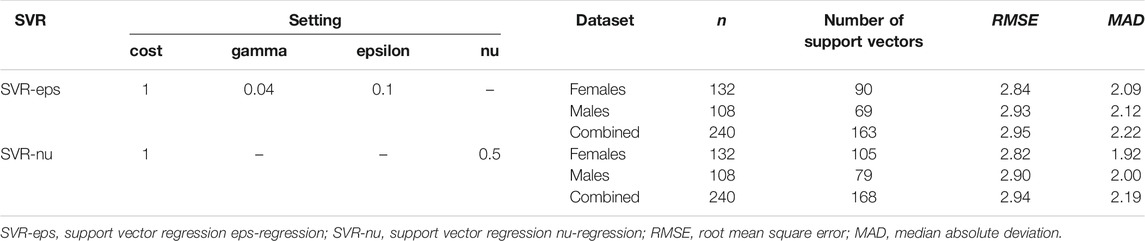
TABLE 2. Model settings and system efficiencies for three different datasets of the CHS cohort (n = 240, blood samples) in two SVR models.
In different age categories, the MAD values ranged from 1.59 (1–20 age category of Validation set, n = 18) to 4.72 (61–81 age category of Training set, n = 12). In addition, in the female dataset, the MAD values spanned from 1.35 (1–20 age category of Validation set, n = 9) to 10.06 (61–81 age category of Training set, n = 4). In the male dataset, the MAD values varied from 1.53 (1–20 age category of Validation set, n = 9) to 5.09 (61–81 age category of Validation set, n = 2). The MAD values between females and males had no significant difference in both Training (t = 0.77, p = 0.07) and Validation (t = −0.38, p = 0.90) sets. Overall, except for the 61–81 age category, the MAD value for each dataset was no more than 2.44.
Besides, the SVR nu-regression model was also used to predict the chronological ages (Table 2). The MAD value of the CHS cohort was 2.19 (RMSE = 2.94), which was obtained at cost = 1 and nu = 0.5 (including 168 support vectors). In female and male datasets, the MAD values were 1.92 and 2.00 with the support vectors of 105 and 79, and the RMSE values were 2.82 and 2.90, respectively. However, there was no significant difference between females and males in the CHS cohort (t = 0.52, p = 0.09). The detailed MAD values of Training and Validation sets are presented in Supplementary Table S7. The MAD values were 2.33 and 1.84 for Training and Validation sets with no significant difference (t = 1.78, p = 0.10), respectively.
In different age categories, the MAD values ranged from 1.56 (1–20 age category of Validation set, n = 18) to 4.73 (61–81 age category of Training set, n = 12). In the female dataset, the MAD values spanned from 1.08 (1–20 age category of Validation set, n = 9) to 10.54 (61–81 age category of Training set, n = 4). In the male dataset, the MAD values varied from 1.27 (1–20 age category of Validation set, n = 9) to 5.18 (61–81 age category of Validation set, n = 2). The MAD values between females and males had no significant difference in both Training (t = 0.75, p = 0.07) and Validation (t = −0.27, p = 0.68) sets. The MAD value for each dataset was no more than 2.41 except for the 61–81 age category.
Compared with SVR-eps, the prediction capacity of the SVR-nu model was more excellent with lower MAD value for each dataset, while the model stability for both of them has larger fluctuations at the 61–81 age category (MAD values ranging from 3.42 to 10.54, details in Supplementary Table S7).
Furthermore, the DNAm profiles of 240 CHS samples were learned by the RFR algorithm. For the ntree feature selection, we set six different threshold values (100, 300, 500, 1,000, 5,000, and 10,000) to find the robust limit with lower error rate (details in Supplementary Figure S7). In fact, the error rates tended to be stable when the ntree was more than 300. However, we set an ntree border at 500 to obtain more reliable results without regard to the hashrate for practice case handling. In addition, the feature selection (ntree = 500) was validated in different gender datasets, which indicated that the relatively lower and stable error rates are obtained with ntree of 500 (Figure 3). The E3 and E4 AR-CpG markers of ELOVL2 genes (r > 0.9 in different gender datasets, details in Supplementary Table S5) ranked the top three positions in different gender datasets, which demonstrated that these biomarkers are the important predictive variables in the CHS cohort. According to different numbers of AR-CpGs for distinct gender datasets, the mtry values were set up at 9, 8, and 8 for female, male, and combined datasets, respectively.
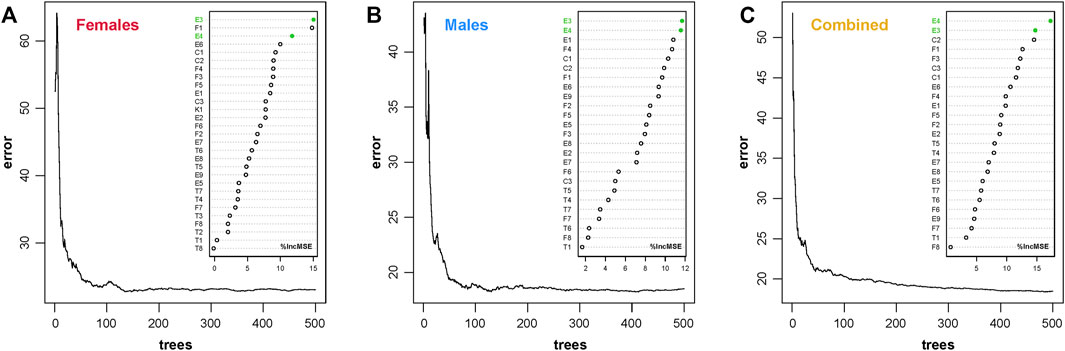
FIGURE 3. Validation of feature selection (ntree = 500) and AR-CpG importance ranking in three different gender datasets of the CHS cohort (n = 240, blood samples). (A) Female dataset (n = 132). (B) Male dataset (n = 108). (C) Combined dataset (n = 240). (ntree, number of trees to grow, which should not be set to too small a number, to ensure that every input row gets predicted at least a few times; %IncMSE, increase in mean squared error.)
With the feature selection and parameter setting as described above, the RFR model could explain 93.21% of the total variances (90.62% for females and 93.88% for males) in the CHS cohort (Table 3). The MAD values were 1.29 (RMSE = 1.77), 1.45 (RMSE = 1.95), and 1.32 (RMSE = 1.77) for combined, female, and male datasets, respectively. There was no significant difference between females and males in the CHS cohort (t = 0.98, p = 0.05). As shown in Supplementary Table S8, the MAD values of Training and Validation sets were 1.37 and 1.10, with no significant difference (t = 1.97, p = 0.07).
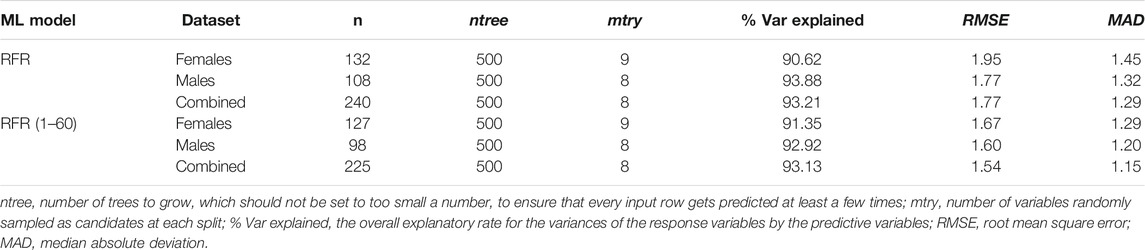
TABLE 3. Detailed feature selection and model efficiency information of random forest regression (RFR) models in three different gender datasets of the CHS cohort.
In different age categories, the MAD values ranged from 0.45 (1–20 age category of Validation set, n = 18) to 3.39 (61–81 age category of Validation set, n = 3). In the female dataset, the MAD values spanned from 0.59 (1–20 age category of Validation set, n = 9) to 4.47 (61–81 age category of Training set, n = 4). In the male dataset, the MAD values varied from 0.75 (1–20 age category of Validation set, n = 9) to 2.21 (61–81 age category of Validation set, n = 8). The MAD values between females and males had no significant difference in both Training (t = 0.90, p = 0.13) and Validation (t = 0.39, p = 0.23) sets. The detailed MAD values for each dataset are presented in Supplementary Table S8, and except for the 61–81 age category, the MAD values were less than 1.80.
Based on aforementioned ML algorithms, four different ML models have been established after multiple rounds of optimization, and the model efficiencies have been evaluated (details in Table 4). All R2 values were above 0.95, and the R2 value reached to 0.99 in the RFR model. The MAD values of the CHS cohort were 2.97 (RMSE = 3.89), 2.22 (RMSE = 2.95), 2.19 (RMSE = 2.94), and 1.29 (RMSE = 1.77) for SR, SVR-eps, SVR-nu, and RFR models, which are also visualized in Figures 4A,B. In the female dataset, the MAD values were 3.00 (RMSE = 4.07), 2.09 (RMSE = 2.84), 1.92 (RMSE = 2.82), and 1.45 (RMSE = 1.95) for SR, SVR-eps, SVR-nu, and RFR models, respectively. In the male dataset, the MAD values were 2.64 (RMSE = 3.45), 2.12 (RMSE = 2.93), 2.00 (RMSE = 2.90), and 1.32 (RMSE = 1.77) for SR, SVR-eps, SVR-nu, and RFR models, respectively. It demonstrated that no matter in female or male datasets, the RFR model had the highest predictive accuracy with an MAD value of 1.29.
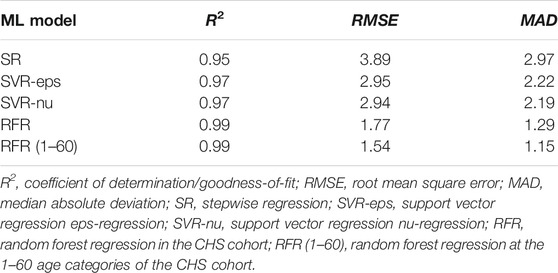
TABLE 4. System efficiency comparisons of different machine learning (ML) models.
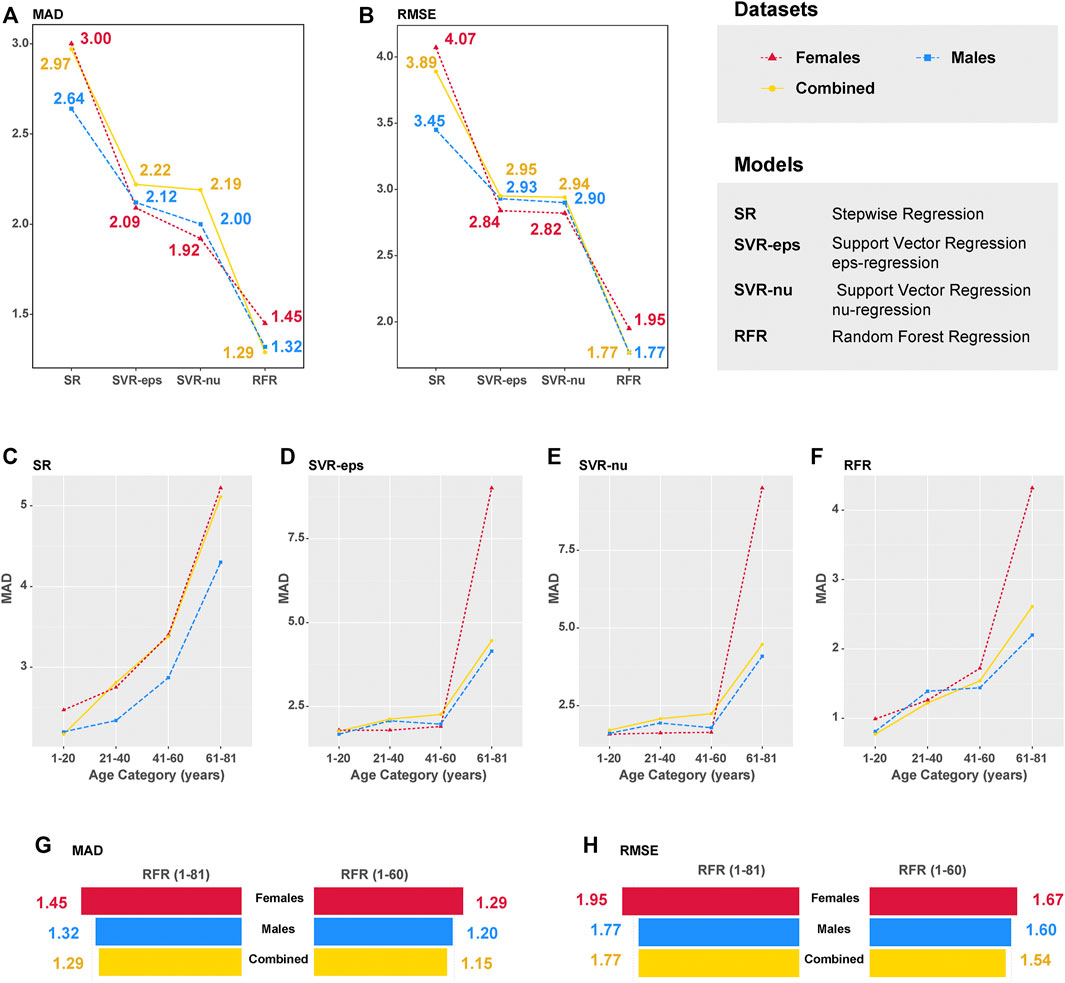
FIGURE 4. Median absolute deviation (MAD) and root mean square error (RMSE) values of different machine learning (ML) models. (A) MAD value comparison of four different models in the CHS cohort (n = 240, blood samples). (B) RMSE value comparison of four different models in the CHS cohort (n = 240, blood samples). (C) MAD values in different age categories of the SR model. (D) MAD values in different age categories of the SVR-eps model. (E) MAD values in different age categories of the SVR-nu model. (F) MAD values in different age categories of the RFR model. (G) MAD value comparison between RFR (1–81) and RFR (1–60) models. (H) RMSE value comparison between RFR (1–81) and RFR (1–60) models.
In four different ML models of the CHS cohort, we definitely observed that the MAD values increased with the chronological ages, especially in the 61–81 age category with a rapid increase (Figures 4C–F). In addition, to obtain more precise prediction accuracy, we evaluated the best-performing RFR model in the age categories of 1–60 (excluding the 61–81 age category). As presented in Supplementary Figure S8, the ntree feature (ntree = 500) was further validated in different gender datasets, and the E3 and E4 CpGs of ELOVL2 were also the most important predictive variables in the RFR model (1–60 age categories). The MAD value of all 225 CHS samples reduced to 1.15 (RMSE = 1.54), and the MAD values were 1.21 and 1.01 for Training (n = 158) and Validation (n = 67) sets, respectively (Supplementary Table S9). In Table 4 and Figures 4G,H, the MAD values of the RFR (1–60) model were 1.29 in females (RMSE = 1.67) and 1.20 in males (RMSE = 1.60). Compared with the RFR model for the 1–81 age categories, both the MAD and RMSE values of RFR (1–60) have decreased, and the MAD values were especially less than 1.00 in the 1–20 age category (Supplementary Table S9), which demonstrated that the RFR (1–60) model is more suitable for the age precise prediction of youngsters. Additionally, the relationships between predicted ages and chronological ages in different ML models were conducted (Supplementary Figure S9), and the R2 values of all different ML models were more than 0.94.
Forensic community has long been seeking for a molecular marker to facilitate age prediction from biological traces at crime scenes. The DNAm biomarkers served as the most promising information source for chronological age estimation, even though the aging process was impacted by both inherited genetic and environmental factors (Li et al., 2018; Morrow et al., 2020; Ryan et al., 2020; Mukherjee et al., 2021). Most of the existing studies selected their DNAm biomarkers based on these biomarkers’ biological relevance to the aging process (Zubakov et al., 2016), statistically correlations with the chronological ages (Shadrina et al., 2018), or feature selection algorithms (Gao et al., 2020). In this study, the correlation coefficient ranking of nine candidate DNAm biomarkers was obtained from a cohort of 7,084 individuals using meta-analysis. Among them, we selected four top-ranking genes (ELOVL2, TRIM59, FHL2, and C1orf132) and KLF14 chosen by a three-step feature selection algorithm AgeGuess to generate the DNAm profiles of the CHS cohort by BTA-pseq technology.
Correlation of DNAm status in five abovementioned genes with chronological age has been very well documented in different tissues and cell types (Zubakov et al., 2016; Cho et al., 2017; Jung et al., 2019; Dias et al., 2020; Anaya et al., 2021; Pfeifer et al., 2021; Woźniak et al., 2021). Our Spearman correlation analysis detected different strongly related CpG (|r|≥0.9) numbers in male (10 AR-CpGs) and female (4 AR-CpGs) datasets, mainly in ELOVL2 and FHL2. However, the MAD values had no significant difference between female and male datasets in different SR (t = 0.59, p = 0.61), SVR-eps (t = 0.51, p = 0.13), SVR-nu (t = 0.52, p = 0.09), and RFR (t = 0.98, p = 0.05) models. The results indicated that the effect of gender on age prediction has not been detected in the present study (all p > 0.05), which was in concordant with Koch and Wagner (2011). In contrast, some studies presented that DNAm in men changes 4% faster than that in women (Hannum et al., 2013) and the predicted age was higher in men than in women (Weidner et al., 2014; Zbieć-Piekarska et al., 2015b). The gender effect on age estimation is inconclusive; however, it is conclusive that there is no gender effect in our ML models at least.
The chosen methylomic biomarker KLF14 has strongly age-associated relationships in Caucasians and Hispanics (Gao et al., 2020), but the age correlations were not apparent in the CHS cohort, Koreans, and Polish (Supplementary Table S10). In addition, we observed high r value of 0.798 (F7 of FHL2) in the CHS cohort, but the corresponding r value is 0.42 in Polish. In different East Asian populations, the r values were 0.67 and 0.87 at T8 of TRIM59 in CHS and Koreans, respectively. Our results demonstrated that different populations have distinct methylation status under the same conditions, for both intercontinental and regional populations (termed as population-specific), which indicated that it is urgently necessary to determine the population-specific AR-CpGs available for practical application regionally.
This study further established four different ML models for chronological age prediction in the CHS cohort. Our results obtained from both Training and Validation sets are concordant in four different ML models (all p > 0.05), and the MAD values were less than 3.0 years (Table 4), which indicated that all ML models are robust in the CHS cohort. Based on the same five age-related genes, Zbieć-Piekarska et al. constructed the SR model in Polish with the MAD values of 3.4 and 3.9 in Training and Validation sets, respectively (Zbieć-Piekarska et al., 2015b). Another SR model exhibited an MAD value of 4.18 in 100 Korean blood samples (Cho et al., 2017). Jung et al. used multiplex methylation SNaPshot assay to establish the SR model using 150 Korean blood samples with the MAD values of 3.174 and 3. 478 in Training and Validation sets, respectively (Jung et al., 2019). Compared to the aforementioned SR models, the SR model of the CHS cohort showed higher prediction accuracy (MAD = 3.04 in Training set and MAD = 2.80 in Validation set). In addition, the MAD values of two optimized SVR models were 2.22 and 2.19 for SVR-eps and SVR-nu models (Table 2, Table 4), which were better than the SR model in the CHS cohort. Additionally, the RFR model with an MAD value of 1.29 was the best-performing ML model in the CHS cohort, which was confirmed at both Training (MAD = 1.45) and Validation (MAD = 1.32) sets without significant difference. Under the same condition, different ML algorithms have apparent influences on age prediction model accuracy.
In our data, we also found that the age prediction accuracy decreases with chronological age in different ML models (Figures 4C–F). As DNAm is a dynamic modification process, age-associated changes in DNAm have been well documented, and a previous study has identified that DNAm tends to increase with age on some CpG islands (Field et al., 2018). Moreover, the MAD values are affected by small sample size (only 15 individuals in the 61–81 age category of the CHS cohort), resulting in some biases for chronological age prediction. Thus, the absolute differences between predicted and chronological ages are larger in the categories of older people, which are also confirmed by previous studies (Zbieć-Piekarska, et al., 2015b; Hamano et al., 2016; Cho et al., 2017; Dias et al., 2020). Notably, the MAD value of the RFR model reduced to 1.15 years in the age range of 1–60. In the meta cohort, the MAD values ranged from 2.53 to 5.07 years. As far as we know, it is the best chronological age prediction model in Han Chinese.
In fact, the DNAm status reflects biological age rather than chronological age. However, DNAm estimated age can be considered as an “epigenetic clock,” which in many cases runs parallel with chronological age (Horvath, 2013; Marioni et al., 2015). The epigenetic clock of CHS can be established by four age-related genes and different ML algorithms. From our perspectives, finding more population-specific and age-associated genes, expanding larger sample sizes (Figures 4G,H), and optimizing ML algorithms will contribute to generating more precise epigenetic clocks for diverse human populations.
In the present study, we conducted that 1) a candidate set of nine DNAm biomarkers was collected by meta-analysis with a number of 7,084 individuals; 2) the DNAm profiles of five promising genes were generated using BTA-pseq in the CHS cohort; and 3) four different ML models based on age-related CpGs (|r|≥0.7) were established and optimized in different datasets. In addition, we concluded that 1) gender effect has little influence on age prediction; 2) methylation levels at different CpGs exhibit population specificity; and 3) the age prediction accuracy decreases with chronological age. Eventually, an optimized RFR ML model with an MAD value of 1.15 has been established (ntree = 500 and mtry = 8) at the 1–60 age categories of CHS using whole blood DNAm data generated by BTA-pseq.
The original contributions presented in the study are included in the article/Supplementary Material, further inquiries can be directed to the corresponding authors.
The studies involving human participants were reviewed and approved by the Biomedical Ethics Committee of Southern Medical University (No. 2021-015). Written informed consent to participate in this study was provided by the participants’ legal guardian/next of kin. Written informed consent was obtained from the individual(s), and minor(s)’ legal guardian/next of kin, for the publication of any potentially identifiable images or data included in this article.
Conceptualization, HF; methodology, HF and QX; software, HF and QX; validation, HF, QX, JW, and ZZ; formal analysis, HF; investigation, HF, QX, and ZZ; resources, HF and PQ; data curation, PQ and XC; writing—original draft preparation, HF, QX, and XC; writing—review and editing, HF, QX, and XC; visualization, HF and QX; supervision, HF, XC, and PQ; project administration, PQ; funding acquisition, HF and PQ. All authors have read and agreed to the published version of the manuscript.
This study was supported by grants from the Program of Hainan Association for Science and Technology Plans to Youth R&D Innovation (QCXM201705), Science Foundation of School of Forensic Medicine, Southern Medical University (No. 2021KY02), and National Natural Science Foundation of China (NSFC, No. 81671865 and No. 81971786).
The authors declare that the research was conducted in the absence of any commercial or financial relationships that could be construed as a potential conflict of interest.
All claims expressed in this article are solely those of the authors and do not necessarily represent those of their affiliated organizations, or those of the publisher, the editors, and the reviewers. Any product that may be evaluated in this article, or claim that may be made by its manufacturer, is not guaranteed or endorsed by the publisher.
The authors sincerely thank all the volunteers who contributed samples for this study.
The Supplementary Material for this article can be found online at: https://www.frontiersin.org/articles/10.3389/fbioe.2021.819991/full#supplementary-material
Aliferi, A., Ballard, D., Gallidabino, M. D., Thurtle, H., Barron, L., and Syndercombe Court, D. (2018). DNA Methylation-Based Age Prediction Using Massively Parallel Sequencing Data and Multiple Machine Learning Models. Forensic Sci. Int. Genet. 37, 215–226. doi:10.1016/j.fsigen.2018.09.003
Alsaleh, H., and Haddrill, P. R. (2019). Identifying Blood-specific Age-Related DNA Methylation Markers on the Illumina MethylationEPIC BeadChip. Forensic Sci. Int. 303, 109944. doi:10.1016/j.forsciint.2019.109944
Anaya, Y., Yew, P., Roberts, K. A., and Hardy, W. R. (2021). DNA Methylation of Decedent Blood Samples to Estimate the Chronological Age of Human Remains. Int. J. Leg. Med 135 (6), 2163–2173. doi:10.1007/s00414-021-02650-8
Bekaert, B., Kamalandua, A., Zapico, S. C., Van de Voorde, W., and Decorte, R. (2015). Improved Age Determination of Blood and Teeth Samples Using a Selected Set of DNA Methylation Markers. Epigenetics 10 (10), 922–930. doi:10.1080/15592294.2015.1080413
Boks, M. P., Derks, E. M., Weisenberger, D. J., Strengman, E., Janson, E., Sommer, I. E., et al. (2009). The Relationship of DNA Methylation with Age, Gender and Genotype in Twins and Healthy Controls. PLoS One 4 (8), e6767. doi:10.1371/journal.pone.0006767
Cho, S., Jung, S.-E., Hong, S. R., Lee, E. H., Lee, J. H., Lee, S. D., et al. (2017). Independent Validation of DNA-Based Approaches for Age Prediction in Blood. Forensic Sci. Int. Genet. 29, 250–256. doi:10.1016/j.fsigen.2017.04.020
Christensen, B. C., Houseman, E. A., Marsit, C. J., Zheng, S., Wrensch, M. R., Wiemels, J. L., et al. (2009). Aging and Environmental Exposures Alter Tissue-specific DNA Methylation Dependent upon CpG Island Context. Plos Genet. 5 (8), e1000602. doi:10.1371/journal.pgen.1000602
Daunay, A., Baudrin, L. G., Deleuze, J.-F., and How-Kit, A. (2019). Amp; How-Kit, AEvaluation of Six Blood-Based Age Prediction Models Using DNA Methylation Analysis by Pyrosequencing. Sci. Rep. 9 (1), 8862. doi:10.1038/s41598-019-45197-w
Dias, H. C., Cordeiro, C., Pereira, J., Pinto, C., Real, F. C., Cunha, E., et al. (2020). DNA Methylation Age Estimation in Blood Samples of Living and Deceased Individuals Using a Multiplex SNaPshot Assay. Forensic Sci. Int. 311, 110267. doi:10.1016/j.forsciint.2020.110267
Esteller, M. (2002). CpG Island Hypermethylation and Tumor Suppressor Genes: a Booming Present, a Brighter Future. Oncogene 21 (35), 5427–5440. doi:10.1038/sj.onc.1205600
Feng, L., Peng, F., Li, S., Jiang, L., Sun, H., Ji, A., et al. (2018). Systematic Feature Selection Improves Accuracy of Methylation-Based Forensic Age Estimation in Han Chinese Males. Forensic Sci. Int. Genet. 35, 38–45. doi:10.1016/j.fsigen.2018.03.009
Field, A. E., Robertson, N. A., Wang, T., Havas, A., Ideker, T., and Adams, P. D. (2018). DNA Methylation Clocks in Aging: Categories, Causes, and Consequences. Mol. Cel 71 (6), 882–895. doi:10.1016/j.molcel.2018.08.008
Fraga, M. F., Ballestar, E., Paz, M. F., Ropero, S., Setien, F., Ballestar, M. L., et al. (2005). From the Cover: Epigenetic Differences Arise during the Lifetime of Monozygotic Twins. Proc. Natl. Acad. Sci. 102 (30), 10604–10609. doi:10.1073/pnas.0500398102
Gao, X., Liu, S., Song, H., Feng, X., Duan, M., Huang, L., et al. (2020). AgeGuess, a Methylomic Prediction Model for Human Ages. Front. Bioeng. Biotechnol. 8, 80. doi:10.3389/fbioe.2020.00080
Gao, X., Nowak-Imialek, M., Chen, X., Chen, D., Herrmann, D., Ruan, D., et al. (2019). Establishment of Porcine and Human Expanded Potential Stem Cells. Nat. Cel Biol 21 (6), 687–699. doi:10.1038/s41556-019-0333-2
Garali, I., Sahbatou, M., Daunay, A., Baudrin, L. G., Renault, V., Bouyacoub, Y., et al. (2020). Improvements and Inter-laboratory Implementation and Optimization of Blood-Based Single-Locus Age Prediction Models Using DNA Methylation of the ELOVL2 Promoter. Sci. Rep. 10 (1), 15652. doi:10.1038/s41598-020-72567-6
Grönniger, E., Weber, B., Heil, O., Peters, N., Stäb, F., Wenck, H., et al. (2010). Aging and Chronic Sun Exposure Cause Distinct Epigenetic Changes in Human Skin. Plos Genet. 6 (5), e1000971. doi:10.1371/journal.pgen.1000971
Gršković, B., Zrnec, D., Vicković, S., Popović, M., and Mršić, G. (2013). DNA Methylation: the Future of Crime Scene Investigation? Mol. Biol. Rep. 40 (7), 4349–4360. doi:10.1007/s11033-013-2525-3
Hamano, Y., Manabe, S., Morimoto, C., Fujimoto, S., Ozeki, M., and Tamaki, K. (2016). Forensic Age Prediction for Dead or Living Samples by Use of Methylation-Sensitive High Resolution Melting. Leg. Med. 21, 5–10. doi:10.1016/j.legalmed.2016.05.001
Hannum, G., Guinney, J., Zhao, L., Zhang, L., Hughes, G., Sadda, S., et al. (2013). Genome-wide Methylation Profiles Reveal Quantitative Views of Human Aging Rates. Mol. Cel 49 (2), 359–367. doi:10.1016/j.molcel.2012.10.016
Horvath, S. (2013). DNA Methylation Age of Human Tissues and Cell Types. Genome Biol. 14 (10), R115. doi:10.1186/gb-2013-14-10-r115
Horvath, S., and Raj, K. (2018). DNA Methylation-Based Biomarkers and the Epigenetic Clock Theory of Ageing. Nat. Rev. Genet. 19 (6), 371–384. doi:10.1038/s41576-018-0004-3
Jung, S.-E., Lim, S. M., Hong, S. R., Lee, E. H., Shin, K.-J., and Lee, H. Y. (2019). DNA Methylation of the ELOVL2, FHL2, KLF14, C1orf132/MIR29B2C, and TRIM59 Genes for Age Prediction from Blood, Saliva, and Buccal Swab Samples. Forensic Sci. Int. Genet. 38, 1–8. doi:10.1016/j.fsigen.2018.09.010
Jylhävä, J., Pedersen, N. L., and Hägg, S. (2017). Biological Age Predictors. EBioMedicine 21, 29–36. doi:10.1016/j.ebiom.2017.03.046
Koch, C. M., and Wagner, W. (2011). Epigenetic-aging-signature to Determine Age in Different Tissues. Aging 3 (10), 1018–1027. doi:10.18632/aging.100395
Lau, P. Y., and Fung, W. K. (2020). Evaluation of Marker Selection Methods and Statistical Models for Chronological Age Prediction Based on DNA Methylation. Leg. Med. 47, 101744. doi:10.1016/j.legalmed.2020.101744
Li, J., Zhu, X., Yu, K., Jiang, H., Zhang, Y., Wang, B., et al. (2018). Exposure to Polycyclic Aromatic Hydrocarbons and Accelerated DNA Methylation Aging. Environ. Health Perspect. 126 (6), 067005. doi:10.1289/ehp2773
Li, S. F., Peng, F. D., Wang, J. N., Zhong, J. J., Zhao, H., Wang, L., et al. (2019). Methylation-Based Age Estimation Model Construction and its Effectiveness Evaluation. Fa Yi Xue Za Zhi 35 (1), 17–22. doi:10.12116/j.issn.1004-5619.2019.01.004
Marioni, R. E., Shah, S., McRae, A. F., Chen, B. H., Colicino, E., Harris, S. E., et al. (2015). DNA Methylation Age of Blood Predicts All-Cause Mortality in Later Life. Genome Biol. 16 (1), 25. doi:10.1186/s13059-015-0584-6
Morrow, J. D., Make, B., Regan, E., Han, M., Hersh, C. P., Tal-Singer, R., et al. (2020). DNA Methylation Is Predictive of Mortality in Current and Former Smokers. Am. J. Respir. Crit. Care Med. 201 (9), 1099–1109. doi:10.1164/rccm.201902-0439OC
Mukaka, M. M. (2012). Statistics Corner: A Guide to Appropriate Use of Correlation Coefficient in Medical Research. Malawi Med. J. 24 (3), 69–71.
Mukherjee, N., Arathimos, R., Chen, S., Kheirkhah Rahimabad, P., Han, L., Zhang, H., et al. (2021). DNA Methylation at Birth Is Associated with Lung Function Development until Age 26 Years. Eur. Respir. J. 57 (4), 2003505. doi:10.1183/13993003.03505-2020
Naue, J., Hoefsloot, H. C. J., Mook, O. R. F., Rijlaarsdam-Hoekstra, L., van der Zwalm, M. C. H., Henneman, P., et al. (2017). Chronological Age Prediction Based on DNA Methylation: Massive Parallel Sequencing and Random forest Regression. Forensic Sci. Int. Genet. 31, 19–28. doi:10.1016/j.fsigen.2017.07.015
Núñez, E., Steyerberg, E. W., and Núñez, J. (2011). Regression Modeling Strategies. Revista Española de Cardiología (English Edition) 64 (6), 501–507. doi:10.1016/j.recesp.2011.01.01910.1016/j.rec.2011.01.017
Pan, C., Yi, S., Xiao, C., Huang, Y., Chen, X., and Huang, D. (2020). The Evaluation of Seven Age-Related CpGs for Forensic Purpose in Blood from Chinese Han Population. Forensic Sci. Int. Genet. 46, 102251. doi:10.1016/j.fsigen.2020.102251
Park, J.-L., Kim, J. H., Seo, E., Bae, D. H., Kim, S.-Y., Lee, H.-C., et al. (2016). Identification and Evaluation of Age-Correlated DNA Methylation Markers for Forensic Use. Forensic Sci. Int. Genet. 23, 64–70. doi:10.1016/j.fsigen.2016.03.005
Parson, W. (2018). Age Estimation with DNA: From Forensic DNA Fingerprinting to Forensic (Epi)Genomics: A Mini-Review. Gerontology 64 (4), 326–332. doi:10.1159/000486239
Pfeifer, M., Greb, A., Bajanowski, T., and Poetsch, M. (2021). Performance des PyroMark Q48 FX Age Assay auf zwei unterschiedlichen Pyrosequenzierplattformen. Rechtsmedizin 31 (3), 217–225. doi:10.1007/s00194-021-00491-8
Piniewska-Róg, D., Heidegger, A., Pośpiech, E., Xavier, C., Pisarek, A., Jarosz, A., et al. (2021). Impact of Excessive Alcohol Abuse on Age Prediction Using the VISAGE Enhanced Tool for Epigenetic Age Estimation in Blood. Int. J. Leg. Med 135 (6), 2209–2219. doi:10.1007/s00414-021-02665-1
Portela, A., and Esteller, M. (2010). Epigenetic Modifications and Human Disease. Nat. Biotechnol. 28 (10), 1057–1068. doi:10.1038/nbt.1685
Ryan, J., Wrigglesworth, J., Loong, J., Fransquet, P. D., and Woods, R. L. (2020). A Systematic Review and Meta-Analysis of Environmental, Lifestyle, and Health Factors Associated with DNA Methylation Age. J. Gerontol. A. Biol. Sci. Med. Sci. 75 (3), 481–494. doi:10.1093/gerona/glz099
Sen, P., Shah, P. P., Nativio, R., and Berger, S. L. (2016). Epigenetic Mechanisms of Longevity and Aging. Cell 166 (4), 822–839. doi:10.1016/j.cell.2016.07.050
Shadrina, A., Tsepilov, Y., Sokolova, E., Smetanina, M., Voronina, E., Pakhomov, E., et al. (2018). Genome-wide Association Study in Ethnic Russians Suggests an Association of the MHC Class III Genomic Region with the Risk of Primary Varicose Veins. Gene 659, 93–99. doi:10.1016/j.gene.2018.03.039
Smeers, I., Decorte, R., Van de Voorde, W., and Bekaert, B. (2018). Evaluation of Three Statistical Prediction Models for Forensic Age Prediction Based on DNA Methylation. Forensic Sci. Int. Genet. 34, 128–133. doi:10.1016/j.fsigen.2018.02.008
Sukawutthiya, P., Sathirapatya, T., and Vongpaisarnsin, K. (2021). A Minimal Number CpGs of ELOVL2 Gene for a Chronological Age Estimation Using Pyrosequencing. Forensic Sci. Int. 318, 110631. doi:10.1016/j.forsciint.2020.110631
Suzuki, K., Suzuki, I., Leodolter, A., Alonso, S., Horiuchi, S., Yamashita, K., et al. (2006). Global DNA Demethylation in Gastrointestinal Cancer Is Age Dependent and Precedes Genomic Damage. Cancer Cell 9 (3), 199–207. doi:10.1016/j.ccr.2006.02.016
Tra, J., Kondo, T., Lu, Q., Kuick, R., Hanash, S., and Richardson, B. (2002). Infrequent Occurrence of Age-dependent Changes in CpG Island Methylation as Detected by Restriction Landmark Genome Scanning. Mech. Ageing Development 123 (11), 1487–1503. doi:10.1016/s0047-6374(02)00080-5
Unnikrishnan, A., Freeman, W. M., Jackson, J., Wren, J. D., Porter, H., and Richardson, A. (2019). The Role of DNA Methylation in Epigenetics of Aging. Pharmacol. Ther. 195, 172–185. doi:10.1016/j.pharmthera.2018.11.001
Vidaki, A., Ballard, D., Aliferi, A., Miller, T. H., Barron, L. P., and Syndercombe Court, D. (2017). DNA Methylation-Based Forensic Age Prediction Using Artificial Neural Networks and Next Generation Sequencing. Forensic Sci. Int. Genet. 28, 225–236. doi:10.1016/j.fsigen.2017.02.009
Vidaki, A., Daniel, B., and Court, D. S. (2013). Forensic DNA Methylation Profiling-Potential Opportunities and Challenges. Forensic Sci. Int. Genet. 7 (5), 499–507. doi:10.1016/j.fsigen.2013.05.004
Weidner, C., Lin, Q., Koch, C., Eisele, L., Beier, F., Ziegler, P., et al. (2014). Aging of Blood Can Be Tracked by DNA Methylation Changes at Just Three CpG Sites. Genome Biol. 15 (2), R24. doi:10.1186/gb-2014-15-2-r24
Woźniak, A., Heidegger, A., Piniewska-Róg, D., Pośpiech, E., Xavier, C., Pisarek, A., et al. (2021). Development of the VISAGE Enhanced Tool and Statistical Models for Epigenetic Age Estimation in Blood, Buccal Cells and Bones. Aging 13 (5), 6459–6484. doi:10.18632/aging.202783
Xiao, C., Yi, S., and Huang, D. (2021). Genome‐wide Identification of Age‐related CpG Sites for Age Estimation from Blood DNA of Han Chinese Individuals. Electrophoresis 42 (14-15), 1488–1496. doi:10.1002/elps.202000367
Xu, C., Qu, H., Wang, G., Xie, B., Shi, Y., Yang, Y., et al. (2015). A Novel Strategy for Forensic Age Prediction by DNA Methylation and Support Vector Regression Model. Sci. Rep. 5, 17788. doi:10.1038/srep17788
Zbieć-Piekarska, R., Spólnicka, M., Kupiec, T., Makowska, Ż., Spas, A., Parys-Proszek, A., et al. (2015a). Examination of DNA Methylation Status of the ELOVL2 Marker May Be Useful for Human Age Prediction in Forensic Science. Forensic Sci. Int. Genet. 14, 161–167. doi:10.1016/j.fsigen.2014.10.002
Zbieć-Piekarska, R., Spólnicka, M., Kupiec, T., Parys-Proszek, A., Makowska, Ż., Pałeczka, A., et al. (2015b). Development of a Forensically Useful Age Prediction Method Based on DNA Methylation Analysis. Forensic Sci. Int. Genet. 17, 173–179. doi:10.1016/j.fsigen.2015.05.001
Keywords: DNA methylation, CpG, chronological age prediction, machine learning, stepwise regression, support vector regression, random forest regression, epigenetic clock
Citation: Fan H, Xie Q, Zhang Z, Wang J, Chen X and Qiu P (2022) Chronological Age Prediction: Developmental Evaluation of DNA Methylation-Based Machine Learning Models. Front. Bioeng. Biotechnol. 9:819991. doi: 10.3389/fbioe.2021.819991
Received: 22 November 2021; Accepted: 21 December 2021;
Published: 24 January 2022.
Edited by:
Wenbing Zhao, Cleveland State University, United StatesReviewed by:
Rashed Alghafri, Dubai Police, United Arab EmiratesCopyright © 2022 Fan, Xie, Zhang, Wang, Chen and Qiu. This is an open-access article distributed under the terms of the Creative Commons Attribution License (CC BY). The use, distribution or reproduction in other forums is permitted, provided the original author(s) and the copyright owner(s) are credited and that the original publication in this journal is cited, in accordance with accepted academic practice. No use, distribution or reproduction is permitted which does not comply with these terms.
*Correspondence: Haoliang Fan, MTg5NzY0MzE2NzdmYW5Ac211LmVkdS5jbg==; Xuncai Chen, eGNoZTM4MTVAc211LmVkdS5jbg==; Pingming Qiu, cWl1cG1Ac211LmVkdS5jbg==
†These authors have contributed equally to this work.
Disclaimer: All claims expressed in this article are solely those of the authors and do not necessarily represent those of their affiliated organizations, or those of the publisher, the editors and the reviewers. Any product that may be evaluated in this article or claim that may be made by its manufacturer is not guaranteed or endorsed by the publisher.
Research integrity at Frontiers
Learn more about the work of our research integrity team to safeguard the quality of each article we publish.