- Structure and Motion Lab, Comparative Biomedical Sciences, Royal Veterinary College, Hatfield, United Kingdom
Fossil trackways provide a glimpse into the behavior of extinct animals. However, while providing information of the trackmaker size, stride, and even speed, the actual gait of the organism can be ambiguous. This is especially true of quadrupedal animals, where disparate gaits can have similar trackway patterns. Here, predictive simulation using trajectory optimization can help distinguish gaits used by trackmakers. First, we demonstrated that a planar, five-link quadrupedal biomechanical model can generate the qualitative trackway patterns made by domestic dogs, although a systematic error emerges in the track phase (relative distance between ipsilateral pes and manus prints). Next, we used trackway dimensions as inputs to a model of Batrachotomus kupferzellensis, a long-limbed, crocodile-line archosaur (clade Pseudosuchia) from the Middle Triassic of Germany. We found energetically optimal gaits and compared their predicted track phases to those of fossil trackways of Isochirotherium and Brachychirotherium. The optimal results agree with trackways at slow speeds but differ at faster speeds. However, all simulations point to a gait transition around a non-dimensional speed of 0.4 and another at 1.0. The trackways likewise exhibit stark differences in the track phase at these speeds. In all cases, including when simulations are constrained to the fossil track phase, the optimal simulations after the first gait transition do not correspond to a trot, as often used by living crocodiles. Instead, they are a diagonal sequence gait similar to the slow tölt of Icelandic horses. This is the first evidence that extinct pseudosuchians may have exhibited different gaits than their modern relatives and of a gait transition in an extinct pseudosuchian. The results of this analysis highlight areas where the models can be improved to generate more reliable predictions for fossil data while also showcasing how simple models can generate insights about the behavior of extinct animals.
Introduction
Despite the incredible animal diversity of the present, the past contains forms with no ideal modern analogues. Batrachotomus kupferzellensis (Gower, 1999) is one such example. This long-limbed, crocodile-line archosaur (clade Pseudosuchia) from the Middle Triassic of Germany had a large head and a massive tail similar to modern crocodylians but a more erect (adducted) limb posture similar to modern (cursorial) mammals (Gower and Schoch, 2009). Was Batrachotomus more similar to a mammal in its locomotion, to a modern crocodylian, or was it altogether different?
Bonaparte (1984) considered the erect limbs, and elongated pubis and ischium, of “rauisuchids” (a group containing Batrachotomus) to be adaptations for parasagittal locomotion that enabled them to survive a Middle–Late Triassic faunal replacement. Parrish (1986) postulated that the erect limbs of “rauisuchians” and other archosaurs gave them increased maneuverability on land as in mammals. While Parrish noted that their hindlimb plantigrady and crurotarsal ankle were more similar to those of modern crocodylians, reorganization of the ankle resulted in symmetrical pull of the plantarflexors, leading to simple plantarflexion of the ankle rather than lateral rotation with plantarflexion as seen in crocodylians and lizards. Nesbitt et al. (2013) interpreted plantigrady and the extended calcaneal tuber as adaptation to high power rather than high speed. Apart from a consensus that Batrachotomus used parasagittal and erect locomotion, and was quadrupedal (Bishop et al., 2020), there is as yet no analysis on the kind(s) of gait it may have employed.
Many aspects of gait choice in cursorial, quadrupedal mammals emerge from work-based optimization in simple parasagittal models. Trajectory optimization, in particular, allows for the numerical optimization of continuous motion through time. Xi et al. (2016) used trajectory optimization to recover the four-beat walk and trot typically used by mammals with a planar model. Galloping was later discovered as optimal when a compliant torso was added (Yesilevskiy et al., 2018). By minimizing mechanical work in parasagittal models, the body’s pitch moment of inertia (when normalized to glenoacetabular distance and mass as the Murphy number), was shown to broadly determine which mammals do and do not trot (Usherwood, 2020; Polet, 2021b).
Precise anatomical details are often unnecessary for the biomechanical models to arrive at similar solutions to the animals they are based upon. For example, a model with one rigid body element, massless prismatic legs, and no elastic elements captured walking and trotting in dogs, matching the gait transition speed, changes in the duty factor with speed, ground reaction force shape, and limb phase with reasonable accuracy from minimizing a cost combining limb work with a penalty for rapid changes in force (Polet and Bertram, 2019). Such models may be useful in paleontological research, where soft-body details including musculature geometry, fiber length, and tendon length are not usually preserved. Indeed, the gaits of fossil organisms are often very difficult to be determined from trackways, although some attempts have been broadly successful (see Nyakatura et al., 2019; Vincelette, 2021).
Triassic pseudosuchian fossil trackways (referred to ichnotaxa Isochirotherium and Brachychirotherium) may belong to Batrachotomus or a close relative (Petti et al., 2009; Diedrich, 2015; Apesteguía et al., 2021; Klein and Lucas, 2021), and offer information on an approximate trackmaker size and gait parameters (e.g., track phase, defined as ipsilateral pes to manus displacement divided by the stride length, Figure 1). However, the precise gait employed by these trackmakers remains ambiguous.

FIGURE 1. Schematic of a Brachychirotherium trackway, showing definition of parameters. Footprints are measured from the caudal-most point to the tip of digit III, or to digit II in the case of Brachychirotherium manus. The caudal side of digit V was used (e.g., the second manus in the diagram) when available. The manus–pes distance is calculated between midpoints along the stride vector,
A biomechanical model can provide quantitative predictions of the track phase given the stride length and trackmaker size. If the model adequately predicts the track phase, it offers not only evidence that a particular gait was used but also clues about other aspects of the trackmaker’s locomotion not directly recorded in fossil trackways.
Methods
Planar Model and Optimization Scheme
The parasagittal, planar model follows the study by Polet and Bertram (2019); Polet (2021b). It has a rigid trunk and massless legs that push along an axis connecting footfall location to acetabulum or glenoid through time (Figure 2). Feet are simple points, actuator force is instantaneously reflected in ground reaction force, and sliding friction is infinite. The center of mass (COM) lies along the glenoacetabular axis, and the pitch moment of inertia (MOI), stride length (

FIGURE 2. Simple quadrupedal model used for simulations overlayed on the skeletal model used for length measurements. White circles show radius of gyration from the center of mass (x). Only two of four legs (red and blue lines) are shown in the figure.
The optimizations minimize an objective
where
In the optimization scheme,
Force rates are controls in the model, with forces, velocities, and positions serving as states. A leg-impulse state is added to prevent simultaneous cranial and caudal contact of a single leg. Footfall positions are parameters (and decision variables) for the optimization. Additional relaxation parameters and slack variables are added as controls to regularize complementarity conditions (see Polet and Bertram, 2019 for details).
As the gaits of interest are symmetrical, the simulation is over a half cycle (time from 0 to T/2). An initial and final COM horizontal position of 0 and D/2 is imposed. A periodicity constraint is enforced such that the body kinematics must be equal at
Optimal gaits are found by trajectory optimization with direct collocation using GPOPS-II (v. 2.3) (Patterson and Rao, 2014) and SNOPT (v. 7.5) (Gill et al., 2005; Gill et al., 2015) in MATLAB 2020b. For each parameter combination, we keep only the best local optimum from a minimum of 50 random initial guesses. The custom software used to generate symmetrical solutions is available on GitHub (Polet, 2021a).
In the baseline unconstrained case, we compared different force-rate penalties but allowed the optimizer to choose its own track phase. In the constrained case, we forced the optimizer to use the track phase to match the fossil trackway trends. We also performed a sensitivity analysis with increasing forelimb length, leaving the track phase unconstrained. In all cases, diagonal sequence and lateral sequence gaits are equivalent, as the model is planar. The ipsilateral limb phase (
Morphology: Domestic Dogs and Batrachotomus
Model track phase predictions were tested against gait and footfall data readily available for Belgian Malinois dogs (Maes et al., 2008), using the body proportions specified by Polet and Bertram (2019) and the MOI specified by Polet (2021b). Batrachotomus dimensions and inertial properties were determined from a volumetric model (Bishop et al., 2020). This in turn was based on the skeletal reconstruction at the Staatliches Museum für Naturkunde Stuttgart. As manus and pes material is fragmentary for this species, the autopodia were partially reconstructed by the museum staff based on closely related species, and we assumed that this autopodial morphology was sufficiently accurate for our purposes. Gower and Schoch (2009) noted that specimen SMNS 90018 preserves two fragmentary metacarpals and phalanges of the right manus, and then “four metatarsals, several phalanges, and a few distally incomplete unguals” of which only the fifth metatarsal’s identity was certain. Yet what is preserved of the general autopodial morphology is consistent with the following: (1) the reconstructed, mounted museum display specimen’s morphology, having a relatively small manus vs. the pes; and (2) the general autopodial morphology of other “rauisuchian”-grade Pseudosuchia (also with smaller manus vs. pes). The model was posed in an approximate standing posture to determine leg lengths and pitch MOI about the COM (Figure 2; Table 1). The distance from the hip to COM along the glenoacetabular axis, divided by
Trackway Data
The ichnotaxa Isochirotherium and Brachychirotherium have usually been assigned to a large pseudosuchian trackmaker, possibly a “rauisuchian” such as Batrachotomus or a close relative (Diedrich, 2015; Apesteguía et al., 2021; Hminna et al., 2021; Klein and Lucas, 2021). Trackway data of interest include stride length, pes and manus length, and ipsilateral pes to manus distance within a footprint “set.” For each trackway of interest, we aggregated all of the above trackway data. For example, all pes lengths were used to calculate mean pes length, even if some were not associated with a manus. These data were gathered from published sources. While these sources on occasion assigned trackways to ichnospecies, for the sake of this analysis, we grouped ichnotaxa to the ichnogenus level.
Data from Tables
Where available, published table data were used (Petti et al., 2009; Diedrich, 2012; Diedrich, 2015). The manus–pes distance was always reported as inter-print distance (IPD). In this case, we calculated midpoint–midpoint distance as
Petti et al. (2009) assigned four trackways to Brachychirotherium (identified as BsZ-A, -D, -E, and -F). Only BsZ-A and BsZ-D included manus–pes distance, and so are included in the present study. Diedrich (2012) reported three Isochirotherium trackways in Table 1. We interpreted the values therein as means. No variational statistics were reported, apart from number of manus/pes sets. Diedrich (2015) reported a single Isochirotherium trackway in their Table 1 with data for each manus/pes set. Stride lengths were reported in this table for every third manus/pes set.
Data from figures
Additional trackway data were extracted from published orthogonal-view photographs or traces of trackways using ImageJ (Abramoff et al., 2004). In general, for each pes print, we digitized the tip of the third digit and the caudal-most point of the fifth digit, where the craniocaudal axis was defined to lie along the axis of the third digit (Figure 1). In the cases where the fifth digit was missing, the caudal-most point of the metatarsal pad was used instead. This process was repeated for the manus tracks, except in the case of Brachychirotherium. Because of the rotation of the manus in this latter ichnogenus, the second digit was used for the craniocaudal axis, and the tip was digitized accordingly.
The midpoints for each manus or pes were calculated, and the stride vector was defined as the displacement between midpoints of successive pes footfalls on the same side (
Clark and Corrance (2009) presented photos of single manus–pes sets of Isochirotherium. These were digitized as shown above. The set from their Figure 7B was associated with trackway BWF_5 data in Table 1 of the study by Clark et al. (2002), where the trackway was at first assigned to Chirotherium. The trackway set from Figure 6C of Clark and Corrance (2009) was associated with trackway SLID_1 data in their Table 1. However, the digitized pes in this case had a much smaller length (0.13 m) than the smallest reported value in their Table 1 (0.21 m). Based on the trackway photo (Figure 6 in Clark et al., 2002), the pes was the sixth print of SLID_1 in their Table 1, and the caudal portion of the print may have been cropped out of the photo in Figure 6C of Clark and Corrance (2009). To correct this, we extended the caudal point by the length of pes 6 reported in their Table 1 (0.28 cm). As there were no orthogonal views of either trackway available, no projection to stride could be performed, and the absolute distance from pes to manus midpoint was used instead. The pes length data for the final print in BWF_5 were excluded, as it was poorly preserved.
Apesteguía et al. (2021) assigned four trackways to Brachychirotherium, identified as R1, R2-t1, -t5, and -t9, and presented them in their Figures 4A, 5B. Trackway R1 includes a trailing left manus with no associated pes. Therefore, a manus–pes midpoint distance to the next left pes was calculated, and it was subtracted from the stride length to get the pes–manus midpoint distance. The same left pes was used to calculate the pes–manus midpoint distance for the next left manus print. Trackway R2-t1 appears to include a slight turn at the start of the trackway, apparent in manus–pes sets 1 and 2. The remainder of the trackway appears steady and straight. Therefore, we omitted the first two manus–pes sets for the purposes of the track phase or stride length calculations, but included them for the trackmaker size. The prints in trackway R2-t5 are relatively poorly preserved, but with enough preservation to allow identification of the ichnotaxon (Brachychirotherium). For this trackway, the cranial-most and caudal-most point of each print were digitized, where digits could not be discerned, with craniocaudal being defined as the trackway direction.
Klein et al. (2006) reported a single Brachychirotherium trackway in their Figure 7. As the digits of the first manus could not be discerned, the cranial-most portion of the print along the trackway direction was used instead.
Hminna et al. (2021) reported a single Brachychirotherium trackway in their Figure 4. There was only one set of well-preserved sequential ipsilateral pes footprints in this trackway. Therefore, sequential ipsilateral manus footprints were used to measure the stride length (total 4 in the trackway).
Calculation of Gait Parameters
Hip height of the trackmaker was determined as mean track pes length times the ratio between hip height and pes length of the Batrachotomus model. The non-dimensional speed (
The trackway stride length and speed were inputs of the model, while the track phase was compared to optimization predictions. An analytical approximation (Stevens et al., 2016) for the track phase (
This was also compared to trackway and optimization results.
See Supplementary Figure S1 for a geometric proof. While Stevens et al. (2016) demonstrated how these estimates can be ambiguous for small stride lengths, the stride lengths in the present study are sufficiently large such that there is no ambiguity about which prints would be in simultaneous contact (assuming quadrupedal stance).
Results
Belgian Malinois Dogs
For dogs, optimization predicts a lateral sequence gait with the limb phase
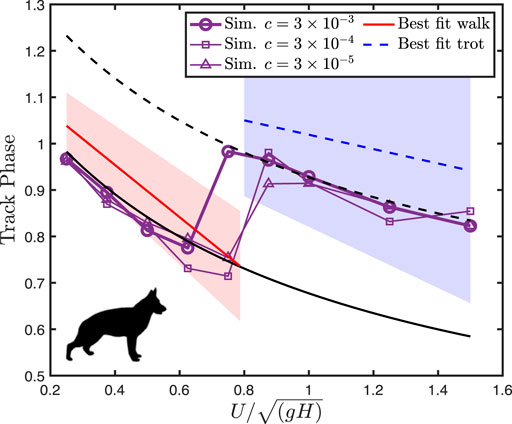
FIGURE 3. Dog track phase decreases with speed, before exhibiting a jump at the walk-trot transition. The lines of best fit to empirical data are from Maes et al. (2008), with filled areas representing two standard deviations from the mean. Black solid and dotted lines indicate
Varying the force-rate penalty
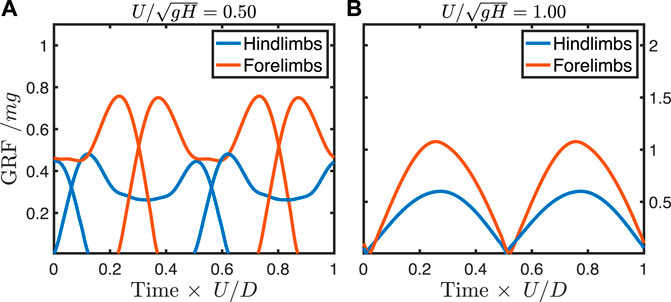
FIGURE 4. Ground reaction forces from predictive simulation at a walking speed (A) and trotting speed (B) in a dog model with force-rate penalty
Trackway Data
Trackways varied in size and length, with mean pes lengths varying in Isochirotherium from 0.22 to 0.34 m and in Brachychirotherium from 0.12 to 0.39 m (Table 2). Isochirotherium normalized speed (estimated via Eq. 2) varied from 0.40 to 0.79, typical for a moderate walk to fast walk or slow run. Brachychirotherium speeds varied more, from a slow walk at 0.31 to a fast run of 1.92. The mean manus to pes length ratio across all trackways was 0.35 ± 0.05 for Isochirotherium and 0.38 ± 0.09 for Brachychirotherium (±standard deviation).
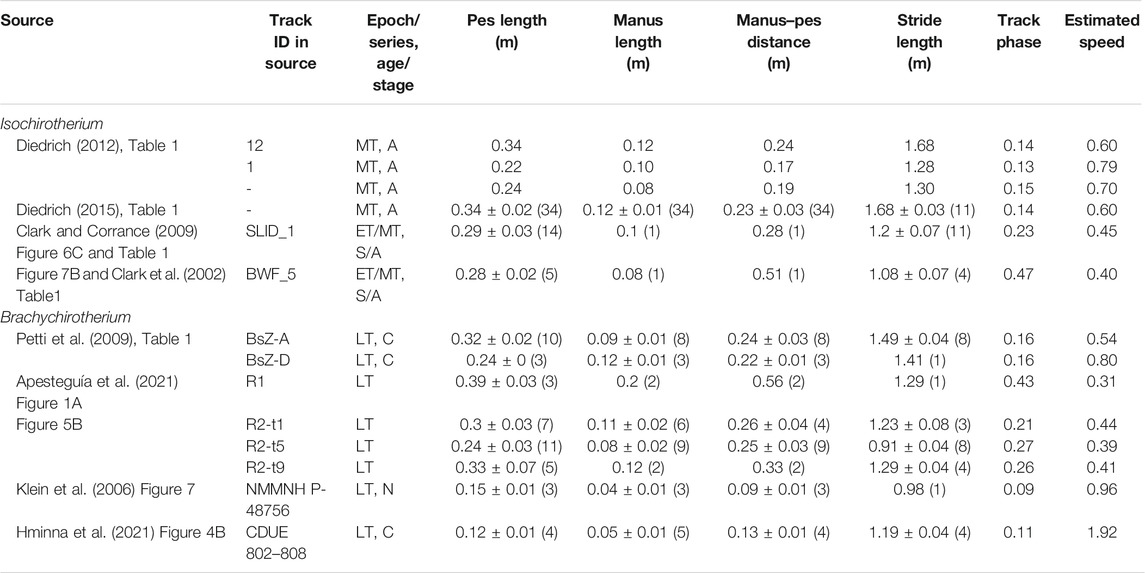
TABLE 2. Summary data for Isochirotherium and Brachychirotherium trackways. Values are means ± standard deviation (sample size). Speed is normalized to presumed hip height. ET, Early Triassic; MT, Middle Triassic; LT, Late Triassic; A, Anisian; C, Carnian; N, Norian; S, “Scythian.”
Altogether, the fossil trackways exhibit a sharp reduction of the track phase with an increasing speed for slow speeds, following the analytical line for a trot (Figure 5). Above
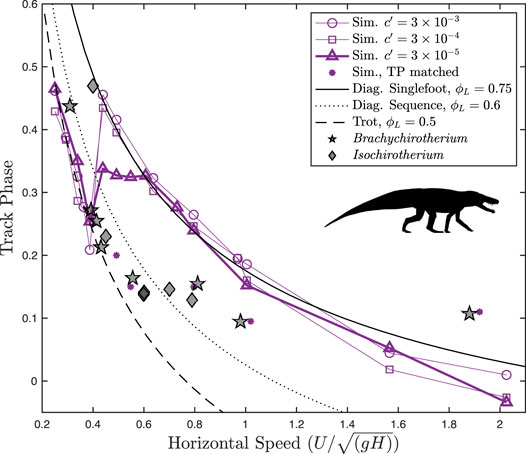
FIGURE 5. Track phase plotted against speed for Batrachotomus vs. fossil chirotheriid trackways. Different levels of the force-rate penalty
We estimated the horizontal glenoacetabular distance (
Scaling the fossil trackways to the Batrachotomus reconstruction yields estimated
Batrachotomus Simulation Results
Optimization predicts that Batrachotomus should have used a walking trot at slow speeds (
At the highest force-rate penalty, the walking trot exhibits typical “vaulting” double-humped ground reaction force profiles (Figure 6A), with simultaneous contacts between fore- and hindlimbs. As speed increases, the hindlimbs continue to vault, while the single-humped force profile in the forelimbs indicates a bouncing mode (Figure 6B). At the theoretical limit for vaulting in the hindlimbs (
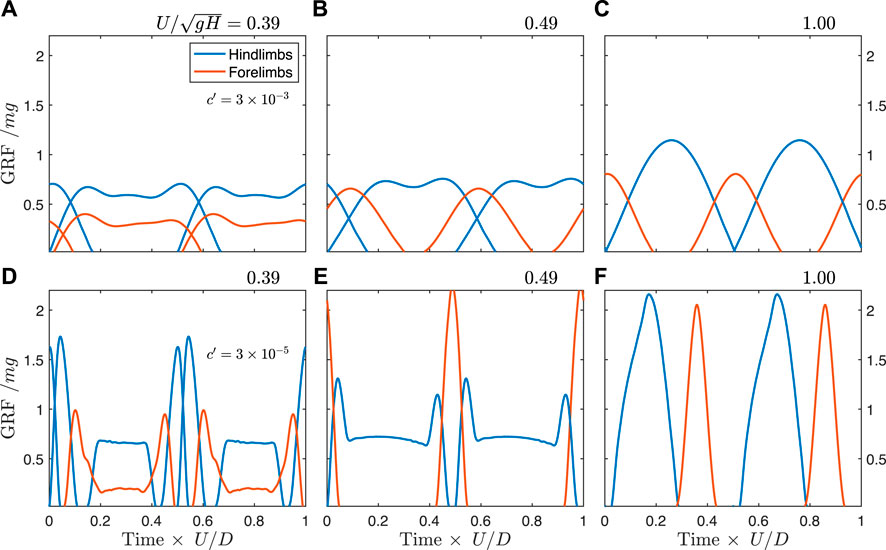
FIGURE 6. Predicted ground reaction forces from simulation for the unconstrained Batrachotomus model with a force-rate penalty of
When solutions are constrained to match the track phase trends of the fossil trackways, the ground reaction forces differ somewhat from the unconstrained case. Prior to the transition to a constant track phase, the optimal solution transitions away from a vaulting, walking trot, and exhibits vaulting hindlimbs with skewed ground reaction forces in the forelimbs indicating an asymmetrical (generative) bouncing mode (Figure 7A, see also Supplementary Video S2). This same gait is used at the transition to the constant track phase (Figure 7B), but gradually shifts to bouncing in both fore- and hindlimbs, similar to the unconstrained case (Figure 7C). As speed increases further, the solution remains the same, but with a lower duty factor and higher peak forces.
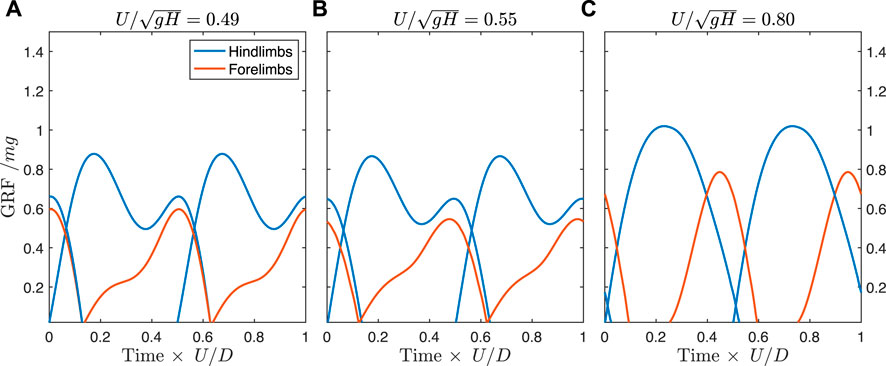
FIGURE 7. Predicted ground reaction forces for the Batrachotomus model constrained to match the empirical track phase. (A) By a speed of 0.49, the optimal solution is to use skewed ground reaction forces in the forelimbs, with semi-vaulting forces in the hindlimbs. (B) This pattern is preserved at the transition point where the track phase remains constant with increasing speed. (C) By a speed of 0.80, the solution shifts to a running tölt, similar to the unconstrained case but differing in the timing of forelimb contact. The same solution is found at faster speeds in the constrained case, but with lower duty factor and higher peak forces (see Supplementary Video S2 for animations).
The constrained solutions exhibit higher costs than the unconstrained solutions (Supplementary Figure S2A). The difference in cost is largest at intermediate speeds and smaller at faster speeds. At
Discussion
The simulation method predicts the canine track phase within natural variation, though predicted values are consistently below the mean empirical values (Figure 3). The model correctly predicts the symmetrical walking and running gaits used by dogs, the shape of their ground reaction forces (Figure 4), and the gait transition speed. This gives us some confidence in applying the model to forms where only the stride length, size, and shape can be estimated, and gait is unknown.
Brachychirotherium trackways follow a consistent pattern with the track phase and speed: a sharp reduction with increasing speeds below
At all force-rate penalties, the simulation data correctly predict a walking trot at slow speeds, closely following the analytical curve. In all cases, the optimal gait transitions at around
At speeds above 0.4, however, the simulations differ markedly from fossil trackways in the track phase. Still, the trackways exhibit stark changes in the track phase, at around
Although the fossil trackways exhibit manus placed cranially to the ipsilateral pes in a couplet, qualitatively matching modern crocodylians in a walking trot (Kubo, 2008), the long trackway stride lengths imply gaits more similar to a dissociated trot or diagonal sequence. Modern crocodylians, the closest living relatives of Batrachotomus, do not normally transition to a four-beat gait at faster speeds, instead either continuing to trot or transitioning to asymmetrical gaits (Hutchinson et al., 2019). Although extant crocodylians do exhibit an increase in the limb phase as the speed increases for symmetrical gaits (Supplementary Figure S3), the change is much more gradual than observed here. Crocodylians do not always walk with the lateral sequence diagonal-couplet gait (Supplementary Figure S3; Hutchinson et al., 2019) held to be ancestral for quadrupedal gnathostomes (Wimberly et al., 2021). However, these results represent the first evidence that extinct pseudosuchians exhibited different gaits than their modern relatives, and the first evidence of a gait transition in an extinct pseudosuchian.
The use of a two-beat gait at slow speeds, and a four-beat gait at fast speeds, is consistent with an analysis by Polet (2021b). The large pitch moment of inertia of Batrachotomus relative to its glenoacetabular distance gives it a Murphy number of 3. Above a Murphy number of 1, a four-beat run is optimal because the energetic cost of pitching the body is lower than the energetic cost of moving the body up and down, and so it is not economical to reject pitching by using a trotting gait. However, in order to maintain vaulting in a typical four-beat walk, the body must pitch, which is energetically expensive for an animal with a large pitch moment of inertia. For this reason, a walking trot is favored at slow speeds.
Both the unconstrained and constrained cases exhibit similar solutions in ground reaction forces, but these are skewed in the latter case. In the unconstrained case, the forelimb is nearly vertical when the hindlimbs are in double support (Figure 8A). By having peak force at midstance, it can effectively offload the weight of the body during the costly step transition for the hindlimbs (Schroeder and Bertram, 2018). At the same time, the symmetrical, single-hump profile acts as a distributed pseudo-elastic “collision” (Figure 6B), which minimizes the cost of limb work while managing the force-rate penalty (Ruina et al., 2005; Rebula and Kuo, 2015).
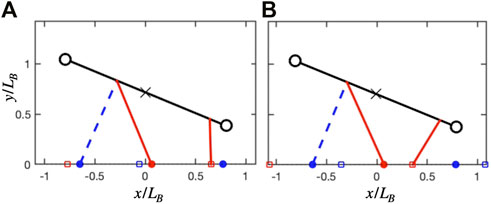
FIGURE 8. Geometry at hindlimb step transition for the unconstrained and constrained track phase cases, both at
In the constrained case, the shoulder is flexed during double support (Figure 8A), meaning that any pushing forces from the leg will generate both vertical and forward propulsion of the center of mass. This is less effective for offloading weight during transfer of support, but does contribute to the pre-transfer pushoff of the hindlimbs, which mitigates work-related energetic losses (Ruina et al., 2005; Rebula and Kuo, 2015; Schroeder and Bertram, 2018). Therefore, the force in the forelimbs can increase, while the second peak in the hindlimbs can decrease (Figure 7A). The asymmetry however results in a generative (plastic) distributed “collision,” which typically requires more work than a symmetrical (pseudo-elastic) collision (Ruina et al., 2005).
The transition of trackways away from the analytical walking trot line occurs at around
When the gait transition seems to occur in the trackway data, the ipsilateral manus and pes prints are nearly overstepping. Increasing the speed further without changing gait would result in overstepping, and would result in a collision of the ipsilateral manus and pes, unless the animal changed its limb orientations. Is it possible that the gait transition we infer here was forced due to this physical constraint, rather than any energetic consideration?
In modern crocodylians, foot collision appears to be avoided in the walking trot by changing yaw of the body so that the craniocaudal axis is not exactly aligned with the direction of motion. This results in manus prints being placed slightly to the left or right of pes prints (Kubo, 2008; see Figures 2A,E therein). This strategy is also employed by dogs when trotting, as can be seen in traces (Murie and Elbroch, 2005). There is no a priori reason to expect that “rauisuchians” such as Batrachotomus would have been unable to yaw their bodies in the same way in order to continue to employ a walking trot at higher speeds. Likewise, the planar model we use here is not constrained to avoid collisions of ipsilateral legs or feet. The transition, in this case, is driven completely by energetic considerations.
The earlier transition from a trot in the simulations (around
This is perhaps also reflected in the ratio between estimated horizontal glenoacetabular distance and pes length (
While the simulations provide evidence of a gait transition in the trackmakers, they do not predict the track phase well except at slow speeds. There may be several reasons for this discrepancy. First, the model may not accurately capture the energetics of gait alternatives in “rauisuchians.” This may be due to neglecting important morphological features (e.g., legs with inertia), or physiological characteristics (e.g., muscles with force–velocity characteristics). Second, the trackmakers may not have followed the simple stride length to speed relationship proposed by Alexander (1976; based mainly on mammals). One reason may be due to a relatively reduced hip flexion and extension in some “rauisuchians” (Nesbitt et al., 2013), which was not considered in the present analysis. Third, the trackmaker may not resemble Batrachotomus in proportion, mass distribution, or other key areas. Finally, it is possible that energetics were not key determinants of locomotion for these trackmakers. The soft substrate where these tracks were formed, for example, could affect gait choice and phase relationships. Future developments in predictive simulation of pseudosuchian locomotion can address some of these issues by adding realism and evaluating the models within extant crocodylians.
Conclusion
We applied a planar, generalized quadrupedal model to the gait of Batrachotomus kupferzellensis, an extinct crocodile-line (pseudosuchian) archosaur. We compared our predictions to fossil trackways putatively left by close relatives of Batrachotomus. When optimized to minimize leg work and force rate squared, the model correctly predicted a sharp reduction in the track phase with speed, corresponding to a trot, at low speeds. Next, the model predicted a transition to a four-beat walk similar to a slow tölt, near the region where the fossil trackways deviated from the walking trot trajectory and appeared to transition to a diagonal sequence gait. Finally, when the fossil trackways exhibited another sharp transition in the track phase, the model predicted a transition to a four-beat gait similar to a fast tölt. This represents the first evidence of a gait transition in an extinct pseudosuchian, and the first evidence that “rauisuchians” like Batrachotomus may have exhibited some gaits different from modern crocodylians.
Because Batrachotomus is inferred to have had features of both modern crocodylians and mammals, trajectory optimization provides an opportunity to understand their gait where no direct analogue exists. According to the optimization results, the large pitch moment of inertia and erect limb posture of Batrachotomus made a tölt-like gait favorable, something not seen in any archosaurian group today and rare in mammals. This raises exciting questions, such as when this suite of gaits evolved in pseudosuchians or how often it did, and what the ancestral state was for Archosauria (birds, crocodiles, and all extinct descendants of their common ancestor, including Mesozoic dinosaurs). More sophisticated three-dimensional models incorporating lateral motions and more realistic morphology (e.g., Bishop et al., 2021) or analysis of neuromuscular control and stability may provide further insight.
Data Availability Statement
The raw data supporting the conclusion of this article will be made available by the authors, without undue reservation.
Author Contributions
The project was conceived by DP and JH, and both authors gathered data from the literature and wrote the manuscript. DP digitized trackways, analyzed data, and performed the simulations.
Funding
This work was supported by the European Research Council Advanced Investigator Award (Grant agreement ID: 695517) to JH.
Conflict of Interest
The authors declare that the research was conducted in the absence of any commercial or financial relationships that could be construed as a potential conflict of interest.
Publisher’s Note
All claims expressed in this article are solely those of the authors and do not necessarily represent those of their affiliated organizations, or those of the publisher, the editors, and the reviewers. Any product that may be evaluated in this article, or claim that may be made by its manufacturer, is not guaranteed or endorsed by the publisher.
Acknowledgments
We thank Ashleigh Wiseman for her prior helpful discussions. We also thank Vivian Allen, Andrew Cuff and Peter Bishop for preparing the Batrachotomus model, as well as Eudald Mujal and Shinya Aoi for their thoughtful reviews, which greatly enhanced the manuscript.
Supplementary Material
The Supplementary Material for this article can be found online at: https://www.frontiersin.org/articles/10.3389/fbioe.2021.800311/full#supplementary-material
References
Abramoff, M. D., Magalhães, P. J., and Ram, S. J. (2004). Image Processing with ImageJ. Biophotonics Int. 11, 36–42.
Alexander, R. M. (1976). Estimates of Speeds of Dinosaurs. Nature 261, 129–130. doi:10.1038/261129a0
Apesteguía, S., Riguetti, F., Citton, P., Veiga, G. D., Poiré, D. G., de Valais, S., et al. (2021). The Ruditayoj-Tunasniyoj Fossil Area (Chuquisaca, Bolivia): a Triassic Chirotheriid Megatracksite and Reinterpretation of Purported Thyreophoran Tracks. Hist. Biol. 33, 2883–2896. doi:10.1080/08912963.2020.1833328
Bertram, J. E. A., Lee, D. V., Case, H. N., and Todhunter, R. J. (2000). Comparison of the Trotting Gaits of Labrador Retrievers and Greyhounds. Am. J. Vet. Res. 61, 832–838. doi:10.2460/ajvr.2000.61.832
Biknevicius, A. R., Mullineaux, D. R., and Clayton, H. M. (2004). Ground Reaction Forces and Limb Function in Tölting Icelandic Horses. Equine Vet. J. 36, 743–747. doi:10.2746/0425164044848190
Bishop, P. J., Bates, K. T., Allen, V. R., Henderson, D. M., Randau, M., and Hutchinson, J. R. (2020). Relationships of Mass Properties and Body Proportions to Locomotor Habit in Terrestrial Archosauria. Paleobiology 46, 550–568. doi:10.1017/pab.2020.47
Bishop, P. J., Falisse, A., De Groote, F., and Hutchinson, J. R. (2021). Predictive Simulations of Running Gait Reveal a Critical Dynamic Role for the Tail in Bipedal Dinosaur Locomotion. Sci. Adv. 7, eabi7348. doi:10.1126/sciadv.abi7348
Bonaparte, J. F. (1984). Locomotion in Rauisuchid Thecodonts. J. Vertebr. Paleontol. 3, 210–218. doi:10.1080/02724634.1984.10011976
Clark, N. D. L., Aspen, P., and Corrance, H. (2002). Chirotherium barthii Kaup 1835 from the Triassic of the Isle of Arran, Scotland. Scottish J. Geology. 38, 83–92. doi:10.1144/sjg38020083
Clark, N. D. L., and Corrance, H. (2009). New Discoveries of Isochirotherium herculis (Egerton 1838) and a Reassessment of Chirotheriid Footprints from the Triassic of the Isle of Arran, Scotland. Scottish J. Geology. 45, 69–82. doi:10.1144/0036-9276/01-362
Diedrich, C. (2015). Isochirotherium Trackways, Their Possible Trackmakers (?Arizonasaurus): Intercontinental Giant Archosaur Migrations in the Middle Triassic Tsunami-Influenced Carbonate Intertidal Mud Flats of the European Germanic Basin. Carbonates Evaporites 30, 229–252. doi:10.1007/s13146-014-0228-z
Diedrich, C. (2012). Middle Triassic Chirotherid Trackways on Earthquake Influenced Intertidal Limulid Reproduction Flats of the European Germanic Basin Coasts. Cent. Eur. J. Geo. 4, 495–529. doi:10.2478/s13533-011-0080-9
Gill, P. E., Murray, W., and Saunders, M. A. (2005). SNOPT: An SQP Algorithm for Large-Scale Constrained Optimization. SIAM Rev. 47, 99–131. doi:10.1137/s0036144504446096
Gill, P. E., Murray, W., Saunders, M. A., and Wong, E. (2015). User’s Guide for SNOPT 7.5: Software for Large-Scale Nonlinear Programming. La Jolla, CASan Diego: Department of Mathematics, University of California.
Gower, D. J., and Schoch, R. R. (2009). Postcranial Anatomy of the Rauisuchian archosaur Batrachotomus kupferzellensis. J. Vertebr. Paleontol. 29, 103–122. doi:10.1080/02724634.2009.10010365
Gower, D. (1999). The Cranial and Mandibular Osteology of a New Rauisuchian Archosaur from the Middle Triassic of Southern Germany. Stuttgarter Beiträge Zur Naturkunde. Serie B (Geologie Paläontologie) 280, 1–49.
Griffin, T. M., Main, R. P., and Farley, C. T. (2004). Biomechanics of Quadrupedal Walking: How Do Four-Legged Animals Achieve Inverted Pendulum-like Movements? J. Exp. Biol. 207 (2072), 3545–3558. doi:10.1242/jeb.01177
Henderson, D. M. (2003). Effects of Stomach Stones on the Buoyancy and Equilibrium of a Floating Crocodilian: a Computational Analysis. Can. J. Zool. 81, 1346–1357. doi:10.1139/z03-122
Hminna, A., Klein, H., Zouheir, T., Lagnaoui, A., Saber, H., Lallensack, J. N., et al. (2021). The Late Triassic Archosaur Ichnogenus Brachychirotherium: First Complete Step Cycles from Morocco, North Africa, with Implications for Trackmaker Identification and Ichnotaxonomy. Hist. Biol. 33, 723–736. doi:10.1080/08912963.2019.1658097
Hutchinson, J. R., Felkler, D., Houston, K., Chang, Y.-M., Brueggen, J., Kledzik, D., et al. (2019). Divergent Evolution of Terrestrial Locomotor Abilities in Extant Crocodylia. Sci. Rep. 9, 19302. doi:10.1038/s41598-019-55768-6
Hutson, J. D., and Hutson, K. N. (2015). Inferring the Prevalence and Function of finger Hyperextension in Archosauria from finger‐joint Range of Motion in the American alligator. J. Zool 296, 189–199. doi:10.1111/jzo.12232
Jayes, A. S., and Alexander, R. M. (1978). Mechanics of Locomotion of Dogs (Canis familiaris) and Sheep (Ovis aries). J. Zoolog. 185, 289–308. doi:10.1111/j.1469-7998.1978.tb03334.x
Klein, H., Lucas, S. G., and Haubold, H. (2006). “Tetrapod Track Assemblage of the Redonda Formation (Upper Triassic, Chinle Group) in East-central New Mexico – Reevaluation of Ichnofaunal Diversity from Studies of New Material,” in The Triassic-Jurassic Terrestrial Transition. Editors J. D. Harris, S. G. Lucas, J. A. Speilmann, M. G. Lockley, A. R. C. Milner, and J. I. Kirkland (Albuquerque, New Mexico: New Mexico Museum of Natural History and Science), 241–250.
Klein, H., and Lucas, S. G. (2021). The Triassic Tetrapod Footprint Record. Albuquerque, New Mexico: New Mexico Museum of Natural History and Science.
Kubo, T. (2008). In Quest of the Pteraichnus Trackmaker: Comparisons to Modern Crocodilians. Acta Palaeontologica Pol. 53, 405–412. doi:10.4202/app.2008.0304
Maes, L. D., Herbin, M., Hackert, R., Bels, V. L., and Abourachid, A. (2008). Steady Locomotion in Dogs: Temporal and Associated Spatial Coordination Patterns and the Effect of Speed. J. Exp. Biol. 211, 138–149. doi:10.1242/jeb.008243
Murie, O. J., and Elbroch, M. (2005). A Field Guide to Animal Tracks. New York, NY: Houghton Mifflin Harcourt.
Nesbitt, S. J., Brusatte, S. L., Desojo, J. B., Liparini, A., De França, M. A. G., Weinbaum, J. C., et al. (2013). Rauisuchia. Geol. Soc. Lond. Spec. Publications 379 (1), 241–274. doi:10.1144/SP379.1
Nyakatura, J. A., Melo, K., Horvat, T., Karakasiliotis, K., Allen, V. R., Andikfar, A., et al. (2019). Reverse-engineering the Locomotion of a Stem Amniote. Nature 565, 351–355. doi:10.1038/s41586-018-0851-2
Parrish, J. M. (1986). Locomotor Adaptations in the Hindlimb and Pelvis of the Thecodontia. Hunteria 1, 2–35.
Patterson, M. A., and Rao, A. V. (2014). GPOPS-II. ACM Trans. Math. Softw. 41, 1–37. doi:10.1145/2558904
Petti, F. M., Avanzini, M., Nicosia, U., Girardi, S., Bernardi, M., Ferretti, P., et al. (2009). Late Triassic (Early-middle Carnian) Chirotherian Tracks from the Val Sabbia Sandstone (Eastern Lombardy, Brescian Prealps, Northern Italy). Riv. Ital. di Paleontol. e Stratigr. 115, 277–290. doi:10.13130/2039-4942/6384
Polet, D. T., and Bertram, J. E. A. (2019). An Inelastic Quadrupedal Model Discovers Four-Beat Walking, Two-Beat Running, and Pseudo-elastic Actuation as Energetically Optimal. PLOS Comput. Biol. 15, e1007444. doi:10.1371/journal.pcbi.1007444
Polet, D. T. (2021a). Delyle/Optimize-Symmetrical-Quadruped: Optimize Symmetrical Quadruped. Zenodo. doi:10.5281/zenodo.5593594
Polet, D. T. (2021b). The Murphy Number: How Pitch Moment of Inertia Dictates Quadrupedal Walking and Running Energetics. J. Exp. Biol. 224, jeb228296. doi:10.1242/jeb.228296
Rebula, J. R., and Kuo, A. D. (2015). The Cost of Leg Forces in Bipedal Locomotion: A Simple Optimization Study. PLOS ONE 10, e0117384. doi:10.1371/journal.pone.0117384
Renders, E. (1984). The Gait of Hipparion Sp. From Fossil Footprints in Laetoli, Tanzania. Nature 308, 179–181. doi:10.1038/308179a0
Ruina, A., Bertram, J. E. A., and Srinivasan, M. (2005). A Collisional Model of the Energetic Cost of Support Work Qualitatively Explains Leg Sequencing in Walking and Galloping, Pseudo-elastic Leg Behavior in Running and the Walk-To-Run Transition. J. Theor. Biol. 237, 170–192. doi:10.1016/j.jtbi.2005.04.004
Schroeder, R. T., and Bertram, J. E. (2018). Minimally Actuated Walking: Identifying Core Challenges to Economical Legged Locomotion Reveals Novel Solutions. Front. Robot. AI 5, 58. doi:10.3389/frobt.2018.00058
Srinivasan, M. (2010). Fifteen Observations on the Structure of Energy-Minimizing Gaits in many Simple Biped Models. J. R. Soc. Interf. 8, 74–98. doi:10.1098/rsif.2009.0544
Stevens, K. A., Ernst, S., and Marty, D. (2016). “Uncertainty and Ambiguity in the Interpretation of Sauropod Trackways,” in Dinosaur Tracks: The Next Steps Life of the Past. Editors P. L. Falkingham, D. Marty, and A. Richter (Bloomington, IN: Indiana University Press), 227–243.
Usherwood, J. R. (2020). An Extension to the Collisional Model of the Energetic Cost of Support Qualitatively Explains Trotting and the Trot-Canter Transition. J. Exp. Zool. 333, 9–19. doi:10.1002/jez.2268
Vincelette, A. (2021). Determining the Gait of Miocene, Pliocene, and Pleistocene Horses from Fossilized Trackways. Foss. Rec. 24, 151–169. doi:10.5194/fr-24-151-2021
Wikimedia Commons (2010). Diagram of Brachychirotherium. Available at: https://commons.wikimedia.org/wiki/File:Brachychirotherium.svg (Accessed September 9, 2021).
Willey, J. S., Biknevicius, A. R., Reilly, S. M., and Earls, K. D. (2004). The Tale of the Tail: Limb Function and Locomotor Mechanics in Alligator mississippiensis. J. Exp. Biol. 207, 553–563. doi:10.1242/jeb.00774
Wimberly, A. N., Slater, G. J., and Granatosky, M. C. (2021). Evolutionary History of Quadrupedal Walking Gaits Shows Mammalian Release from Locomotor Constraint. Proc. R. Soc. B. 288, 20210937. doi:10.1098/rspb.2021.0937
Xi, W., Yesilevskiy, Y., and Remy, C. D. (2016). Selecting Gaits for Economical Locomotion of Legged Robots. Int. J. Robotics Res. 35, 1140–1154. doi:10.1177/0278364915612572
Keywords: locomotion, predictive simulation, Pseudosuchia, fossil trackways, energetics, Chirotheriidae
Citation: Polet DT and Hutchinson JR (2022) Estimating Gaits of an Ancient Crocodile-Line Archosaur Through Trajectory Optimization, With Comparison to Fossil Trackways. Front. Bioeng. Biotechnol. 9:800311. doi: 10.3389/fbioe.2021.800311
Received: 22 October 2021; Accepted: 30 December 2021;
Published: 03 February 2022.
Edited by:
Bernardo Innocenti, Université libre de Bruxelles, BelgiumReviewed by:
Eudald Mujal, Staatliches Museum für Naturkunde Stuttgart, GermanyShinya Aoi, Kyoto University, Japan
Copyright © 2022 Polet and Hutchinson. This is an open-access article distributed under the terms of the Creative Commons Attribution License (CC BY). The use, distribution or reproduction in other forums is permitted, provided the original author(s) and the copyright owner(s) are credited and that the original publication in this journal is cited, in accordance with accepted academic practice. No use, distribution or reproduction is permitted which does not comply with these terms.
*Correspondence: Delyle T. Polet, ZHBvbGV0QHJ2Yy5hYy51aw==; John R. Hutchinson, amh1dGNoaW5zb25AcnZjLmFjLnVr
†ORCID: Delyle T. Polet, orcid.org/0000-0002-8299-3434; John R. Hutchinson, orcid.org/0000-0002-6767-7038
 Delyle T. Polet
 John R. Hutchinson