 Suchada Chanprateep Napathorn
 Sirirat Visetkoop2
 Kenji Okano
 Kohsuke Honda
95% of researchers rate our articles as excellent or good
Learn more about the work of our research integrity team to safeguard the quality of each article we publish.
Find out more
ORIGINAL RESEARCH article
Front. Bioeng. Biotechnol. , 03 May 2021
Sec. Industrial Biotechnology
Volume 9 - 2021 | https://doi.org/10.3389/fbioe.2021.661096
This article is part of the Research Topic Advances and Trends in Polyhydroxyalkanoate (PHA) Biopolymer Production View all 11 articles
Cupriavidus necator strain A-04 has shown 16S rRNA gene identity to the well-known industrial strain C. necator H16. Nevertheless, the cell characteristics and polyhydroxyalkanoate (PHA) production ability of C. necator strain A-04 were different from those of C. necator H16. This study aimed to express PHA biosynthesis genes of C. necator strain A-04 in Escherichia coli via an arabinose-inducible expression system. In this study, the PHA biosynthesis operon of C. necator strain A-04, consisting of three genes encoding acetyl-CoA acetyltransferase (phaAA–04, 1182 bp, 40.6 kDa), acetoacetyl-CoA reductase (phaBA–04, 741 bp, 26.4 kDa) and PHB synthase Class I (phaCA–04, 1770 bp), was identified. Sequence analysis of the phaAA–04, phaBA–04, and phaCA–04 genes revealed that phaCA–04 was 99% similar to phaCH16 from C. necator H16. The difference in amino acid residue situated at position 122 of phaCA–04 was proline, whereas that of C. necator H16 was leucine. The intact phaCABA–04 operon was cloned into the arabinose-inducible araBAD promoter and transformed into E. coli strains Top 10, JM109 and XL-1 blue. The results showed that optimal conditions obtained from shaken flask experiments yielded 6.1 ± 1.1 g/L cell dry mass (CDM), a PHB content of 93.3 ± 0.9% (w/w) and a productivity of 0.24 g/(L⋅h), whereas the wild-type C. necator strain A-04 accumulated 78% (w/w) PHB with a productivity of 0.09 g/(L⋅h). Finally, for the scaled-up studies, fed-batch cultivations by pH-stat control in a 5-L fermenter of E. coli strains XL1-Blue harboring pBAD/Thio-TOPO-phaCABA–04 and pColdTF-phaCABA–04 in MR or LB medium, leading to a PHB production of 31.4 ± 0.9 g/L at 54 h with a PHB content of 83.0 ± 3.8% (w/w), a CDM of 37.8 ± 1.2 g/L, a YP/S value of 0.39 g PHB/g glucose and a productivity of 0.6 g PHB/(L⋅h) using pColdTF-phaCABA–04 in MR medium. In addition, PHB production was 29.0 ± 1.1 g/L with 60.2 ± 2.3% PHB content in the CDM of 53.1 ± 1.0 g/L, a YP/S value of 0.21 g PHB/g glucose and a productivity of 0.4 g PHB/(L⋅h) using pBAD/Thio-TOPO-phaCABA–04 in LB medium. Thus, a relatively high PHB concentration and productivity were achieved, which demonstrated the possibility of industrial production of PHB.
Microplastic pollution continues to induce negative impacts that harm both animals and ecosystems. Nevertheless, the plastic manufacturing sector has moved to a circular economy that calls for upstream and downstream industry collaborations in chemical and mechanical recycling to create new resins offered with recycled and biobased content (Hahladakis et al., 2020). However, awareness among consumers regarding the efficient postuse of petrochemical plastics, the benefits of green material and government regulations that encourage people to adopt eco-friendly alternatives still promote the demand for bioplastics and biodegradable plastics. Recently, global bioplastic production capacity has been estimated to increase from 2.11 million tons in 2019 to approximately 2.43 million tons in 2024. Bioplastics can widely be used in a wide variety of markets and applications, from packaging, catering products, consumer electronics, automotive, agriculture, textiles and a number of other segments. Bioplastics consist of diverse materials and are primarily focused on renewable materials, including starch, cellulose, or bioethanol. Among them, polyhydroxyalkanoates (PHAs) and innovative biopolymers, such as biobased polypropylene, have received the highest attention and showed strong growth rates. Biodegradable plastics, which include PHAs, polylactic acid (PLA), starch blends and others, account for 55.5% (over 1 million tons) of the global bioplastic production capacities. The production of biodegradable plastics is expected to increase to 1,33 million in 2024, especially due to PHA’s significant growth rates (Bioplastics, 2020).
Nowadays, PHAs are one of the most preferable solutions to alleviate the conventional plastic pollution, especially for the preparation of PHAs microbeads that is required for the biodegradation of microbeads in marine environment. PHAs are a class of well-known microbial polyesters that possess unique advantages of thermoplastic, biocompatible and biodegradable properties. Based on their true biodegradable properties in various environments, PHAs are considered environmentally sustainable biodegradable plastics. However, PHAs have not yet become competitive and ecofriendly alternative materials to petrochemical plastics compared with semi-biosynthetic polymers, PLA and polybutylene succinate (PBS). The major problem is their high cost of production resulting from raw materials, solvent used in polymer extraction and purification, long cultivation time in the wild-type strain and small amount of obtained PHAs, even at its high PHA content from non-growth-associated PHA-producing strains. Recently, metabolic engineering approaches in which the PHA biosynthesis genes phaCAB and other related genes are cloned into Escherichia coli have been used to increase the efficiency of PHA production.
In our previous studies, we reported new isolated Cupriavidus necator strain A-04 that has shown the ability to produce PHAs [formerly reported as Alcaligenes sp. A-04 and Ralstonia eutropha A-04 (Chanchaichaovivat, 1992; Chanprateep et al., 2008)]. First, it has shown the ability to produce PHB from fructose and molasses. In 5 L fermentor, batch cultivation, the PHB produced was 7.21 g/L with PHB content of 82.12% (w/w) at 72 h when ammonium sulfate and fructose were 1.5 and 30.0 g/L, respectively. The amount of PHB produced from cane molasses was less than that obtained from fructose. The amount of PHB produced from molasses was 2.3 g/L with PHB content of 53.66% (w/w) at 72 h when 20% (w/v) of molasses was used as a carbon source and 0.1 g/L of ammonium sulfate was a nitrogen source (Phonprapai, 1994). It has also shown the ability to produce copolymer of poly(3-hydroxybutyrate-co-3-hydroxuvalerate) [P(3HB-co-3HV)], poly(3-hydroxybutyrate-co-4-hydroxybutyrate) (P(3HB-co-4HB)], and terpolymer of poly(3-hydroxybutrate-co-3-hydroxyvalerate-co-4-hydroxybutyrate) [P(3HB-co-3HV-co-4HB) with a wide range of monomer compositions from various organic acids (Surathikajon, 1994; Chanprateep and Kulpreecha, 2006; Chanprateep, 2010). Then, it was taxonomic characterization and it possessed 99.78% 16S RNA sequence similarity with C. necator H16, but it differed in PHA production ability based on PHB yield (YP/S, g-PHB/g-carbon) from butyric, valeric, γ-hydroxybutyric acid, and fructose (Chanprateep et al., 2008). It could incorporate a high mole fraction of monomeric 4-hydroxybutyrate monomeric into the poly(3-hydroxybutyrate-co-4-hydroxybutyrate) [P(3HB-co-4HB)] copolymer under a C/N ratio of 20 and the biocompatibility of P(3HB-co-4HB) produced was also reported (Chanprateep et al., 2010). Recently, it has also shown the ability to grow on pineapple wastes hydrolysate that contains mixtures of sugars and tolerate levulinic acid and 5-hydroxymethyl furfural, and a detoxification step was not required prior to the conversion of cellulose hydrolysate to PHB (Sukruansuwan and Napathorn, 2018). Therefore, we aimed to study the PHA biosynthesis operon of C. necator strain A-04 and to realize the capability of the PHA biosynthesis operon of C. necator strain A-04 when it was heterologously expressed in recombinant E. coli. There have been a number of exciting developments in the field of metabolic regulation in recent years, but only a few reports are based on the use of arabinose-inducible expression systems for PHA production (Horng et al., 2010; Wu et al., 2016). The objective of this work was to analyze phaCAB genes from the isolated C. necator strain A-04 and clone these genes for expression in an arabinose-inducible araBAD promoter (pBAD/Thio-TOPO vector) that have not been reported for PHB production. Here, we investigated the optimal conditions; L-arabinose concentration, four different media, glucose concentration for phaCABA–04 expression under pBAD/Thio-TOPO vector in shake flask cultivation. In fed-batch cultivation, phaCABA–04 expression under araBAD promoter was compared with the cspA promoter (a cold- and isopropyl-β-D-thiogalactoside (IPTG)-inducible vector, pColdTF) (Boontip, 2020) using a pH stat fed-batch cultivation strategy. Finally, high cell density of cell dry mass (CDM) 51.2 ± 1.0 g/L with PHB 29.0 ± 1.1 g/L was obtained in LB medium.
All bacterial strains and plasmids used in this study are listed in Table 1. C. necator strain A-04, which is a soil-isolated bacterium possessing 99.84% 16S rRNA identity to C. necator H16, was used as a wild-type PHB-producing strain (Chanprateep et al., 2008). E. coli JM109 [F′traD36 proA+B+lacIq(lacZ)ΔM15/Δ(lac-proAB) glnV44 e14- gyrA96 recA1 relA1 endA1 thi hsdR17] (Promega Corporation, Madison, WI, United States) was used for general genetic manipulation and for the production of PHB. E. coli Top10 [F– mcrA Δ(mrr-hsdRMS-mcrBC) Φ80 lacZΔ M15 ΔlacX74 recA1 araD139 Δ(ara-leu)7697 galU galK rpsL (StrR) endA1 nupG (Invitrogen, Carlsbad, CA, United States) was used for PHB production. E. coli XL1 Blue [recA1 endA1 gyrA96 thi-1 hsdR17 supE44 relA1 lac [F′ proAB lacIqZΔM15 Tn10 (Tetr)] (Promega Corporation, Madison, WI, United States) was used for PHB production in a 5 L fermenter. The pCR4-TOPO vector (Invitrogen, Carlsbad, CA, United States) was used for cloning the phaCAB and phaC genes. The pBAD/Thio-TOPO vector (Invitrogen, Carlsbad, CA, United States) was used as a final vector for the phaCAB expression plasmid. C. necator strain A-04 was cultivated in pre-culture medium consisting of 10 g/L yeast extract, 10 g/L polypeptone, 5 g/L beef extract, and 5 g/L (NH4)2SO4 at 30°C at 200 rpm for 24 h. E. coli JM109 and E. coli Top10 were cultivated at 37°C in Luria-Bertani (LB) medium containing 10 g/L casein peptone, 10 g/L sodium chloride and 5 g/L yeast extract. The antibiotic ampicillin (100 μg/mL) or carbenicillin (50 μg/mL) was added to the medium to maintain the stability of the plasmids.
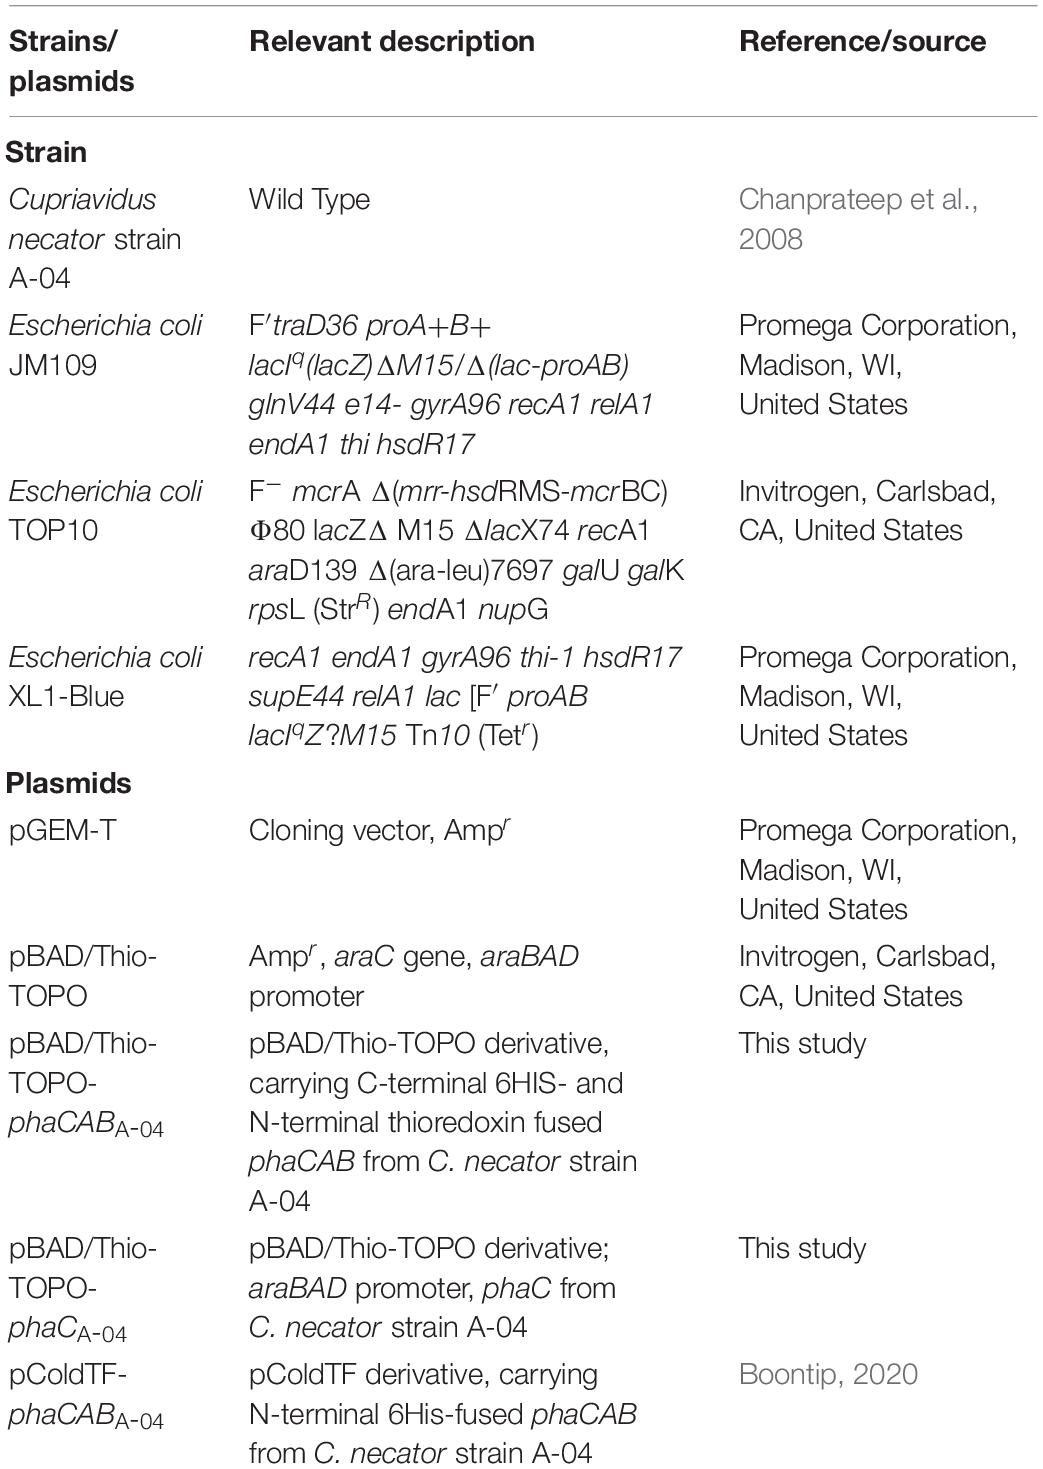
Table 1. Bacterial strains and plasmids used in this study.
Genomic DNA of C. necator strain A-04 was extracted by standard procedures (Sambrook and Russell, 2001). A partial fragment of the phaC gene from the genomic DNA of C. necator A-04 was amplified using two degenerate primers (F): 5′-TAYATHYTNGAYYTNCARCCNT-3′ and (R): 5′-CGYAGTHYCACAYYAGGTCG-3′, which were based on highly conserved regions of the phaC genes of Comamonas acidovorans (accession no. AB009273), Alcaligenes sp. strain SH-69 (accession no. U78047), Alcaligenes eutrophus (accession no. J05003), Aeromonas caviae (accession no. D88825) Rhodococcus rubber (accession no. X66407), Chromatium vinosum (accession no. 01112), and C. necator H16 (accession no. AM260479.1) (Sudesh et al., 1998). Next, the partial sequences (469 bp) of phaC were detected with degenerated PCR primers, and the subsequent sequences were obtained using the GenomeWalkerTM Universal Kit (Clontech Laboratories Inc., United States). In addition, two target-specific primers (forward primer (F0): 5′-TACATCCTGGACCTGCAGCC-3′ and reverse primer (R4): 5′-CGTAGTTCCACACCAGGTCG-3′) were designed based on the determined sequences. A GenomeWalkerTM Universal Kit was completed according to the manufacturer’s protocols. The amplified full-length genes of the entire pha locus containing the phaCA–04, phaAA–04, and phaBA–04 genes of C. necator strain A-04 were cloned into a pGEM-T easy vector (Promega, Madison, WI, United States) followed by transformation of the vectors into E. coli JM109 prior to DNA sequencing. DNA sequencing was performed at the Macrogen service center (Macrogen Inc., Seoul, Korea). The nucleotide sequences of phaCA–04, phaAA–04, and phaBA–04 reported here were deposited in the GenBank online database under accession numbers FJ897463.1, FJ897461.1, and FJ897462.1, respectively. In addition, the nucleotide sequences of the NAD-dependent 4-hydroxybutyrate dehydrogenase gene of C. necator strain A-04 were deposited in the GenBank online database under accession number MH243762.1.
Specific primers for the amplification of phaCAB were designed according to the sequences obtained. The oligonucleotide primers for the amplification of the phaCAB gene fragment were (F-phaCAB): 5′-ATGGCGACCGGCAAAG-3′ (forward primer) and (R-phaCAB): 5′- TCAGCCCATATGCAGGCC-3′ (reverse primer). The oligonucleotide primers for the amplification of the phaC gene fragment were (F-phaCAB): 5′-ATGGCGACCGGCAAAG-3′ (forward primer) and (R-phaC): 5′-TCATGCCTTGGCTTTGACG-3′ (reverse primer). PCR using the respective primers for the amplification of phaCAB and phaC genes from the genomic DNA of C. necator strain A-04 was carried out to obtain the ligated DNA fragments using Ex TaqTM DNA Polymerase (TaKaRa Bio Inc., Otsu, Japan) for ligation. The fragment was ligated to pBAD/Thio-TOPO® (Invitrogen, Carlsbad, CA, United States) according to the manufacturer’s protocol. A new plasmid named pBAD/Thio-TOPO-phaCABA–04 with the entire phaCABA–04 operon and pBAD/Thio-TOPO-phaCA–04 with phaCA–04 were transformed using a heat shock method (Sambrook and Russell, 2001) into E. coli JM109 and E. coli TOP10. The colonies were screened on LB agar containing carbenicillin (50 μg/mL), and the inserts were confirmed through PCR and restriction enzyme digestion.
Shaken flask experiments were performed in 500-mL Erlenmeyer flasks containing 100 mL of medium. E. coli JM109 and E. coli TOP10 transformants containing pBAD/Thio-TOPO-phaCABA–04 or pBAD/Thio-TOPO-phaCA–04 plasmid were grown in LB medium containing carbenicillin 50 μg/mL at 37°C and 200 rpm for 16–18 h. Subsequently, cells were harvested by centrifugation, washed to remove the medium and resuspended in 5 mL of 0.85% sodium chloride solution. The cells were separately inoculated into four different media: LB (10 g/L casein peptone, 10 g/L sodium chloride and 5 g/L yeast extract), superbroth (SB) (32 g/L tryptone, 5 g/L sodium chloride and 20 g/L yeast extract), 2YT (16 g/L tryptone, 5 g/L sodium chloride and 10 g/L yeast extract), and terrific broth (TB) (12 g/L tryptone, 4 mL glycerol and 24 g/L yeast extract) containing L-arabinose 0.2% (w/v), glucose 20 g/L and carbenicillin 50 μg/mL to evaluate suitable media for PHB production. Next, five concentrations of L-arabinose, 0.002, 0.02, 0.2, 0.5, and 2% (w/v), were separately added when an optical density at a wavelength of 600 nm (OD600) of 0.5–0.6 was obtained to induce the arabinose-inducible araBAD promoter for phaCABA04 or phaCA04 expression. Finally, the inoculum size was investigated by means of a colony forming unit (CFU) varying from 4.5 × 10⁸, 3.2 × 10⁹, and 1.5 × 10¹⁰ CFU in LB medium containing L-arabinose 1.0% (w/v), glucose 20 g/L and carbenicillin 50 μg/mL. Culture samples were taken at 12 h intervals for 96 h.
Polyhydroxyalkanoate production was confirmed by comparative staining using the modified Sudan Black B staining method (López-Cortés et al., 2008). Cell morphology and PHA granules were also observed by transmission electron microscopy (TEM) at Scientific and Technological Research Equipment Centre Chulalongkorn University, Bangkok, Thailand. For TEM, diluted culture from production medium was fixed in 2% (v/v) glutaraldehyde containing 2% (v/v) paraformaldehyde in 0.1 M phosphate buffer (pH 7.2) and was postfixed in 1% (w/v) osmium tetroxide. The cells were dehydrated in an ascending series of ethanol concentrations from 35 to 100% and embedded in Spurr resin (EMS, PA, United States). Thin sections were prepared with an LKB 2088 Ultratome V (Surrey, United Kingdom), stained with 2% (w/v) uranyl acetate and 2% (w/v) lead citrate and examined with TEM (JEM 2100, JEOL Ltd., Tokyo, Japan) at an accelerating voltage of 80 kV (Muangwong et al., 2016).
In this study, competent E. coli XL1 blue cells were transformed with pBAD/Thio-TOPO-phaCABA–04 and pColdTF-phaCABA–04. Seed cultures were prepared in LB medium containing 50 μg/mL carbenicillin or 100 μg/L ampicillin and 20 g/L glucose at 30°C and 200 rpm for 10 h at 200 rpm. For fed-batch culture, LB medium supplemented with 20 g/L glucose and MR medium supplemented with 20 g/L glucose and 10 mg/L thiamine were compared. MR medium, pH 7.0, consisted of the following: 13.5 g/L KH2PO4, 4.0 g/L (NH4)2HPO4, 1.4 g/L MgSO4⋅7H2O, 1.7 g/L citric acid and 10 mL/L trace metal solution. The trace metal solution contained the following (in 5 M HCl): 10.0 FeSO4⋅7H2O, 2.0 CaCl2, 2.2 ZnSO4⋅7H2O, 0.5 MnSO4⋅4H2O, 1.0 CuSO4⋅5H2O, 0.1 (NH4)6Mo7O24⋅4H2O, 0.02 Na2B4O7⋅10H2O (Kahar et al., 2005). The seed culture at 5% (v/v) was inoculated into a 5-L bioreactor (MDL500, B.E. Marubishi Co., Ltd., Tokyo, Japan) containing an initial volume of 2 L of LB medium supplemented with 50 μg/mL carbenicillin or 100 μg/L ampicillin and 20 g/L glucose in comparison with MR medium supplemented with 10 mg/L thiamine, 50 μg/mL carbenicillin or 100 μg/L ampicillin and 20 g/L glucose. Fed-batch cultures were carried out at 30°C, and the pH was maintained at 7.0 by automatic addition of 28% (v/v) ammonia hydroxide solution. The dissolved oxygen was monitored and controlled at above 10% air saturation by varying agitation and aeration. The feeding solution used for the fed-batch cultivation contained the following: 700 g/L glucose, 15 g/L MgSO4⋅7H2O and 0.25 g/L thiamine (Kahar et al., 2005). A pH stat feeding strategy using a pH electrode (Broadley-James Corporation, Irvine, CA, United States) based on increasing pH due to glucose depletion was used in this study. When the pH was greater than 7.0, an appropriate volume of feeding solution was fed to supply glucose to the culture medium. The fermenter was coupled to a process control system (Bio Process Controller, MDIAC-S5, B.E. Marubishi Co., Ltd., Tokyo, Japan). The agitation speed and the air flow rate were 500 rpm and 1 mL/min, respectively. After an OD600 of 0.5 was obtained, isopropyl-β-D-thiogalactopyranoside (IPTG) was added to the culture at a final concentration of 0.5 mM. Culture samples were collected at 6 h intervals for 72 h. For pColdTF-phaCABA–04, after an OD600 of 0.5 was obtained, the cultivation temperature was reduced from 37 to 15°C for 30 min. Next, IPTG was added to the culture at a final concentration of 0.5 mM. After IPTG addition, the cultivation temperature was shifted from 15 to 37°C and maintained at 37°C for 72 h (Boontip, 2020). Culture samples were collected at 6 h intervals for 48 h.
Cell growth was monitored by the CDM, which was determined by filtering 5 mL of the culture broth through pre-weighed cellulose nitrate membrane filters (pore size 0.22 μm; Sartorius, Göttingen, Germany). The filters were dried at 80°C for 2 days and stored in desiccators. The net biomass was defined as the residual cell mass (RCM), which was calculated by subtracting the amount of PHB from the CDM. The PHB in dried cells was methyl-esterified using a mixture of chloroform and 3% (v/v) methanol-sulfuric acid (1:1 v/v) (Braunegg et al., 1978). The resulting monomeric methyl esters were quantified by a gas chromatograph (model CP3800, Varian Inc., Walnut Creek, CA, United States) using a Carbowax-PEG capillary column (0.25-μm df, 0.25-mm ID, 30 m length, Agilent Technologies, Inc., Santa Clara, CA, United States). The internal standard was benzoic acid, and the external standard was PHB (Sigma-Aldrich Corp., St. Louis, MO, United States). The total reducing sugar concentration was determined using a 3,5-dinitrosalicylic acid (DNS) assay (Miller, 1959). The NH4+ concentration in the culture medium was determined using a colorimetric assay (Kemper, 1974).
Harvested cells were dried and extracted with 1,3-dioxolane, and PHB was recovered from 1,3-dioxolane by precipitation in water. The precipitation step was repeated three times (Yabueng and Napathorn, 2018).
1H and 13C NMR spectra of PHA samples were recorded on a Varian Inova 500 MHz instrument. The chemical shifts are reported in parts per million (ppm) relative to chloroform as an internal reference. Spectra were recorded using 5% (w/w) polymer solutions in CDCl3 with the following parameters: 25°C, pulse of 90 degrees, width of 8003.2 Hz, 5.0 s relaxation delay, and 0.2 Hz line broadening. Two-dimensional 1H-correlation spectroscopy (2D-1H-COSY) was performed in combination with 1H NMR on a Bruker AM 400 MHz FT-NMR (Bruker BioSpin Corporation, Woodland, TX, United States).
A 10-mg sample of PHB was encapsulated in an aluminum sample vessel and placed in the sample holding chamber of the differential scanning calorimetry (DSC) apparatus (DSC7, PerkinElmer, Inc., Waltham, MA, United States). STARe software (version SW 10.00; Mettler-Toledo International Inc., Columbus, OH, United States) was used to operate the DSC apparatus at the Petroleum and Petrochemical College, Chulalongkorn University. The previous thermal history of the sample was removed before the thermal analysis by heating the sample from ambient temperature to 180°C at 10°C/min. Next, the sample was maintained at 180°C for 5 min before cooling at 10°C/min to −50°C. The sample was then thermally cycled at 10°C/min to 180°C. The melting peak temperature, denoted by Tm, was given by the intersection of the tangent with the furthest point of an endothermic peak and the extrapolated sample baseline. The glass transition temperature, denoted by Tg, could be estimated by extrapolating the midpoint of the heat capacity difference between glassy and viscous states after heating of the quenched sample.
All the data presented in this manuscript are representative of the results of three independent experiments and are expressed as the mean values ± standard deviations (SDs). Analysis of variance (one-way ANOVA) followed by Duncan’s test for testing differences among means was conducted using SPSS version 22 (IBM Corp., Armonk, NY, United States). Differences were considered significant at P < 0.05.
Based on our study, the element composition of biomass represented by CHaObNc for C. necator H16 was CH1.77O0.50N0.24 with ash content of 5.31% (w/w) and C/N ratio based on biomass element composition was 4.09 whereas those for C. necator strain A-04 was CH1.66O0.45N0.16 with ash content of 2.865% (w/w) and C/N ratio of 6.37. For identification of the PHA biosynthesis genes of C. necator strain A-04, a partial fragment of the phaCA–04 gene (469 bp) was amplified from the genomic DNA using degenerate primers based on the highly conserved regions of phaC genes of C. acidovorans (accession no. AB009273), Alcaligenes sp. strain SH-69 (accession no. U78047), A. eutrophus (accession no. J05003), A. caviae (accession no. D88825), R. rubber (accession no. X66407), C. vinosum (accession no. 01112), and C. necator H16 (accession no. AM260479.1), as shown in Figure 1. In addition, after optimizing PCR conditions, it was found that the partial fragment of the phaCA–04 gene (469 bp) and phaCH16 gene (as a positive control, 460 bp) could be amplified from the genomic DNA using different MgCl2 concentration where C. necator H16 required higher MgCl2 concentration than that of C. necator strain A-04. Although, there seems to be a low opportunity to obtain new results contributing to the existing knowledge, it is very challenging to us to express PHA biosynthesis genes of C. necator strain A-04 in recombinant E. coli based on an academic point of view.
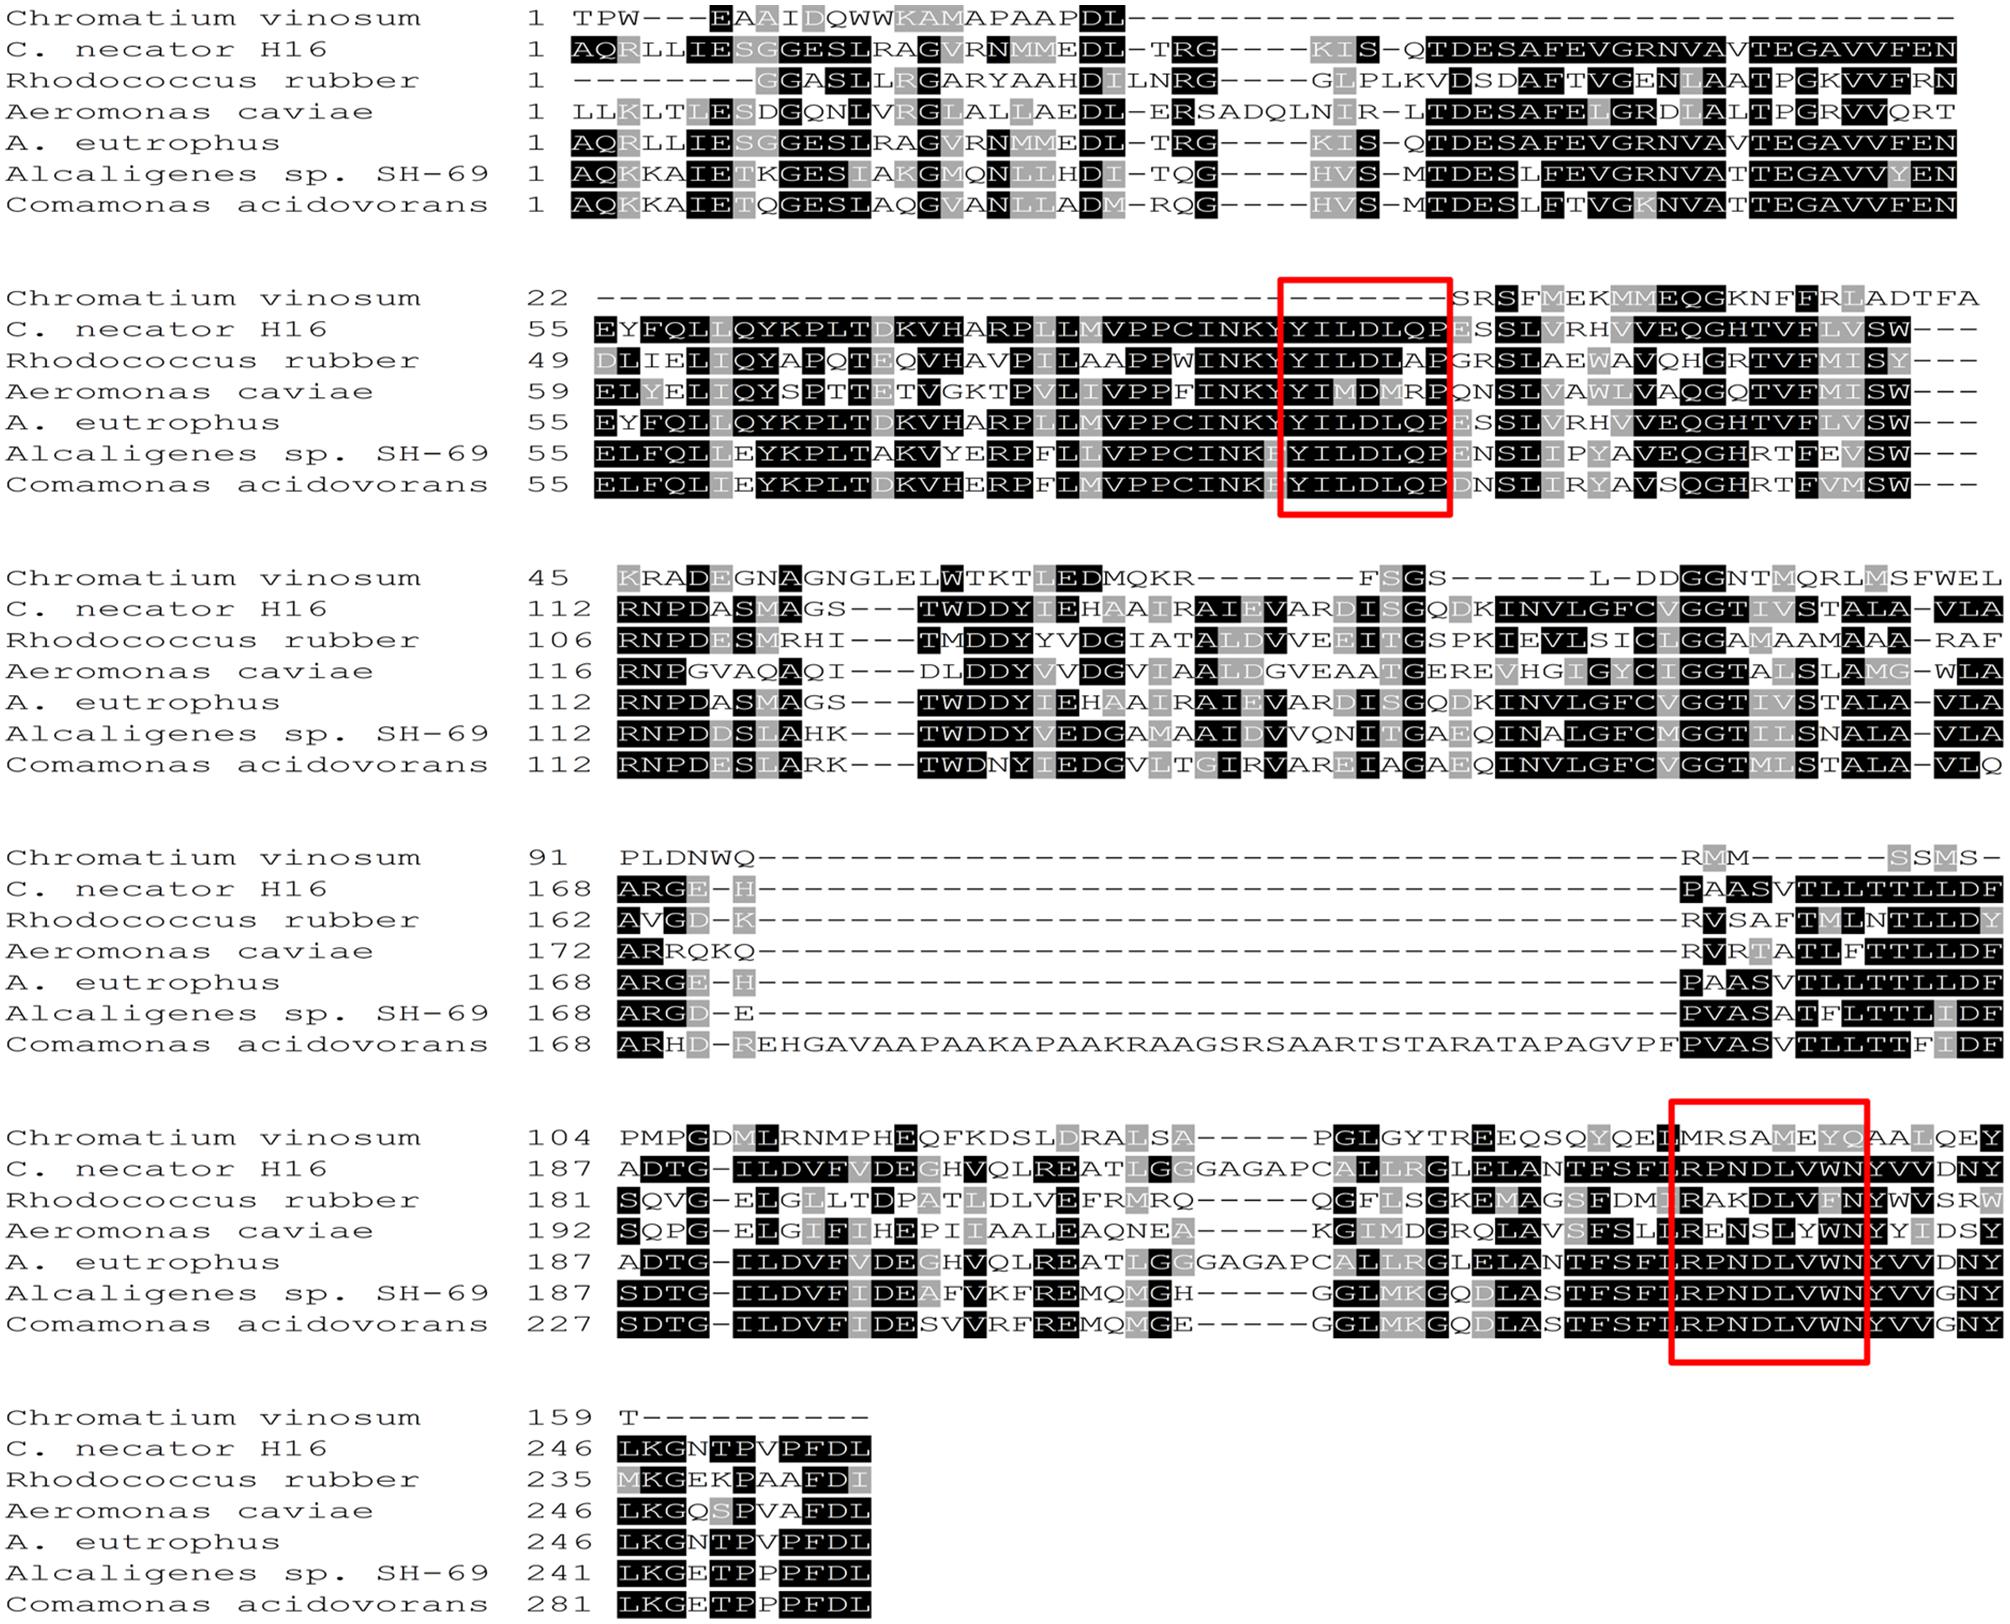
Figure 1. Alignment of the deduced amino acid sequence of the PHA synthase from Comamonas acidovorans (accession no. AB009273), Alcaligenes sp. strain SH-69 (accession no. U78047), A. eutrophus (accession no. J05003), Aeromonas caviae (accession no. D88825), Rhodococcus rubber (accession no. X66407), Chromatium vinosum (accession no. 01112), and C. necator H16 (accession no. AM260479.1) (Sudesh et al., 1998). Amino acids that are identical between all the PHA synthases are identified by black boxes, whereas conserved and similar amino acids are highlighted in light gray. The red box means the selected conserved sequence regions that were used for designing degenerate primers.
Next, the entire sequence of phaCABA–04 was obtained using a gene walk kit by digesting genomic DNA with SmaI. The resulting 1.7 kb PCR product was obtained when the outer forward primer (F3: 5′-TCACGCTGCTGACCACGCTGCTGGACTTTG-3′) was used with outer adaptor primer 1 (AP1: 5′-GTAATA CGACTCACTATAGGGC-3′), whereas a PCR product as large as 4.0 kb was obtained when the nested forward primer (F4: 5′-TTGAGCTGGCCAATACCTTCTCGTTCTTGC-3′) was used with nested adaptor primer 2 (AP2: 5′-ACTATAGGGC ACGCGTGGT-3′). Analysis of the entire nucleotide sequence of the PCR product revealed that phaAA–04 and phaBA–04 were located downstream of the phaCA–04 gene, and the molecular organization of the phaCABA–04 operon from C. necator strain A-04 is shown in Figure 2. The PCR product of the expected size (4.0 kb) was recovered, purified, and cloned into the pBAD/Thio-TOPO vector. They were transformed into E. coli TOP10, JM109 and XL-1 Blue as the expression host strains. Twenty of five-hundred transformants were screened for PHA production by Nile blue A staining of the colonies and investigated the light intensity under blue light (470 nm) (BluPAD dual LED blue/white light transilluminator, Bio-helix, Taiwan) using Image-J program. Five clones that showed either similar or higher levels of fluorescence intensity that increased with the increase in PHA content of PHA than that of C. necator A-04 were selected and further analyzed to ensure the correctness of sequences. There have been relatively few reports on the use of arabinose promoter for PHB production in recombinant E. coli (Horng et al., 2010; Wu et al., 2016). In this study, an arabinose-inducible araBAD promoter (pBAD/Thio-TOPO vector) that has not been reported for PHB production was used to produce PHB in E. coli TOP10, JM100 and XL-1 Blue. For a comparative study, the expression plasmid pColdTF (cspA promoter, cold shock and IPTG inducible) harboring phaCABA–04 genes was transformed into E. coli XL-1 Blue.
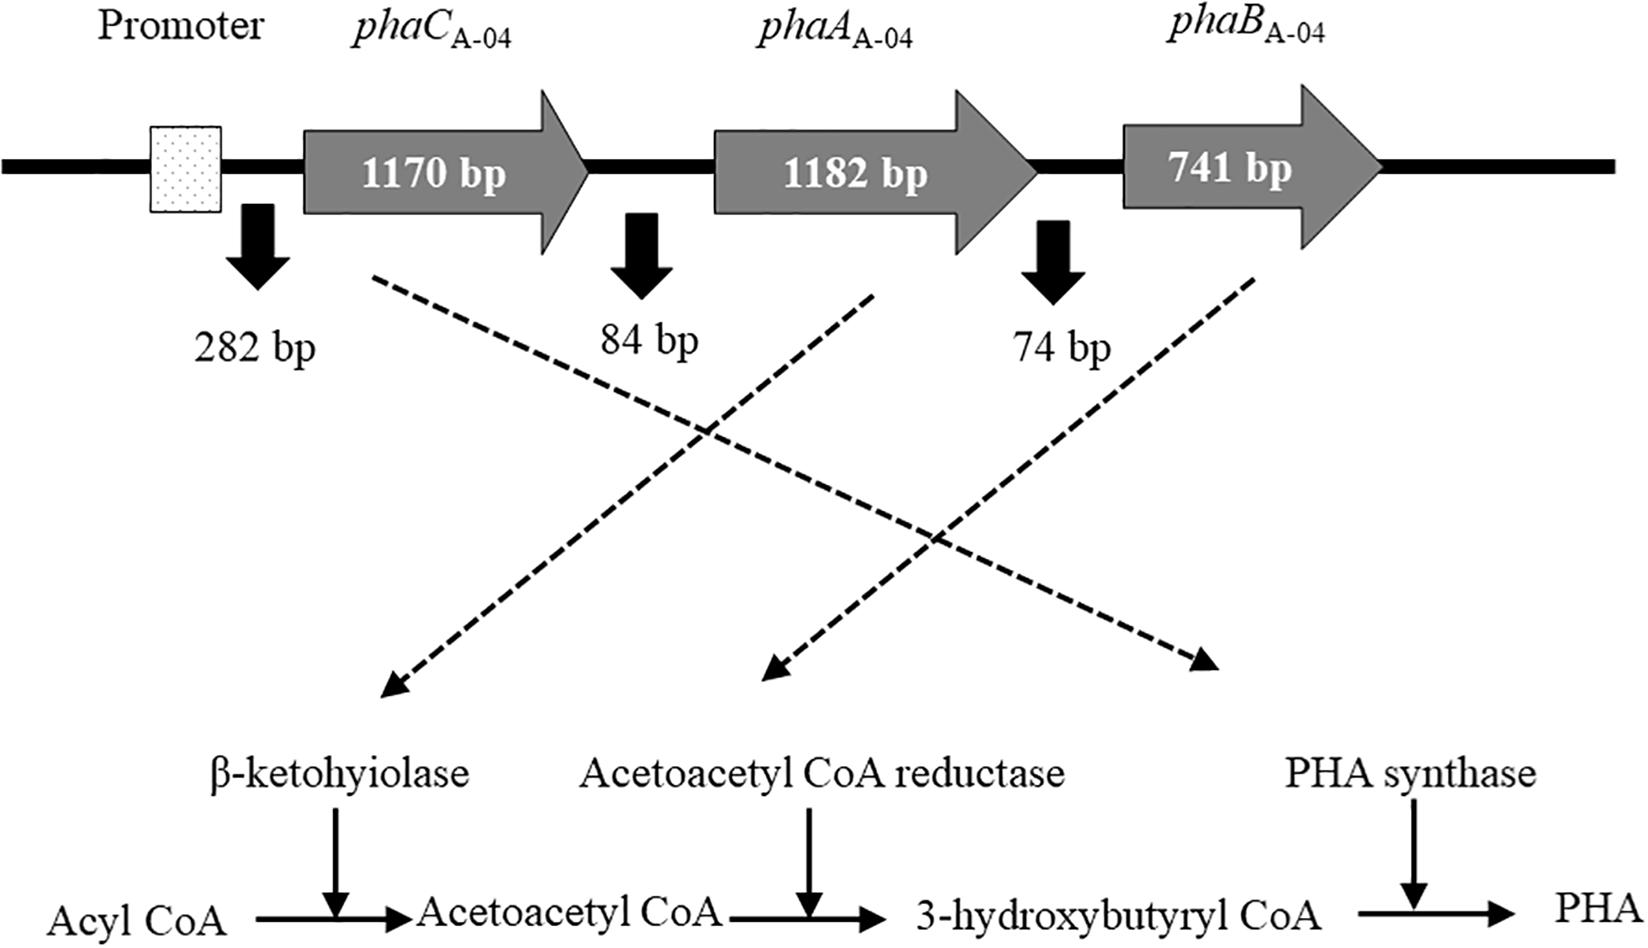
Figure 2. Diagram of the molecular organization of phaCABA–04 biosynthesis genes from C. necator strain A-04. PHA synthase (phaCA–04), acetyl-CoA acetyltransferase (phaAA–04), acetoacetyl-CoA reductase (phaBA–04) genes and promoter (PA–04).
The choice of growth media has a significant influence on cell growth and PHB production. Thus, selection of suitable growth medium and conditions for PHB production in E. coli TOP10 was carried out by comparison of kinetic parameters. The results are shown in Figure 3. Terrific broth (TB) medium provided better growth conditions than the other three types of media. The specific growth rate of E. coli TOP10 harboring pBAD/Thio-TOPO-phaCABA–04 in TB medium was 0.035 (1/h), followed by SB medium (0.027 (1/h)), 2YT (0.024 (1/h)), and LB medium (0.007 (1/h)). However, the LB medium appeared to promote PHB production in E. coli TOP10, resulting in a specific production rate of 0.048 g-PHB/g-CDW/h, whereas the specific production rate in TB medium was 0.012 g-PHB/g-CDW/h. TB medium contains the highest amount of yeast extract with additional glycerol, which makes it suitable for the long-term growth of cells but does not promote PHB production. The LB medium contained the lowest amount of yeast extract and tryptone with a slightly higher amount of sodium chloride and was found to promote PHB production better than TB, 2YT, and SB media. Figures 3C–F show time courses of PHB granules accumulated in E. coli TOP10 grown in LB medium at 6, 12, 18, and 24 h visualized by Sudan Black B staining. Finally, LB medium was chosen for further optimization (Nambu et al., 2020).
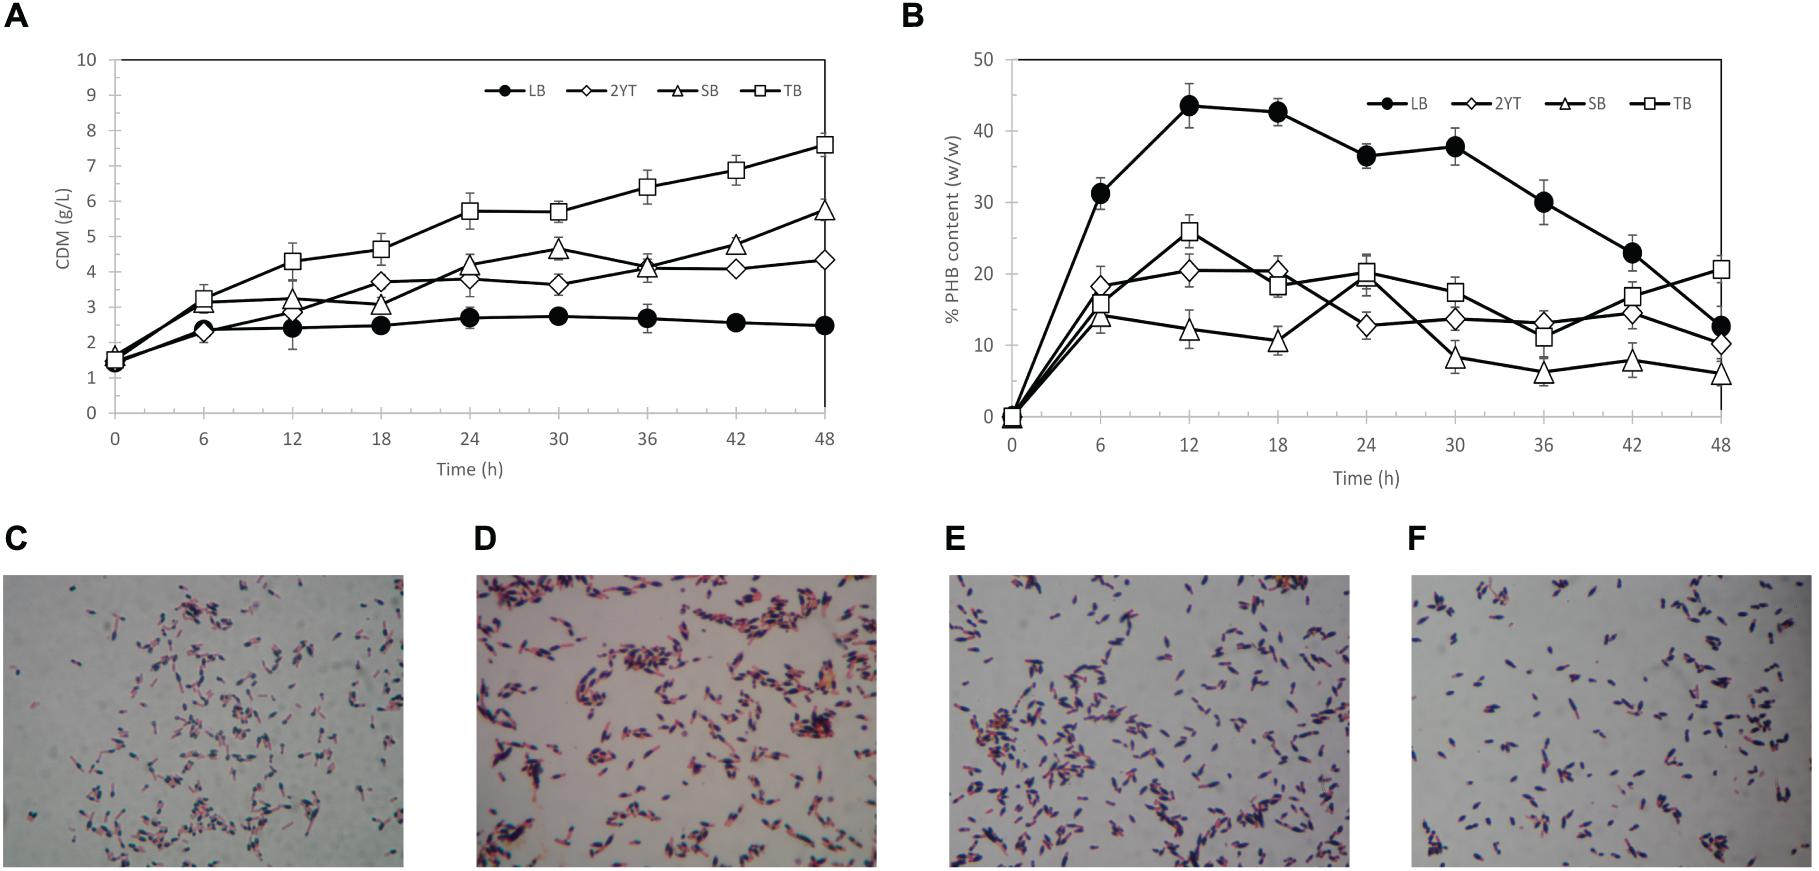
Figure 3. Time courses of CDM (g/L) (A) % PHB content (w/w) (B) and Sudan black B-stained PHB granules (black section) in pBAD/Thio-TOPO-phaCABA–04 expressing E. coli TOP10 grown in LB medium at 6 h (C), 12 h (D), 18 h (E), and 24 h (F).
To optimize PHB production in recombinant E. coli, many variables need to be systematically investigated. In this study, arabinose concentration, length of induction, inoculum size and glucose concentration were investigated in detail.
First, the arabinose concentration was varied from 0.002, 0.02, 0.2, 0.5, and 2% (w/v) for pBAD/Thio-TOPO-phaCABA–04-expressing E. coli TOP10. Figure 4A represents the effect of arabinose concentration on the relationship between the specific growth rate and specific production rate. The specific PHB production rate increased proportionally with increasing L-arabinose concentration from 0.002 to 1% (w/v), and then the specific PHB production rate decreased at an L-arabinose concentration of 2.0 (w/v). It was clearly observed that 1.0% (w/v) L-arabinose gave the highest amount of PHB at 5.6 ± 0.4 g/L (Figure 4C) with a PHB content of 93.3 ± 0.9% (w/w) at 24 h after induction (Figure 4D). The effect of arabinose concentration on YP/S (g-PHB/g-glucose) and YX/S (g-RCM/g-glucose) was shown in Figure 4B and it was clearly found that 1% (w/v) L-arabinose provided the highest YP/S of 0.28 g-PHB/g-glucose. Next, the inoculum size was varied from 4.5 × 10⁸, 3.2 × 10⁹, and 1.5 × 10¹⁰ CFU/mL. Figure 5A demonstrates the effect of inoculum size on the specific growth rate and specific production rate. In this study, using a low inoculum size of 4.5 × 10⁸ CFU/mL gave the highest specific production rate compared with those obtained from a high cell concentration of pre-culture. For the expression of pBAD/Thio-TOPO-phaCA–04-expressing E. coli TOP10 using the above optimal conditions, PHB production was not observed. Next, the comparison of pBAD/Thio-TOPO-phaCABA–04 was compared between E. coli TOP10 and JM109. The optimal conditions of arabinose concentration, length of induction and inoculum size for pBAD/Thio-TOPO-phaCABA–04-expressing E. coli JM109 were similar but they gave lower amount of CDM and PHB concentration than those obtained from pBAD/Thio-TOPO-phaCABA–04-expressing E. coli TOP10. Finally, glucose concentration was varied from 0, 2, 5, 10, 20, 50 g/L for both pBAD/Thio-TOPO-phaCABA–04-expressing E. coli TOP10 and pBAD/Thio-TOPO-phaCABA–04-expressing E. coli JM109. The optimal glucose concentration was 20 g/L for both recombinant strains, but pBAD/Thio-TOPO-phaCABA–04-expressing E. coli TOP10 offered higher CDM (g/L), PHB (g/L), YP/S (g-PHB/g-glucose), and PHB productivity (g/L⋅h) than those obtained from E. coli JM109 as shown in Table 2.
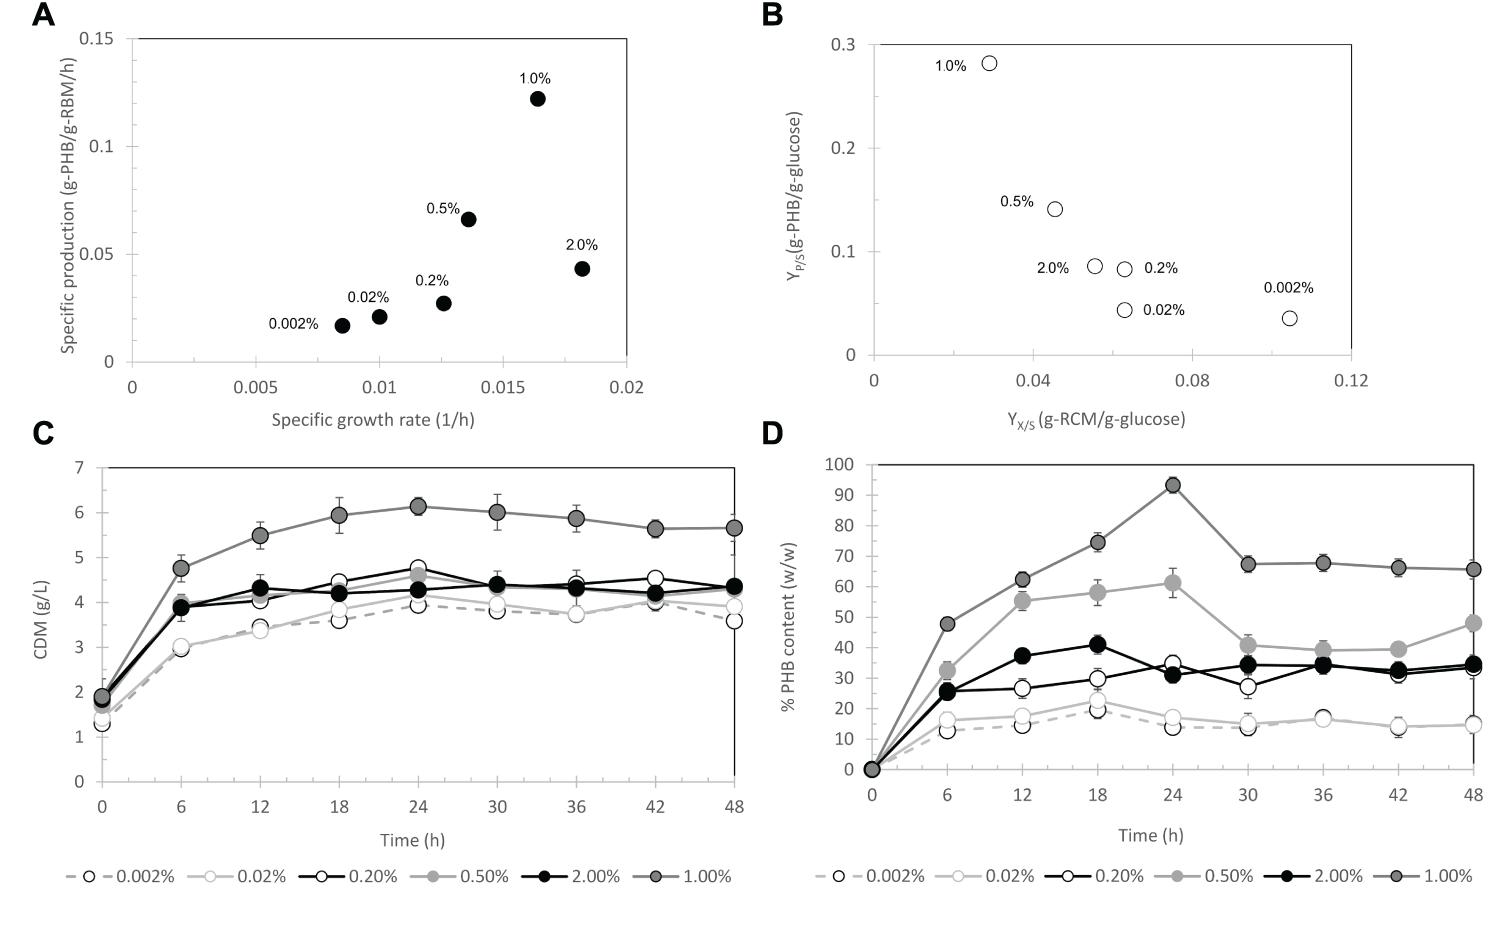
Figure 4. Effect of L-arabinose concentrations of 0.002, 0.02, 0.2, 0.5, and 2% (w/v) on the relationship between the specific growth rate and specific production rate (A) and the relationship between YX/S and YP/S (B) time course of CDM (g/L) (C) and % PHB content (w/w) (D).
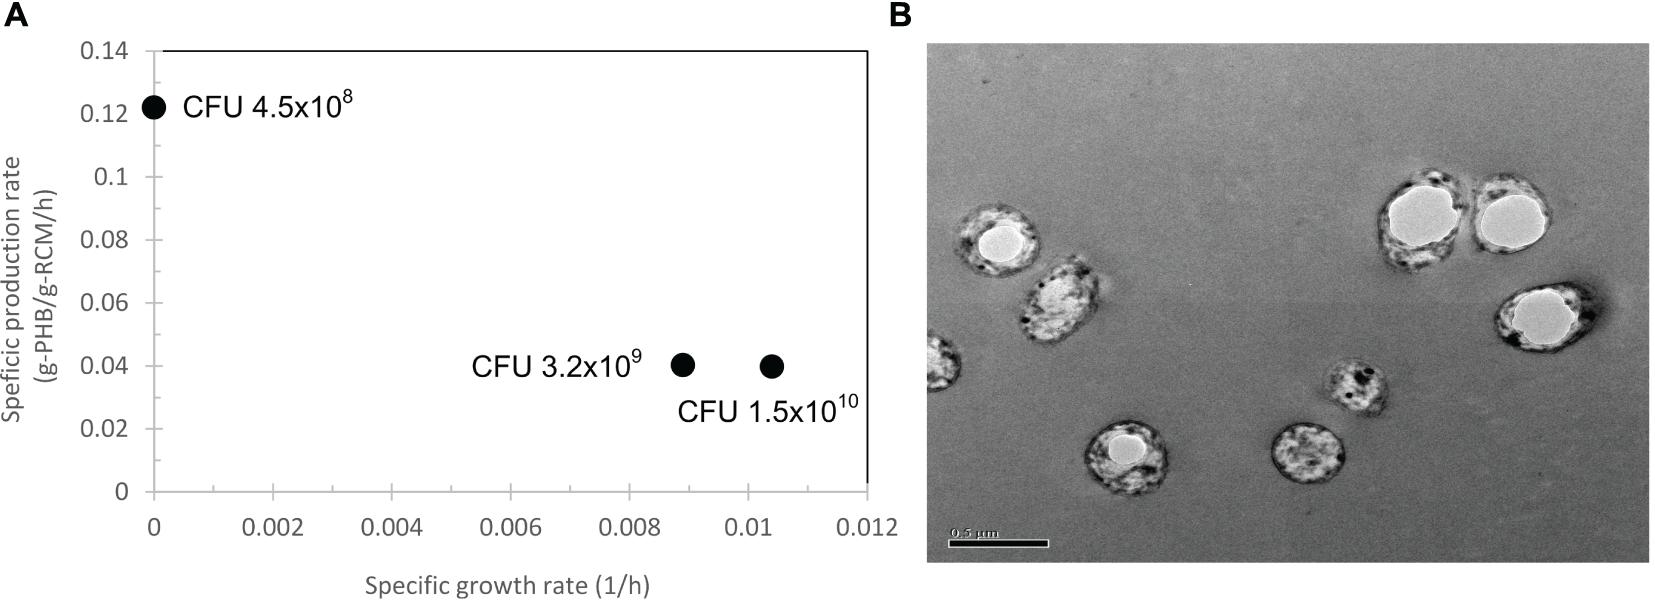
Figure 5. Effect of inoculum size from 4.5 × 10⁸, 3.2 × 10⁹, and 1.5 × 10¹⁰ CFU/mL on the specific growth rate and specific production rate (A) and transmission electron micrograph of ultrathin sections of pBAD/Thio-TOPO-phaCABA–04 expressing E. coli TOP10 grown in LB medium. (B) Typical short rod cells containing one PHB granule (white fractions). Bar 0.5 μm.
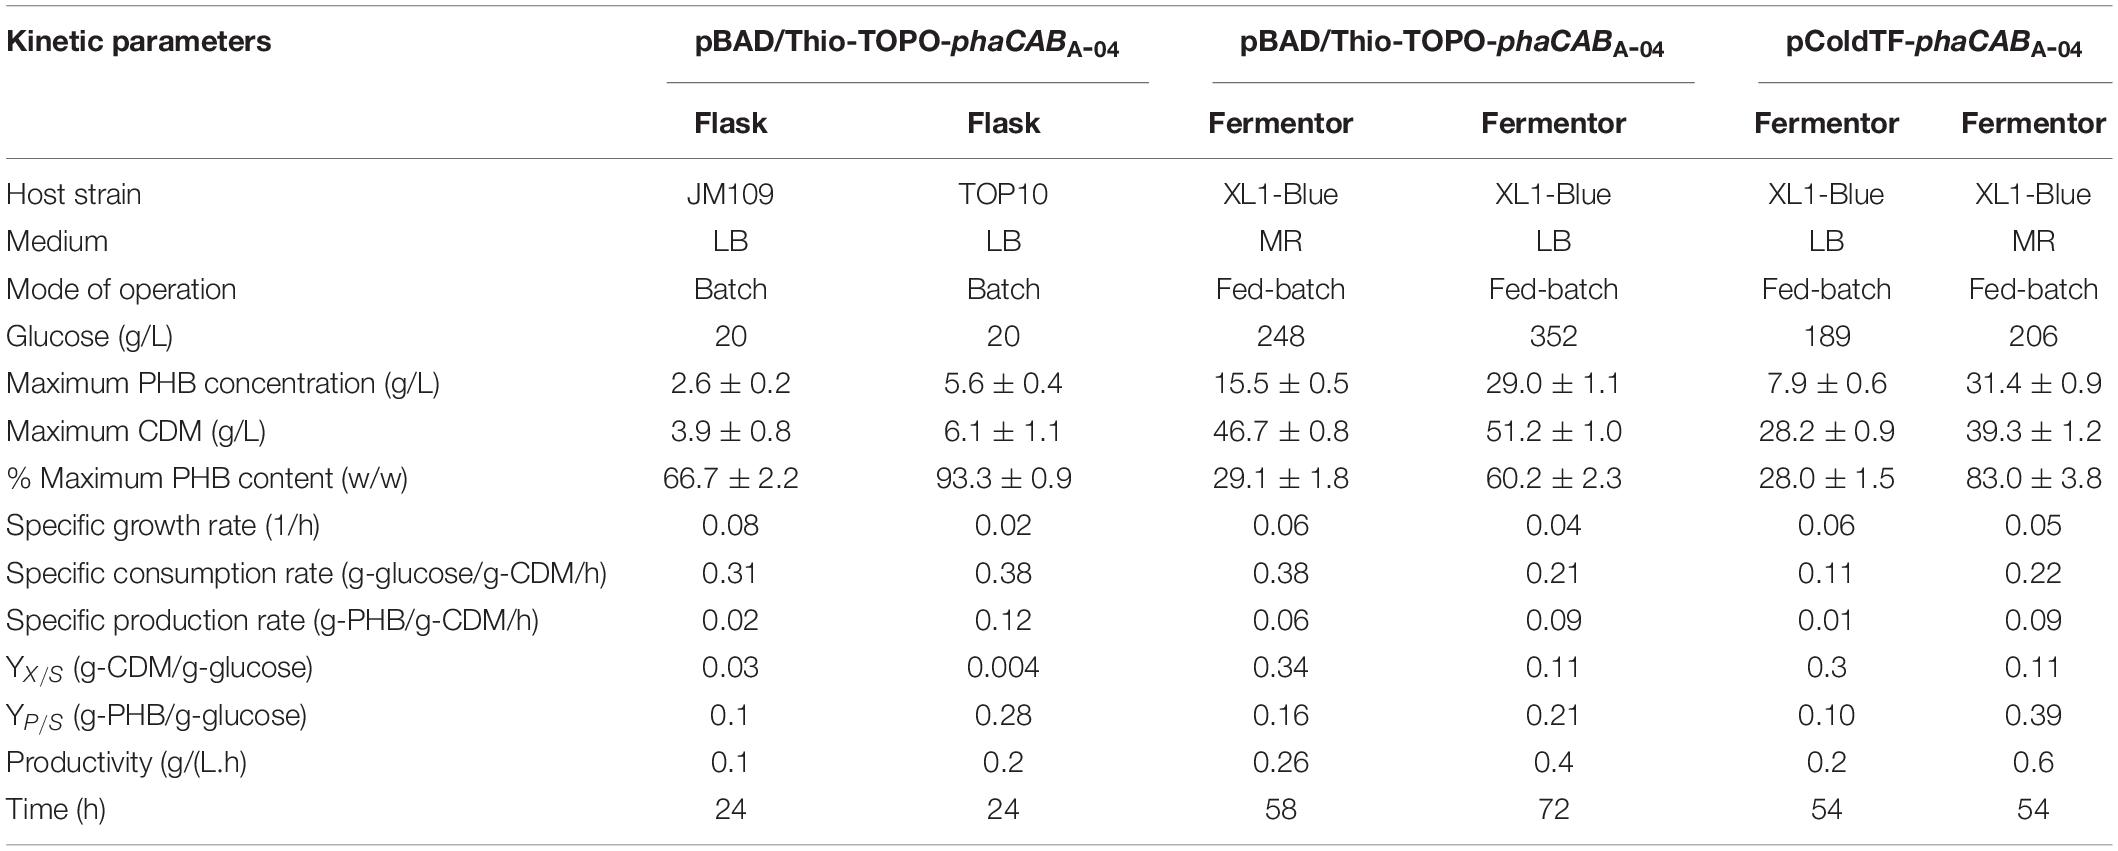
Table 2. Comparison of kinetic parameters obtained from flask cultivation and fed-batch cultivation for PHB production from glucose between pBAD/Thio-TOPO-phaCABA–04 and pColdTF-phaCABA–04 expressing E. coli strains JM109, TOP10, and XL1-Blue in LB medium and MR medium.
Transmission electron microscopy analysis (Figure 5B) revealed the morphology of PHB granules accumulating in pBAD/Thio-TOPO-phaCABA–04-expressing E. coli TOP10. Most recombinant cells contained only one single PHB granule varying in size. Finally, PHB was extracted from cells, purified and subjected to chemical structure analysis by 2D-1H NMR and thermal analysis by DSC. The chromatogram of 2D-1H NMR when compared with the PHA chemical structure in previous reports showed that the homopolymer PHB was produced (data not shown). The melting temperature, Tm, of all the PHB film samples produced in this study was in the range of 172–176°C (Owen et al., 1992), and the glass transition temperature, Tg, was in the normal range of 0–1.5°C (Shimamura et al., 1994; Doi et al., 1995; Chanprateep et al., 2010). Altogether, under shaken flask experiments, the optimal conditions consisting of a low inoculum size of 4.5 × 10⁸ CFU/mL and LB medium containing 50 μg/ml carbenicillin supplemented with 1% (w/v) L-arabinose yielded 6.1 ± 1.1 g/L cell dry weight, a PHB content of 93.3 ± 0.9% (w/w) and a productivity of 0.2 g/(L⋅h), whereas the wild-type C. necator strain A-04 accumulated 78% (w/w) PHB with a productivity of 0.09 g/(L⋅h).
However, to attain high cell density cultivation, E. coli TOP10 was not a good candidate because of the limitation to attain high cell density in fed-batch cultivation experiments (data not shown). As discussed with a well-known expert in the field, E. coli XL1-blue is highly recommended to be used as a host strain (personal communication with Professor Takeharu Tsuge at Tokyo Institute of Technology). In addition, the optimal conditions for phaCABH16 expression by arabinose PBAD promoter in E. coli XL1-blue have already been reported and were the same conditions as in our study. Thus, in fed-batch cultivation experiments, we changed the host strain from E. coli TOP10 to E. coli XL1-blue and compared its potential PHB production efficiency between pBAD/Thio-TOPO-phaCABA–04 and pColdTF-phaCABA–04 in fed-batch cultivation experiments by applying the pH-stat strategy that was previously reported by Kahar et al. (2005) with some modifications by comparing LB medium and MR medium. The objective of this study was to compare araBAD promoter (pBAD/Thio-TOPO, arabinose induction) with the cspA promoter (pColdTF, cold temperature and IPTG induction) because there is no data supporting the use of these promoters when expressing phaCAB in high cell density of recombinant E. coli in fed-batch cultivation. In addition, our research group have studied and compared pColdTF-phaCABA–04 with pGEX-6P-1, pColdI, pColdTF, pBAD/Thio-TOPO, and pUC19 (native promoter) in E. coli JM109 and found that pColdTF was the best among various promotors tested in shake flask cultivations (manuscript submitted for publication). Therefore, pColdTF-phaCABA–04 was chosen in this study and compared with pBAD/Thio-TOPO-phaCABA–04 using the same host strain.
The fed-batch culture with pH-stat feeding of glucose was carried out using E. coli XL1-blue and compared between pBAD/Thio-TOPO-phaCABA–04 and pColdTF-phaCABA–04. In addition, MR medium (Kahar et al., 2005), which is a synthetic medium, was also compared with LB medium, which is a complex medium. For pBAD/Thio-TOPO-phaCABA–04 expressing E. coli XL1-blue in LB and MR medium, the culture conditions were controlled for optimal cell growth and PHB production as obtained from the above experiments. At 24 h, expression of the pha operon was induced by the addition of IPTG to a final concentration of 0.5 mM to promote the expression of phaCABA–04 and obtain PHB production. For comparison, pColdTF-phaCABA–04 expressing E. coli XL1-blue in LB and MR medium was performed in the same manner.
Figure 6 shows the time courses of CDM (g/L) (Figure 6C), PHB (g/L) (Figure 6A), and PHB content (% w/w) (Figure 6B) during batch cultivation in a 5-L fermenter, comparing pBAD/Thio-TOPO-phaCABA–04 and pColdTF-phaCABA–04 expressing E. coli XL1-blue when cultivated in LB medium and MR medium. After 54 h, the CDM of 39.3 ± 1.2 g/L and PHB 31.4 ± 0.9 g/L with 83.0 ± 3.8% (w/w) of PHB content were obtained from pColdTF-phaCABA–04 expressing E. coli XL1-blue in MR medium whereas CDM of 51.2 ± 1.0 g/L and PHB 29.0 ± 1.1 g/L with 60.2 ± 2.3% (w/w) of PHB content were obtained from pBAD/Thio-TOPO-phaCABA–04 expressing E. coli XL1-blue in MR medium. In MR medium, the PHB yield from glucose, YP/S, was 0.21 for pBAD/Thio-TOPO-phaCABA–04 and 0.39 for pColdTF-phaCABA–04. However, in LB medium, YP/S was 0.16 for E. coli XL1-blue harboring pBAD/Thio-TOPO-phaCABA–04 and 0.10 for E. coli XL1-blue harboring pColdTF-phaCABA–04 (Table 2). The highest productivity (PHB in g/L⋅h) was 1.9 g-PHB/L⋅h for pColdTF-phaCABA–04, which was slightly higher than the 1.4 g-PHB/L⋅h of pBAD/Thio-TOPO-phaCABA–04 expressing E. coli XL1-blue.
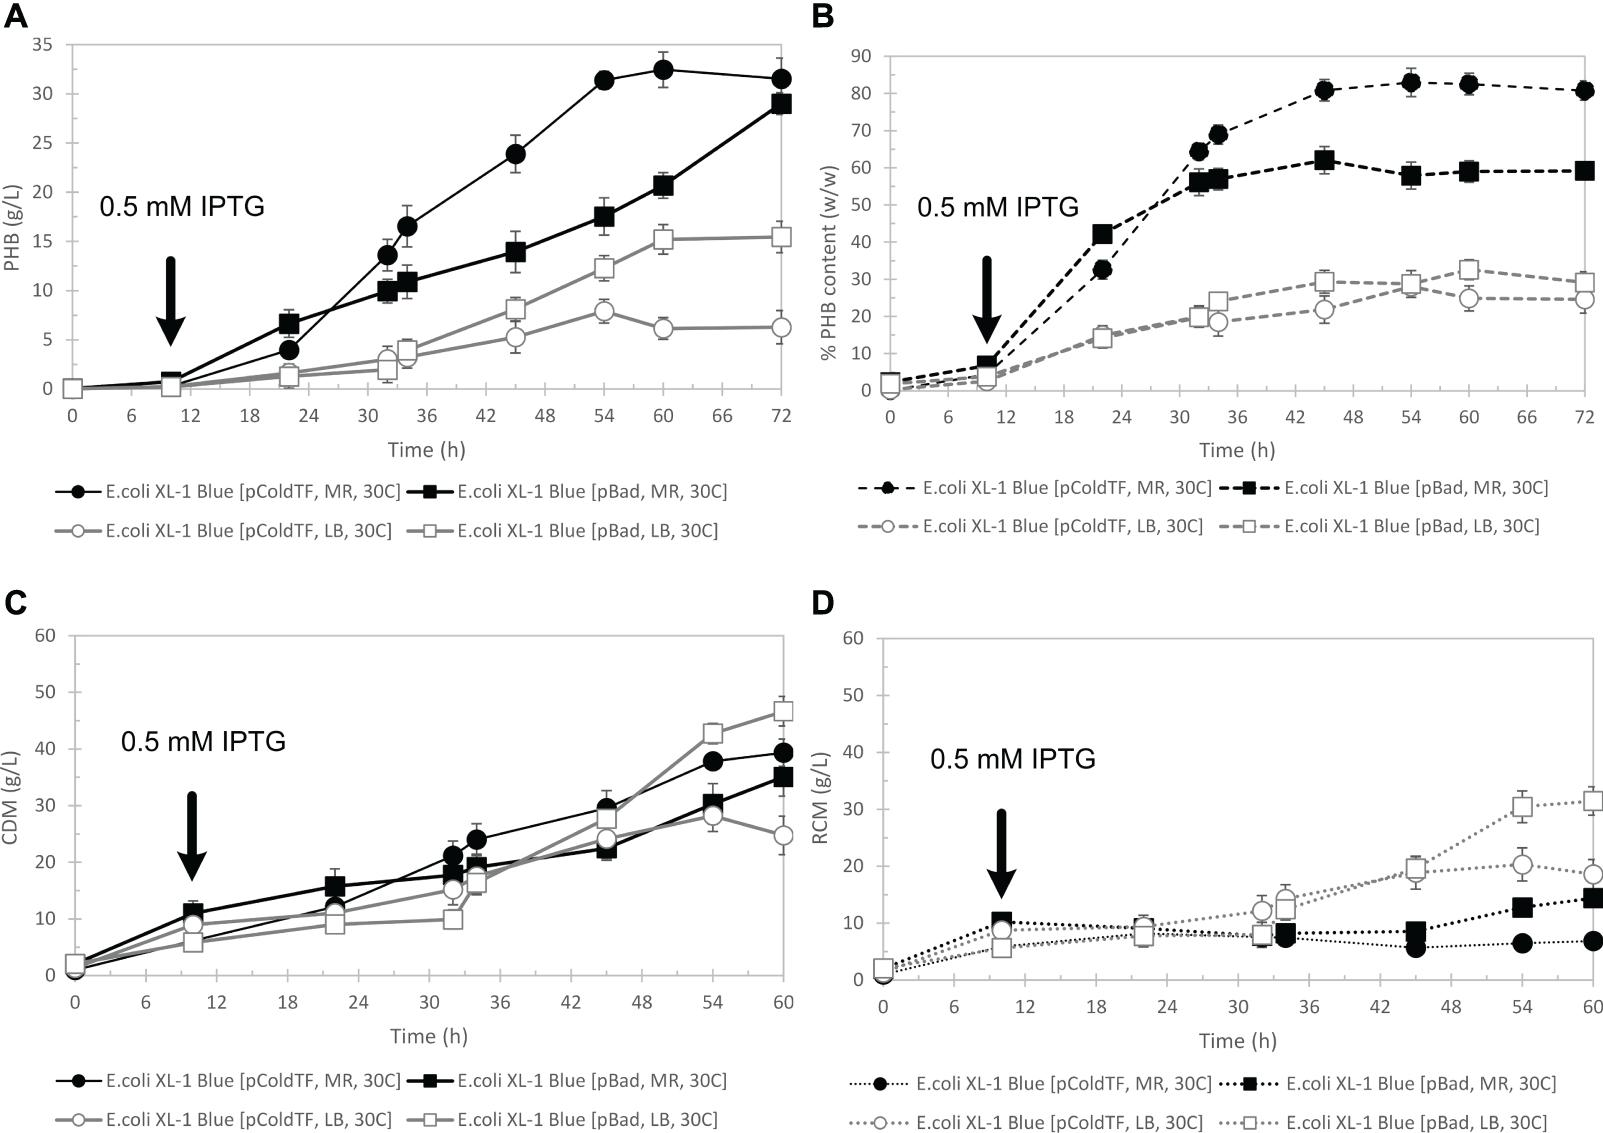
Figure 6. Time courses of PHB g/L (A), PHB content % (w/w) (B), CDM (g/L) (C), and RCM (g/L) (D) during batch cultivation in a 5-L fermenter in comparison between pBAD/Thio-TOPO-phaCABA–04 and pColdTF-phaCABA–04-expressing E. coli XL1 blue-cultured in LB medium and MR medium.
Cupriavidus necator strain A-04 was demonstrated in previous studies to synthesize various types of monomeric PHAs from a variety of carbon sources. It was morphologically and taxonomically identified, and 16S rRNA gene analysis revealed that the isolate was close to C. necator H16 with different cell morphologies, PHA yields, productivity and growth rates on the same carbon source. To date, a number of transcription-based inducible systems have been tested in C. necator H16 (Bhubalan et al., 2008; Fukui et al., 2011), and a number of recombinant phaCABH16-expressing E. coli have been constructed (Kahar et al., 2005; Rehm and Steinbüchel, 2005; Agus et al., 2006). Therefore, we would like to challenge the expression of phaCABA–04 in E. coli and investigate the optimal conditions that promoted high cell density with high PHB production. Among various types of promoters, there have been few reports on the application of arabinose-inducible expression systems (Fukui et al., 2011). Thus, in this study, phaCABA–04 was cloned and expressed in pBAD/Thio-TOPO (araBAD promoter, arabinose-inducible vector, N-terminal thioredoxin fusion protein and C-terminal 6His-fusion protein). First, four different media (LB, 2YT, SB, and TB media) were examined for PHB production in shake flask experiments. It was found that TB medium promoted the highest cell formation because it contained the highest amount of yeast extract (rich nitrogen source), but not suitable for promoting PHB production. In contrast, LB medium contained the lowest amount of yeast extract and tryptone with a slightly higher amount of sodium chloride and was found to promote PHB production better than TB, 2YT and SB media. This finding was in accordance with Wang et al. (2009) who investigated various amount of nitrogen (NH4Cl, 0.2 g/L, 1 g/L, 2.5 g/L, 5 g/L) in M9 medium supplied with glucose as carbon source and who concluded that low nitrogen concentration led to the fast and high PHB accumulation in their engineered E. coli. The more NH4Cl supplied in the medium, the less PHB accumulated in the cells that could support our results. From Figure 3B, % PHB content (w/w) went down for LB medium over time after 12 h whereas RCM remained constant and PHB production slightly decreased after 30 h. This phenomenon caused by the decrease of organic nitrogen source and Mg2+ in LB medium was not sufficient, which were discussed again in fed-batch cultivation as feeding of Mg2+ was performed in both LB medium and MR medium to improve this limitation (Nikaido, 2009). Next, basically, the expression level via the araBAD promoter could be tightly regulated by varying the arabinose concentration. We found that 1% L-arabinose was the optimum concentration, which was the same concentration that was previously reported (Horng et al., 2010). Horng et al. (2010) reported co-expression of phaCABH16 and vgb (bacterial hemoglobin from Vitreoscilla stercoraria) constructed and controlled by the same arabinose PBAD promoter in E. coli XL1-blue. The optimal arabinose concentration for maximum inductions of phaCABH16 was 1%, and there was no significant increase in PHB production at more than 2% arabinose, which was similar to our finding. In shaken flask experiments, pBAD/Thio-TOPO-phaCABH16 and vgb expressing E. coli XL1-blue, CDM 5.13 ± 0.02 g/L with 3.06 ± 0.02 g/L (59.51 ± 0.17% w/w) were obtained which was slightly lower than our results, pBAD/Thio-TOPO-phaCABA–04 expressing E. coli TOP10, with 6.1 ± 1.1 g/L of CDM, PHB content of 93.3 ± 0.9% (w/w) and productivity of 0.2 g/(L⋅h). The reason may be from some differences, including the use of a low inoculum size of 4.5 × 10⁸ CFU/mL and LB medium containing 2% glucose and 50 μg/ml carbenicillin at 37°C, while Horng et al. (2010) used LB medium containing 1% glycerol and 65 μg/ml ampicillin at 37°C. Nevertheless, Wu et al. (2016) also reported the use of the L-arabinose promoter to overexpress tubulin-like protein (FtsZ) and MinC, MinD and MinE, which regulate the formation of division sites. The optimal L-arabinose concentration was reported to be 0.2% for plasmid p15a-Pbad-ftsQLWN in E. coli JM109ΔminCD, resulting in 11.58 g/L CDM with a PHB content of 82.13% (w/w) in LB medium containing 20 g/L glucose at 30°C. The decrease of PHB production with 2% L-arabinose induction can be referred to the study of Khlebnikov et al. (2000) who reported that genes encoding arabinose catabolic genes (araBAD) are under arabinose-inducible control through AraC; arabinose binds to the AraC protein, which positively regulates the expression of transporters and negatively regulates its own expression. They investigated the effects of the arabinose concentration and arabinose-independent transport control on population homogeneity using flow cytometry. It was reported that arabinose concentration of 2% was a saturate concentration and a decline in the specific fluorescence was observed. This phenomenon might be ascribed to arabinose catabolism, resulting in a lower internal arabinose concentration (Khlebnikov et al., 2000) and lower PHB production in our case. The morphology of pBAD/Thio-TOPO-phaCABA–04-expressing E. coli TOP10 containing PHB granules was observed by TEM, and most cells contained a single PHB granule varying in size.
In fed-batch experiments, a pH stat strategy employing ammonium hydroxide solution to maintain glucose concentration (Kahar et al., 2005) was applied in this study, and it was found that the pH stat strategy effectively worked well for both pBAD/Thio-TOPO-phaCABA–04 expressing E. coli XL1-blue and pColdTF-phaCABA–04-expressing E. coli XL1-blue in LB medium and MR medium. The pH-stat strategy together with MR medium promoted PHB production by both pBAD/Thio-TOPO-phaCABA–04 expressing E. coli XL1-blue (CDM of 51.2 ± 1.0 g/L and PHB 29.0 ± 1.1 g/L with 60.2 ± 2.3% (w/w) PHB content) and pColdTF-phaCABA–04 expressing E. coli XL1-blue (CDM of 39.3 ± 1.2 g/L and PHB 31.4 ± 0.9 g/L with 83.0 ± 3.8% (w/w) PHB content). We found that LB medium promoted higher cell density than that obtained from MR medium, but LB medium resulted in lower PHB production than MR medium. Figures 6C,D shows that pBAD/Thio-TOPO-phaCABA–04-expressing E. coli XL1-blue grown in LB medium attained a CDM of 46.7 ± 0.8 g/L and PHB 15.5 ± 0.5 g/L with 29.1 ± 1.8% (w/w) PHB content. The low content of PHB may have resulted from the LB medium containing insufficient mineral compounds to promote PHB biosynthesis. In addition, MR medium contained a high concentration of Mg2+, in which E. coli required high amounts of Mg2+ and Ca2+ to bridge the highly negatively charged lipopolysaccharide (LPS) molecules in its outer membrane. The total amount of Mg2+ associated with E. coli cells is estimated to be approximately 100 mM, where LB broth contains only between 30 and 200 μM Mg2+, so that the amount of Mg2+ in LB is not sufficient (Nikaido, 2009). During cultivation in LB medium, E. coli cells undergo alterations in carbon nutrition. Cells subsequently use easier-to-utilize amino acids until they are depleted and then switch to harder-to-use amino acids (Sezonov et al., 2007), resulting in a slow specific production rate and growth rate. During cultivation in MR medium, E. coli cells growing in glucose-minimal medium convert glucose into acetate and other organic acids during the early exponential phase; then, in the mid-exponential phase, they grow primarily by oxidizing these organic acids. It has been reported that MgATP is the substrate of numerous phosphorylating enzymes and the principal energy source of the cell. Indeed, any increase in metabolic activity increases the rate of MgATP use and, consequently, the rate of ADP and magnesium release, and vice versa (Gout et al., 2014). Therefore, because MR medium and the feeding solution contained a greater amount of Mg2+ than those in LB medium, they enhanced the metabolic advantage of E. coli cells cultured in this medium as well as supplemented Mg2+ together with glucose using fed-batch cultivation techniques. However, the same composition of glucose, MgSO4⋅7H2O and thiamine in the feeding solution was used for both MR medium and LB medium. We found that LB medium together with Mg2+ feeding promoted only cell growth but did not enhance PHB biosynthesis. Gahlawat and Srivastava (2012) studied the optimum concentration of medium components obtained from statistical design to identify the batch growth and product kinetics parameters of PHB fermentation in Azohydromonas australica using sucrose. They reported that mineral (essential) nutrients (MgSO4⋅7H2O, KH2PO4, and Na2HPO4), which were similar to MR medium (nutrients (MgSO4⋅7H2O, KH2PO4, and (NH4)2PO4), play a very important role in the susceptibility of the buffering capacity of the nutrient medium, which is necessary to support the growth of microbial cells and PHB production.
This study demonstrates that the araBAD promoter and thioredoxin fusion proteins are able to yield high cell density and PHB production in fed-batch cultivation using a pH-stat feeding strategy. To achieve economical productivity, we found that MR medium with a pH stat feeding strategy (NH4OH) coupled with a sufficient amount of Mg2+ in glucose feeding solution is an important key to attaining both a high cell density of CDM and PHB production. LB medium plus Mg2+ in glucose feeding solution promoted only high cell density. However, the advantage of the PBAD expression system is that the cost of arabinose is cheaper than that of the IPTG induction system. In this study, we compared araBAD promoter (pBAD/Thio-TOPO, arabinose induction) with the cspA promoter (pColdTF, cold temperature and IPTG induction) and attained high cell density in both cases. Therefore, pBAD/Thio-TOPO-phaCABA–04 expressing E. coli XL1-blue and pColdTF-phaCABA–04 expressing E. coli XL1-blue constructed by our research group possess a high potential for PHB production.
The datasets presented in this study can be found in online repositories. The names of the repository/repositories and accession number(s) can be found below: https://www.ncbi.nlm.nih.gov/genbank/, FJ897463.1; https://www.ncbi.nlm.nih.gov/genbank/, FJ897461.1; and https://www.ncbi.nlm.nih.gov/genbank/, FJ897462.1.
SCN and SV performed the experiments. OP provided guidance and suggestions for the experimental design and discussed the results. KH and KO provided guidance and suggestions. SCN provided guidance and suggestions for the experimental design, discussed the results, and wrote and edited the manuscript. All authors read and approved the final version of the manuscript.
This research was supported in part by the 90th Anniversary of Chulalongkorn University (Ratchadapiseksomphot) Endowment Fund and the Thailand Research Fund for Master Research Grants TRF-MAG Window I to SCN and SV.
The authors declare that the research was conducted in the absence of any commercial or financial relationships that could be construed as a potential conflict of interest.
The Supplementary Material for this article can be found online at: https://www.frontiersin.org/articles/10.3389/fbioe.2021.661096/full#supplementary-material
Supplementary Figure 1 | Growth profile on various glycerol concentrations of C. necator strain A-04 (green line), C. necator H16 (red line) and variant V6C6 (blue line) that is an adaptive laboratory evolution of C. necator H16. This experiment was performed by Dr. Tuck Seng Wong (University of Sheffield, United Kingdom) under the research collaboration between National Center for Genetic Engineering and Biotechnology (BIOTEC) and Chulalongkorn University.
Agus, J., Kahar, P., Abe, H., Doi, Y., and Tsuge, T. (2006). Altered expression of polyhydroxyalkanoate synthase gene and its effect on poly [(R)-3-hydroxybutyrate] synthesis in recombinant Escherichia coli. Polym. Degrad. Stab. 91, 1645–1650. doi: 10.1016/j.polymdegradstab.2005.12.011
Bhubalan, K., Lee, W.-H., Loo, C.-Y., Yamamoto, T., Tsuge, T., Doi, Y., et al. (2008). Controlled biosynthesis and characterization of poly (3-hydroxybutyrate-co-3-hydroxyvalerate-co-3-hydroxyhexanoate) from mixtures of palm kernel oil and 3HV-precursors. Polym. Degrad. Stab. 93, 17–23. doi: 10.1016/j.polymdegradstab.2007.11.004
Bioplastics, E. (2020). Bioplastics Market Data. Available online at: https://www.european-bioplastics.org/market/ (accessed November 4, 2020)
Boontip, T. (2020). Production of Poly(3-Hydroxybutyrate) and Copolymer Via Expression of phaCAB Genes Under Cold Inducible Promoter in Escherichia coli. Ph.D. thesis, Bangkok: Chulalongkorn University.
Braunegg, G., Sonnleitner, B., and Lafferty, R. (1978). A rapid gas chromatographic method for the determination of poly-β-hydroxybutyric acid in microbial biomass. Appl. Microbiol. Biotechnol. 6, 29–37. doi: 10.1007/bf00500854
Chanchaichaovivat, A. (1992). Characterization and Formation of Poly-3-Hydroxybutyrate by Alcaligenes SP. A-04. Master of Science thesis, Bangkok: Chulalongkorn University.
Chanprateep, S. (2010). Current trends in biodegradable polyhydroxyalkanoates. J. Biosci. Bioeng. 110, 621–632. doi: 10.1016/j.jbiosc.2010.07.014
Chanprateep, S., Buasri, K., Muangwong, A., and Utiswannakul, P. (2010). Biosynthesis and biocompatibility of biodegradable poly(3-hydroxybutyrate- co-4-hydroxybutyrate). Polym. Degrad. Stab. 95, 2003–2012. doi: 10.1016/j.polymdegradstab.2010.07.014
Chanprateep, S., Katakura, Y., Visetkoop, S., Shimizu, H., Kulpreecha, S., and Shioya, S. (2008). Characterization of new isolated Ralstonia eutropha strain A-04 and kinetic study of biodegradable copolyester poly(3-hydroxybutyrate-co-4-hydroxybutyrate) production. J. Industrial Microbiol. Biotechnol. 35, 1205–1215. doi: 10.1007/s10295-008-0427-5
Chanprateep, S., and Kulpreecha, S. (2006). Production and characterization of biodegradable terpolymer poly(3-hydroxybutyrate-co-3-hydroxyvalerate-co-4-hydroxybutyrate) by Alcaligenes sp. A-04. J. Biosci. Bioeng. 101, 51–56. doi: 10.1263/jbb.101.51
Doi, Y., Kitamura, S., and Abe, H. (1995). Microbial synthesis and characterization of poly (3-hydroxybutyrate-co-3-hydroxyhexanoate). Macromolecules 28, 4822–4828. doi: 10.1021/ma00118a007
Fukui, T., Ohsawa, K., Mifune, J., Orita, I., and Nakamura, S. (2011). Evaluation of promoters for gene expression in polyhydroxyalkanoate-producing Cupriavidus necator H16. Appl. Microbiol. Biotechnol. 89, 1527–1536. doi: 10.1007/s00253-011-3100-2
Gahlawat, G., and Srivastava, A. K. (2012). Estimation of fundamental kinetic parameters of polyhydroxybutyrate fermentation process of Azohydromonas australica using statistical approach of media optimization. Appl. Biochem. Biotechnol. 168, 1051–1064. doi: 10.1007/s12010-012-9840-3
Gout, E., Rébeillé, F., Douce, R., and Bligny, R. (2014). Interplay of Mg2+, ADP, and ATP in the cytosol and mitochondria: unravelling the role of Mg2+ in cell respiration. Proc. Natl. Acad. Sci. 111, E4560–E4567.
Hahladakis, J. N., Iacovidou, E., and Gerassimidou, S. (2020). “Plastic waste in a circular economy,” in Plastic Waste and Recycling, ed. T. Letcher (Amsterdam: Elsevier), 481–512. doi: 10.1016/b978-0-12-817880-5.00019-0
Horng, Y. T., Chang, K. C., Chien, C. C., Wei, Y. H., Sun, Y. M., and Soo, P. C. (2010). Enhanced polyhydroxybutyrate (PHB) production via the coexpressed phaCAB and vgb genes controlled by arabinose PBAD promoter in Escherichia coli. Lett. Appl. Microbiol. 50, 158–167. doi: 10.1111/j.1472-765x.2009.02772.x
Kahar, P., Agus, J., Kikkawa, Y., Taguchi, K., Doi, Y., and Tsuge, T. (2005). Effective production and kinetic characterization of ultra-high-molecular-weight poly [(R)-3-hydroxybutyrate] in recombinant Escherichia coli. Polym. Degrad. Stab. 87, 161–169. doi: 10.1016/j.polymdegradstab.2004.08.002
Kemper, A. (1974). Determination of sub-micro quantities of ammonium and nitrate in soils with phenol, sodium nitropusside and hypochloride. Geoderma 12, 201–206. doi: 10.1016/0016-7061(74)90068-8
Khlebnikov, A., Risa, Ø, Skaug, T., Carrier, T. A., and Keasling, J. (2000). Regulatable arabinose-inducible gene expression system with consistent control in all cells of a culture. J. Bacteriol. 182, 7029–7034. doi: 10.1128/jb.182.24.7029-7034.2000
López-Cortés, A., Lanz-Landázuri, A., and García-Maldonado, J. Q. (2008). Screening and isolation of PHB-producing bacteria in a polluted marine microbial mat. Microb. Ecol. 56, 112–120. doi: 10.1007/s00248-007-9329-8
Miller, G. L. (1959). Use of dinitrosalicylic acid reagent for determination of reducing sugar. Analytical Chem. 31, 426–428. doi: 10.1021/ac60147a030
Muangwong, A., Boontip, T., Pachimsawat, J., and Napathorn, S. C. (2016). Medium chain length polyhydroxyalkanoates consisting primarily of unsaturated 3-hydroxy-5-cis-dodecanoate synthesized by newly isolated bacteria using crude glycerol. Microb. Cell Factories 15:55.
Nambu, Y., Ishii-Hyakutake, M., Harada, K., Mizuno, S., and Tsuge, T. (2020). Expanded amino acid sequence of the PhaC box in the active center of polyhydroxyalkanoate synthases. FEBS Lett. 594, 710–716. doi: 10.1002/1873-3468.13651
Nikaido, H. (2009). The Limitations of LB Medium. Available online at: http://schaechter.asmblog.org/schaechter/2009/11/the-limitations-of-lbmedium.html (accessed January 23, 2021)
Owen, A., Heinzel, J., and Škrbić, Ž, and Divjaković, V. (1992). Crystallization and melting behaviour of PHB and PHB/HV copolymer. Polymer 33, 1563–1567. doi: 10.1016/0032-3861(92)90139-n
Phonprapai, C. (1994). Optimal Cultivation Conditions for Poly-b-Hydroxbutyrate Production from ALCALIGENES SP. Strain A-04 in a Jar Fermentor. Master of Science thesis, Bangkok: Chulalongkorn University.
Rehm, B. H. A., and Steinbüchel, A. (2005). “Polyhydroxyalkanoate (PHA) synthases: the key enzymes of PHA synthesis,” in Biopolymers Online, ed. A. Steinbüchel. doi: 10.1002/3527600035.bpol3a06
Sambrook, J., and Russell, D. W. (2001). Molecular Cloning: a Laboratory Manual. 2001. New York, NY: Cold Spring Harbor Laboratory Press, Cold Spring Harbor.
Sezonov, G., Joseleau-Petit, D., and D’ari, R. (2007). Escherichia coli physiology in Luria-Bertani broth. J. Bacteriol. 189, 8746–8749. doi: 10.1128/jb.01368-07
Shimamura, E., Scandola, M., and Doi, Y. (1994). Microbial synthesis and characterization of poly (3-hydroxybutyrate-co-3-hydroxypropionate). Macromolecules 27, 4429–4435. doi: 10.1021/ma00094a003
Sudesh, K., Fukui, T., and Doi, Y. (1998). Genetic analysis of Comamonas acidovorans polyhydroxyalkanoate synthase and factors affecting the incorporation of 4-hydroxybutyrate monomer. Appl. Environ. Microbiol. 64, 3437–3443. doi: 10.1128/AEM.64.9.3437-3443.1998
Sukruansuwan, V., and Napathorn, S. C. (2018). Use of agro-industrial residue from the canned pineapple industry for polyhydroxybutyrate production by Cupriavidus necator strain A-04. Biotechnol. Biofuels 11:202. doi: 10.1186/s13068-018-1207-8
Surathikajon, U. (1994). Formation of poly(3-Hydroxybutyrate-co-3-hydroxyvalerate) copolymers by Alcaligenes sp. strain A-04. Master of Science thesis, Bangkok: Chulalongkorn University.
Wang, Q., Yu, H., Xia, Y., Kang, Z., and Qi, Q. (2009). Complete PHB mobilization in Escherichia coli enhances the stress tolerance: a potential biotechnological application. Microb. Cell Factories 8, 1–9.
Wu, H., Fan, Z., Jiang, X., Chen, J., and Chen, G.-Q. (2016). Enhanced production of polyhydroxybutyrate by multiple dividing E. coli. Microb. Cell Factories 15, 1–13.
Keywords: polyhydroxybutyrate, araBAD promoter, Cupriavidus necator, recombinant E. coli, pH stat feeding strategy
Citation: Napathorn SC, Visetkoop S, Pinyakong O, Okano K and Honda K (2021) Polyhydroxybutyrate (PHB) Production Using an Arabinose-Inducible Expression System in Comparison With Cold Shock Inducible Expression System in Escherichia coli. Front. Bioeng. Biotechnol. 9:661096. doi: 10.3389/fbioe.2021.661096
Received: 30 January 2021; Accepted: 06 April 2021;
Published: 03 May 2021.
Edited by:
Prasun Kumar, Chungbuk National University, South KoreaReviewed by:
Mingji Li, Cornell University, United StatesCopyright © 2021 Napathorn, Visetkoop, Pinyakong, Okano and Honda. This is an open-access article distributed under the terms of the Creative Commons Attribution License (CC BY). The use, distribution or reproduction in other forums is permitted, provided the original author(s) and the copyright owner(s) are credited and that the original publication in this journal is cited, in accordance with accepted academic practice. No use, distribution or reproduction is permitted which does not comply with these terms.
*Correspondence: Suchada Chanprateep Napathorn, c3VjaGFkYS5jaGFAY2h1bGEuYWMudGg=
Disclaimer: All claims expressed in this article are solely those of the authors and do not necessarily represent those of their affiliated organizations, or those of the publisher, the editors and the reviewers. Any product that may be evaluated in this article or claim that may be made by its manufacturer is not guaranteed or endorsed by the publisher.
Research integrity at Frontiers
Learn more about the work of our research integrity team to safeguard the quality of each article we publish.