- 1Department of Mathematics, College of Engineering, Mathematics and Physical Sciences, Living Systems Institute, Translational Research Exchange @ Exeter and The Engineering and Physical Sciences Research Council Centre for Predictive Modelling in Healthcare, University of Exeter, Exeter, United Kingdom
- 2McCormick Genomics and Proteomics Center, School of Medicine and Health Sciences, The George Washington University, Washington, DC, United States
- 3Department of Genetics and Genomics Sciences, Icahn School of Medicine at Mount Sinai, New York, NY, United States
- 4Cancer Program, Broad Institute of MIT and Harvard, Cambridge, MA, United States
- 5Medical Oncology, Dana-Farber Cancer Institute, Boston, MA, United States
- 6Biological Sciences Division, Pritzker School of Medicine, The University of Chicago, Chicago, IL, United States
- 7Department of Bioinformatics and Mathematical Modelling, Institute of Biophysics and Biomedical Engineering, Bulgarian Academy of Sciences, Sofia, Bulgaria
- 8Department of Pharmacology and Physiology, School of Medicine and Health Sciences, The George Washington University, Washington, DC, United States
- 9Department of Biochemistry and Molecular Medicine, School of Medicine and Health Sciences, The George Washington University, Washington, DC, United States
Variant allele frequencies (VAF) are an important measure of genetic variation that can be estimated at single-nucleotide variant (SNV) sites. RNA and DNA VAFs are used as indicators of a wide-range of biological traits, including tumor purity and ploidy changes, allele-specific expression and gene-dosage transcriptional response. Here we present a novel methodology to assess gene and chromosomal allele asymmetries and to aid in identifying genomic alterations in RNA and DNA datasets. Our approach is based on analysis of the VAF distributions in chromosomal segments (continuous multi-SNV genomic regions). In each segment we estimate variant probability, a parameter of a random process that can generate synthetic VAF samples that closely resemble the observed data. We show that variant probability is a biologically interpretable quantitative descriptor of the VAF distribution in chromosomal segments which is consistent with other approaches. To this end, we apply the proposed methodology on data from 72 samples obtained from patients with breast invasive carcinoma (BRCA) from The Cancer Genome Atlas (TCGA). We compare DNA and RNA VAF distributions from matched RNA and whole exome sequencing (WES) datasets and find that both genomic signals give very similar segmentation and estimated variant probability profiles. We also find a correlation between variant probability with copy number alterations (CNA). Finally, to demonstrate a practical application of variant probabilities, we use them to estimate tumor purity. Tumor purity estimates based on variant probabilities demonstrate good concordance with other approaches (Pearson's correlation between 0.44 and 0.76). Our evaluation suggests that variant probabilities can serve as a dependable descriptor of VAF distribution, further enabling the statistical comparison of matched DNA and RNA datasets. Finally, they provide conceptual and mechanistic insights into relations between structure of VAF distributions and genetic events. The methodology is implemented in a Matlab toolbox that provides a suite of functions for analysis, statistical assessment and visualization of Genome and Transcriptome allele frequencies distributions. GeTallele is available at: https://github.com/SlowinskiPiotr/GeTallele.
Introduction
RNA and DNA carry and present genetic variation in related yet distinct manners; the differences encoding information about functional and structural traits. In diploid organisms, an important measure of genetic variation is the variant allele frequency (VAF), which can be measured from both genomic (DNA) and transcriptomic (RNA) sequencing data as the encoded and expressed allele frequencies, respectively. Differential DNA-RNA allele frequencies are associated with a variety of biological processes, such as genome admixture, and allele-specific transcriptional regulation (Ha et al., 2012; Shah et al., 2012; Han et al., 2015; Ferreira et al., 2016; Movassagh et al., 2016).
RNA-DNA allele comparisons from sequencing have mostly been approached at the nucleotide level, where they have proven to be highly informative for determining the allelic functional consequences (ENCODE Project Consortium, 2012; Ha et al., 2012; Shah et al., 2012; Morin et al., 2013; Han et al., 2015; Ferreira et al., 2016; Macaulay et al., 2016; Movassagh et al., 2016; Reuter et al., 2016; Shi et al., 2016; Shlien et al., 2016; Yang et al., 2016). Comparatively, integration of allele signals at the molecular level, as derived from linear DNA and RNA, is less comprehensively explored due to the challenges presented by limited compatibility of the outputs from the two sequencing assays.
Herein, we introduce a novel methodology for the analysis of DNA and RNA VAF distributions. This methodology is motivated by the following observations that, to our knowledge, have not been integrated into existing VAF analysis methodologies:
1) VAF distributions can change along a chromosome and differ between chromosomal segments (continuous multi-SNV genomic regions);
2) VAF distribution in a chromosomal segment is approximately symmetric;
3) VAF distribution in a chromosomal segment is a reflection of contributions from all the genetic events in all of the cells constituting the sequenced sample;
4) the variant and reference read counts can be modeled as random numbers from a binomial distribution; and
5) the support of the VAF distributions is a Farey sequence.
Guided by the first three observations, our methodology is designed to provide an aggregate description of VAF distribution in chromosomal segments.
The fourth observation motivates the development of a stochastic model for generating synthetic VAF samples. The model is a binomial mixture model, meaning that each of the mixture components is a binomial distribution parametrised by probability of success given a number of trials. The probability of success is equal across all binomial distributions in the mixture, while the number of trials varies between the mixture components. Each individual component has number of trials that is sampled from the total read counts in the dataset. We interpret the random numbers from this binomial mixture model as the number of variant reads at individual SNV loci. Namely, the common probability of success becomes variant probability, or vPR, defined as the probability of observing a variant allele at any site in a given chromosomal segment. We sample the total read counts from the data to account for technical variance arising from the sequencing process. The binomial mixture model implies that a variant or reference read at a given site is a result of a Bernoulli process.
Finally, the fifth observation allows for the rigorous comparison of observed and synthetic VAF distributions, resulting in the estimation of vPR of observed VAF distributions.
The potential benefits of the proposed approach are 2-fold: first, by exploiting the statistical relations between SNVs in chromosomal segment, vPR is less dependent on read depth and hence can help to utilize sequencing signals more efficiently; second, since vPR is a high-level descriptor of VAF distributions, it allows for the direct comparison of DNA and RNA VAF distributions without the effects of limited comparability of DNA and RNA sequencing data.
Materials and Methods
Data
We evaluate and demonstrate GeTallele's functionality using matched whole exome and RNA sequencing datasets from paired normal and tumor tissue obtained from 72 female patients with breast invasive carcinoma (BRCA) from TCGA. Each dataset contains four matched sequencing sets: normal exome (Nex), normal transcriptome (Ntr), tumor exome (Tex), and tumor transcriptome (Ttr) (see Supplementary Table 1). The raw sequencing data were processed as previously described (Movassagh et al., 2016) to generate the inputs for GeTallele.
In short, all datasets were generated through paired-end sequencing on an Illumina HiSeq platform. The human genome reference (hg38)-aligned sequencing reads (Binary Alignment Maps, bams) were downloaded from the Genomic Data Commons Data Portal (https://portal.gdc.cancer.gov/) and processed downstream through an in-house pipeline. After variant calling (Li, 2011), the RNA-seq and whole exome sequencing (WES) alignments, together with their respective variant calls, were processed through the read count module of the package RNA2DNAlign (Movassagh et al., 2016), to produce variant and reference sequencing read counts for all the variant positions in all four sequencing signals (normal exome, normal transcriptome, tumor exome and tumor transcriptome). Selected read count assessments were visually examined using the Integrative Genomics Viewer (Thorvaldsdóttir et al., 2013).
For each sample, to select SNV positions for analysis, we start with heterozygous SNV calls in the normal exome (Li et al., 2009). In each of these positions, we estimate the counts of the variant and reference reads (nVAR and nREF, respectively) across the 4 matching datasets, and retain positions covered by a minimum total (variant + reference) read depth for further analyses. This threshold is flexible and is required to ensure that only sufficiently covered positions will be analyzed; it is set to 3 in the herein presented results. For further analysis (without loss of generality), we transform all the original VAF values to VAF = |VAF−0.5|+0.5. We introduce this transformation due to the symmetric nature of the VAF distributions.
In addition, we required each tumor sample to have at least three of the following five purity estimates—Estimate, Absolute, LUMP, IHC, and the consensus purity estimate (CPE) (Katkovnik et al., 2002; Pagès et al., 2010; Carter et al., 2012; Yoshihara et al., 2013; Zheng et al., 2014; Aran et al., 2015). On the same datasets, we applied THetA (Oesper et al., 2013, 2014)—a popular tool for assessing CNA and admixture from sequencing data—was also applied to the datasets.
Statistics
To test statistical significance, GeTallele uses parametric and non-parametric methods and statistical tests (Hollander et al., 2013; Corder and Foreman, 2014). Namely, to compare distributions of the variant allele frequencies (VAF) we use the Kolmogorov–Smirnov test (examples of VAF distributions are depicted in Figures 2, 3). To study concurrence of windows, we use permutation/bootstrap tests. To test relations between vPR and copy number alterations (CNA), we use Pearson's correlation coefficient.
To account for multiple comparisons, we set the probability for rejecting the null hypothesis at p < 1e−5, which corresponds to Bonferroni (Dunn, 1961) family-wise error rate (FWER) correction against 100,000 comparisons. We use a fixed value, rather than other approaches, to ensure better consistency and reproducibility of the results. Alternatively, we apply Benjamini and Hochberg (Benjamini and Hochberg, 1995) false discovery rate (FDR) correction with a probability of accepting false positive results pFDR <0.05. We specify the method used in the text when reporting the results.
Description of the Novel Methodology
The overall workflow of the proposed methodology as implemented in the GeTallele is shown in Figure 1. As input, GeTallele requires the absolute number of sequencing reads bearing the variant and reference nucleotide in each single-nucleotide variant (SNV) position. For each available dataset (4 in the presented analysis) GeTallele estimates VAF based on the variant and reference reads (nVAR and nREF, respectively) covering the positions of interest: VAF = nVAR/(nVAR + nREF). An example of genome-wide VAF values estimated from tumor exome Tex dataset, and their corresponding histogram is shown in Figure 2.
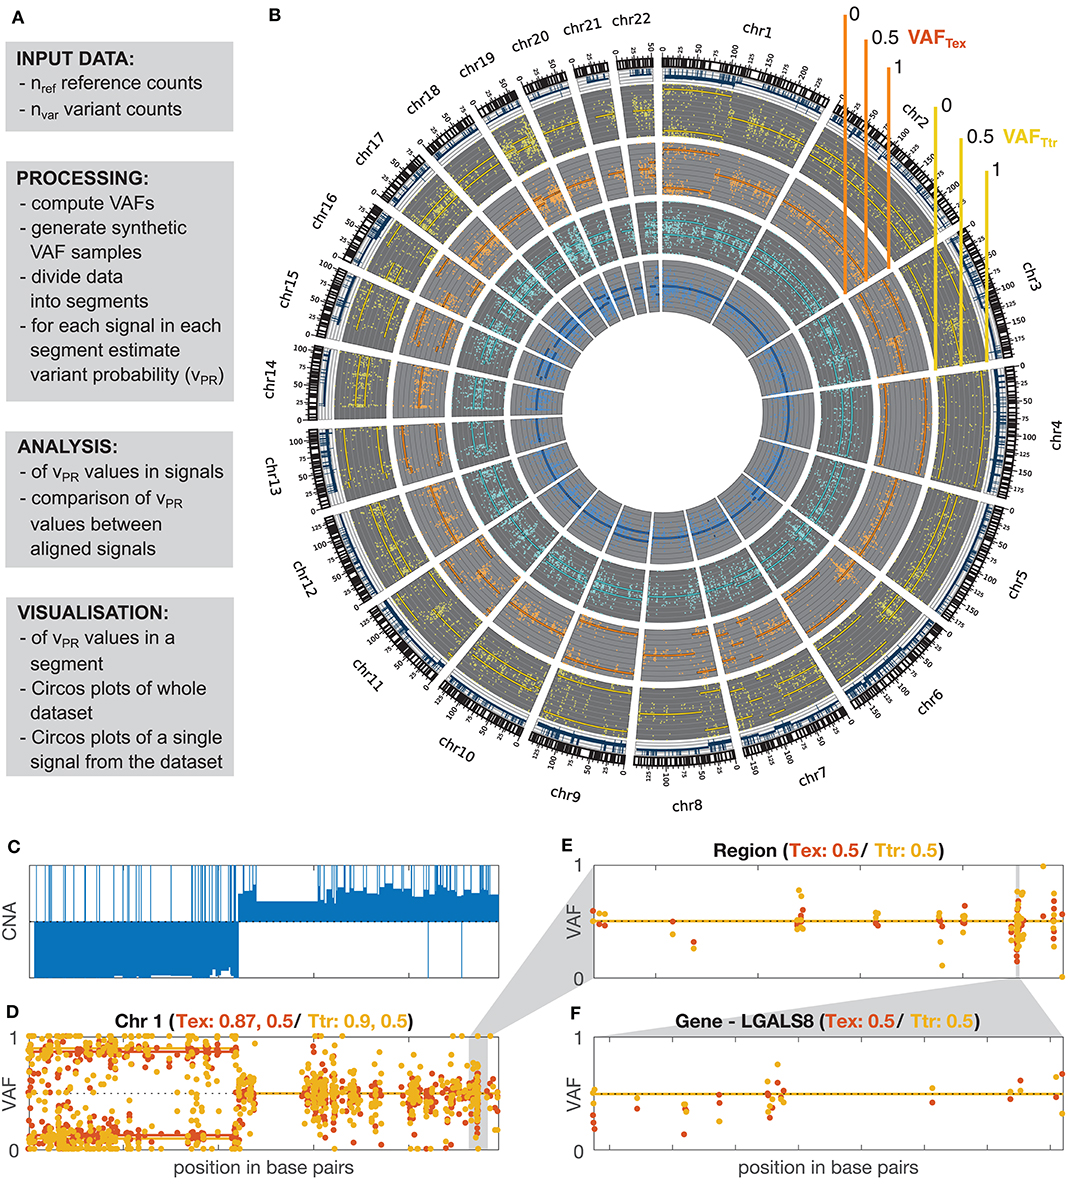
Figure 1. GeTallele and visualization of VAF data. (A) Toolbox description. (B) Visualization of the whole dataset on the level of genome using Circos plot (blue, normal exome; cyan, normal transcriptome; orange, tumor exome; yellow, tumor transcriptome). (C) CNA values for chromosome 1. (D–F) Visualization of the VAF values with fitted variant probability (vPR–see section Estimation of Variant Probability vPR and Figure 3). VAFTEX and VAFTTR values at the level of: chromosome (chromosome 1) (D), custom genome region (E), and gene (F). (D) Shows that there are two chromosomal segments with different VAF distributions, likely representing a region of copy-neutral loss of heterozygosity. (C) Shows that large scale change in the CNA is concurrent with the change in the VAF distributions. In panel titles: Tex, vPR estimate for VAF distributions of tumor exome (orange); Ttr, vPR estimate for VAF distributions of tumor transcriptome (yellow).
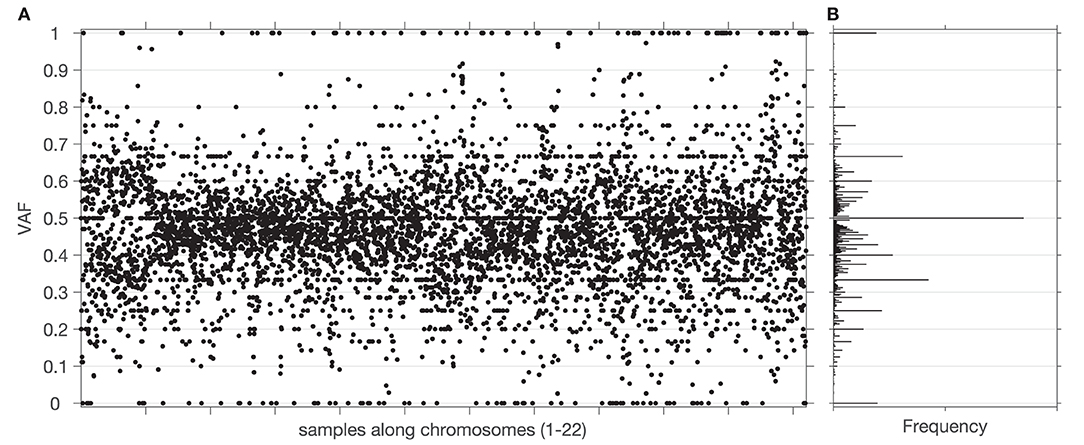
Figure 2. Sample and distribution of variant allele frequencies (VAF) values. (A) All the VAF values of a tumor exome sequencing signal (chromosomes 1–22) from one of the datasets. (B) Histogram of the VAF values from (A). Centers of bins of the histogram are located at elements of a Farey sequence.
Data Segmentation
To analyse variant allele frequencies (VAF) at genome-wide level, GeTallele first divides the VAF sequence into a set of non-overlapping segments along the chromosomes. To partition the data into segments, GeTallele uses a parametric global method, which detects the breakpoints in a signal using its mean, as implemented in the Matlab function findchangepts (Lavielle, 2005; Killick et al., 2012) In each segment, the VAFs of the chosen signal must have a different mean than that of the adjacent segment. In the Matlab implementation, sensitivity of breakpoint detection can be controlled using parameter MinThreshold; with a default setting of 0.2. Segments containing fewer than 10 data points were merged with the preceding segment. For analysis of matched signals, segmentation is based on one signal, and then applied to the others. In the presented analysis, segmentation is based mainly on Tex dataset, for comparison we also use Ttr dataset (dataset used for segmentation is specified in the description of the results presented in Section Results).
Estimation of Variant Probability vPR
Variant probability is a biologically interpretable quantitative descriptor of the VAF distribution. It is the common probability of observing a variant allele at any site in a given chromosomal segment. The vPR is a measure describing the genomic event that, through the sequencing process, was transformed into an observed distribution of VAFs. For example, in VAFDNA from a diploid genome, we assume variant probability vPR = 0.5 (meaning that both alleles are equally probable) corresponds to a true allelic ratio of 1:1 for heterozygous sites. The value might differ from 0.5 due to reference mapping biases (Degner et al., 2009). For heterozygous sites in the DNA from a diploid monoclonal samples, the corresponding tumor VAFDNA is expected to have the following interpretations: vPR = 1 or vPR = 0 corresponding to a monoallelic status resulting from a deletion, and vPR = 0.8 (or 0.2), 0.75 (or 0.25), 0.67 (or 0.33) corresponding to allele-specific tetra-, tri-, and duplication of the variant-bearing allele, respectively.
The vPR of the VAFRNA is interpreted as follows. In positions corresponding to heterozygote sites in DNA, alleles not preferentially targeted by regulatory traits are expected to have expression rates with variant probability vPR = 0.5, which (by default) scale with the DNA allele distribution. Differences between VAFDNA and VAFRNA values are observed in special cases of transcriptional regulation where one of the alleles is preferentially transcribed over the other. In the absence of allele-preferential transcription, VAFDNA, and VAFRNA are anticipated to have similar vPR across both diploid (normal) and copy number altered genomic regions. Consequently, VAFDNA, and VAFRNA are expected to synchronously switch between allelic patterns along the chromosomes, with the switches indicating breakpoints of DNA deletions or amplifications.
Since we observed that DNA and RNA signals have different distributions of total reads and also that the distributions of total reads vary between participants, the synthetic VAF distributions are generated individually for each sequencing signal and each participant.
To estimate vPR in the signals, GeTallele first generates synthetic VAF distributions and then uses the earth mover's distance (EMD) (Kantorovich and Rubinstein, 1958; Levina and Bickel, 2001) to fit them to the data. To generate a synthetic VAF distribution with a given variant probability, vPR, GeTallele, bootstraps 10,000 values of the total reads (sum of the variant and reference reads; nVAR + nREF) from the analyzed signal in the dataset. It then uses binomial pseudorandom number generator to get number of successes for given number of total reads and a given value of vPR (implemented in the Matlab function binornd). The vPR is the common value of the probability of success and generated number of successes is interpreted as an nVAR. Since the vPR of the synthetic sample can take any value, it can correspond to a single genomic event as well as any combination of genomic events in any mixture of normal and tumor populations (See section vPR Values in Mixtures of Normal and Tumour Populations).
The analysis presented in the paper uses 51 synthetic VAF distributions with vPR values that vary from 0.5 to 1 with step (increment of) 0.01. The synthetic VAF distributions are parametrized using only vPR ≥ 0.5, however, to generate them we use vPR and its symmetric counterpart 1-vPR. The process of generating synthetic VAF distributions along with examples of synthetic and real VAF distributions with different values of vPR are illustrated in Figure 3.
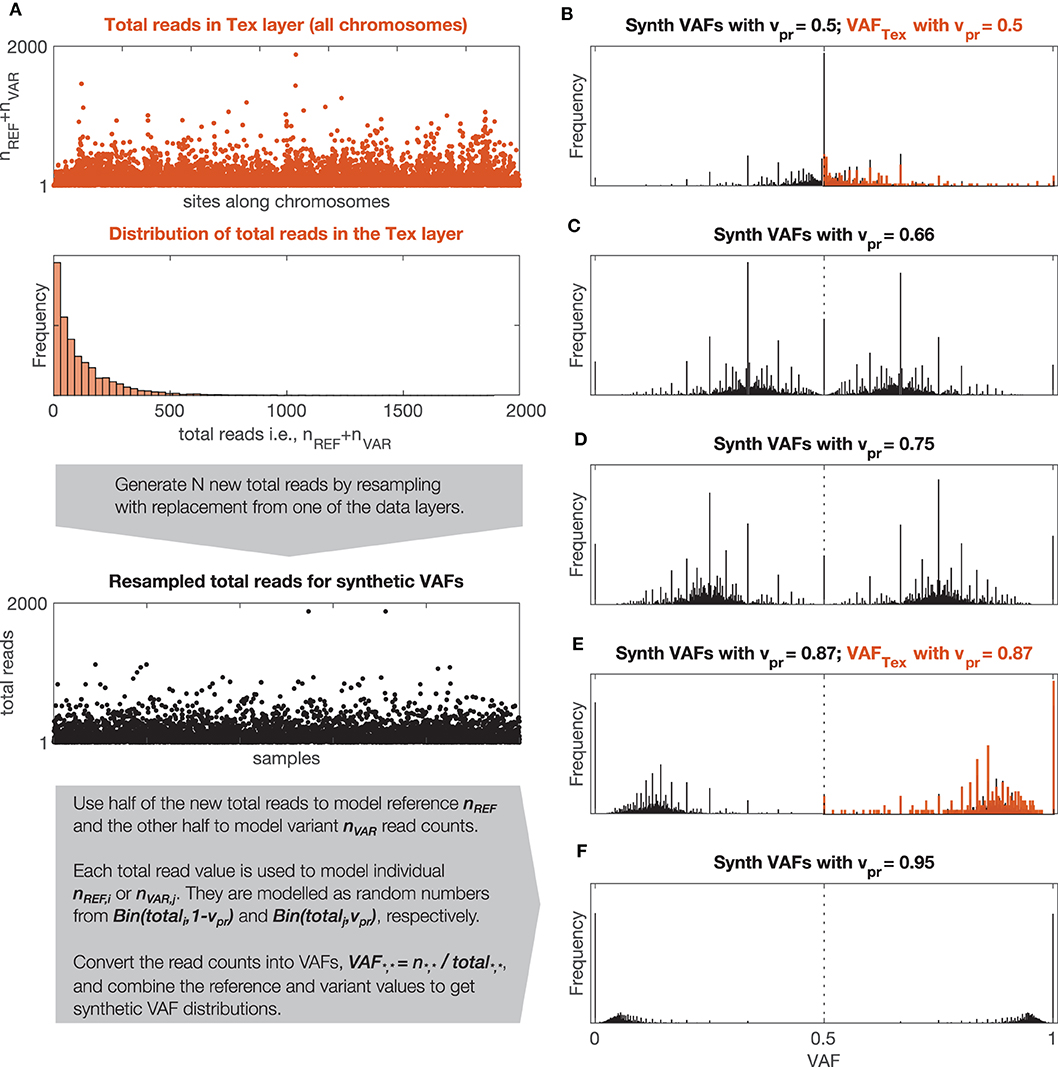
Figure 3. Synthetic and observed VAF distributions. (A) Description of the model used to generate synthetic VAF distributions, Bin(n,p) stands for binomial distribution with parameters n (number of trials) and p (probability of success). (B–F) Synthetic VAF distributions for different values of vPR. (B,F) Show additionally distributions of VAFTEX for the two windows shown in Figure 1D.
To estimate vPR, we compute the Earth mover's distance between the distribution of VAF values in the considered window and the 51 synthetic VAF distributions (i.e., observed vs. synthetic VAF). The estimate is given by the vPR of the synthetic VAF distribution that is closest to the VAF distribution in the segment.
Earth mover's distance (EMD) is a metric for quantifying differences between probability distributions (Kantorovich and Rubinstein, 1958; Levina and Bickel, 2001) and in the case of univariate distributions it can be computed as:
Here, PDF1 and PDF2 are two probability density functions, and CDF1 and CDF2 are their respective cumulative distribution functions. Z is the support of the PDFs (i.e., set of all the possible values of the random variables described by them). Because VAFs are defined as simple fractions with values between 0 and 1, their support is given by a Farey sequence (Hardy and Wright, 2008) of order n; n is the highest denominator in the sequence. For example, Farey sequence of order 2 is 0, 1/2, 1, and Farey sequence of order 3 is 0, 1/3, 1/2, 2/3, 1. We use a Farey sequence of order 1,000 as the support Z for estimating the vPR.
Examples of VAF distributions with fitted synthetic VAF distributions are shown in Figures 3A,D. The dependence of the confidence intervals of the estimation on the number of VAF values in a segment is illustrated in Figure 4, which clearly demonstrates that the accuracy of the estimate is positively correlated with the number of VAFs in the chosen segment.
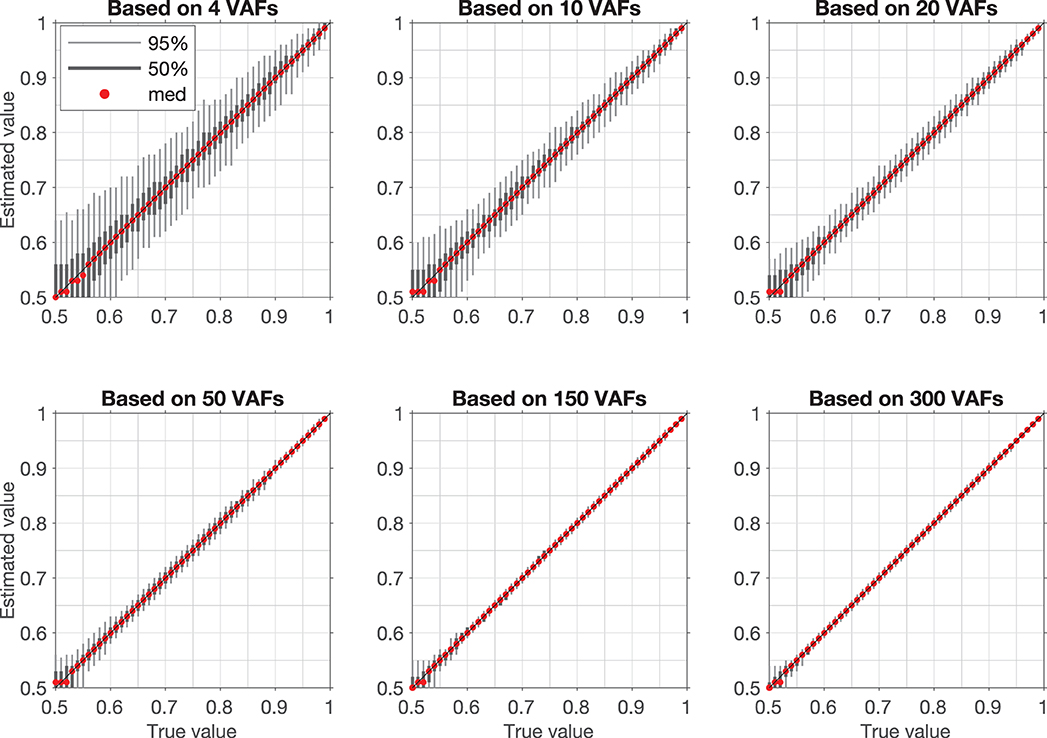
Figure 4. Confidence intervals for artificial samples with different numbers of VAFs. Each confidence interval is based on estimation of vPR in 1,000 randomly generated samples with a fixed vPR (True value). Light gray bar is 95% confidence interval (950 samples lay within this interval), dark gray bar is 50% confidence interval (500 samples lay within this interval), red dot is median value.
vPR Values in Mixtures of Normal and Tumor Populations
Since the vPR can take any value between 0.5 and 1 it can correspond to a single genomic event as well as any combination of genomic events in any mixture of normal and tumor populations. A mixture vPR value that corresponds to a combination of genomic events can be computed using the following expression:
Where eVAR and eREF are the multiplicities of variant and reference alleles and pPL is a proportion of one of the populations. For heterozygote sites eVAR = 1 and eREF = 1, for deletions eVAR = 0 or eREF = 0, for du-, tri- and tetraplications eVAR or eREF can be equal to 2, 3 or 4, respectively. The sum of proportions pPL over the populations is equal 1. For example, for a mixture of 1 normal (N, pN = 0.44) and 2 tumor populations (T1, pT1 = 0.39 and T2, pT2 = 0.17), T1 with deletion and T2 with deletion the mixture vPR value can be computed as follows:
By comparing the vPR values estimated from data with possible mixture vPR values we propose to estimate sample purity and its clonal composition. To this end, we first generate a full set of proportions of all the population in the mixture with step (increment of) 0.01 and compute all the possible vPR values that each of the mixtures could produce. For step 0.01: two populations (1 tumor) give 99 proportions, three populations (2 tumors) give 4,851 proportions, four populations (3 tumors) give 156,849 proportions. The matrices with mixture vPR values for each proportion, vary from 2 × 2, for two populations with deletions, to 35 × 35 for four populations with all events up to tetra-plications. Then, we run an exhaustive approximate search over all the matrices with mixture vPR values over all the proportions. The search is approximate because the estimated vPR values have limited accuracy and because we consider only discrete values of proportions. In the analysis we define a match between estimated and mixture vPR values if they differ by <0.009 (we chose a value that is smaller than the smallest difference between possible vPR estimates). The search returns a large number of admissible mixtures that could produce the estimated vPR values. This process is illustrated in Figure 5.
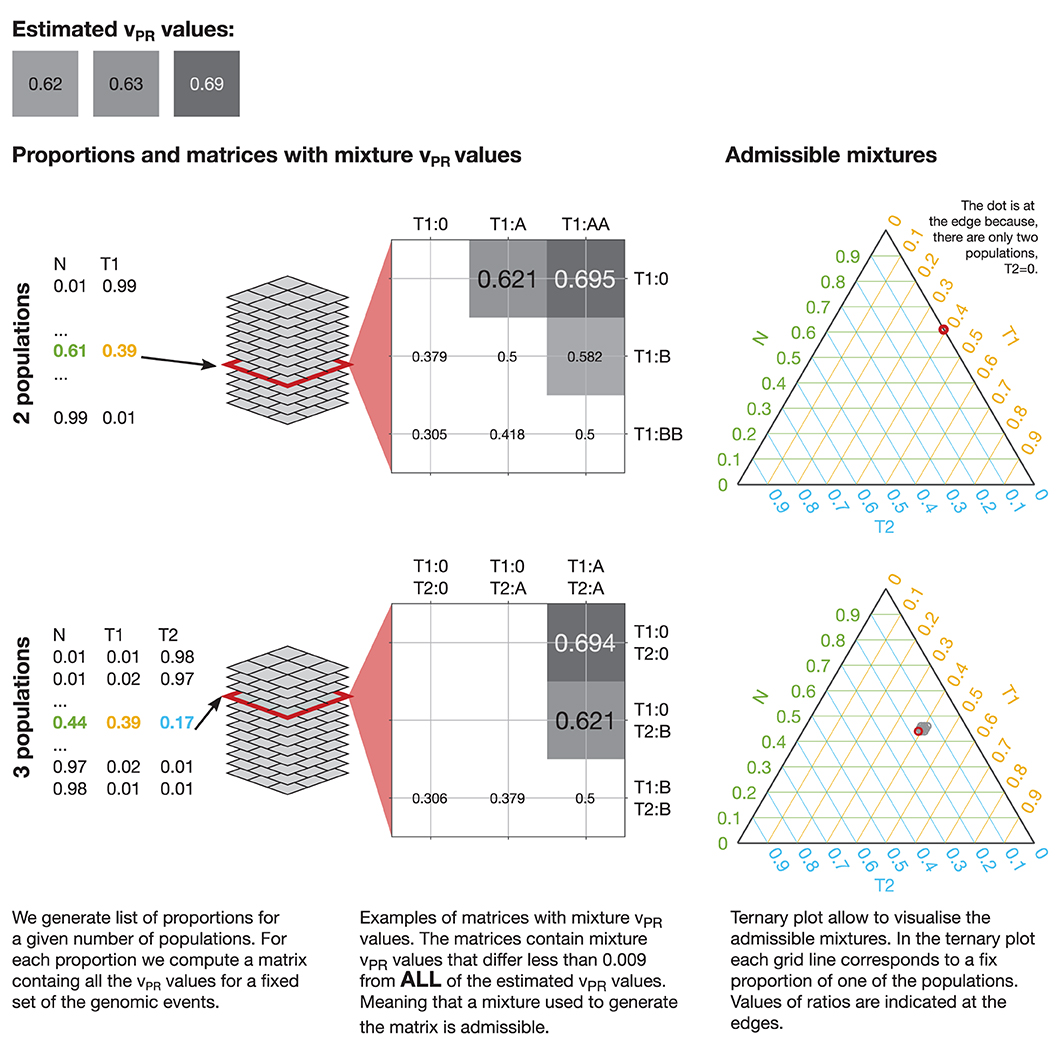
Figure 5. Mixtures admissible by the vPR values estimated from data. To uncover mixtures that could produce the three estimated vPR values we perform an exhaustive approximate search of all the possible vPR values produced by any mixture of the populations with a given set of genetic events. In each case we generate a full set of proportions with a given step (e.g., 0.01) and compute all the possible vPR values that such a mixture could produce. In the illustrated cases: 2 populations (1 tumor) could produce the estimated vPR values through a deletion (estimated vPR = 0.62 and vPR = 0.63) and via deletion of one allele and duplication of another (estimated vPR = 0.69); 3 populations (2 tumors) could produce the estimated vPR values through a deletion in one of the tumor populations (estimated vPR = 0.62 and vPR = 0.63) and via deletion in both of the tumor populations (estimated vPR = 0.69). The 2 populations case admits a single mixture and the 3 populations allow 9 mixtures with similar compositions. The admissible mixtures are depicted on the ternary plots, red circle indicates solution corresponding to the presented matrix. We exclude mixture vPR values that result from deletion of both the variant and reference alleles (empty fields in the matrices).
To visualize the admissible mixtures, we use ternary plots, which allow us to illustrate composition of three components in two dimensions. The composition, represented by ratios of the three components, which sum to a constant, is depicted as point inside or on the edge of an equilateral triangle. If the point is on the edges, the composition has only two components. To help interpretation of the ternary plots, we also plot the grid lines that are parallel to the sides of the triangle. These gridlines indicate the directions of constant ratios of the components. Along such direction the ratio of one of the components is fixed and only the other two ratios vary. Examples of visualization of admissible mixtures on ternary plots are shown in Figures 5, 6.
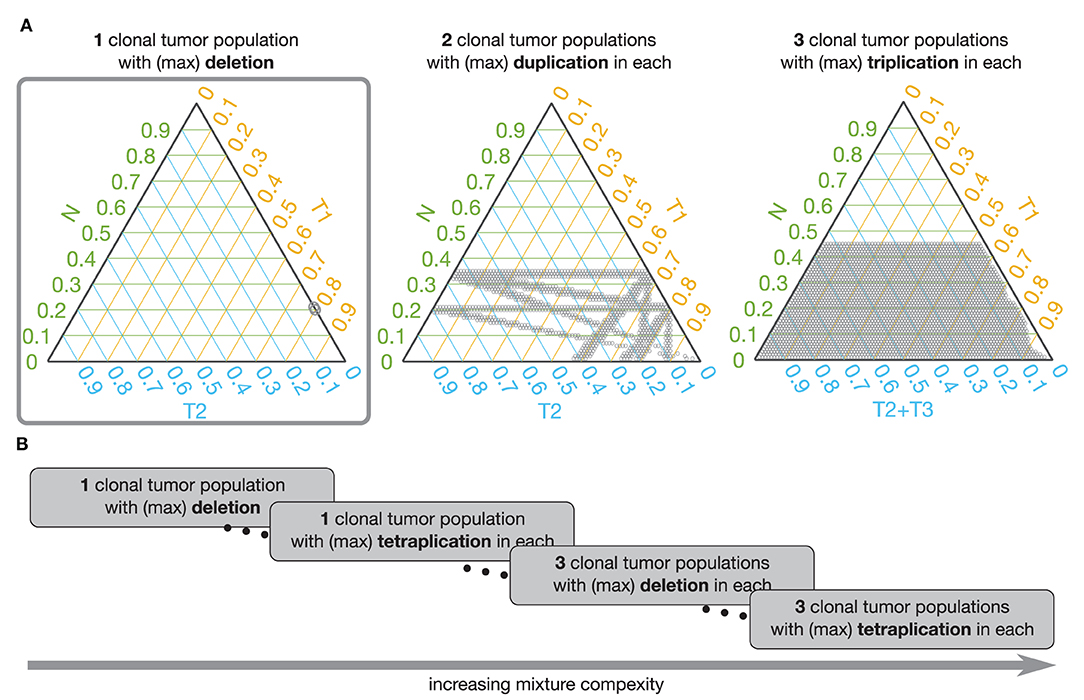
Figure 6. Admissible mixtures for increasing mixture complexity. (A) Shows admissible mixtures for 3 different mixtures with increasing complexity. The simplest mixture (mixture with the lowest number of components and the simplest set of genetic events) is show within the gray frame. On each ternary plot, the admissible mixtures are indicated by gray dots. The green axis indicates proportion of the normal population (N), the yellow axis indicates proportion of the 1st tumor population (T1), the blue axis shows proportion of the 2nd tumor population (T2), or sum of the 2nd and 3rd tumor populations (T2 + T3). (B) Schematic representation of increasing complexity of the mixture models. From a mixture of 1 normal and 1 tumor population in which only deletion is possible to a model with 1 normal and 3 tumor populations and each can have deletions, du-, tri-, and tetraplications.
To facilitate analysis of the admissible mixtures returned by the search procedure we introduce mixture complexity. Mixture complexity is a measure that increases with number of populations as well as with variety of genetic events. From the simplest mixture of 1 normal and 1 tumor population in which only deletions are possible to a model with 1 normal and multiple tumor populations where each can have deletions, and any level of multiplications. In practice, we set the limit at 3 tumor populations and tetra-plications. Mixture complexity helps to group and visualize admissible mixtures. Mixtures with higher complexity allow more possible vPR values, meaning that it is easier to find the match with the estimated vPR values but that the number of admissible mixtures increases (see Figure 6). We, further, observe that proportion of normal population, pN, increases with a number of clonal tumor populations included in the model mixture and that, generally, pN stays constant with increasing variety of genetic events, for a fixed number of clonal tumor populations. We note that this is just one of many possible ways of deciding which solution should be chosen.
Results
To evaluate the proposed methodology, we apply it on matched normal and tumor exome and transcriptome sequencing data of 72 breast carcinoma (BRCA) datasets with pre-assessed copy-number and genome admixture estimates acquired through TCGA (see Materials and Methods). We first compare DNA and RNA VAF distributions from matched sequencing datasets and find that both genomic signals give very similar results in terms of segmentation and estimated variant probability values. We further assess the correlations between vPR values and copy number alterations (CNA) values and find that they are in agreement with each other. Finally, we use the vPR values to estimate tumor purity. The purity estimates based on vPR values show good concordance with alternative approaches.
Segmentation Results
Segmentation of the data, based on the tumor exome signal, resulted in 2,697 chromosomal segments across the 72 datasets. We excluded from further analysis 294 chromosomal segments where either tumor exome or transcriptome had vPR > = 0.58 but their VAF distribution could not be differentiated from the model VAF distributions with vPR = 0.5 (p > 1e−5, Kolmogorov Smirnov test, equivalent to Bonferroni FWER correction for 100,000 comparisons). The 294 excluded chromosomal segments, corresponding to 4% of the total length of the data in base pairs and 4% of all the available data points. This implies these short segments containing few VAF values. In the remaining 2,403 chromosomal segments, we systematically examined the similarity between corresponding VAFTEX (tumor exome), VAFTTR (tumor transcriptome), and CNA. We obtained several distinct patterns of coordinated RNA-DNA allelic behavior as well as correlations with CNA data.
In 60% of all analyzed chromosomal segments the distributions of VAFTEX and VAFTTR were statistically concordant (P > 1e−5, Kolmogorov Smirnov test), and in 40% they were statistically discordant (P < 1e−5, Kolmogorov Smirnov test). In two chromosomal segments, VAFTEX and VAFTTR, had the same vPR, while having statistically different VAF distributions (P < 1e−5, Kolmogorov Smirnov test). We consider such chromosomal segments as concordant. The vPR robustly characterizes VAF sample while the Kolmogorov-Smirnov test is very sensitive for differences between distributions that might be caused by to technical variance. In the vast majority of the discordant chromosomal segments vPR of the VAFTTR, vPR,TTR, was higher than vPR of the VAFTEX, vPR,TEX, (only in 21 out of 959 discordant chromosomal segments vPR,TTR was lower than vPR,TEX).
Concurrence of Segmentation Based on DNA and RNA
We next analyzed the concurrence between chromosomal segments resulting from independent segmentations of the tumor exome (VAFTEX) and transcriptome (VAFTTR) datasets (2,697 and 3,605 chromosomal segments, respectively, across all the samples). We first assessed chromosome-wise alignment of the start and end points of the chromosomal segments. In 45% of the chromosomes both VAFTEX and VAFTTR signals produce a single segment that contains the whole chromosome. In 33% of chromosomes both signals produced multiple chromosomal segments. These chromosomal segments are well aligned, with 90% of the breakpoints differing <7% of data points in the chromosome, e.g., they are <70 points apart if the chromosome contains 1,000 data points; Q50 = 0.02%, Q75 = 2% of data points in the chromosome. The probability of observing such an alignment by chance is smaller than p = 1e−5 (100,000 bootstrap samples with breakpoints assigned randomly in all the individual chromosomes where both signals produced multiple chromosomal segments). In 22% of the chromosomes, segments based on VAFTEX and VAFTTR signals were positionally discordant—one signal produced a single segment containing whole chromosome while the other produced multiple chromosomal segments.
To compare the vPR values in the 55% of chromosomes where at least one signal produced more than one chromosomal segment, we computed chromosome-wise mean absolute error (MAE) between the vPR in two sets of chromosomal segments. To account for different start and end points of the segments we interpolated the vPR values (nearest neighbor interpolation) at each data point in the chromosome. We separately compared the vPR,TEX and vPR,TTR values. Assessment of alignment using MAE showed strong concordance: vPR,TEX agreed perfectly in 11% of the chromosomes and had the percentiles of MAE equal to Q50 = 0.012, Q75 = 0.022 and Q97.5 = 0.047, while vPR,TTR agreed perfectly in 8% but had slightly higher percentiles of MAE Q50 = 0.019, Q75 = 0.034 and Q97.5 = 0.07. vPR,TEX and vPR,TTR values had MAE = 0 simultaneously in 4% of the chromosomes. Probability of observing such values of MAE by chance is smaller than p = 1e−3 (1,000 random assignments of vPR,TEX and vPR,TTR values to windows in the 873 chromosomes where at least one signal had more than one chromosomal segment). It is noteworthy that MAE Q97.5 < 0.07 is comparable with the confidence interval of single vPR estimate based on 50 VAF values. In other words, both signals in a sample (Tex and Ttr) give very similar results in terms of segmentation and estimated values of the vPR. Albeit, segmentation of VAFTTR generates a higher number of chromosomal segments. The higher number of VAFTTR chromosomal segments indicates that transcriptional regulation occurs at a smaller scale than alterations in DNA. Figure 7 shows examples of concurrence between chromosomal segments based on VAFTEX and VAFTTR signals in a positionally concordant chromosome (both signals produced multiple segments).
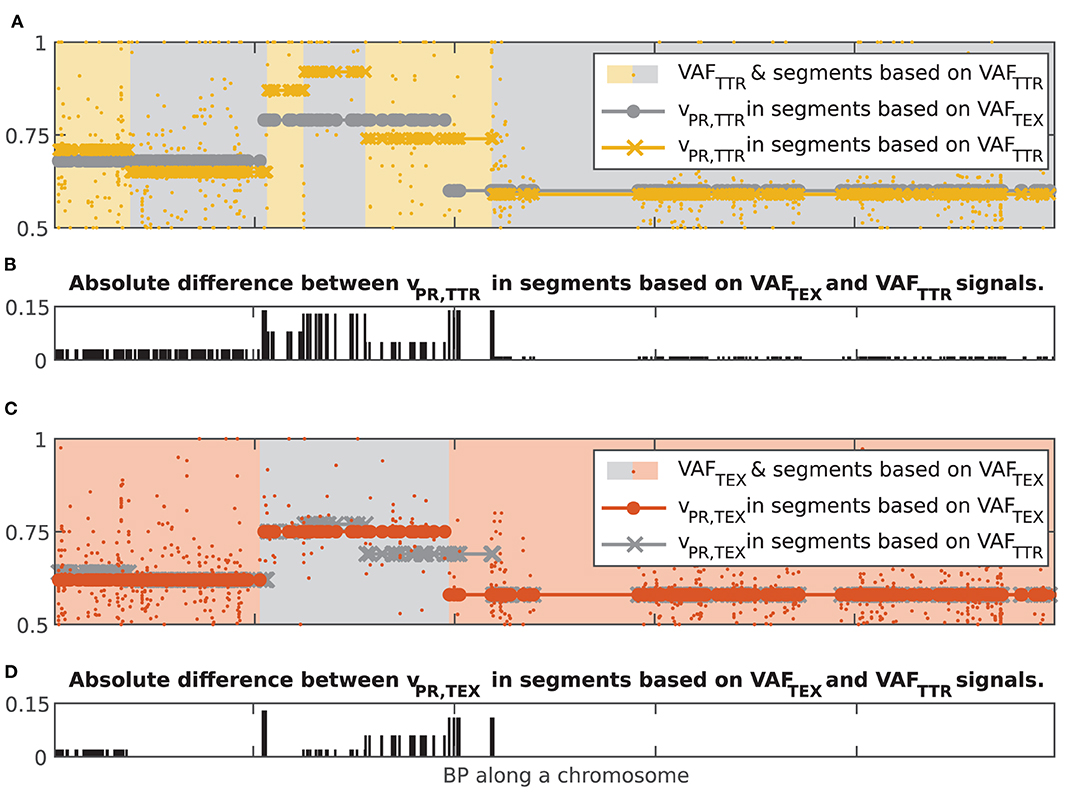
Figure 7. Illustration of concurrence between chromosomal segment resulting from independent segmentations of the dataset based on the VAFTEX and VAFTTR signals. (A) Yellow dots, VAFTTR; gray circles, vPR,TTR interpolated at all data points in segments based on VAFTEX; yellow crosses, vPR,TTR interpolated at all data points in segments based on VAFTTR. (B) Bar plot of the absolute difference between the vPR values in the two kinds of chromosomal segments. (C) orange dots, VAFTEX; gray crosses, vPR,TEX interpolated at all data points in segments based on VAFTEX; orange dots vPR,TEX interpolated at all data points in segments based on VAFTTR. (D) Bar plot of the absolute difference between the vPR values in the two kinds of chromosomal segments.
Correlation Between vPR and CNA
Finally, we assess the correlations between vPR and CNA in the individual samples. We separately computed correlations for deletions and amplifications. In order to separate deletions and amplifications, for each data set we found CNAMIN, value of the CNA in the range −0.3 to 0.3 that had the smallest corresponding vPR,TEX. To account for observed variability of the CNA values near the CNAMIN, we set the threshold for amplifications to CNAAMPLIFICATION = CNAMIN-0.05, and for deletions we set it to CNADELETION = CNAMIN + 0.05 (each data set had a different threshold).
For VAFTEX, we observed significant correlations with negative trend between vPR,TEX and CNA ≤ CNADELETION in 57 datasets and with a positive trend between vPR,TEX and CNA ≥ CNAAMPLIFICATION in 39 datasets (pFDR < 0.05, Pearson's correlation with Benjamini Hochberg multiple comparison correction for 72 samples). For VAFTTR, we observed significant correlations with a negative trend between vPR,TTR and CNA ≤ CNADELETION in 62 datasets and with positive trend between vPR,TTR and CNA ≥ CNAAMPLIFICATION in 33 datasets (pFDR < 0.05, Pearson correlation with Benjamini Hochberg correction). These correlations indicate that the segmentation and the estimated vPR values are concordant with CNA calls. However, the vPR values (estimated at the level of chromosomal segments) do not differentiate between positive and negative values of the CNA, meaning it is not possible to use vPR alone to call amplifications and deletions.
Figure 8 shows four typical patterns of correlation between the CNA and vPR values observed in the data. In Figure 8A, all the values of CNA are close to CNAMIN. In Figure 8B, the relationship between CNA and vPR is noisy, only correlations between vPR,TTR and CNA ≤ CNADELETION are statistically significant (rTEX,CNA,DEL = −0.29, pFDR = 0.063; rTEX,CNA,DEL = −0.38, pFDR = 0.012; rTEX,CNA,AMPL = 0.14, pFDR = 0.58; rTEX,CNA,AMPL = 0.19, pFDR = 0.47; Pearson's correlation with Benjamini Hochberg multiple comparison correction for 72 samples). In Figure 8C all the correlations are statistically significant, vPR,TTR values (circles) follow closely the vPR,TEX (squares) indicating that in most of the windows distributions of the VAFTEX and VAFTTR are concordant (rTEX,CNA,D = −0.91, pFDR < 1e−10; rTEX,CNA,DEL = −0.96, pFDR < 1e−10; rTEX,CNA,AMPL = 0.92, pFDR < 1e−10; rTEX,CNA,AMPL = 0.95, pFDR < 1e−10). In Figure 8D correlations between vPR,TEX, vPR,TTR and CNA ≤ CNAD are statistically significant, but there is a large difference (with median of 0.18) between vPR,TEX and vPR,TTR values, indicating that in most of the windows the distributions of the VAFTEX and VAFTTR in this dataset are discordant (rTEX,CNA,DEL = −0.44, pFDR = 0.047; rTEX,CNA,DEL = −0.64, pFDR = 0.0017; rTEX,CNA,AMPL = 0.44 pFDR = 0.16; rTEX,CNA,AMPL = 0.28, pFDR = 0.41). In many of the datasets we observe that the vPR,TTR values are higher than the corresponding vPR,TEX values (median vPR,TTR-vPR,TEX = 0.03), likely indicative of preferential transcription of some alleles in the chromosomal segment. Correlations between vPR and CNA in all datasets are shown in the Supplementary Figure 1.
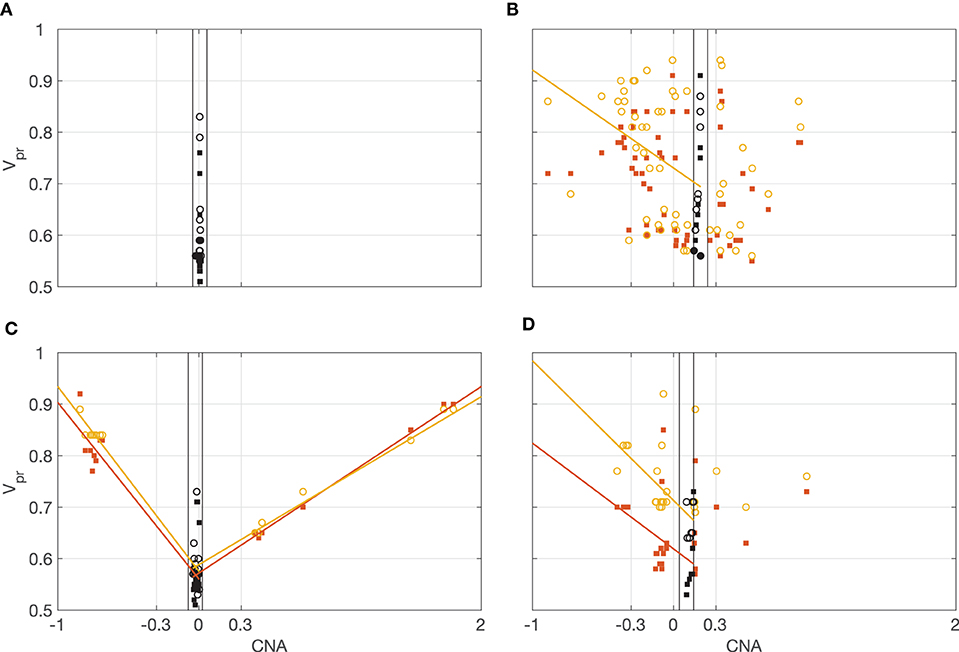
Figure 8. Illustration of the correlations between vPR and CNA. Orange squares vPR,TEX, yellow circles vPR,TTR. Lines, least-squares fitted trends for significant correlations (orange correlation with vPR,TEX, yellow correlation with vPR,TTR). Black, vPR for CNAMIN ± 0.05. Correlations for all the datasets are shown in Supplementary Figure 1. (A) All the values of CNA are close to CNAMIN = 0. (B) Relationship between CNA and vPR is noisy, only some correlations are statistically significant. (C) All the correlations are statistically significant, vPR,TTR values (circles) follow closely the vPR,TEX (squares) indicating concordance of the VAFTEX and VAFTTR distributions. (D) Only correlations for CNA ≤ CNAD are statistically significant.
vPR Based Purity Estimation
To demonstrate a practical application of the vPR values we use them to estimate tumor purity of the samples. To this end we compared the vPR based purity (VBP) estimates with ESTIMATE, ABSOLUTE, LUMP, IHC, and the Consensus Purity Estimation (CPE) (Katkovnik et al., 2002; Pagès et al., 2010; Carter et al., 2012; Yoshihara et al., 2013; Zheng et al., 2014; Aran et al., 2015).
To obtain the VBP estimate we used vPR,TEX values. We, first, selected the vPR,TEX values that: 1. are estimated with high confidence, i.e., are based on at least 50 VAF values; 2. are most likely heterozygous in normal exome, i.e., have a corresponding vPR value in normal exome vPR,NEX <0.58; 3. most likely have vPR,TEX > 0.5, i.e., their p-value for comparison with vPR,TEX = 0.5 is very small p < 1e−5 (Kolmogorov-Smirnov test).
Next, we used the selected vPR,TEX values to find all admissible mixtures (with 1–3 tumor populations and allowing for all events, from deletions to tetraplications). To estimate the VBP, out of all the admissible mixtures we chose these with lowest mixture complexity and among these mixtures we take one with the highest pN (proportion of the normal population). The VBP, percentage of tumor populations in the sample, is then given as 1-pN. Such approach provides rather conservative estimates of VBP (the smallest 1-pN). However, GetAllele can be extended to offer alternative methods of employing the admissible mixtures to estimate VBP. Development, analysis and comparison of alternative VBP estimation methods is beyond scope of the current paper.
Figure 9A shows violin plots of all considered 1-pN values and (x) indicates the smallest value taken as a VBP estimate. In two of the datasets we could not estimate the purity due to lack of suitable vPR,TEX values. The VBP estimates shows the best agreement with ABSOLUTE method (y = 0.86 x + 0.02, r = 0.76, p < 3.4e−14, Pearson's correlation, Figure 9B2). We suppose that this is because the ABSOLUTE method is based on copy number distributions, and our analysis (Section Correlation Between vPR and CNA) revealed high correlations between the CNAs and vPR values. Similar, to the ABSOLUTE method, VBP estimates are generally lower than the other purity estimates (ESTIMATE, LUMP, IHC, CPE); see Figures 9B1–5.
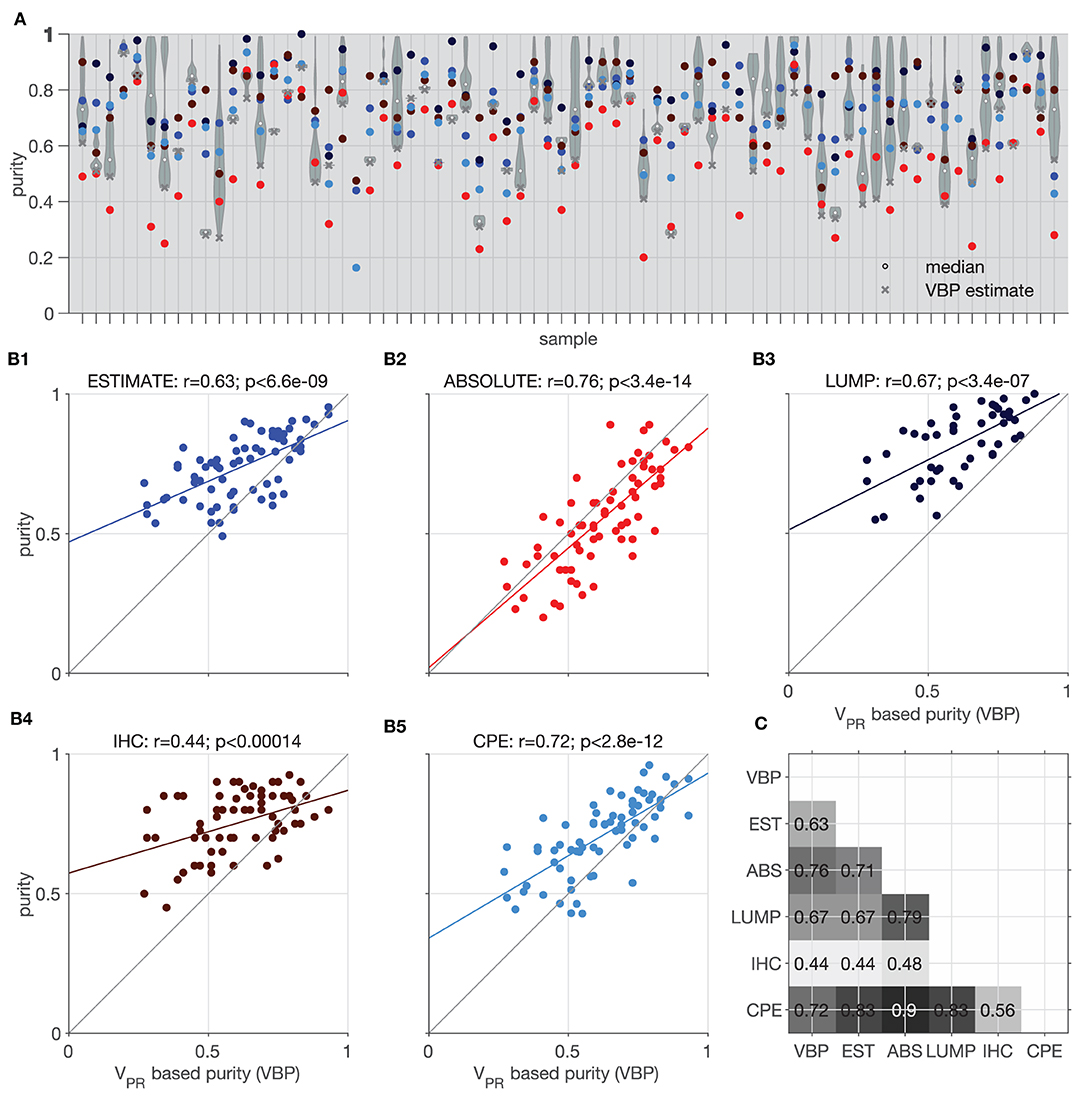
Figure 9. Illustration of purity estimation based on model mixtures and vPR,TEX. Comparison of the Estimate (EST), Absolute (ABS), LUMP, IHC, and the consensus purity estimate (CPE) methods with vPR based purity (VBP). (A) Violin plots show distributions of purity based on all the admissible proportions of the normal population (x) indicates the lowest value selected as the most conservative estimate; colors corresponding to the different methods are indicated in (B1–5). (B1–5) Correlation of the VBP with individual methods; colored line indicates best fit linear trend. (C) Matrix showing significant p < 0.05 Pearson's correlation coefficients between all tested methods.
The approach presented in this section differs from other methods for inferring genomic mixture composition in that it is based on chromosomal segments with at least 50 VAF values which can extend over millions of base pairs. In contrast, PyClone (Roth et al., 2014) is based on sets of carefully selected individual deeply sequenced VAF values, while SciClone (Miller et al., 2014) and TPES (Locallo et al., 2019) are based on analysis of selected VAF values aggregated from the genome-wide sequences (multiple chromosomes). By using chromosomal segments, vPR allows for a more granular description of the VAF distributions than aggregating genome-wide VAF values. At the same time, basing purity estimation on vPR values allows for the use of SNVs with a low sequencing depth (3 in the presented analysis). Rigorous comparison of the performance of the different methods is beyond the scope of this demonstration of potential practical applications of vPR.
Discussion
We present a novel methodology to assess allele asymmetries in RNA and DNA datasets using VAF. Simultaneous analysis of RNA and DNA VAF is becoming more feasible with the growing accessibility of paired RNA and DNA sequencing datasets from the same individual (ENCODE Project Consortium, 2012; Macaulay et al., 2016; Reuter et al., 2016). Our approach addresses the compatibility between RNA and DNA VAF estimations and the high VAF variability by introducing variant probability, vPR, a high-level descriptor of VAF distributions in chromosomal segments (continuous multi-SNV genomic regions).
vPR is a parameter of a stochastic model of VAF distributions that allows for the generation of synthetic VAF samples that closely resembles the observed data. The simplicity and transparency of vPR is one of the biggest advantages of the presented methodology over other existing methods.
Using variant probability, we analyzed relationships between DNA and RNA VAF estimations and biological processes. We observed that, in chromosomes affected by deletions and amplifications, VAFRNA and VAFDNA showed highly concordant breakpoint calls. This indicates that VAFRNA alone can serve as preliminary indicator for break points of DNA deletions or amplifications if they fall within the regions covered by sequencing, and potential could facilitate the estimation of CNAs from RNA-sequencing data. Furthermore, a large proportion of vPR estimates based on VAFRNA samples are higher than vPR estimates based on VAFDNA indicating preferential transcription of some alleles in a number of chromosomal segments. Finally, we showcased that matched vPR,NEX and vPR,TEX values can be used to model the proportions of normal and tumor populations, thereby providing an estimate of the tumor purity. The purity estimates based on variant probabilities show good concordance with other approaches (Pearson's correlation between 0.44 and 0.76; as illustrated in Figure 9). Additionally, once the mixture composition is estimated, vPR values allow for the interrogation of genetic events in each population at a specific chromosomal segment (as illustrated in Figure 5).
Since VAF estimations can be affected by allele mapping bias (Degner et al., 2009) which can lead to overestimation of the reference allele count (Brandt et al., 2015), we suggest that GetAllele input is generated from SNV-aware alignments, which perform better in VAF-based downstream analyses (Spurr et al., 2020). We note that SNV-aware alignments are now facilitated by recent methodological advances, including the implementation of the WASP method (Van De Geijn et al., 2015) in the STAR aligner (Dobin et al., 2013).
Based on our results, variant probabilities can serve as a dependable descriptor of VAF distribution and can be used to assess allele asymmetries or to aid in making matched calls of genomic events in sequencing RNA and DNA datasets without limitations caused by their different molecular nature. Finally, vPR provides conceptual and mechanistic insights into relationships between VAF distributions and underlying genetic events.
Methods for estimating and analyzing vPR values are implemented in a GeTallele toolbox. GeTallele allows to analyse and visualize patterns observed in the VAF distributions at a desired resolution, such as the chromosome, gene or other custom genomic level.
Data Availability Statement
The data analyzed in this study is subject to the following licenses/restrictions: The datasets used and/or analyzed during the current study are available from the corresponding author on reasonable request. Requests to access these datasets should be directed to cC5tLnNsb3dpbnNraUBleGV0ZXIuYWMudWs=.
Author Contributions
PS, ML, PR, NA, LS, CM, KT-A, and AH conception and design of the work. ML data acquisition. PS data analysis. PS, ML, PR, LS, KT-A, and AH interpretation of data. PS creation of new software used in the work. PS, ML, PR, LS, KT-A, and AH have drafted the work or substantively revised it. All authors approved the submitted version. All authors agreed both to be personally accountable for the author's own contributions and to ensure that questions related to the accuracy or integrity of any part of the work, even ones in which the author was not personally involved, are appropriately investigated, resolved, and the resolution documented in the literature.
Funding
This work was supported by McCormick Genomic and Proteomic Center (MGPC), The George Washington University; [MGPC_PG2018 to AH]. Work of PS was generously supported by the Wellcome Trust Institutional Strategic Support Award [204909/Z/16/Z]. KT-A gratefully acknowledges the financial support of the EPSRC via grant EP/N014391/1.
Conflict of Interest
The authors declare that the research was conducted in the absence of any commercial or financial relationships that could be construed as a potential conflict of interest.
Acknowledgments
This manuscript has been released as a pre-print at bioRxiv https://www.biorxiv.org/content/10.1101/491209v3, (Słowiński et al., 2020).
Supplementary Material
The Supplementary Material for this article can be found online at: https://www.frontiersin.org/articles/10.3389/fbioe.2020.01021/full#supplementary-material
Abbreviations
BRCA, breast invasive carcinoma; CDF, cumulative distribution function; CNA, copy number alterations; CNADELETION, copy number alterations corresponding to deletions (see section Correlation between vPR and CNA); CNAAMPLIFICATION, copy number alterations corresponding to amplifications (see section Correlation between vPR and CNA); CPE, consensus purity estimate; DNA, genome; EMD, earth mover's distance; FWER, family-wise error rate; FDR, false discovery rate; MEA, mean absolute error; Nex, normal exome; Ntr, normal transcriptome; rTEX,CNA,DEL, Pearson's correlation coefficient between vPR,TEX and CNADELETION; rTEX,CNA,AMPl, Pearson's correlation coefficient between vPR,TEX and CNAAMPLIFICATION; rTTR,CNA,DEL, Pearson's correlation coefficient between vPR,TTR and CNADELETION; rTTR,CNA,AMPL, Pearson's correlation coefficient between vPR,TTR and CNAAMPLIFICATION; pFDR, p-value after multiple comparisons Benjamini and Hochberg false discovery rate correction; PDF, probability density function; QN (e.g., Q50), N-th percentile; RNA, transcriptome; SNV, single-nucleotide variant; TCGA, the cancer genome atlas; Tex, tumor exome; Ttr, tumor transcriptome; VAF, variant allele frequency; VAFTEX, variant allele frequency in tumor exome sequence; VAFTTR, variant allele frequency in tumor transcriptome sequence; VBP, vPR based purity; vPR, variant probability; vPR,TEX, variant probability estimated from tumor exome sequence; vPR,TTR, variant probability estimated from tumor transcriptome sequence; WES, whole exome sequencing.
References
Aran, D., Sirota, M., and Butte, A. J. (2015). Systematic pan-cancer analysis of tumour purity. Nat. Commun. 6:8971. doi: 10.1038/ncomms9971
Benjamini, Y., and Hochberg, Y. (1995). Controlling the false discovery rate - a practical and powerful approach to multiple testing. J. R. Stat. Soc. B 57, 289–300. doi: 10.1111/j.2517-6161.1995.tb02031.x
Brandt, D. Y., Aguiar, V. R., Bitarello, B. D., Nunes, K., Goudet, J., and Meyer, D. (2015). Mapping bias overestimates reference allele frequencies at the HLA genes in the 1000 genomes project phase I data. G3 5, 931–941. doi: 10.1534/g3.114.015784
Carter, S. L., Cibulskis, K., Helman, E., McKenna, A., Shen, H., Zack, T., et al. (2012). Absolute quantification of somatic DNA alterations in human cancer. Nat. Biotechnol. 30, 413–421. doi: 10.1038/nbt.2203
Degner, J. F., Marioni, J. C., Pai, A. A., Pickrell, J. K., Nkadori, E., Gilad, Y., et al. (2009). Effect of read-mapping biases on detecting allele-specific expression from RNA-sequencing data. Bioinformatics 25, 3207–12. doi: 10.1093/bioinformatics/btp579
Dobin, A., Davis, C. A., Schlesinger, F., Drenkow, J., Zaleski, C., Jha, S., et al. (2013). STAR: ultrafast universal RNA-seq aligner. Bioinformatics 29, 15–21. doi: 10.1093/bioinformatics/bts635
Dunn, O. J. (1961). Multiple comparisons among means. J. Am. Stat. Assoc. 56, 52–64. doi: 10.1080/01621459.1961.10482090
ENCODE Project Consortium (2012). An integrated encyclopedia of DNA elements in the human genome. Nature 489:57. doi: 10.1038/nature11247
Ferreira, E., Shaw, D. M., and Oddo, S. (2016). Identification of learning-induced changes in protein networks in the hippocampi of a mouse model of Alzheimer's disease. Transl. Psychiatry. 6:e849. doi: 10.1038/tp.2016.114
Ha, G., Roth, A., Lai, D., Bashashati, A., Ding, J., Goya, R., et al. (2012). Integrative analysis of genome-wide loss of heterozygosity and monoallelic expression at nucleotide resolution reveals disrupted pathways in triple-negative breast cancer. Genome Res. 22, 1995–2007. doi: 10.1101/gr.137570.112
Han, L., Vickers, K. C., Samuels, D. C., and Guo, Y. (2015). Alternative applications for distinct RNA sequencing strategies. Brief. Bioinform. 16, 629–639. doi: 10.1093/bib/bbu032
Hardy, G. H., and Wright, E. M. (2008). An Introduction to the Theory of Numbers. Oxford, NY: Oxford University Press.
Hollander, M., Wolfe, D. A., and Chicken, E. (2013). Nonparametric Statistical Methods. Hoboken, NJ: John Wiley & Sons.
Kantorovich, L. V., and Rubinstein, G. S. (1958). On a space of completely additive functions. Vestnik Leningrad. Univ. 13, 52–59.
Katkovnik, V., Kgiazarian, K., and Astola, J. (2002). Adaptive window size image de-noising based on intersection of confidence intervals (ICI) rule. J. Math. Imaging Vis. 16, 223–235. doi: 10.1023/A:1020329726980
Killick, R., Fearnhead, P., and Eckley, I. A. (2012). Optimal detection of changepoints with a linear computational cost. J. Am. Stat. Assoc. 107, 1590–1598. doi: 10.1080/01621459.2012.737745
Lavielle, M. (2005). Using penalized contrasts for the change-point problem. Signal Process 85, 1501–1510. doi: 10.1016/j.sigpro.2005.01.012
Levina, E., and Bickel, P. (2001). “The earth mover's distance is the mallows distance: some insights from statistics,” in IEEE International Conference on Computer Vision (Vancouver, BC), 251–256. doi: 10.1109/ICCV.2001.937632
Li, H. (2011). A statistical framework for SNP calling, mutation discovery, association mapping and population genetical parameter estimation from sequencing data. Bioinformatics 27, 2987–2993. doi: 10.1093/bioinformatics/btr509
Li, H., Handsaker, B., Wysoker, A., Fennell, T., Ruan, J., Homer, N., et al. (2009). The sequence alignment/map format and SAMtools. Bioinformatics 25, 2078–2079. doi: 10.1093/bioinformatics/btp352
Locallo, A., Prandi, D., Fedrizzi, T., and Demichelis, F. (2019). TPES: tumor purity estimation from SNVs. Bioinformatics 35, 4433–4435 doi: 10.1093/bioinformatics/btz406
Macaulay, I. C., Teng, M. J., Haerty, W., Kumar, P., Ponting, C. P., and Voet, T. (2016). Separation and parallel sequencing of the genomes and transcriptomes of single cells using G&T-seq. Nat. Protoc. 11, 2081–2103. doi: 10.1038/nprot.2016.138
Miller, C. A., White, B. S., Dees, N. D., Griffith, M., Welch, J. S., Griffith, O. L., et al. (2014). SciClone: inferring clonal architecture and tracking the spatial and temporal patterns of tumor evolution. PLOS Comput. Biol. 10:e1003665. doi: 10.1371/journal.pcbi.1003665
Morin, R. D., Mungall, K., Pleasance, E., Mungall, A. J., Goya, R., Huff, R. D., et al. (2013). Mutational and structural analysis of diffuse large B-cell lymphoma using whole-genome sequencing. Blood 122, 1256–1265. doi: 10.1182/blood-2013-02-483727
Movassagh, M., Alomran, N., Mudvari, P., Dede, M., Dede, C., Kowsari, K., et al. (2016). RNA2DNAlign: nucleotide resolution allele asymmetries through quantitative assessment of RNA and DNA paired sequencing data. Nucleic Acids Res. 44:e161. doi: 10.1093/nar/gkw757
Oesper, L., Mahmoody, A., and Raphael, B. J. (2013). THetA: inferring intra-tumor heterogeneity from high-throughput DNA sequencing data. Genome Biol. 14:R80. doi: 10.1186/gb-2013-14-7-r80
Oesper, L., Satas, G., and Raphael, B. J. (2014). Quantifying tumor heterogeneity in whole-genome and whole-exome sequencing data. Bioinformatics 30, 3532–3540. doi: 10.1093/bioinformatics/btu651
Pagès, F., Galon, J., Dieu-Nosjean, M. C., Tartour, E., Sautes-Fridman, C., and Fridman, W. H. (2010). Immune infiltration in human tumors: a prognostic factor that should not be ignored. Oncogene 29, 1093–1102. doi: 10.1038/onc.2009.416
Reuter, J. A., Spacek, D. V., Pai, R. K., and Snyder, M. P. (2016). Simul-seq: combined DNA and RNA sequencing for whole-genome and transcriptome profiling. Nat. Methods 13, 953–958. doi: 10.1038/nmeth.4028
Roth, A., Khattra, J., Yap, D., Wan, A., Laks, E., Biele, J., et al. (2014). PyClone: statistical inference of clonal population structure in cancer. Nat. Methods 11, 396–398. doi: 10.1038/nmeth.2883
Shah, S. P., Roth, A., Goya, R., Oloumi, A., Ha, G., Zhao, Y., et al. (2012). The clonal and mutational evolution spectrum of primary triple-negative breast cancers. Nature 486, 395–399. doi: 10.1038/nature10933
Shi, L., Guo, Y., Dong, C., Huddleston, J., Yang, H., Han, X., et al. (2016). Long-read sequencing and de novo assembly of a Chinese genome. Nat. Commun. 7:12065. doi: 10.1038/ncomms12065
Shlien, A., Raine, K., Fuligni, F., Arnold, R., Nik-Zainal, S., Dronov, S., et al. (2016). Direct transcriptional consequences of somatic mutation in breast cancer. Cell Rep. 16, 2032–2046. doi: 10.1016/j.celrep.2016.07.028
Słowiński, P., Li, M., Restrepo, P., Alomran, N., Spurr, L. F., Miller, C., et al. (2020). GeTallele: a mathematical model and a toolbox for integrative analysis and visualization of DNA and RNA allele frequencies. bioRxiv [Preprint]. doi: 10.1101/491209
Spurr, L. F., Alomran, N., Bousounis, P., Reece-Stremtan, D., Prashant, N. M., Liu, H., et al. (2020). ReQTL: identifying correlations between expressed SNVs and gene expression using RNA-sequencing data. Bioinformatics 36, 1351–1359. doi: 10.1093/bioinformatics/btz750
Thorvaldsdóttir, H., Robinson, J. T., and Mesirov, J. P. (2013). Integrative genomics viewer (IGV): high-performance genomics data visualization and exploration. Brief. Bioinform. 14, 178–192. doi: 10.1093/bib/bbs017
Van De Geijn, B., McVicker, G., Gilad, Y., and Pritchard, J. K. (2015). WASP: allele-specific software for robust molecular quantitative trait locus discovery. Nat. Methods 12, 1061–1063. doi: 10.1038/nmeth.3582
Yang, S., Mercante, D. E., Zhang, K., and Fang, Z. (2016). An integrated approach for RNA-seq data normalization. Cancer Inform. 15, 129–141. doi: 10.4137/CIN.S39781
Yoshihara, K., Shahmoradgoli, M., Martínez, E., Vegesna, R., Kim, H., Torres-Garcia, W., et al. (2013). Inferring tumour purity and stromal and immune cell admixture from expression data. Nat. Commun. 4:2612. doi: 10.1038/ncomms3612
Keywords: variant allele fraction (VAF), RNA—DNA, earth mover's distance (EMD), circos plot, farey sequence
Citation: Słowiński P, Li M, Restrepo P, Alomran N, Spurr LF, Miller C, Tsaneva-Atanasova K and Horvath A (2020) GeTallele: A Method for Analysis of DNA and RNA Allele Frequency Distributions. Front. Bioeng. Biotechnol. 8:1021. doi: 10.3389/fbioe.2020.01021
Received: 21 April 2020; Accepted: 04 August 2020;
Published: 16 September 2020.
Edited by:
Quan Zou, University of Electronic Science and Technology of China, ChinaReviewed by:
Stephen J. Bush, University of Oxford, United KingdomXiaojian Shao, National Research Council Canada - Conseil national de recherches Canada, Canada
Copyright © 2020 Słowiński, Li, Restrepo, Alomran, Spurr, Miller, Tsaneva-Atanasova and Horvath. This is an open-access article distributed under the terms of the Creative Commons Attribution License (CC BY). The use, distribution or reproduction in other forums is permitted, provided the original author(s) and the copyright owner(s) are credited and that the original publication in this journal is cited, in accordance with accepted academic practice. No use, distribution or reproduction is permitted which does not comply with these terms.
*Correspondence: Piotr Słowiński, cC5tLnNsb3dpbnNraUBleGV0ZXIuYWMudWs=
 Piotr Słowiński
 Muzi Li2
 Liam F. Spurr
 Krasimira Tsaneva-Atanasova
 Anelia Horvath