- 1Academician Workstation, Changsha Medical University, Changsha, China
- 2Geneis (Beijing) Co., Ltd., Beijing, China
- 3Department of Radiology, Beijing Chest Hospital, Capital Medical University, Beijing Tuberculosis and Thoracic Tumor Research Institute, Beijing, China
- 4Inner Mongolia People’s Hospital, Huhhot, China
Sequencing-based identification of tumor tissue-of-origin (TOO) is critical for patients with cancer of unknown primary lesions. Even if the TOO of a tumor can be diagnosed by clinicopathological observation, reevaluations by computational methods can help avoid misdiagnosis. In this study, we developed a neural network (NN) framework using the expression of a 150-gene panel to infer the tumor TOO for 15 common solid tumor cancer types, including lung, breast, liver, colorectal, gastroesophageal, ovarian, cervical, endometrial, pancreatic, bladder, head and neck, thyroid, prostate, kidney, and brain cancers. To begin with, we downloaded the RNA-Seq data of 7,460 primary tumor samples across the above mentioned 15 cancer types, with each type of cancer having between 142 and 1,052 samples, from the cancer genome atlas. Then, we performed feature selection by the Pearson correlation method and performed a 150-gene panel analysis; the genes were significantly enriched in the GO:2001242 Regulation of intrinsic apoptotic signaling pathway and the GO:0009755 Hormone-mediated signaling pathway and other similar functions. Next, we developed a novel NN model using the 150 genes to predict tumor TOO for the 15 cancer types. The average prediction sensitivity and precision of the framework are 93.36 and 94.07%, respectively, for the 7,460 tumor samples based on the 10-fold cross-validation; however, the prediction sensitivity and precision for a few specific cancers, like prostate cancer, reached 100%. We also tested the trained model on a 20-sample independent dataset with metastatic tumor, and achieved an 80% accuracy. In summary, we present here a highly accurate method to infer tumor TOO, which has potential clinical implementation.
Introduction
Worldwide, almost one in three cancer patients is clinically diagnosed with distant metastases. In most cases, primary and metastatic lesions are identified simultaneously; however, some primary tumors cannot be found after systematic clinicopathological diagnosis (Tomuleasa et al., 2017). Cases with cancer of unknown primary (CUP) lesions account for approximately 3–5% of all newly diagnosed cancers (Richardson et al., 2015); due to its poor prognosis, CUP is the fourth-highest cause of cancer-related deaths around the world (Pavlidis and Fizazi, 2005; Kamposioras et al., 2013). Cancer of unknown primary patients are generally treated with non-selective empirical chemotherapy, which leads to a very low short-term survival rate (Kurahashi et al., 2013). Thus, identifying the primary site is critical for improving long-term survival in CUP patients, especially when considering cancer-type specific targeted therapy (Hudis, 2007; Varadhachary et al., 2008; Hyphantis et al., 2013).
To identify the primary lesion of CUP, a systematic assessment is performed which consists of physical examination, patient-history analysis, serum markers, radiological imaging; as well as immunohistochemical analysis. Immunohistochemical markers are very important for determining tissue-of-origin (TOO; MacReady, 2010; Molina et al., 2012; Oien and Dennis, 2012; Pavlidis and Pentheroudakis, 2012); however, the expressed markers may be non-specific sometimes (Handorf et al., 2013; Montezuma et al., 2013; Tothill et al., 2013). Recently, studies have shown that cellular-origin signatures, which are sufficiently retained in primary tissue, persist after primary cancer cells undergo dedifferentiation and colonization in different tissue types (Ma et al., 2005; Tothill et al., 2005). Molecular profiling is a promising technique that can improve primary-site diagnosis in CUP patients (Ma et al., 2005; Lazaridis et al., 2008; Meiri et al., 2012); it is based on expression microarrays and the quantitative real-time polymerase chain reaction (qRT-PCR) experimental platform (Ma et al., 2005; Lazaridis et al., 2008; Greco et al., 2012; Meiri et al., 2012).
In recent years, cancer classification based on gene expression data such as RT-PCR has attracted great interest and has been implemented in different studies (Lapointe et al., 2004; Mramor et al., 2007; Liu et al., 2008). Single studies are prone to laboratory-specific bias; they are usually limited to a relatively small number of samples and fail to yield novel markers for clinical application. However, applying Next Generation Sequencing (NGS) technology helps alleviate the issue of batch effect by providing gene expression data sets from multiple studies; thus, the integrative analysis of such data can be considered a source of cancer classification. In this regard, establishing a robust classification model is a challenging task; bioinformatics feature selection techniques for establishing such models have been introduced in a previous review (Saeys et al., 2007).
Support vector machines (SVMs) based on the recursive feature elimination (RFE) algorithm represent embedded methods used for feature selection and classification modeling based on microarray gene expression data, which mined 11,925 genes to 154 genes with definite biological significance (Xu et al., 2016). More than 20,000 genes were generated from NGS RNA-Seq data in other studies (Bhowmick et al., 2019); this number is almost twice as much as that from microarray gene expression data. Hence, RNA-Seq data from nine cancer types (lung, liver, colon, thyroid, prostate, bladder, kidney, brain, and skin) were analyzed with different algorithms, and Artificial Bee Colony (ABC) yielded better results than Ant Colony Optimization, Differential Evolution, and Particle Swarm Optimization. Among different cancer types, lower grade brain glioma had the highest accuracy (99.1%) based on the ABC algorithm (Bhowmick et al., 2019). However, the robustness of feature selection and classification modeling methods still needs to be comprehensively evaluated; different algorithms might result in different results depending on their model (Chopra et al., 2010; Bhowmick et al., 2019). Therefore, it is necessary to design a robust classification algorithm based on NGS data that can yield accurate cancer type classification and supplement clinical examination.
In the present study, genome-wide gene expression profiles were established based on comprehensive RNA-Seq data. The gene expression data of ∼8,000 tumor samples were used to identify gene signatures for 15 common human cancer types (lung, breast, liver, colorectal, gastroesophageal, ovarian, cervical, endometrial, pancreatic, bladder, head and neck, thyroid, prostate, kidney, and brain). To screen gene features and evaluate cancer classifiers, the Pearson correlation Neural Network (NN) algorithm was implemented in this study to identify tumor origins.
Materials and Methods
RNA-Seq Datasets
NGS-based gene expression profiling data of 7,480 tumor samples were collected from The Cancer Genome Atlas (TCGA, release version v26),1 and the tissue origins of those samples were confirmed through histopathological analysis. The downloaded data offered RNA-seq data of 21 cancer types that belongs to projects from United States, which is sequenced using the same protocols. Among them, melanoma had a distinct distribution from other cancer types (80 samples were sampled from primary tumor and 352 were sampled from metastatic tumor) and was excluded. Thus, the expression profiles of 15 common cancer types (lung, breast, liver, colorectal, gastroesophageal, ovarian, cervical, endometrial, pancreatic, bladder, head and neck, thyroid, prostate, kidney, and brain) were studied in this work. The normalized expression value of expression data was downloaded from TCGA and provided the expression levels of 20,501 unique genes for the 15 chosen cancer types.
To perform the bioinformatics analysis in this study, the transcript level of genes was normalized again to form a matrix with rows of sample numbers and columns of gene numbers. The normalization was done by dividing the sum of the gene expression value of each sample. Normalized gene expression data were extracted and represented as a matrix with ‘m’ rows and ‘n’ columns, such that ‘m’ represented 7,480 tumor samples and ‘n’ represented the expression levels of 20,501 unique genes.
For log transformation, we used log2 to transform the original dataset after replacing zeros to global minimum × 0.1. No normalizations were done after feature selection.
Among all the samples, 7,460 samples were sampled from primary tumors, remaining 20 samples sampled from the metastatic tumors.
Gene Feature Identification
To identify an optimal gene signature, we introduced a strategy of feature selection and multi-class classification modeling in this study. According to the mechanism of feature selection, the sets of genes were screened by the Pearson Correlation algorithm (Hall, 1998; Saeys et al., 2007). This study consisted of the following steps: (i) create an array to binarize rows for each cancer type (C columns) for the m tumor samples, labeling the sample as “true” if the sample belongs to the cancer type, otherwise the sample was labeled as “False,” where C is the total cancer types and m is the sample number; (ii) calculate the correlation of gene expression level with samples labeled “true” for each cancer type, then sort in decreasing order according to their correlation; (iii) take the most important signatures, appeared top N of the list, for each cancer type, where N is an integer; and (iv) combine C lists of the top N genes and remove the redundant genes, generating a gene set. Gene expression values from the gene set will be extracted for further usage.
Feature Performance Assessment
We used a NN (Hinton, 1989) to train the classification model. The gene expression values were used as input signatures for the NN. The NN was designed with three layers, in which the input layer has N units, the hidden layer has 50 units, and output layer has 15 units corresponding to each cancer where N is the gene number of the input matrix. The output layer of the NN was used as the input for the Softmax function to obtain the probabilities for each cancer type. To prevent overfitting, L2 penalty was set to 0.0001. For comparison, we used logistic regression as a baseline method. The parameter C was set to 10,000 for logistic regression. The algorithms were implemented using scikit-learn package (Pedregosa et al., 2011).
Gene Ontology Analysis
To perform the Gene ontology (GO) analysis of the identified gene features, GO consortium (Ashburner et al., 2000) was used. The enrichment result was generated by clusterProfiler, which performs a hyper geometric test between the tested genes and gene sets in GO terms (Yu et al., 2012). The biological significances of the selected genes were examined by GO enrichment analysis to identify the most enriched biological-process terms. Benjamini–Hochberg was used to adjust the p value.
Results
Collection of Gene Expression Datasets of Common Human Cancer Types
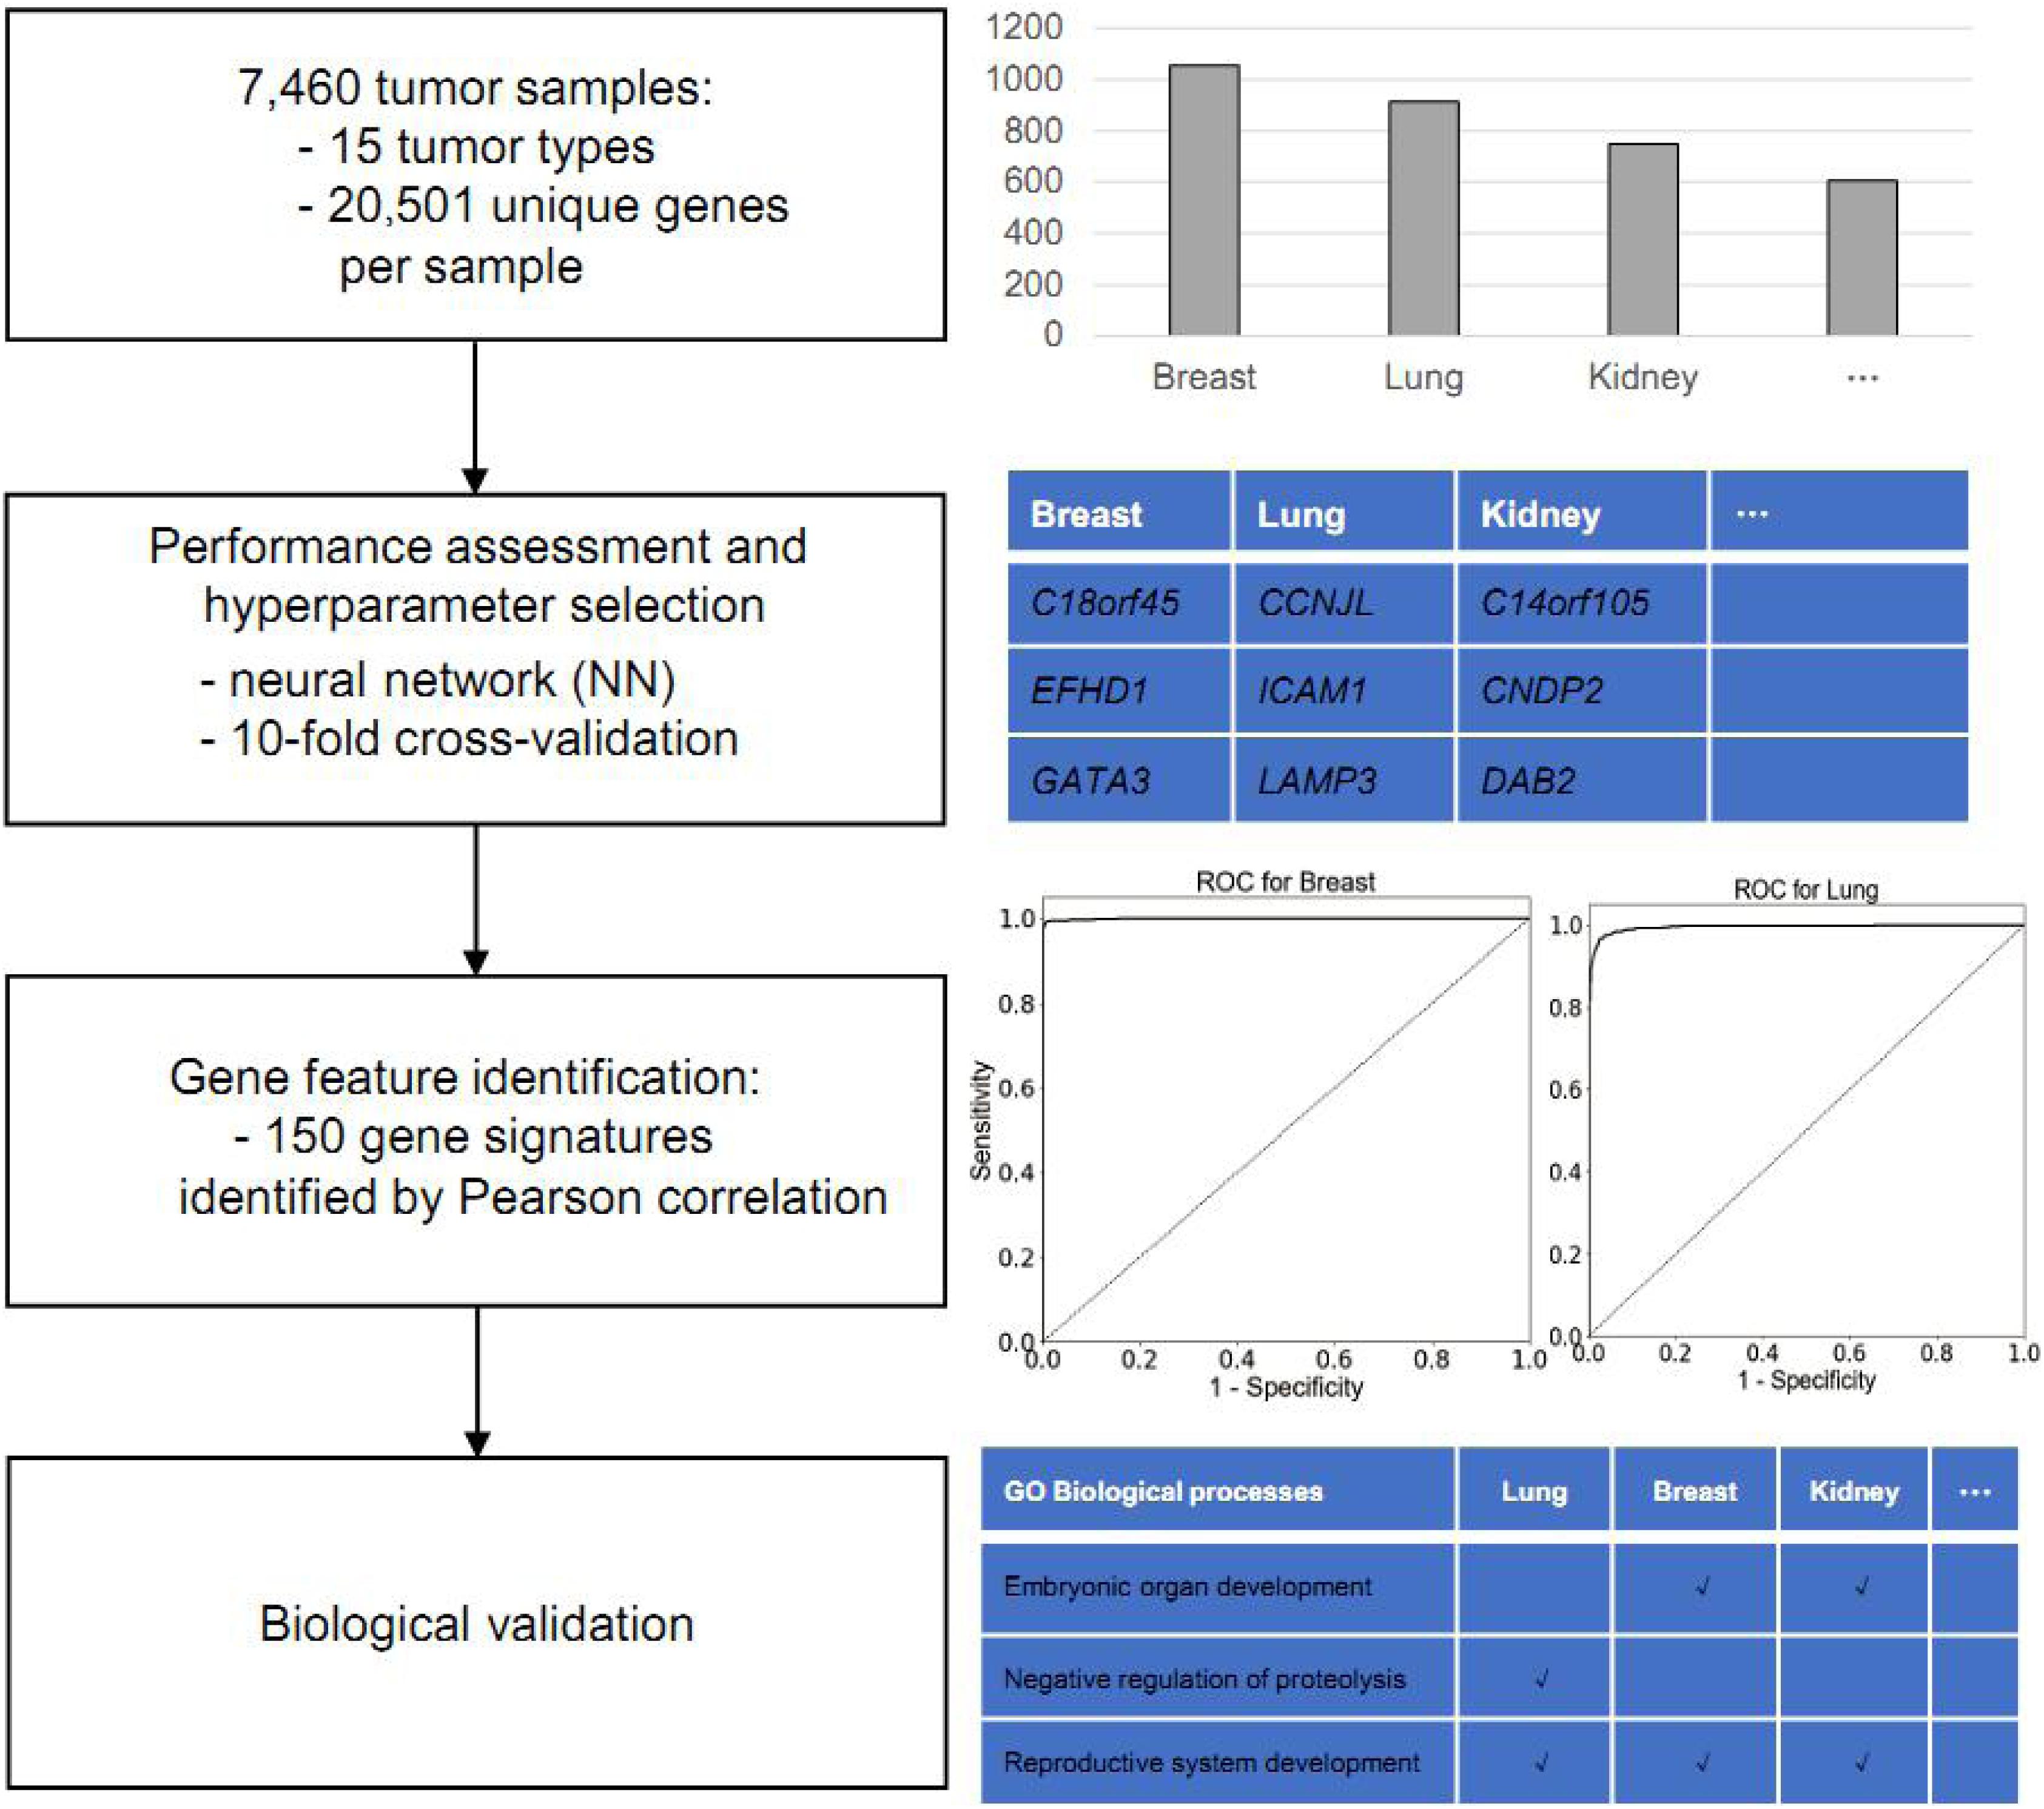
The main objective in this study is to identify putative gene biomarkers to classify cancer type. The workflow of the present study is shown in Figure 1. For this analysis, the TCGA was used to obtain gene expression profiles of 15 common solid tumor cancer types via NGS-based RNA-Seq, including lung, gastroesophageal, colorectal, liver, breast, thyroid, cervical, brain, pancreatic, ovarian, endometrial, bladder, kidney, head and neck, and prostate. In total, the expression data of 7,480 tumor samples were collected. Among those, the gene expression profiles of lung adenocarcinoma and lung squamous cell carcinoma samples were merged into lung cancer; those of colon adenocarcinoma and rectum adenocarcinoma were merged into colorectal cancer; those of kidney renal clear cell carcinoma and kidney renal papillary cell carcinoma were merged into kidney cancer; and those of glioblastoma multiforme and lower grade glioma were merged into brain cancer.
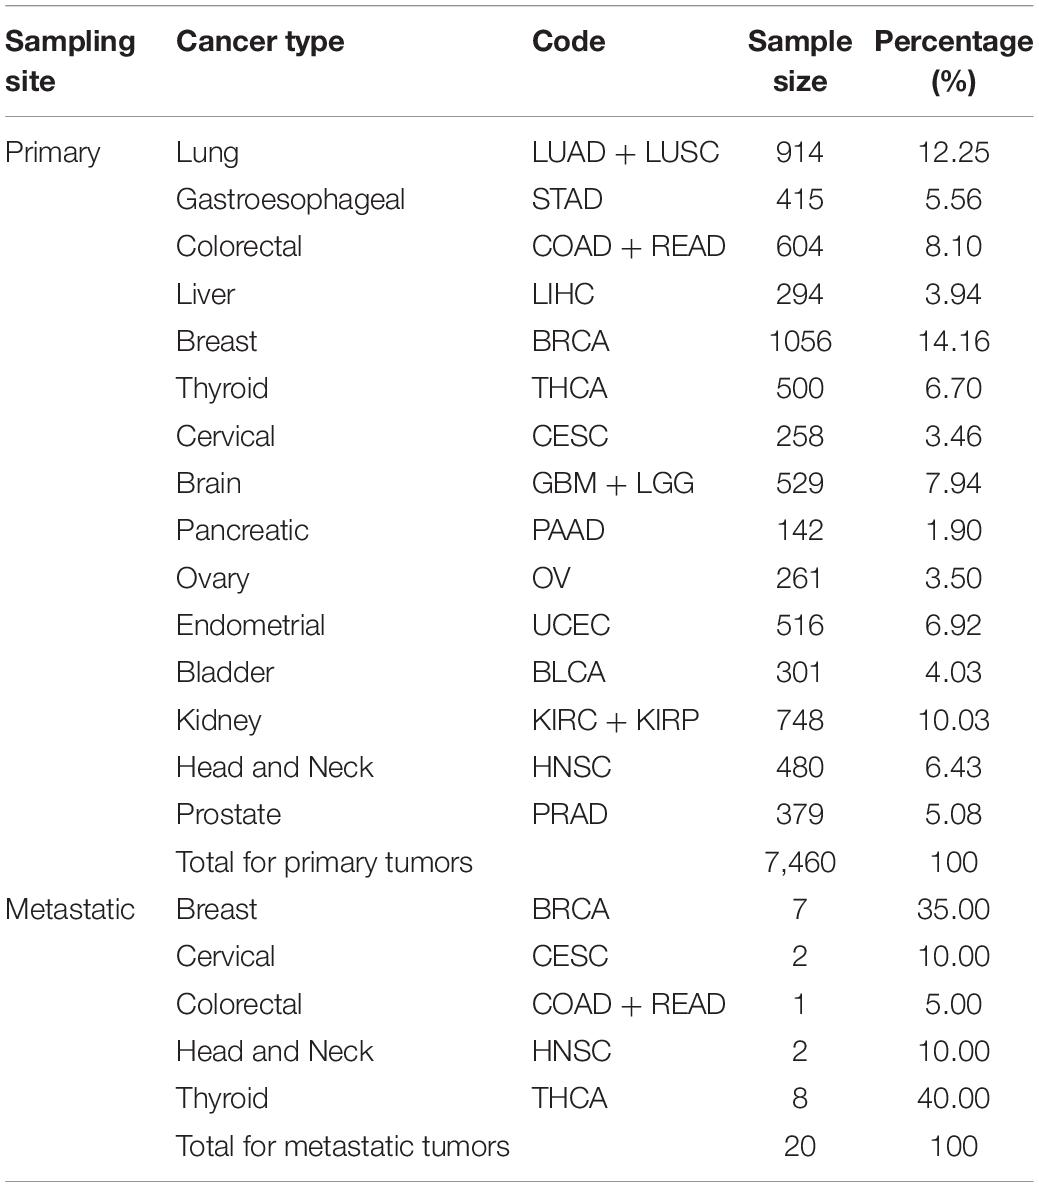
Around 20 of the 7,480 samples were sampled from metastatic tumors, whereas 7,460 were sampled from primary tumors. Thus, we split the dataset into the 7,460-sample training dataset and the 20-sample test dataset according to the sampling tumor type. All cancer types in the training dataset had more than 100 samples; the largest sample size was that of breast cancer (1,056 samples), whereas, the smallest sample size was that of pancreatic cancer (142 samples). Table 1 summarizes the datasets and provides information on the tumor samples.
Hundred and Fifty as a Feature Number Works Well With the Neural Network
A classification modeling database of 15 common cancer types was established based on the expression data of 20,501 unique genes obtained from TCGA. However, having a large number of samples per cancer type might result in variations due to intra-tumor heterogeneity; hence, it is critical to identify the gene expression features from high-dimension datasets. Pearson correlation-based feature selection represents a multivariable filter method for high-dimension data analysis (Hall, 1998; Saeys et al., 2007), which is fast in operation and simple in complex computation; they are used to assess the correlation between cancer type and corresponding gene-expression features. Here, we used Pearson correlation to select the gene-expression signature from NGS-based mRNA expression data for each cancer type. In this study, we used integers from 1 to 20 as candidates for gene number for each cancer type, which might give rise to 20 possible gene sets of 15, 30, …, 300 with a step of 15.
The regression model is an important mathematical model for classification. NNs, as types of deep learning algorithms, are advanced techniques that can analyze complex and high-dimensional data. NNs have been applied in protein classification (Asgari and Mofrad, 2015) and anomaly classification (Suk and Shen, 2013; Plis et al., 2014; Hua et al., 2015). Here, we used NNs as the classification model to assess the performance of different numbers of features. The gene expressions levels were the input layer for the NN; 15 cancer types were the output layer obtained from NNs.
Usually, 10-fold cross-validation is used for minimizing the over-fitting issues and obtaining good performance. Hence, to avoid overfitting of the NN algorithm, we ran a 10-fold cross-validation 10 times using the 7,460-sample training dataset to obtain relatively stable and reliable results, possibly minimizing the percentage of false positives and false negatives. The 10-fold cross validation was performed as follows. (a) Split the whole training dataset into 10 disjoint parts randomly. (b) Use 9 parts as the training set (9/10 training set). (c) Choose N genes using Pearson correlation from the 9/10 training set, where N is the gene number which might be 15, 30, …, 300 with a step of 15. (d) Train a model using the selected genes using the 9/10 training set. (e) Use the remaining one part as test set as the validation set of the previously trained model. (f) Repeat b–e 10 times with each part being the test set, until all the samples are predicted once. Finally, (g) merge the results from the test parts and evaluate the metrics.
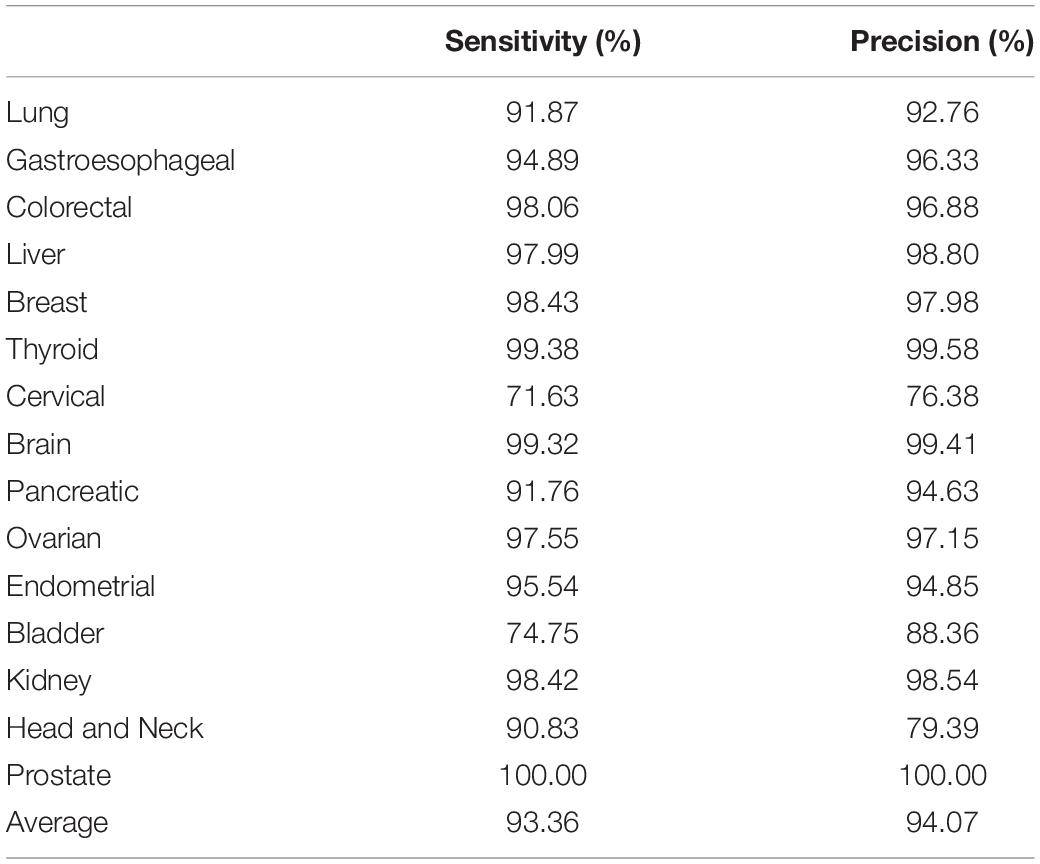
The cross validation was done using different gene number and the accuracies from each 10-fold cross validation are plotted. For comparison, we also used logistic regression as a baseline model (Figure 2). We achieved a good accuracy when the selected gene number is 150. Though a better accuracy could be achieved using the 200 or more as the feature number, the growth curve of number-accuracy is slowing down. The 150 could be seen as a turning point for this curve. Thus, we finally chose the number 150 as the feature number. The results was calculated by averaging the results of 10 times of 10-fold cross validations and showed that the overall accuracy of each cancer type was 94.87% using 150 as the feature number; the sensitivity was on average 93.36%, while the precision was on average 94.07%, corresponding to the actual numbers of cancer samples (Table 2). Among the 15 cancer types, the classifier sensitivity of 13 cancer types (lung, breast, liver, colorectal, gastroesophageal, ovarian, endometrial, pancreatic, head and neck, thyroid, prostate, kidney, and brain) was more than 90%, with that of prostate cancer having the highest sensitivity (100%). On the contrary, the remaining two cancer types had a sensitivity of <90% (74.75% for bladder cancer and 71.63% for cervical cancer) (Figure 3 and Table 2).
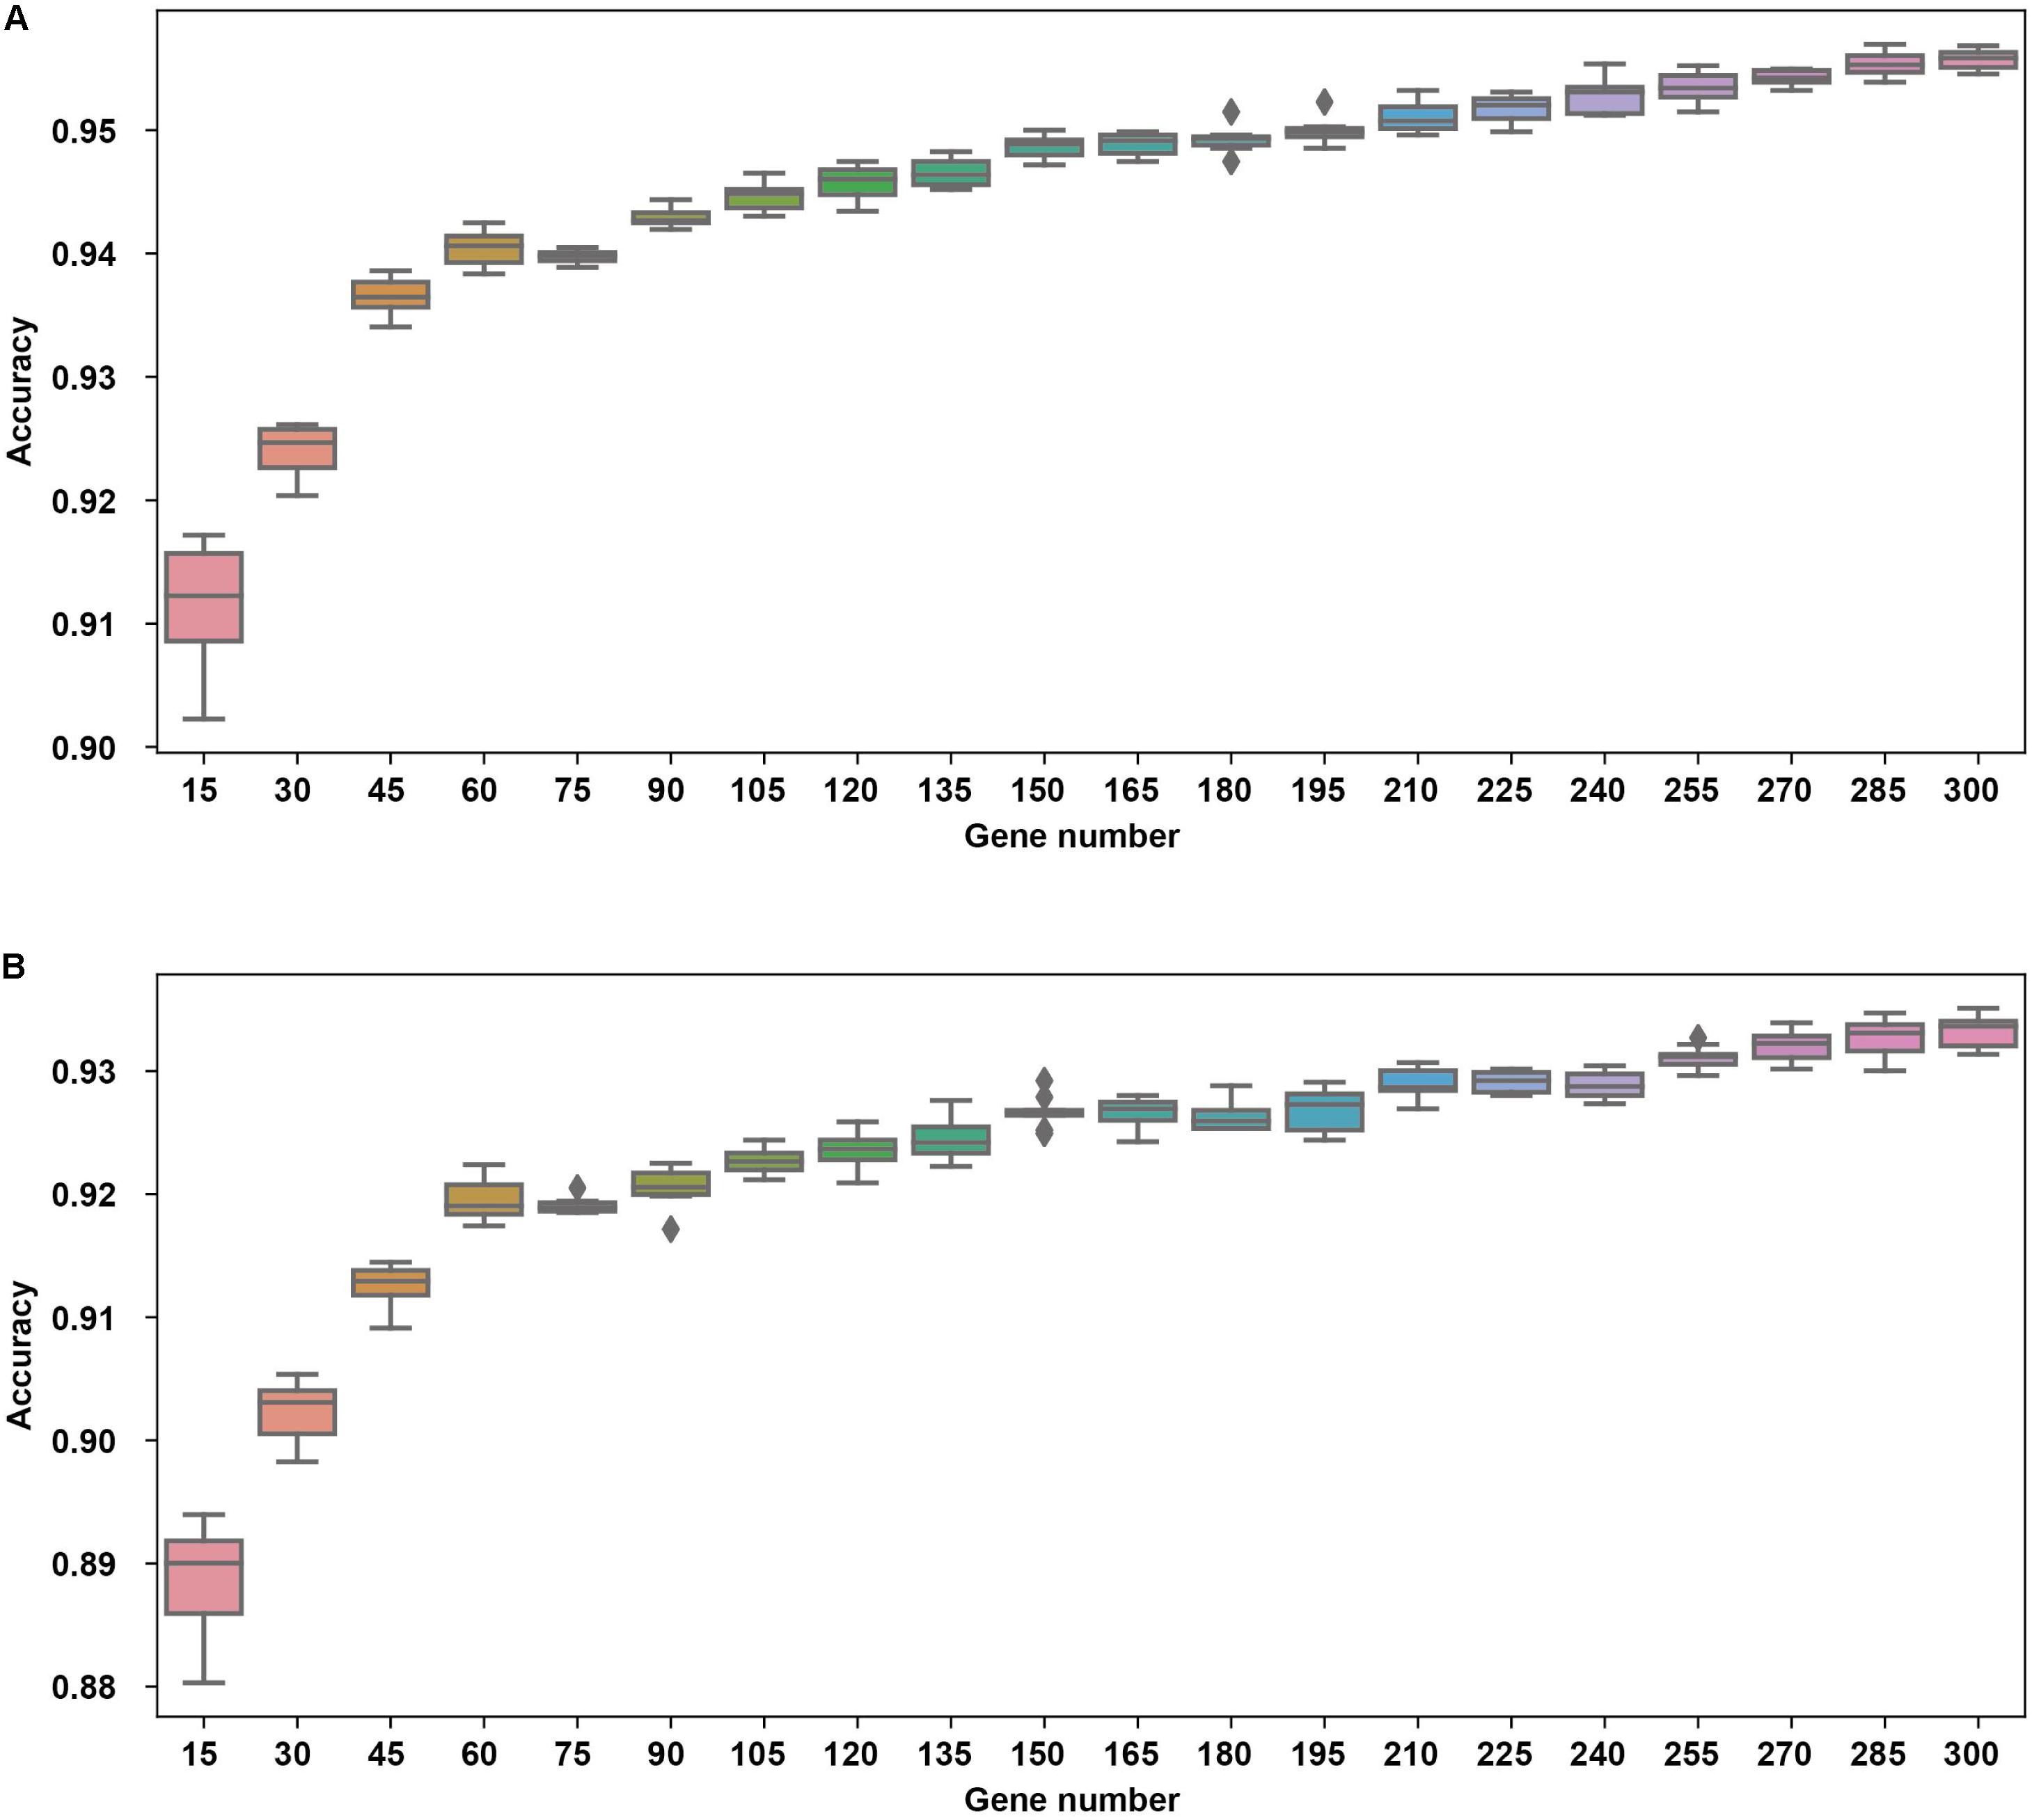
Figure 2. The cross validation accuracy of different gene numbers using neural network (A) and logistic regression (B).
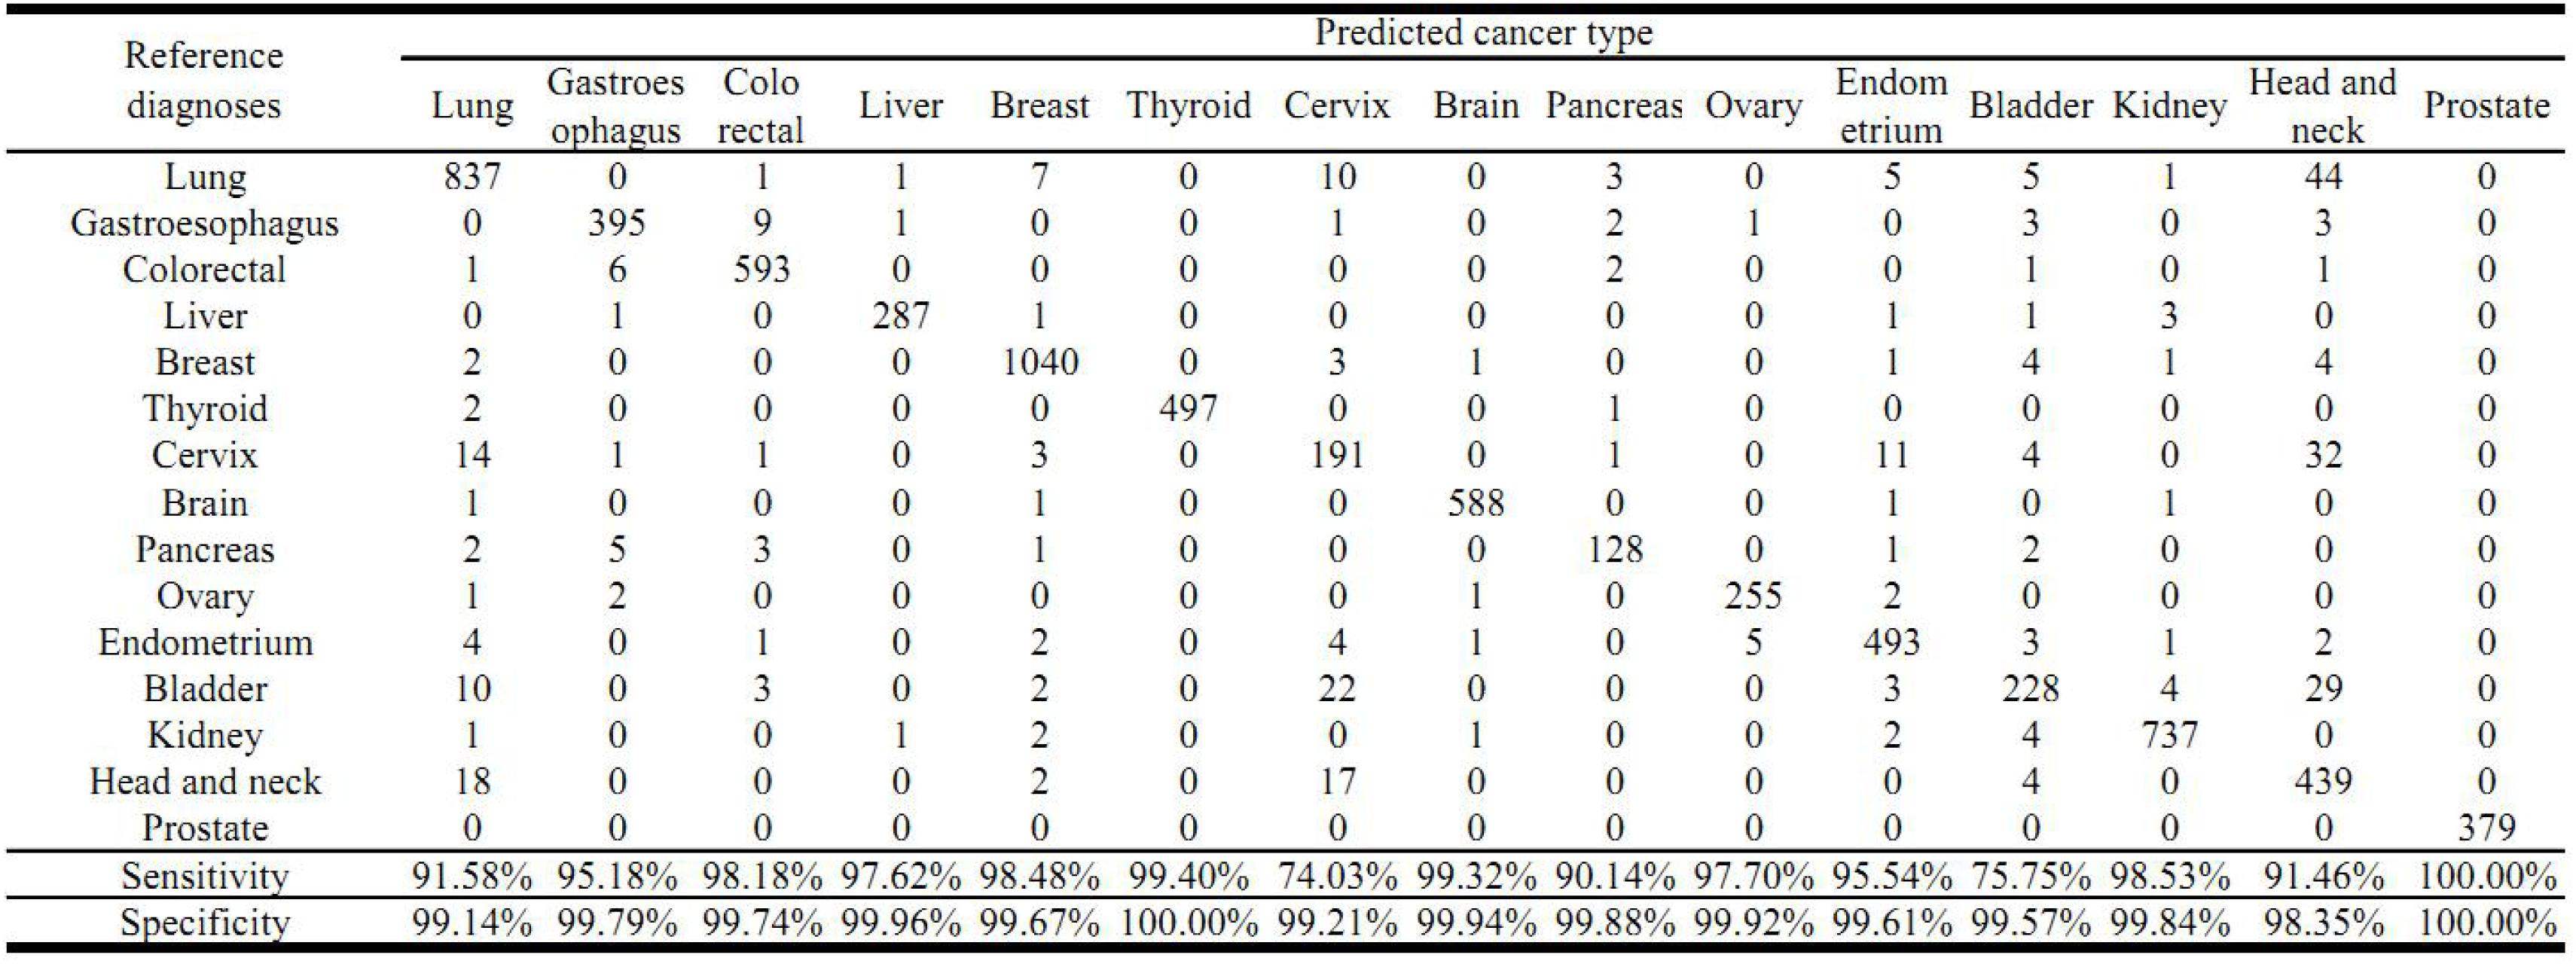
Figure 3. Prediction of cancer type by confusion matrix analysis. The confusion matrix is from one 10-fold cross validation and displayed the relationship between reference diagnosis and the predicted cancer type. The first column represents reference diagnoses; the predicted cancer types by transcript levels of the 150 genes are shown across the top row.
We also attempted to use the log-transformed data for in the cross validation since log-transformation was a common transformation for gene expression profile. For a reasonable comparison, we selected 10 genes for each cancer in each fold of cross validation. However, the overall accuracy by 10 times of 10-fold cross validations only reached 80.90% (Supplementary Table S1), which is not satisfactory. In contrast, the data by the previously described transformation method output the result of 94.87%, showing more optimization shall be done for a better result using the log-transformed data.
The Identified Genes Were Enriched in Several Organ-Specific Pathways
A 150-gene set was identified using the whole training dataset for subsequent processing (Table 3). To understand how frequently those genes will show up in the cross validation phase, we counted the genes in all the 100 gene sets used in the cross validation and found that 117 genes out of the 150 gene showed up in all gene sets validation, showing the robustness of the feature selection method based on Pearson correlation (Supplementary Table S2). To investigate the biological processes of the involved signature genes, GO enrichment analysis was performed. We saw that the most functionally enriched processes related to our 150-gene panel by GO analysis were biological processes (Figure 4 and Table 4). Among those, GO:0048568 Embryonic organ development, GO:0061458 Reproductive system development, GO:0007389 Pattern specification process, GO:0043062 Extracellular structure organization, GO:0002009 Morphogenesis of an epithelium, and GO:0048732 Gland development were related to tissue or organ morphogenesis. Our signature genes were involved in these biological processes and might be useful for classifying distinct cancer types. Hence, the enrichment analysis in the present study might provide a basis to improve our understanding of lung, gastroesophageal, colorectal, liver, breast, thyroid, cervical, brain, pancreatic, ovarian, endometrial, bladder, kidney, head and neck, and prostate cancers.
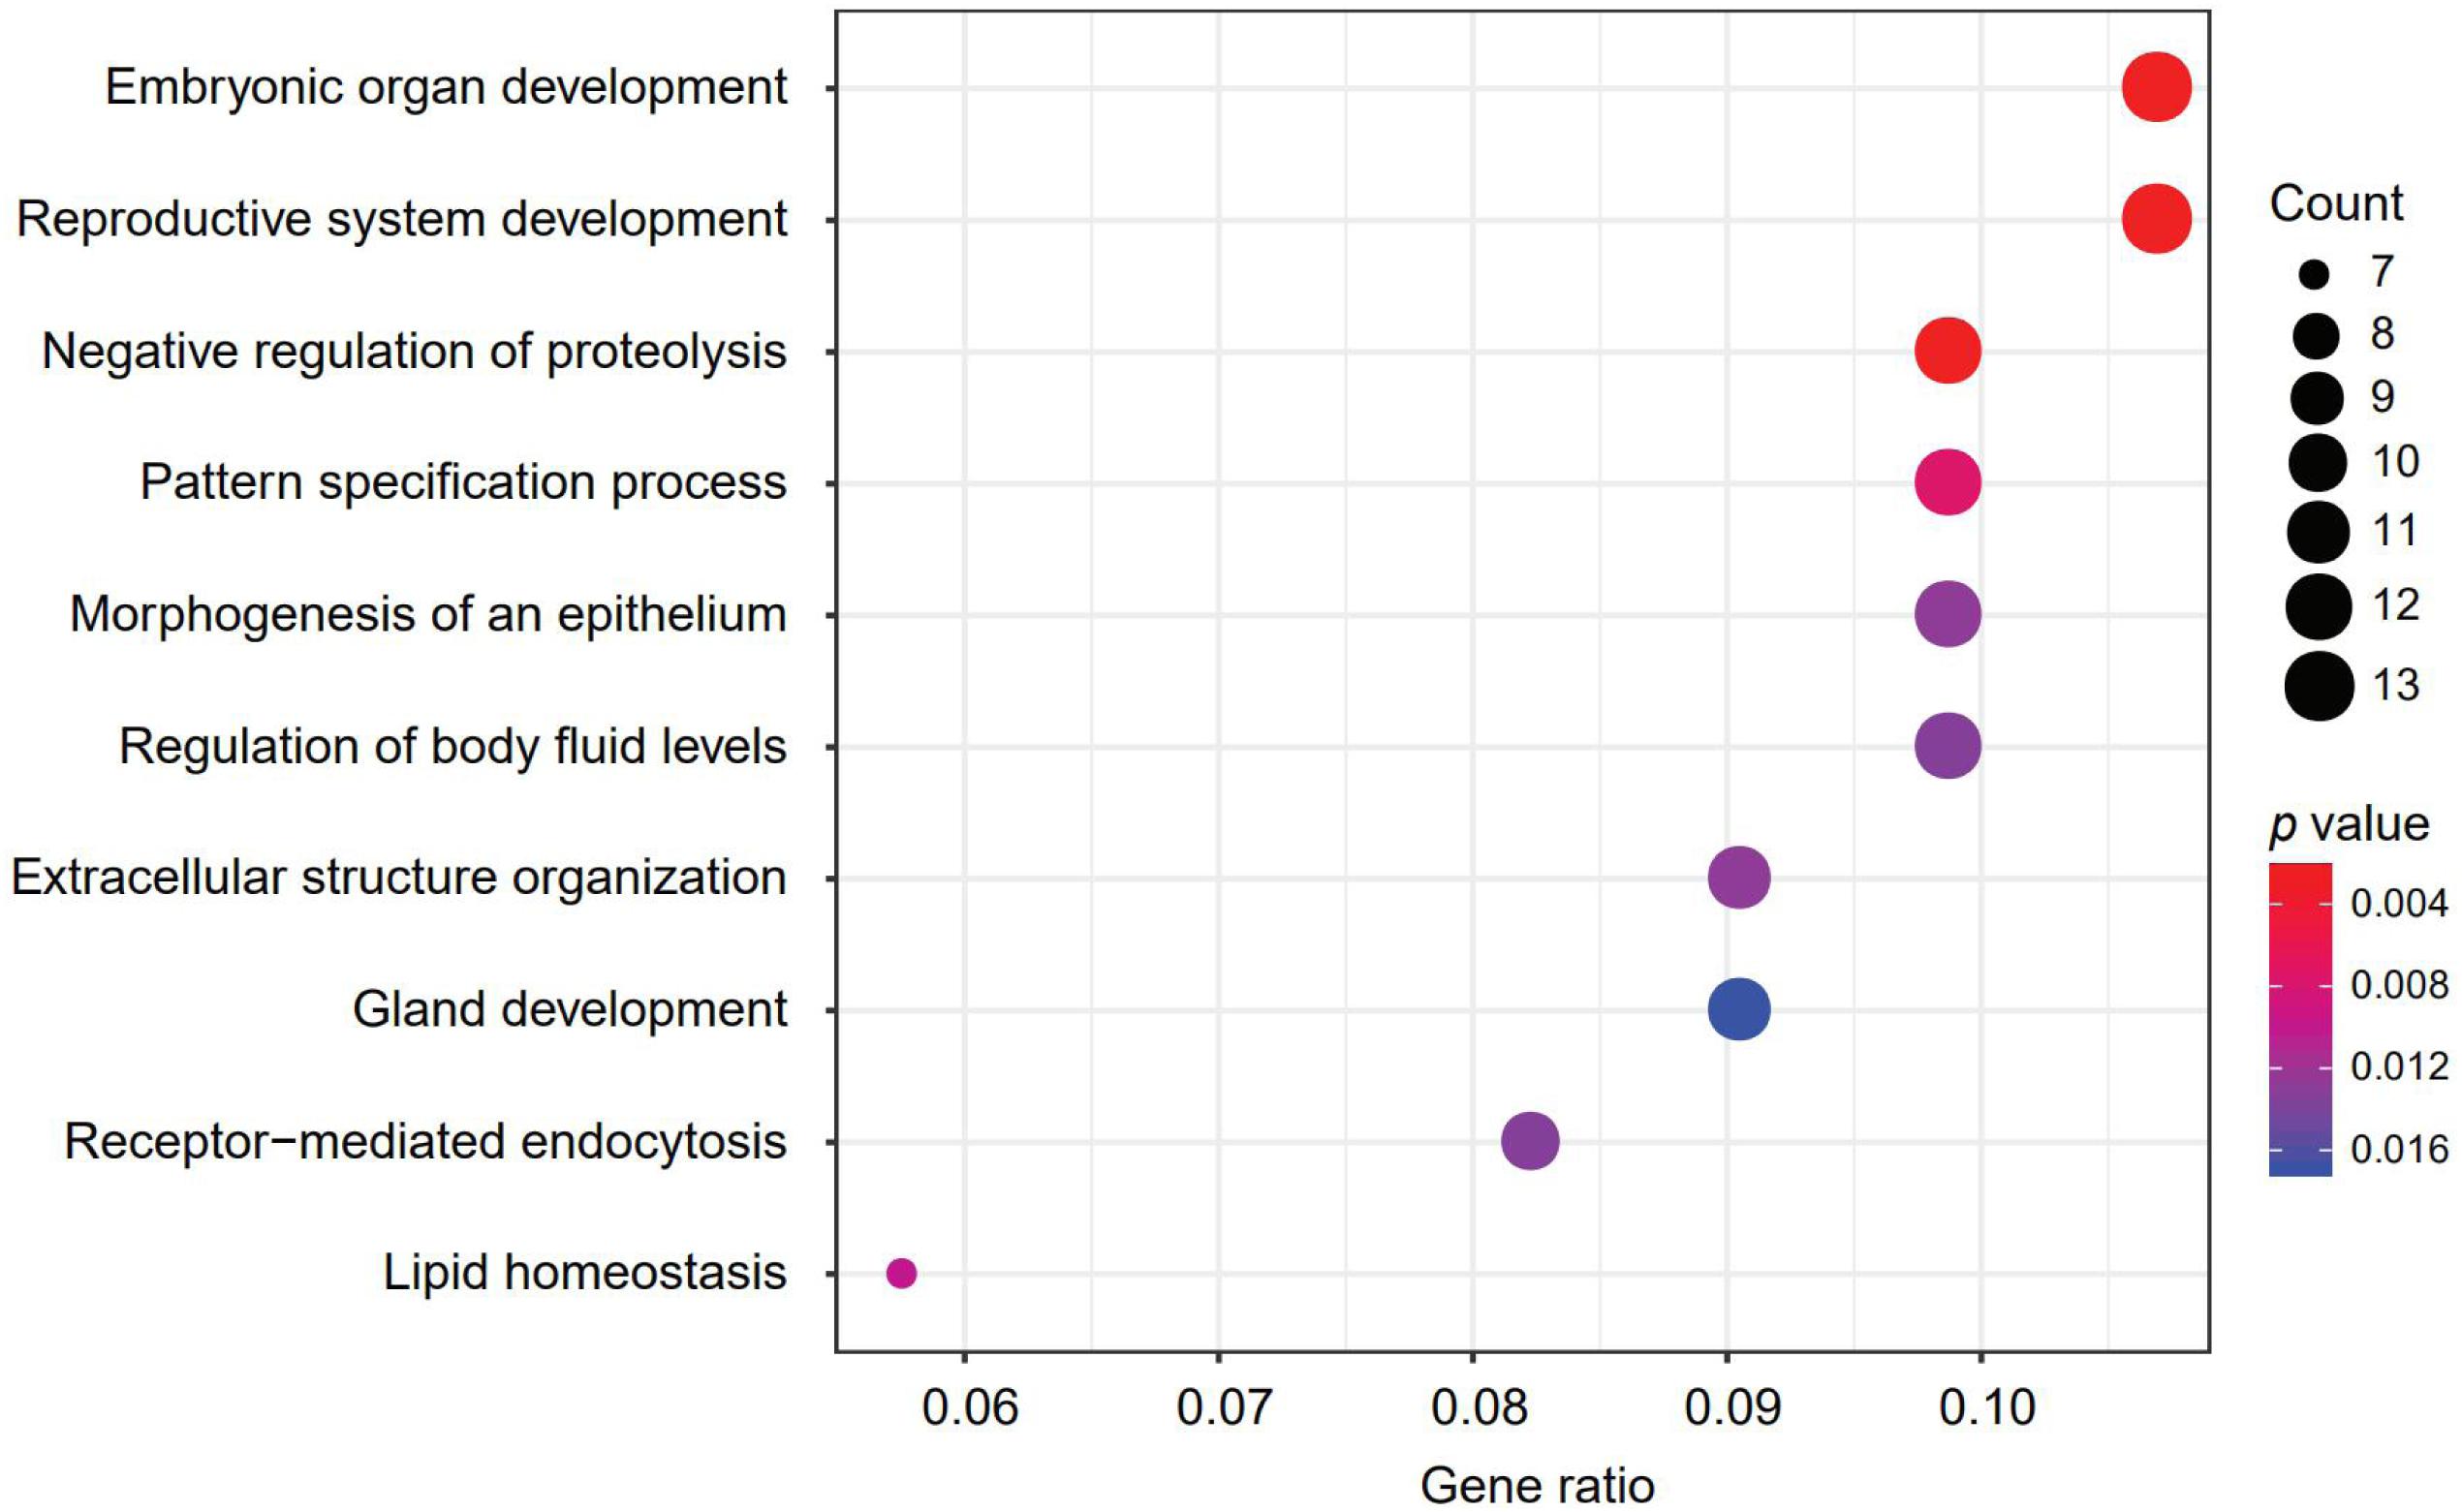
Figure 4. The most represented biological processes associated with our signature genes. Dot plot displaying the number of signature genes involved in each biological process, determined by enrichment analysis. Dot size represents the number of genes, and dot color represents p-value; a lower p-value represents a higher probability of a biological process being enriched with the signature genes.

Table 4. The overrepresented biological processes associated with identified gene-signatures, as obtained through GO enrichment analysis.
The Trained Neural Network Showed High Accuracy on Independent Metastatic Tumor Dataset
We further sought to validate our model on the 20-sample metastatic dataset as a test set. We trained the NN model and the logistic regression model on the whole training dataset using the 150-gene set, which was then used for predicting the test set. The prediction accuracy of NNs was 80%, while the prediction accuracy of the logistic regression model was 70%. The detailed predictions are shown in Table 5.
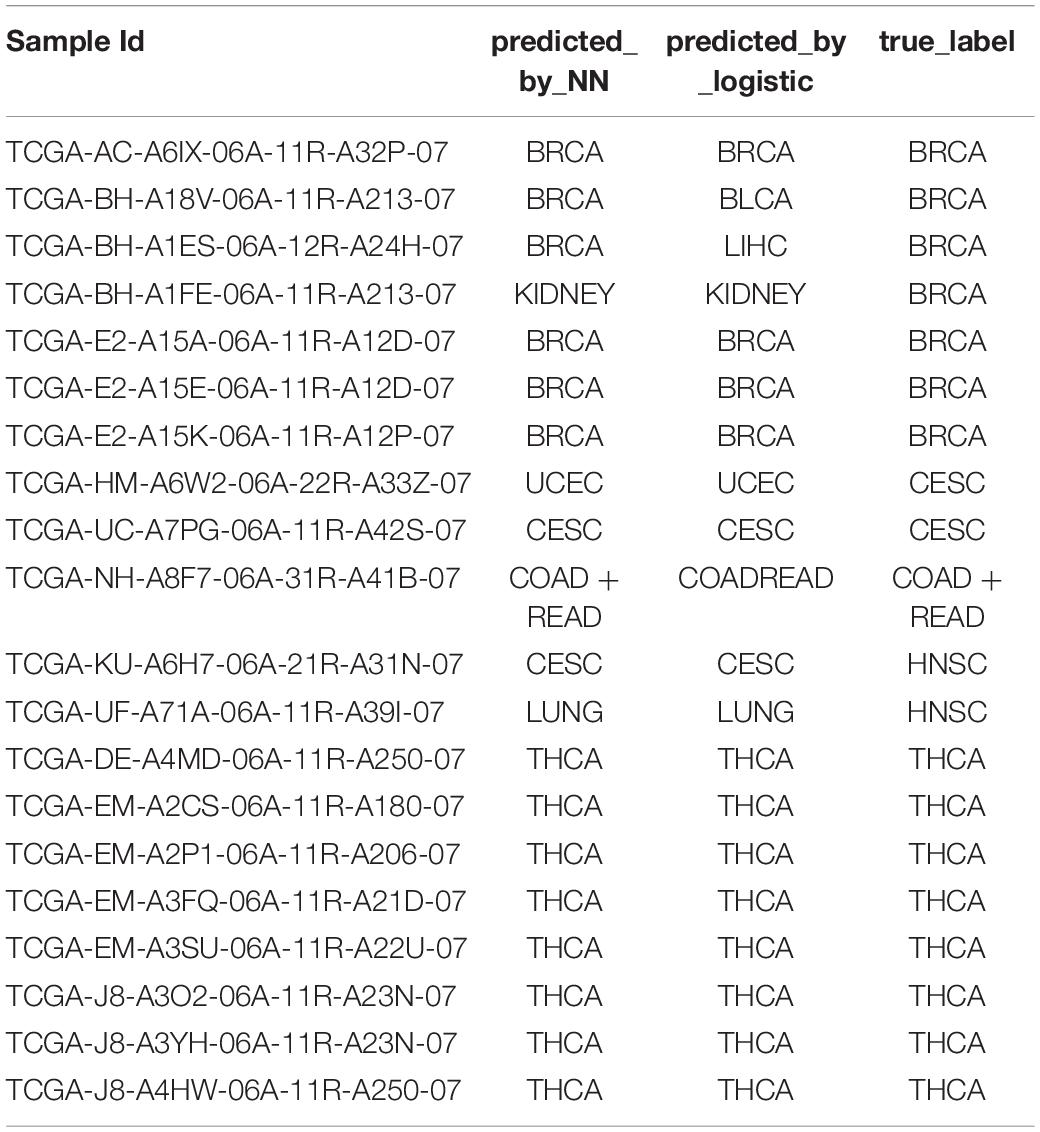
Table 5. The performance on metastatic samples of the neural network trained on the primary samples.
Discussion
Inferring cancer TOO is important for CUP patients and might serve well for minimizing misdiagnosis, even if the cancer origin is diagnosed by pathological observation. Hence, it is critical to develop a method to classify TOO of common cancer types. This study was possible because of the great advancements in NGS technologies and the general application of NGS in clinical experiments, along with the efforts made by researchers who have contributed to the TCGA, from where huge gene expression datasets can be obtained. In the present study, we utilized the NN method to comprehensively analyze high-dimensional RNA-Seq datasets of 15 common cancer types. The 150-gene panel of cancer classifiers demonstrated an average accuracy of 94.87%, corresponding to the actual numbers of cancer samples.
Several hallmarked studies indicated that the cellular origin signatures that are expressed in primary tissue are sufficiently retained even after primary cancer cells undergo dedifferentiation and colonization in different tissue types (Ma et al., 2005; Tothill et al., 2005). A recent study compared four different algorithms and indicated that the modeling performance differed between these algorithms when analyzing RNA-Seq data from 4,127 primary tumor tissue samples related to nine cancer types (Bhowmick et al., 2019). Among those, ABC yielded the best results; it had an average precision of 91.16% and an average sensitivity of 96.5% for nine cancer types (Bhowmick et al., 2019). However, our study demonstrated an average precision of 94.07% and an average sensitivity of 93.36%, corresponding to 7,460 cancer samples related to 15 common cancer types. Although the average sensitivity from our study was a bit lower than that of ABC algorithm, we managed to dramatically minimize the false-positive rate to 0.34% (Table 2). Moreover, the overall accuracy with an average of 94.87% is higher than that of other gene expression-based signatures, which ranged from 79–91% (Ma et al., 2005; Monzon et al., 2009; Kerr et al., 2012). Furthermore, the performance of the 150-gene panel was higher than that of the immunohistochemistry technique (75%), which represents the current clinical practice standard, as tested by a 10-antibody panel (Park et al., 2007).
In the present study, GO analysis revealed several over-represented biological processes related to tissue morphogenesis, such as embryonic organ development, reproductive system development, pattern specification process/regionalization, extracellular structure organization, epithelial morphogenesis, and glandular development (Figure 4 and Table 4). Additionally, the expression patterns of several signature genes of the 150-gene panel were previously reported to be related to tissues of specific tumor types. For example, GRHL3 (Grainyhead-Like Transcription Factor 3) encodes a cancer suppressor that is a member of the grainyhead-like transcription factor family (Darido et al., 2011). The downregulated GRHL3 gene was associated with head and neck squamous cell carcinomas (Frisch et al., 2018); overexpression of the oncogenic mir21 was as result of decreased GRHL3 (Bhandari et al., 2013). In addition, KLKs (Kallikrein-Related Peptidases) are genes that encode serine proteases that exhibit a deregulated expression in prostate cancer. In our study, KLK2, KLK3, and KLK4 were identified as gene signatures for prostate cancer; KLK3 is a prostate-specific antigen that is a gold-standard clinical biomarker widely employed in the diagnosis and monitoring of prostate cancer (Fuhrman-Luck et al., 2014); KLK2 showed promise as prostate cancer biomarker, as well. Additionally, the deregulated expression of KLKs has been utilized in designing novel therapeutic targets for prostate cancer (Fuhrman-Luck et al., 2014).
GATA DNA-binding proteins, commonly abbreviated as GATAs, are zinc-finger binding transcription factors that regulate tissue differentiation and specification (Chou et al., 2010; Zheng and Blobel, 2010). In our study, GATA3 and GATA6 transcripts were identified as gene signatures for breast cancer and gastroesophageal cancer, respectively. Previous studies have indicated that GATA3 was weakly expressed in a wide variety of normal tissues, while its expression was remarkably elevated in breast cancer (Yang and Nonaka, 2010; Liu et al., 2012); moreover, GATA3 has been identified as a novel clinical marker for detecting primary and metastatic breast cancer (Cimino-Mathews et al., 2013; Krings et al., 2014; Shield et al., 2014; Braxton et al., 2015; Sangoi et al., 2016; Yang et al., 2017). GATA6 was initially cloned from rat gastric tissue, designated as GATA-GT1 (Tamura et al., 1994); however, recent studies have indicated that GATA6 was frequently overexpressed and/or amplified in human gastroesophageal cancer (Sulahian et al., 2014; Chia et al., 2015; Song et al., 2018). There’s some limitations about our studies. First, we assessed the model based on NGS RNA-Seq data from the formalin-fixed and paraffin-embedded materials, but not fresh materials. We did not evaluate it in fresh materials mainly due to the formalin-fixed and paraffin-embedded materials are most diagnostic materials in routine practice. Second, some solid tumor cancer types such as sarcoma was not included due to the unavailability of RNAseq data; besides, the non-solid tumors were currently excluded; melanoma was also excluded due to the data scarcity and the distinct distribution of its primary tumor sample number and metastatic tumor sample number. Thus, further efforts should be made for a broader application scope. Third, the training dataset could be further expanded. Since the final gene set contains some organ development-related genes, we can infer that the gene set does not only classify cancer types, but also organs. Staub et al. has already made efforts by expand the training dataset and achieved a better result (Staub et al., 2009). Thus, expression profiles from normal tissues could be further added to our training dataset for a better performance. Another limitation is that our method is based on the expression value without any manipulations. Recently, an algorithm called TSP was applied to this problem, which will generate gene pairs instead of single gene features, giving rise to a leap to the prediction accuracy (Shen et al., 2020). We believe that combining the neural network and the feature generation could further improve the performance for CUP problems.
Conclusion
In the present study, our 150-gene panel exhibited promising results as a tumor classifier for inferring the origin of tumor tissue. First, we obtained NGS-based RNA-Seq data for 7,460 tumor samples from TCGA. Second, we built a fine pipeline to identify gene signatures based on their transcript-levels for 15 common cancer types. Third, we utilized the Neural Network to evaluate the performance of the genes; on average, the precision was 94.07%, while the sensitivity was 93.36%. In addition, GO enrichment analysis revealed several biological processes, including tissue morphogenesis; notably, most of the gene signatures were involved in key oncogenic pathways, supporting our 150-gene panel. Therefore, the 150-gene biomarker signature in our study might prove to be clinically useful for identifying cancers of unknown origin and confirming initial clinical diagnoses. In future studies, we will focus on the application of this model in metastatic cancer patients, in addition to patients with cancer of unknown origin, to evaluate their therapy outcome.
Data Availability Statement
Publicly available datasets were analyzed in this study. This data can be found here: https://dcc.icgc.org/releases/release_26.
Author Contributions
GT, JY, and HL conceived the concept of the work. BH, BW, YL, and JL performed the experiments. YZ wrote the manuscript. ZZ, HL, PB, LY, and DS reviewed the manuscript. All authors approved the final version of this manuscript.
Funding
This study was partially funded by Hunan Provincial Innovation Platform and Talents Program (No. 2018RS3105), the Natural Science Foundation of China (Nos. 61803151, 81560405, and 81960449), the Natural Science Foundation of Hunan province (Nos. 2018JJ2461, 2018JJ2463, and 2018JJ3570), the Project of Scientific Research Fund of Hunan Provincial Education Department (Nos. 19A060 and 19C0185), and the Talents Science and Technology Program of Changsha (No. kq1907035).
Conflict of Interest
YZ, BW, YL, JL, HL, JY, and GT were employed by the company Geneis (Beijing) Co., Ltd.
The remaining authors declare that the research was conducted in the absence of any commercial or financial relationships that could be construed as a potential conflict of interest.
Supplementary Material
The Supplementary Material for this article can be found online at: https://www.frontiersin.org/articles/10.3389/fbioe.2020.00737/full#supplementary-material
TABLE S1 | The result of 10 times of 10-fold cross validations using 10 genes for each cancer.
TABLE S2 | The gene sets from the cross validation phase and the occurrence in the final gene set.
Footnotes
References
Asgari, E., and Mofrad, M. R. (2015). Continuous distributed representation of biological sequences for deep proteomics and genomics. PLoS One 10:e0141287. doi: 10.1371/journal.pone.0141287
Ashburner, M., Ball, C. A., Blake, J. A., Botstein, D., Butler, H., Cherry, J. M., et al. (2000). Gene ontology: tool for the unification of biology. The gene ontology consortium. Nat. Genet. 25, 25–29.
Bhandari, A., Gordon, W., Dizon, D., Hopkin, A. S., Gordon, E., Yu, Z., et al. (2013). The grainyhead transcription factor Grhl3/Get1 suppresses miR-21 expression and tumorigenesis in skin: modulation of the miR-21 target MSH2 by RNA-binding protein DND1. Oncogene 32, 1497–1507. doi: 10.1038/onc.2012.168
Bhowmick, S. S., Bhattacharjee, D., and Rato, L. (2019). Identification of tissue-specific tumor biomarker using different optimization algorithms. Genes Genomics 41, 431–443. doi: 10.1007/s13258-018-0773-2
Braxton, D. R., Cohen, C., and Siddiqui, M. T. (2015). Utility of GATA3 immunohistochemistry for diagnosis of metastatic breast carcinoma in cytology specimens. Diagn. Cytopathol. 43, 271–277. doi: 10.1002/dc.23206
Chia, N. Y., Deng, N., Das, K., Huang, D., Hu, L., Zhu, Y., et al. (2015). Regulatory crosstalk between lineage-survival oncogenes KLF5. GATA4 and GATA6 cooperatively promotes gastric cancer development. Gut 64, 707–719. doi: 10.1136/gutjnl-2013-306596
Chopra, P., Lee, J., Kang, J., and Lee, S. (2010). Improving cancer classification accuracy using gene pairs. PLoS One 5:e14305. doi: 10.1371/journal.pone.0014305
Chou, J., Provot, S., and Werb, Z. (2010). GATA3 in development and cancer differentiation: cells GATA have it! J. Cell. Physiol. 222, 42–49. doi: 10.1002/jcp.21943
Cimino-Mathews, A., Subhawong, A. P., Illei, P. B., Sharma, R., Halushka, M. K., Vang, R., et al. (2013). GATA3 expression in breast carcinoma: utility in triple-negative, sarcomatoid, and metastatic carcinomas. Hum. Pathol. 44, 1341–1349. doi: 10.1016/j.humpath.2012.11.003
Darido, C., Georgy, S. R., Wilanowski, T., Dworkin, S., Auden, A., Zhao, Q., et al. (2011). Targeting of the tumor suppressor GRHL3 by a miR-21-dependent proto-oncogenic network results in PTEN loss and tumorigenesis. Cancer Cell 20, 635–648. doi: 10.1016/j.ccr.2011.10.014
Frisch, A., Walter, T. C., Grieser, C., Geisel, D., Hamm, B., and Denecke, T. (2018). Performance survey on a new standardized formula for oral signal suppression in MRCP. Eur. J. Radiol. Open 5, 1–5. doi: 10.1016/j.ejro.2017.12.002
Fuhrman-Luck, R. A., Loessner, D., and Clements, J. A. (2014). Kallikrein-related peptidases in prostate cancer: from molecular function to clinical application. Ejifcc 25, 269–281.
Greco, F. A., Oien, K., Erlander, M., Osborne, R., Varadhachary, G., Bridgewater, J., et al. (2012). Cancer of unknown primary: progress in the search for improved and rapid diagnosis leading toward superior patient outcomes. Ann. Oncol. 23, 298–304. doi: 10.1093/annonc/mdr306
Hall, M. A. (1998). Correlation-based Feature Subset Selection for Machine Learning. Waikato: The University of Waikato.
Handorf, C. R., Kulkarni, A., Grenert, J. P., Weiss, L. M., Rogers, W. M., Kim, O. S., et al. (2013). A multicenter study directly comparing the diagnostic accuracy of gene expression profiling and immunohistochemistry for primary site identification in metastatic tumors. Am. J. Surg. Pathol. 37, 1067–1075. doi: 10.1097/pas.0b013e31828309c4
Hinton, G. E. (1989). Connectionist learning procedures. Artif. Intell. 40, 185–234. doi: 10.1016/0004-3702(89)90049-0
Hua, K. L., Hsu, C. H., Hidayati, S. C., Cheng, W. H., and Chen, Y. J. (2015). Computer-aided classification of lung nodules on computed tomography images via deep learning technique. OncoTargets Ther. 8, 2015–2022.
Hudis, C. A. (2007). Trastuzumab–mechanism of action and use in clinical practice. N. Engl. J. Med. 357, 39–51. doi: 10.1056/nejmra043186
Hyphantis, T., Papadimitriou, I., Petrakis, D., Fountzilas, G., Repana, D., Assimakopoulos, K., et al. (2013). Psychiatric manifestations, personality traits and health-related quality of life in cancer of unknown primary site. Psycho Oncol. 22, 2009–2015. doi: 10.1002/pon.3244
Kamposioras, K., Pentheroudakis, G., and Pavlidis, N. (2013). Exploring the biology of cancer of unknown primary: breakthroughs and drawbacks. Eur. J. Clin. Invest. 43, 491–500. doi: 10.1111/eci.12062
Kerr, S. E., Schnabel, C. A., Sullivan, P. S., Zhang, Y., Singh, V., Carey, B., et al. (2012). Multisite validation study to determine performance characteristics of a 92-gene molecular cancer classifier. Clin. Cancer Res. 18, 3952–3960. doi: 10.1158/1078-0432.ccr-12-0920
Krings, G., Nystrom, M., Mehdi, I., Vohra, P., and Chen, Y. Y. (2014). Diagnostic utility and sensitivities of GATA3 antibodies in triple-negative breast cancer. Hum. Pathol. 45, 2225–2232. doi: 10.1016/j.humpath.2014.06.022
Kurahashi, I., Fujita, Y., Arao, T., Kurata, T., Koh, Y., Sakai, K., et al. (2013). A microarray-based gene expression analysis to identify diagnostic biomarkers for unknown primary cancer. PLoS One 8:e63249. doi: 10.1371/journal.pone.0063249
Lapointe, J., Li, C., Higgins, J. P., van de Rijn, M., Bair, E., Montgomery, K., et al. (2004). Gene expression profiling identifies clinically relevant subtypes of prostate cancer. Proc. Natl. Acad. Sci. U.S.A. 101, 811–816. doi: 10.1073/pnas.0304146101
Lazaridis, G., Pentheroudakis, G., Fountzilas, G., and Pavlidis, N. (2008). Liver metastases from cancer of unknown primary (CUPL): a retrospective analysis of presentation, management and prognosis in 49 patients and systematic review of the literature. Cancer Treat. Rev. 34, 693–700. doi: 10.1016/j.ctrv.2008.05.005
Liu, H., Shi, J., Wilkerson, M. L., and Lin, F. (2012). Immunohistochemical evaluation of GATA3 expression in tumors and normal tissues: a useful immunomarker for breast and urothelial carcinomas. Am. J. Clin. Pathol. 138, 57–64. doi: 10.1309/ajcp5uafmsa9zqbz
Liu, J., Ranka, S., and Kahveci, T. (2008). Classification and feature selection algorithms for multi-class CGH data. Bioinformatics 24, i86–i95. doi: 10.1093/bioinformatics/btn145
Ma, X. J., Patel, R., Wang, X., Salunga, R., Murage, J., Desai, R., et al. (2005). Molecular classification of human cancers using a 92-gene real-time quantitative polymerase chain reaction assay. Arch. Pathol. Lab Med. 130, 465–473.
MacReady, N. (2010). NICE issues guidance on cancer of unknown primary. Lancet Oncol. 11:824. doi: 10.1016/s1470-2045(10)70215-1
Meiri, E., Mueller, W. C., Rosenwald, S., Zepeniuk, M., Klinke, E., Edmonston, T. B., et al. (2012). A second-generation microRNA-based assay for diagnosing tumor tissue origin. Oncol. 17, 801–812. doi: 10.1634/theoncologist.2011-0466
Molina, R., Bosch, X., Auge, J. M., Filella, X., Escudero, J. M., Molina, V., et al. (2012). Utility of serum tumor markers as an aid in the differential diagnosis of patients with clinical suspicion of cancer and in patients with cancer of unknown primary site. Tumour Biol. 33, 463–474. doi: 10.1007/s13277-011-0275-1
Montezuma, D., Azevedo, R., Lopes, P., Vieira, R., Cunha, A. L., and Henrique, R. (2013). A panel of four immunohistochemical markers (CK7, CK20, TTF-1, and p63) allows accurate diagnosis of primary and metastatic lung carcinoma on biopsy specimens. Virchows Archiv. 463, 749–754. doi: 10.1007/s00428-013-1488-z
Monzon, F. A., Lyons-Weiler, M., Buturovic, L. J., Rigl, C. T., Henner, W. D., Sciulli, C., et al. (2009). Multicenter validation of a 1,550-gene expression profile for identification of tumor tissue of origin. J. Clin. Oncol. 27, 2503–2508. doi: 10.1200/jco.2008.17.9762
Mramor, M., Leban, G., Demsar, J., and Zupan, B. (2007). Visualization-based cancer microarray data classification analysis. Bioinformatics 23, 2147–2154. doi: 10.1093/bioinformatics/btm312
Oien, K. A., and Dennis, J. L. (2012). Diagnostic work-up of carcinoma of unknown primary: from immunohistochemistry to molecular profiling. Ann. Oncol. 23, (Suppl. 10), x271–x277. doi: 10.1093/annonc/mds357
Park, S. Y., Kim, B. H., Kim, J. H., Lee, S., and Kang, G. H. (2007). Panels of immunohistochemical markers help determine primary sites of metastatic adenocarcinoma. Arch. Pathol. Lab. Med. 131, 1561–1567.
Pavlidis, N., and Fizazi, K. (2005). Cancer of unknown primary (CUP). Crit. Rev. Oncol. Hematol. 54, 243–250.
Pedregosa, F., Varoquaux, G., Gramfort, A., Michel, V., Thirion, B., Grisel, O., et al. (2011). Scikit-learn: machine learning in python. J. Mach. Learn Res. 12, 2825–2830.
Plis, S. M., Hjelm, D. R., Salakhutdinov, R., Allen, E. A., Bockholt, H. J., Long, J. D., et al. (2014). Deep learning for neuroimaging: a validation study. Front. Neurosci. 8:229. doi: 10.3389/fnins.2014.00229
Richardson, A., Wagland, R., Foster, R., Symons, J., Davis, C., Boyland, L., et al. (2015). Uncertainty and anxiety in the cancer of unknown primary patient journey: a multiperspective qualitative study. BMJ Support. Palliat. Care 5, 366–372. doi: 10.1136/bmjspcare-2013-000482
Saeys, Y., Inza, I., and Larranaga, P. (2007). A review of feature selection techniques in bioinformatics. Bioinformatics 23, 2507–2517. doi: 10.1093/bioinformatics/btm344
Sangoi, A. R., Shrestha, B., Yang, G., Mego, O., and Beck, A. H. (2016). The novel marker GATA3 is significantly more sensitive than traditional markers mammaglobin and GCDFP15 for identifying breast cancer in surgical and cytology specimens of metastatic and matched primary tumors. Appl. Immunohistochem. Mol. Morphol. 24, 229–237. doi: 10.1097/pai.0000000000000186
Shen, Y., Chu, Q., Yin, X., He, Y., Bai, P., Wang, Y., et al. (2020). TOD-CUP: a gene expression rank-based majority vote algorithm for tissue origin diagnosis of cancers of unknown primary. Brief. Bioinform. 8:bbaa031.
Shield, P. W., Papadimos, D. J., and Walsh, M. D. (2014). GATA3: a promising marker for metastatic breast carcinoma in serous effusion specimens. Cancer Cytopathol. 122, 307–312. doi: 10.1002/cncy.21393
Song, S. H., Jeon, M. S., Nam, J. W., Kang, J. K., Lee, Y. J., Kang, J. Y., et al. (2018). Aberrant GATA2 epigenetic dysregulation induces a GATA2/GATA6 switch in human gastric cancer. Oncogene 37, 993–1004. doi: 10.1038/onc.2017.397
Staub, E., Buhr, H. J., and Grone, J. (2009). WITHDRAWN: predicting the site of origin of tumors by a gene expression signature derived from normal tissues. Oncogene 29:3732. doi: 10.1038/onc.2010.184
Suk, H. I., and Shen, D. (2013). “Deep learning-based feature representation for AD/MCI classification,” in Medical Image Computing and Computer-Assisted Intervention – MICCAI 2013. MICCAI 2013. Lecture Notes in Computer Science, Vol. 8150, eds K. Mori, I. Sakuma, Y. Sato, C. Barillot, and N. Navab (Berlin: Springer).
Sulahian, R., Casey, F., Shen, J., Qian, Z. R., Shin, H., Ogino, S., et al. (2014). An integrative analysis reveals functional targets of GATA6 transcriptional regulation in gastric cancer. Oncogene 33, 5637–5648. doi: 10.1038/onc.2013.517
Tamura, S., Wang, X. H., Maeda, M., and Futai, M. (1994). Gastric DNA-binding proteins recognize upstream sequence motifs of parietal cell-specific genes. Proc. Natl. Acad. Sci. U.S.A. 91:4609. doi: 10.1073/pnas.91.10.4609
Tomuleasa, C., Zaharie, F., Muresan, M. S., Pop, L., Fekete, Z., Dima, D., et al. (2017). How to diagnose and treat a cancer of unknown primary site. J. Gastrointestin. Liver Dis. 26, 69–79.
Tothill, R. W., Kowalczyk, A., Rischin, D., Bousioutas, A., Haviv, I., van Laar, R. K., et al. (2005). An expression-based site of origin diagnostic method designed for clinical application to cancer of unknown origin. Cancer Res. 65, 4031–4040. doi: 10.1158/0008-5472.can-04-3617
Tothill, R. W., Li, J., Mileshkin, L., Doig, K., Siganakis, T., Cowin, P., et al. (2013). Massively-parallel sequencing assists the diagnosis and guided treatment of cancers of unknown primary. J. Pathol. 231, 413–423. doi: 10.1002/path.4251
Varadhachary, G. R., Raber, M. N., Matamoros, A., and Abbruzzese, J. L. (2008). Carcinoma of unknown primary with a colon-cancer profile-changing paradigm and emerging definitions. Lancet Oncol. 9, 596–599. doi: 10.1016/s1470-2045(08)70151-7
Xu, Q., Chen, J., Ni, S., Tan, C., Xu, M., Dong, L., et al. (2016). Pan-cancer transcriptome analysis reveals a gene expression signature for the identification of tumor tissue origin. Modern Pathol. 29, 546–556. doi: 10.1038/modpathol.2016.60
Yang, M., and Nonaka, D. (2010). A study of immunohistochemical differential expression in pulmonary and mammary carcinomas. Modern Pathol. 23, 654–661. doi: 10.1038/modpathol.2010.38
Yang, Y., Lu, S., Zeng, W., Xie, S., and Xiao, S. (2017). GATA3 expression in clinically useful groups of breast carcinoma: a comparison with GCDFP15 and mammaglobin for identifying paired primary and metastatic tumors. Ann. Diagn. Pathol. 26, 1–5. doi: 10.1016/j.anndiagpath.2016.09.011
Yu, G., Wang, L. G., Han, Y., and He, Q. Y. (2012). clusterprofiler: an R package for comparing biological themes among gene clusters. Omics 16, 284–287. doi: 10.1089/omi.2011.0118
Keywords: cancer of unknown primary, tissue-of-origin, neural network, RNA sequencing, the Pearson correlation
Citation: He B, Zhang Y, Zhou Z, Wang B, Liang Y, Lang J, Lin H, Bing P, Yu L, Sun D, Luo H, Yang J and Tian G (2020) A Neural Network Framework for Predicting the Tissue-of-Origin of 15 Common Cancer Types Based on RNA-Seq Data. Front. Bioeng. Biotechnol. 8:737. doi: 10.3389/fbioe.2020.00737
Received: 05 March 2020; Accepted: 10 June 2020;
Published: 05 August 2020.
Edited by:
Lu Zhang, Hong Kong Baptist University, Hong KongCopyright © 2020 He, Zhang, Zhou, Wang, Liang, Lang, Lin, Bing, Yu, Sun, Luo, Yang and Tian. This is an open-access article distributed under the terms of the Creative Commons Attribution License (CC BY). The use, distribution or reproduction in other forums is permitted, provided the original author(s) and the copyright owner(s) are credited and that the original publication in this journal is cited, in accordance with accepted academic practice. No use, distribution or reproduction is permitted which does not comply with these terms.
*Correspondence: Binsheng He, aGJzY3NtdUAxNjMuY29t; Huaiqing Luo, bHVvaHVhaXFpbmdAY3N1LmVkdS5jbg==; bGluaHgyQGdlbmVpcy5jbg==; Jialiang Yang, eWFuZ2psQGdlbmVpcy5jbg==; Geng Tian, dGlhbmdAZ2VuZWlzLmNu
†These authors have contributed equally to this work
 Binsheng He
 Yanxiang Zhang
 Zhen Zhou3†
 Bo Wang
 Yuebin Liang
 Jidong Lang
 Huixin Lin
 Jialiang Yang
 Geng Tian