
94% of researchers rate our articles as excellent or good
Learn more about the work of our research integrity team to safeguard the quality of each article we publish.
Find out more
ORIGINAL RESEARCH article
Front. Bioeng. Biotechnol. , 19 February 2020
Sec. Computational Genomics
Volume 8 - 2020 | https://doi.org/10.3389/fbioe.2020.00101
This article is part of the Research Topic Computational Epigenetics in Human Diseases, Cell Differentiation, and Cell Reprogramming, Volume I View all 42 articles
 Runzhi Huang1,2†
 Tong Meng1,2†
 Rui Zhu1,2
 Lijuan Zhao1,2
 Dianwen Song3
 Huabin Yin3
 Zongqiang Huang4*
 Liming Cheng1,2*
 Jie Zhang1,2,5*
Background: Spinal cord injury (SCI) is one of the most devastating diseases with a high incidence rate around the world. SCI-related neuropathic pain (NeP) is a common complication, whereas its pathomechanism is still unclear. The purpose of this study is to identify key genes and cellular components for SCI-related NeP by an integrated transcriptome bioinformatics analysis.
Methods: The gene expression profile of 25 peripheral blood samples from chronic phase SCI patients (E-GEOD-69901) and 337 normal peripheral blood samples were downloaded from ArrayExpress and Genotype-Tissue Expression Portal (GTEx), respectively. A total of 3,368 normal peripheral blood mononuclear cells (PBMC) were download from Sequence Read Archive (SRA713577). Non-parametric tests were used to evaluate the association between all of differential expression genes (DEGs) and SCI-related NeP. CellPhoneDB algorithm was performed to identify the ligand–receptor interactions and their cellular localization among single PBMCs. Transcription factor (TF) enrichment analysis and Gene Set Variation Analysis (GSVA) were used to identify the potential upstream regulatory TFs and downstream signaling pathways, respectively. Co-expression analysis among significantly enriched TFs, key cellular communication genes and differentially expressed signaling pathways were performed to identify key genes and cellular components for SCI-related NeP.
Results: A total of 2,314 genes were identified as DEGs between the experimental and the control group. Five proteins (ADRB2, LGALS9, PECAM1, HAVCR2, LRP1) were identified in the overlap of proteins in the significant ligand-receptor interactions of PBMCs and protein-protein interaction (PPI) network based on the DEGs. Only HAVCR2 was significantly associated with NeP (P = 0.005). Besides, the co-expression analysis revealed that TF YY1 had significantly co-expression pattern with cellular communication receptor HAVCR2 (R = −0.54, P < 0.001) in NK cells while HAVCR2 was also co-expressed with mTOR signaling pathway (R = 0.57, P < 0.001). The results of RT-qPCR and external dataset validation supported the signaling axis with the most significant co-expression patterns.
Conclusion: In peripheral blood of chronic SCI, HAVCR2 might act as a key receptor on the surface of NK cells and interact with ligand LGALS9 secreted by CD14+ monocytes, inhibiting NK cells through mTOR signaling pathway and ultimately predicting the occurrence of SCI-related NeP. This hypothetical signaling axis may provide prognostic biomarkers and therapeutic targets for SCI-related NeP.
Spinal cord injury (SCI) refers to the damage to the spinal cord due to trauma, disease or degeneration (Cheshire et al., 1996; Brienza et al., 2018). According to the National Spinal Cord Injury Statistical Center, there are about 12,000 new cases of SCI each year in the United States (Natinal Spinal Cord Injury Statistical Center [NSCISC], 2014). The global SCI incidence is 40 to 80 new cases per million population per year (New et al., 2014). It not only induces locomotor deficits or even complete paralysis physically, but also generates despairing psychological stress (Budh and Osteraker, 2007). Therapeutically, there are no effective treatment strategies for SCI-induced neurological deficits, leading to a high disability rate and adding heavy burdens to the individual family and the whole society. In order to bring tangible benefits to patients with SCI, there is a pressing need to explore the pathologic mechanisms which may provide candidate targets for treatment (Azarhomayoun et al., 2018; Musubire et al., 2019).
Generally, SCI is categorized into three phases: the acute phase (0–15 days), the sub-acute phase (3–5 months) and the chronic phase (6–12 months) (Pouw et al., 2011). Although the functional status of the chronic phase may be considered clinically similar, regardless of the level of injury, new types of pathologies at both micro and macro level occurs involving a variety of aberrant molecules and cellular components, especially immune cells (Metz et al., 2000; Chen et al., 2013; Van Niekerk et al., 2016). The most common pathological features during the chronic phase are the formation of the glial scar resulting from persistent glial activation and neuronal hyperactivity associated with reactive astrocytes, microglias, and infiltrating macrophages (Takeura et al., 2019). In addition, all of these pathological features are related to neuropathic pain (NeP). Thus, we suppose that identifying the mechanism of NeP and predicting its occurrence.
Neuropathic pain is reported to occur in 40–50% of SCI patients and typically develops within the first year following SCI as the chronic presentation (Siddall et al., 2003; Werhagen et al., 2004). Currently, its treatment is difficult and the efficacy of the recommended treatment options are modest (Finnerup et al., 2015). Although the pathological mechanism of NeP is still unclear, it may be associated with the dynamic process of nerve regeneration and immune response (Yune et al., 2007; Lee et al., 2008; Pinzon et al., 2008; Takeura et al., 2019). In addition, no factor has been identified to predict the occurrence of SCI-related NeP. With regard to human specimens, peripheral blood from patients with SCI is the more accessible and minimally invasive than injured spinal cord in clinical practice.
Thus, an integrated transcriptome bioinformatics analysis based on bulk RNA sequence and single-cell RNA sequence was performed to identify differentially expressed genes and cellular communications, key ligand-receptor interactions and their cellular localization in peripheral blood of patients with SCI. In addition, potential upstream transcription factors (TFs) and downstream signaling pathways of key cellular communication genes were also identified to draw a signaling axis, which might provide candidate predictors and therapeutic targets for SCI and SCI-related NeP.
This study was approved by the Ethics Committee of Tongji Hospital affiliated to Tongji University School of Medicine. The gene expression profile of 25 peripheral blood samples from chronic phase SCI patients (E-GEOD-69901) (Platform: Affy Primeview Gene Expression Array) were downloaded from ArrayExpress1 as the experimental group. Because we wanted to identity DEGs between peripheral blood of normal people and patients with SCI, but E-GEOD-69901 did not have the data of normal people. Therefore, we did not use the control set that was published with the E-GEOD-69901. The control group including 337 normal peripheral blood samples was downloaded from the Genotype-Tissue Expression Portal2 (GTEx) (Consortium, 2015). A total of 3,368 normal peripheral blood mononuclear cells (PBMC) were download from Sequence Read Archive3 (SRA713577) (Freytag et al., 2018). The single cell set was one 10X genomics object of 3,368 cells from the same one person. In order to ensure the repeatability of the experiment, we used the RData file including matrixes of Reads Per Kilobase per Million mapped reads (RPKM) and raw counts from the PanglaoDB (Franzen et al., 2019). Besides, we have carried out an external validation. Two Affy Primeview dataset (GSE82152 and E-MTAB-5151) including normal peripheral blood samples were used as the control group for differential expression analysis. We did not use these published data in the initial study because of the small sample size.
First of all, non-peripheral-blood specific expression genes (no expression was detected in both control group and experimental group) were filtered. The limma package was used to find differential expression genes (DEGs) after normalization between two batches of data (Ritchie et al., 2015). Limma algorithm was originally developed for the analysis of microarray data, and its protocol for RNA-seq analysis also normalized the data using voom algorithm to process it into data similar to microarray for analysis (Ritchie et al., 2015). Thus, we used the GTEx dataset as the control group for a larger sample size. And the data of GTEx were normalized by voom algorithm and the batch effect of data were eliminated by the function named normalizeBetweenArrays. The standard of DEGs was an absolute log2 fold change greater than 2 and false discovery rate (FDR) P-value < 0.05.
To further explore the function of the DEGs above, the functional enrichment analysis was performed using the clusterProfiler including gene ontology (GO) term and the Kyoto Encyclopedia of Genes and Genomes (KEGG) pathway (Yu et al., 2012). String database was used to construct a protein-protein interaction (PPI) network based on the DEGs and the names of all the interacting proteins and the protein-coding genes were extracted from the network (Szklarczyk et al., 2019). Besides, non-parametric tests were used to assess the association between all DEGs and NeP.
Raw reads in the sra file were first separated into pair-ended reads fastq files, which were trimmed to remove polyA tail sequence and the template switch oligo (TSO) sequence. Then, the clean reads were aligned to the hg38 human transcriptome (UCSC) and quantified by the Cell Ranger Single Cell Software Suite 3.3.14.
For all 3,368 normal sequenced single PBMCs, cells with either fewer than 100,000 transcripts or fewer than 1,500 genes were filtered out. Besides, only the genes expressed in at least three single cells and their expression levels greater than 1 were considered for downstream analysis. Additionally, the Seurat method was applied to downstream analysis (Butler et al., 2018).
First, “vst” selection method was used to find variable genes, which were the input features for initial principal component analysis (PCA) (Butler et al., 2018). Then, the jackstraw analysis was performed to select the principal components (PCs) with P-values < 0.05 (Chung and Storey, 2015). Significant PCs were incorporated into further t-distributed Stochastic Neighbor Embedding (t-SNE) to identify different cell clusters with DEGs (resolution = 0.50). The standard of DEGs was an absolute log2 fold change greater than 0.50 and FDR value <0.05. Only the genes with an absolute log fold change greater than 0.5 and FDR P-value < 0.05 were selected as DEGs. The distribution and expression of top 10 DEGs were displayed by feature plots and heat maps, respectively. Additionally, scMatch (Hou et al., 2019), singleR (Aran et al., 2019), and CellMarker (Zhang et al., 2019) database were used as references for defining each cluster.
CellPhoneDB (Vento-Tormo et al., 2018; Efremova et al., 2019), a repository of ligand-receptor complexes and a statistical tool to predict the cell-type specificity of cell-cell communication via these molecular interactions, was performed to identify the ligand-receptor interactions and their cell localization among single PBMCs. The names of all the interacting proteins and the protein-coding genes were extracted from the network. Then, the Venn plot was used to illustrate the intersection of CellPhoneDB results and the PPI network.
Cell type identification by estimating relative subsets of RNA transcripts (CIBERSORT) algorithm was used to characterize the cell composition from the complex tissues according to their gene expression profiles (Newman et al., 2015). Then the fraction of 22 types of immune cell was estimated in peripheral blood based on the normalized gene expression profiles. Samples with a CIBERSORT output of P < 0.05 were considered to be eligible for further analysis. Then, the Wilcoxon rank-sum test was applied to identify the immune cells with the fractions between peripheral blood samples from SCI patients and normal control samples. It should be pointed out that the CIBERSORT algorithm could correct for differences between different platforms and batches of data in the initial version (Newman et al., 2015). Additionally, the next generation CIBERSORT algorithm (CIBERSORTx) (Newman et al., 2019), including enable batch correction and disable quantile normalization algorithm, were applied to confirm the reliability of the results.
The DAVID database UCSC TFBS function module was used for TF enrichment analysis to identify target TFs among the DEGs. Differentially expressed TFs with enrichment analysis FDR < 0.05 were defined as significantly enriched TFs.
Gene Set Variation Analysis (GSVA) pathway analysis was performed to evaluate the expression levels of 185 KEGG pathways. The limma method was also used to find differentially expressed pathways between peripheral blood samples from SCI patients and normal control samples (Ritchie et al., 2015). The FDR P-value < 0.05, the log (fold-change) >0.5 or <−0.5 was defined a downregulated or upregulated pathway, respectively.
Eventually, a co-expression Pearson correlation analysis among significantly enriched TFs, key cellular communication genes and differentially expressed KEGG pathways.
Total RNA was isolated from was extracted from human whole blood of 16 patients with fractures complicated with SCI, 16 patients with fractures but no SCI and 8 normal adults, using QIAamp RNA Blood Mini Kits (Qiagen, catalog number 52304) according to the modified protocol of manufacturers. All cDNA generated from reverse transcription [PrimeScript RT Reagent Kit (Perfect Real Time) (Takara Bio)] was used for quantitative PCR analysis by ABI PRISM 7900 Sequence Detection System (Applied Biosystems, Foster City, CA, United States) and SYBR Premix Ex Taq (Tli RNaseH Plus) PCR Kit (Takara Bio). The relative expression levels of eight key genes (YY1, CEBPB, HAVCR2, LGALS9, MTOR, RPS6, RPS6KB1, RPS6KB2) and reference gene were determined by the 2–ΔΔCt method. Kruskal–Wallis test was used to identity the statistical difference of gene expression among groups.
Additionally, since the platform effect and batch effect could inevitably affect the results of the differential genes, two Affy Primeview dataset (GSE82152 and E-MTAB-5151) including normal peripheral blood samples were used as the control group for differential expression analysis. The limma package was also used to find differential expression genes (DEGs) after normalization between two batches of data (Ritchie et al., 2015). The standard of DEGs was an absolute log fold change greater than 1 and FDR P-value < 0.05.
Two-sided P-value < 0.05 was thought to be statistical significance. All statistical analysis was conducted with R version 3.6.1 software (Institute for Statistics and Mathematics, Vienna, Austria)5 (Package: limma, Seurat, ggplot2, SingleR, reticulate, clusterProfiler, GSEABase, GSVA).
The analysis process of this study was presented in Figure 1. For identifying the significantly DEGs, we set the log (fold-change) >2.0 or <−2.0 and FDR < 0.05 as the cutoff and a total of 2,314 genes were identified as DEGs, including 1,152 upregulated ones and 1,162 downregulated ones (Figure 2A).
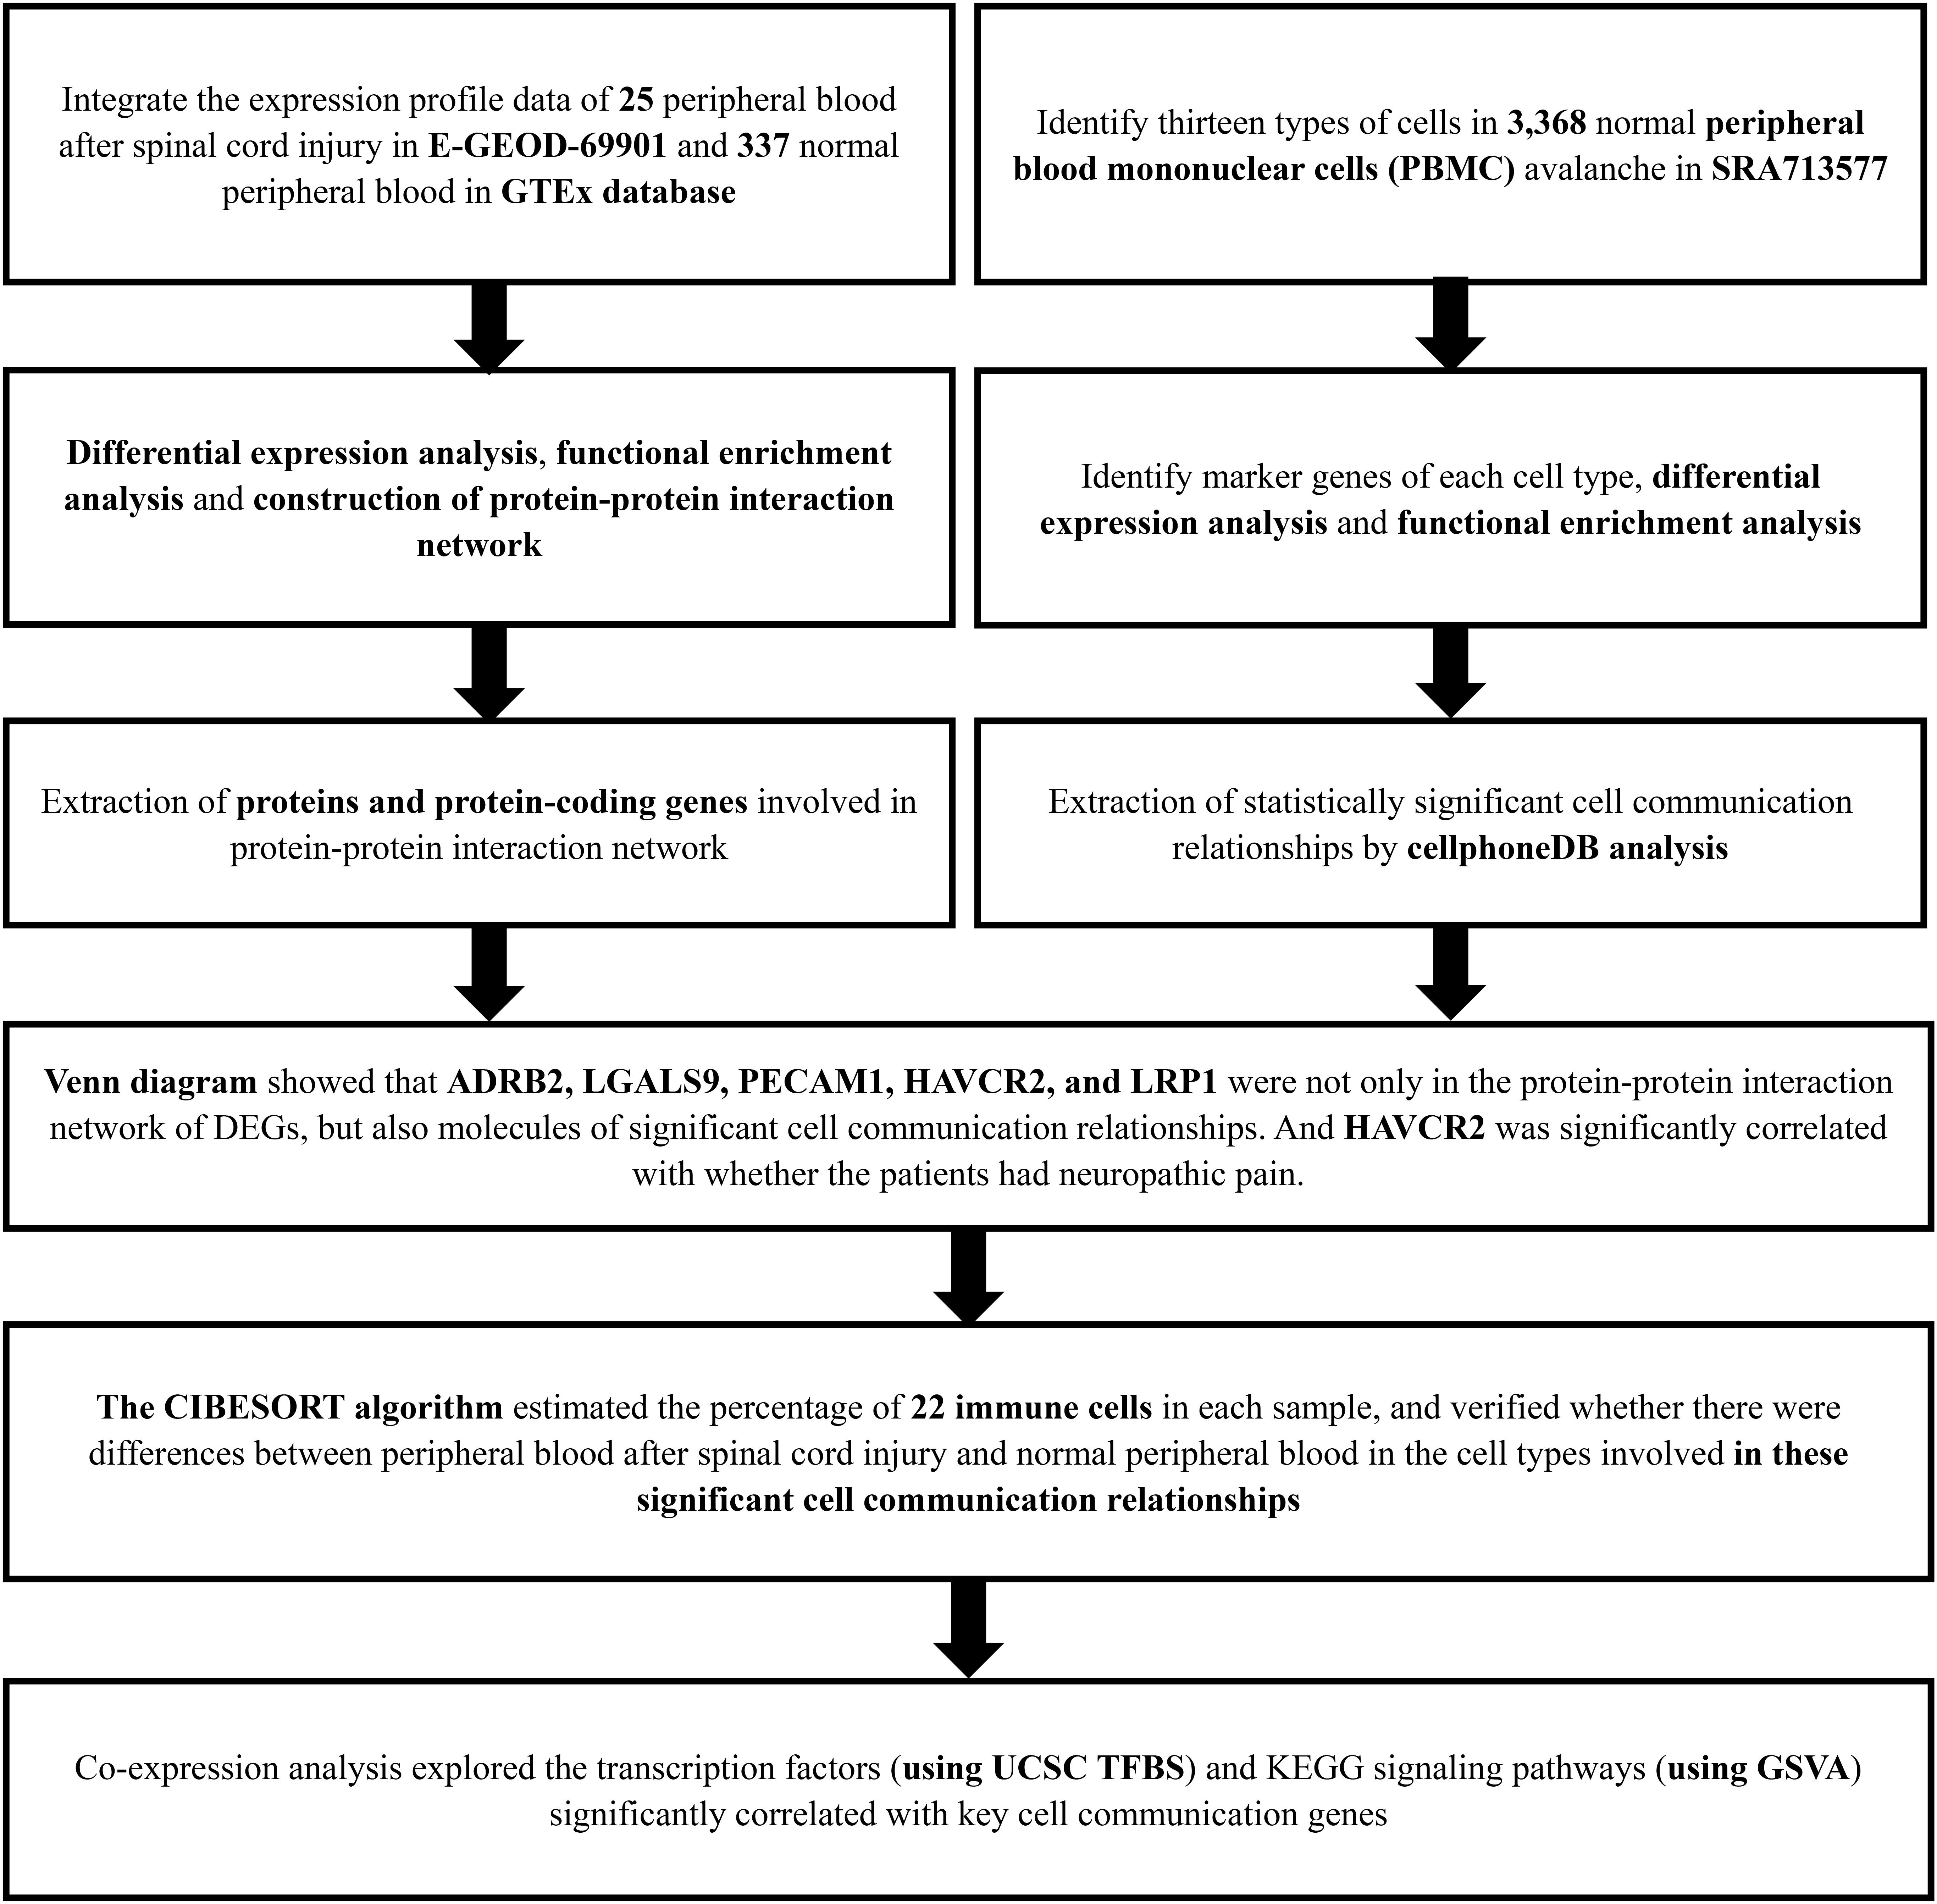
Figure 1. The flow chart of the analysis process. GTEx, Genotype-Tissue Expression; PBMC, peripheral blood mononuclear cell; SRA, Sequence Read Archive; CIBERSORT, Cell type identification by estimating relative subsets of RNA transcripts; KEGG, Kyoto Encyclopedia of Genes and Genomes; GSVA, Gene Set Variation Analysis.
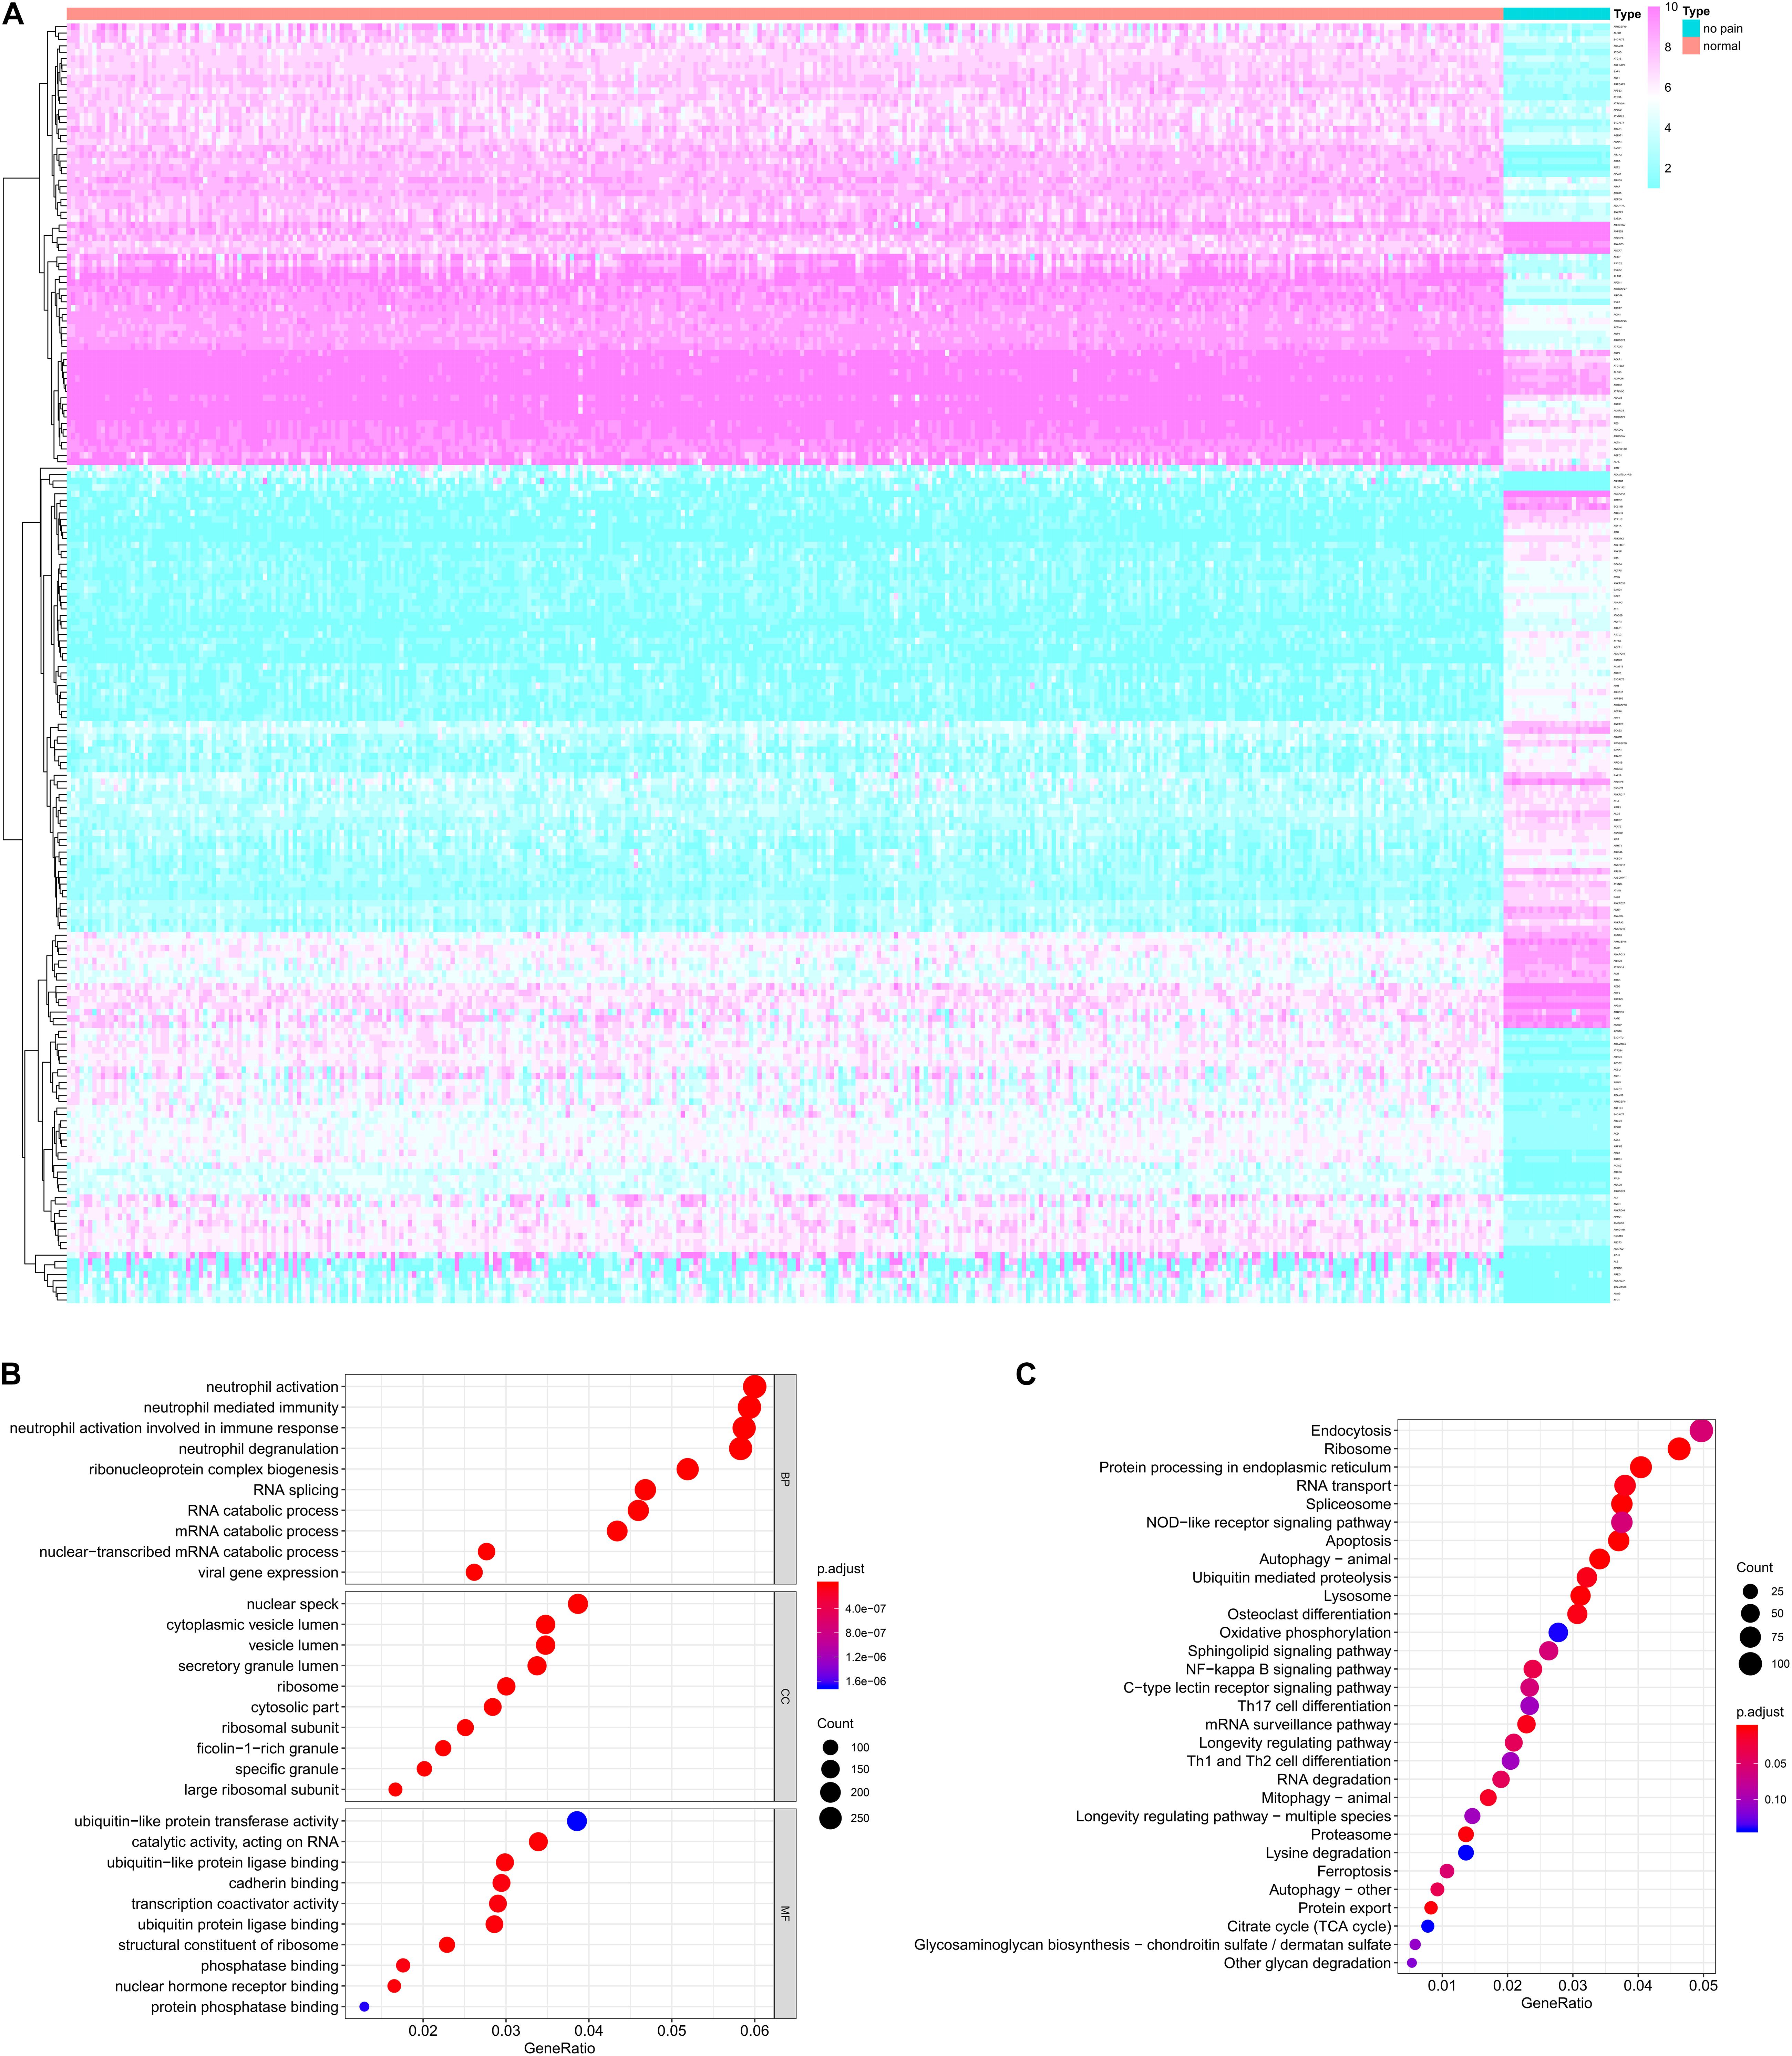
Figure 2. The differentially expressed genes (DEGs) between peripheral blood samples from spinal cord injury (SCI) patients and normal control samples (A) and the functional enrichment analysis for these DEGs in gene ontology (GO) terms (B) and Kyoto Encyclopedia of Genes and Genomes (KEGG) pathways (C). (A) The heatmap of DEGs between peripheral blood samples from SCI patients and normal control samples. (B) The bubble plot of top 10 significant GO terms in biological process (BP), cellular component (CC) and molecular function (MF). (C) The bubble plot of top 20 significant KEGG pathways. DEG, differentially expressed gene; SCI, spinal cord injury; GO, Gene Ontology; KEGG, Kyoto Encyclopedia of Genes and Genomes; BP, biological process; CC, cellular component; MF, molecular function.
The functional enrichment analysis for these DEGs in GO terms and KEGG pathways were shown in Figures 2B,C, respectively. The biological process of GO terms analysis revealed the enrichment of some remarkable immune cell related terms. Additionally, “secretory granule lumen” “ubiquitin-like protein transferase activity” and “cadherin binding” were also significantly enriched as cellular component or molecular function, which might mean the active aberrant cellular communication in the peripheral blood of SCI patients (Figure 2B). The KEGG enrichment analysis also suggested some critical pathways were significantly associated with cellular communication, such as “Endocytosis,” “Protein processing in endoplasmic reticulum,” “RNA transport,” and “NF-κB signaling pathway” (Figure 2C).
String database was used to construct a PPI network based on the whole 2,314 DEGs, which included 4,807 PPI relationships related to 799 proteins (Supplementary Figure S1).
A t-SNE analysis was performed and clearly identified 13 clusters and 8 cell types (CD4 + T cells, CD14 + Monocytes, Natural killer (NK) cells, B cells, CD8 + T cells, Megakaryocytes, FCGR3A + Monocytes, Dendritic cells) (Figures 3A,C). The expression levels of the top 10 DEGs in each cluster and cell type were displayed in Figures 3B,D, respectively. The feature plots of each cell type markers reported in the CellMarker database were presented in Figures 3E–M.
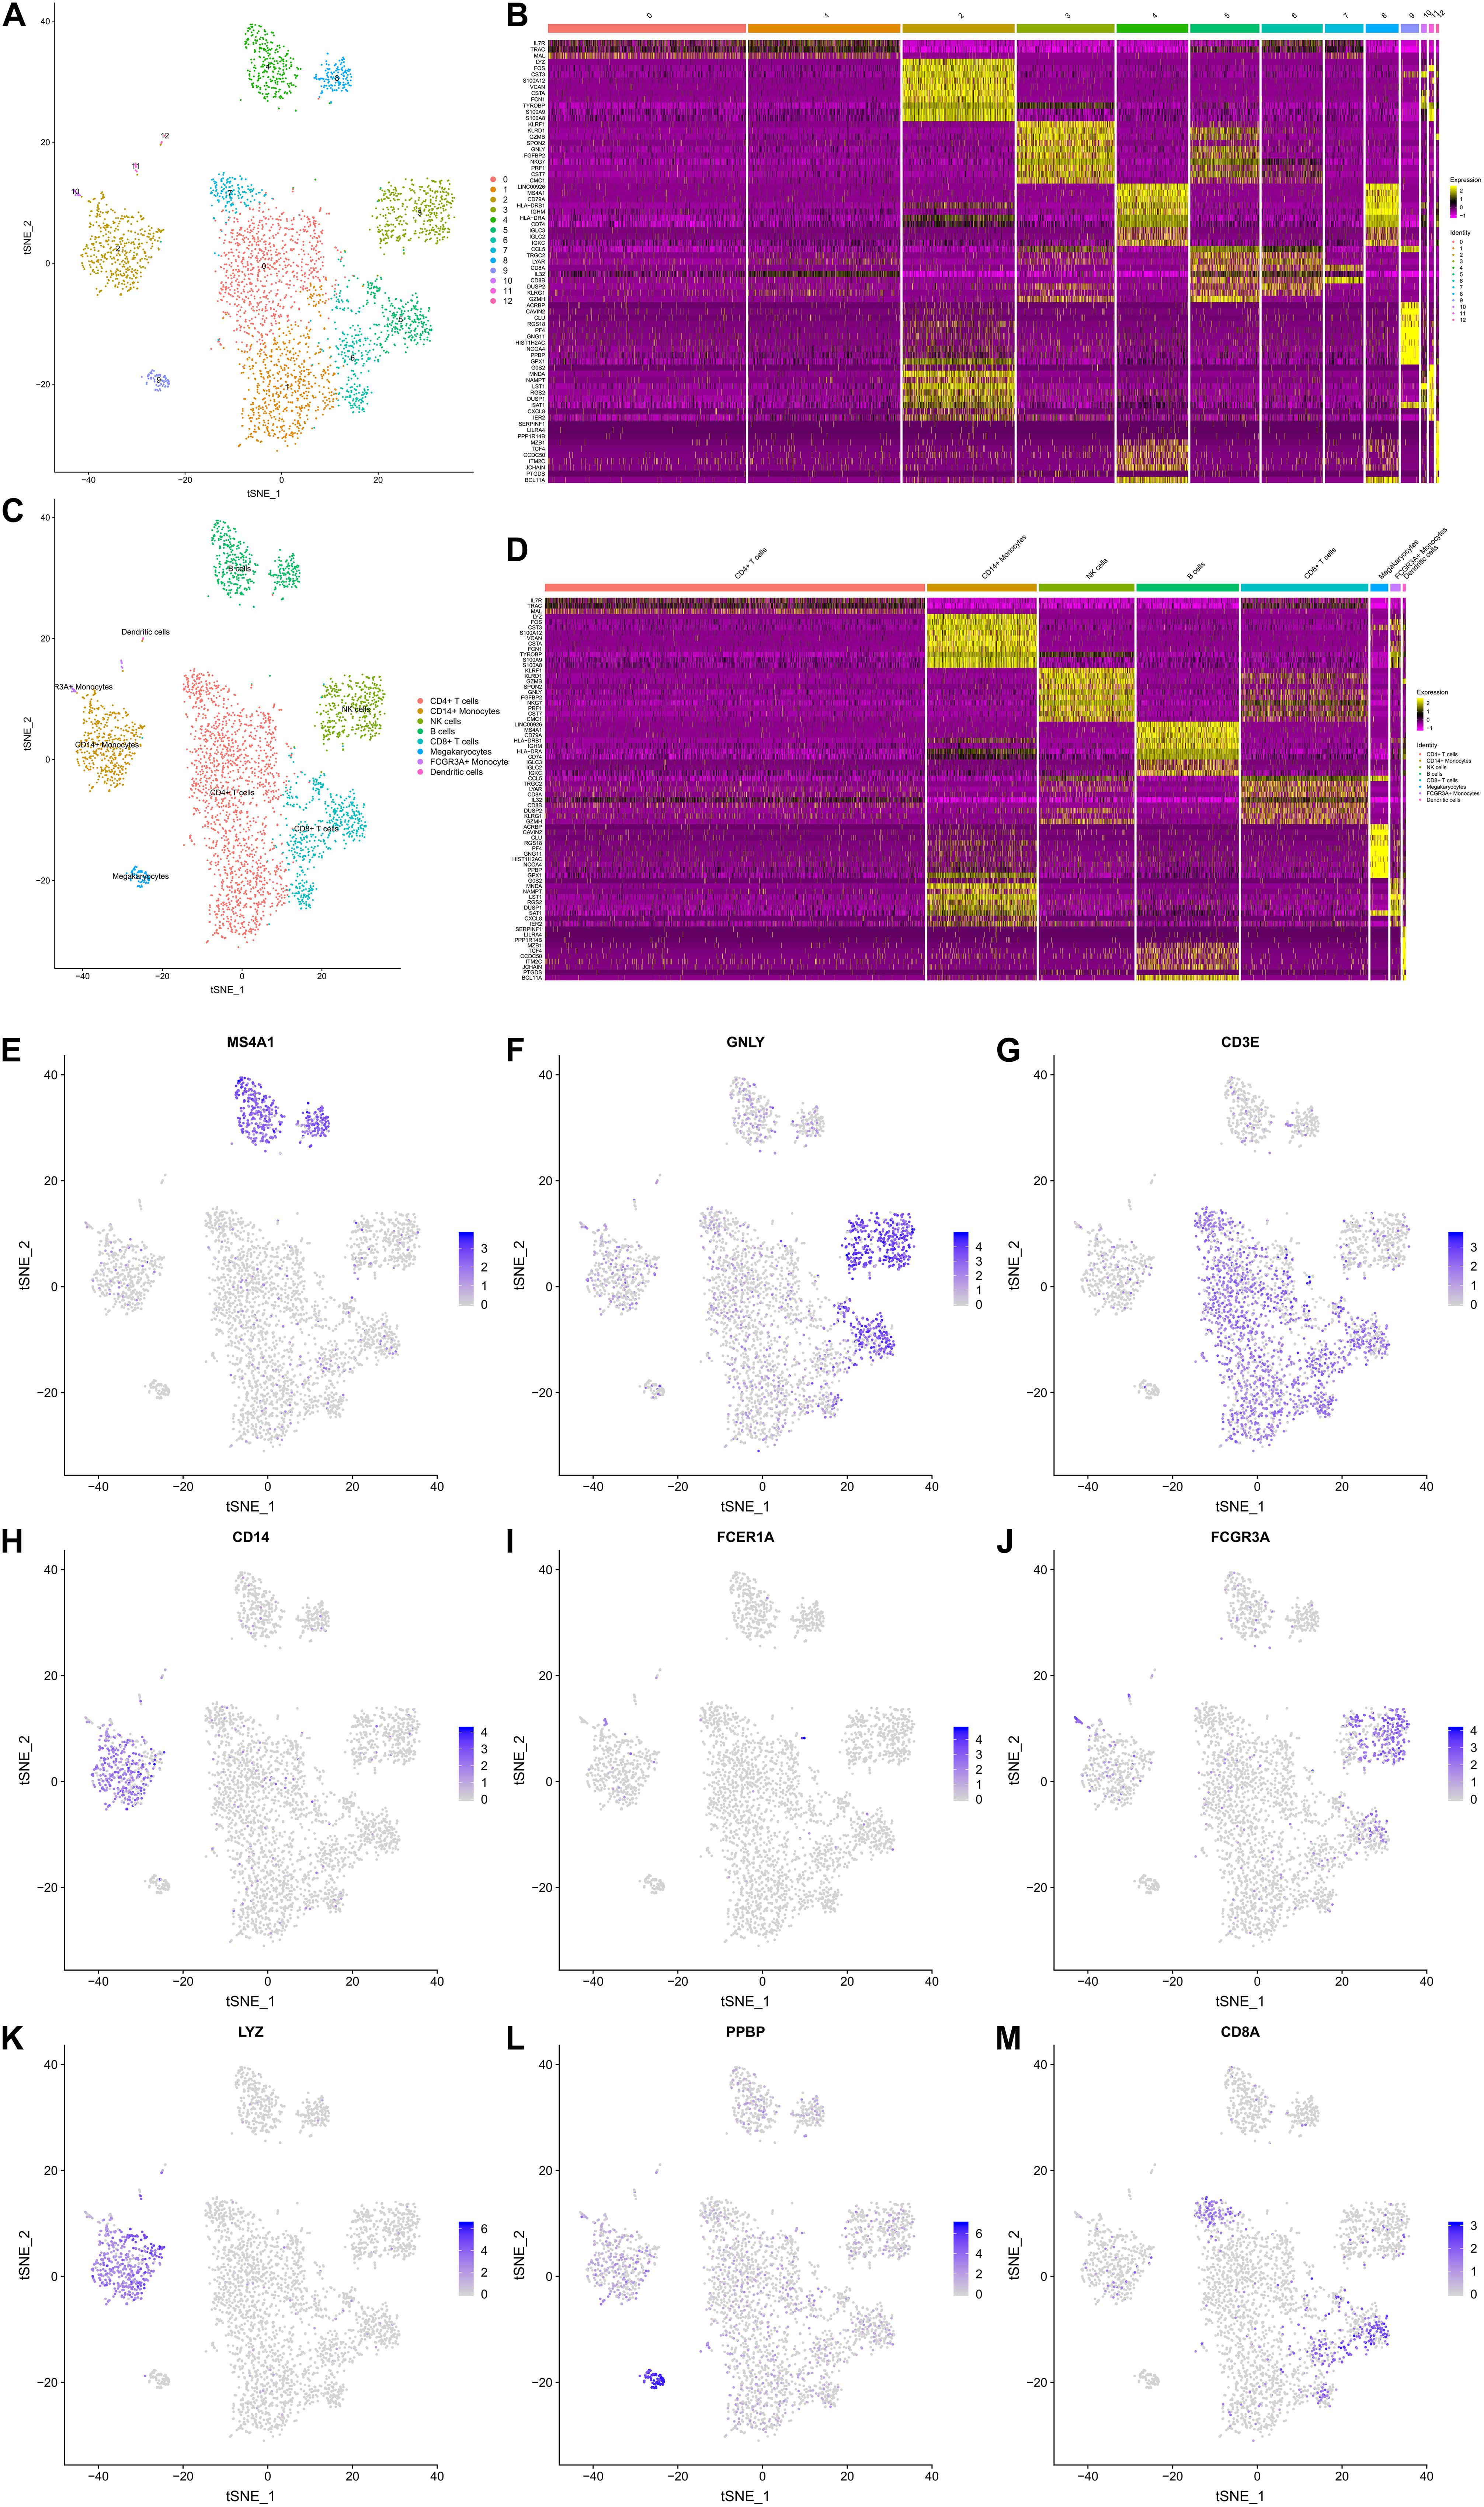
Figure 3. The Gene Expression Landscapes of 3,368 peripheral blood mononuclear cells (PBMCs). A t-distributed stochastic neighbor embedding (t-SNE) analysis was performed, which clearly identified 13 clusters (A) and 8 cell types (CD4+ T cells, CD14+ Monocytes, NK cells, B cells, CD8+ T cells, Megakaryocytes, FCGR3A + Monocytes, Dendritic cells) (C). The expression levels the top 10 differentially expressed genes (DEGs) of each cluster (B) and cell type (D) are displayed in the heatmaps. (E–M) illustrate the feature plots of each cell type markers reported in the CellMarker database. PBMC, peripheral blood mononuclear cell; t-SNE, t-distributed stochastic neighbor embedding; DEG, differentially expressed gene.
The CellPhoneDB analysis was performed to identify the ligand-receptor interactions and their cell localization among single PBMCs. A total of 87 significant ligand-receptor interactions (related to 108 proteins) and their cell localization were identified. Furthermore, 5 proteins (ADRB2, LGALS9, PECAM1, HAVCR2, LRP1) were identified in the overlap of proteins in the significant ligand-receptor interactions of PBMCs and PPI network based on the DEGs. Only HAVCR2 (Hepatitis A Virus Cellular Receptor 2) was significantly associated with NeP (P = 0.005) (Figures 4A,B). Besides, a total of 87 ligand-receptor interaction relationships and a new PPI network illustrating the interaction among the five proteins were shown in Figures 4C,D, respectively. Additionally, the results of CellPhoneDB analysis including ADRB2, LGALS9, PECAM1, HAVCR2, and LRP1 were presented in Table 1.
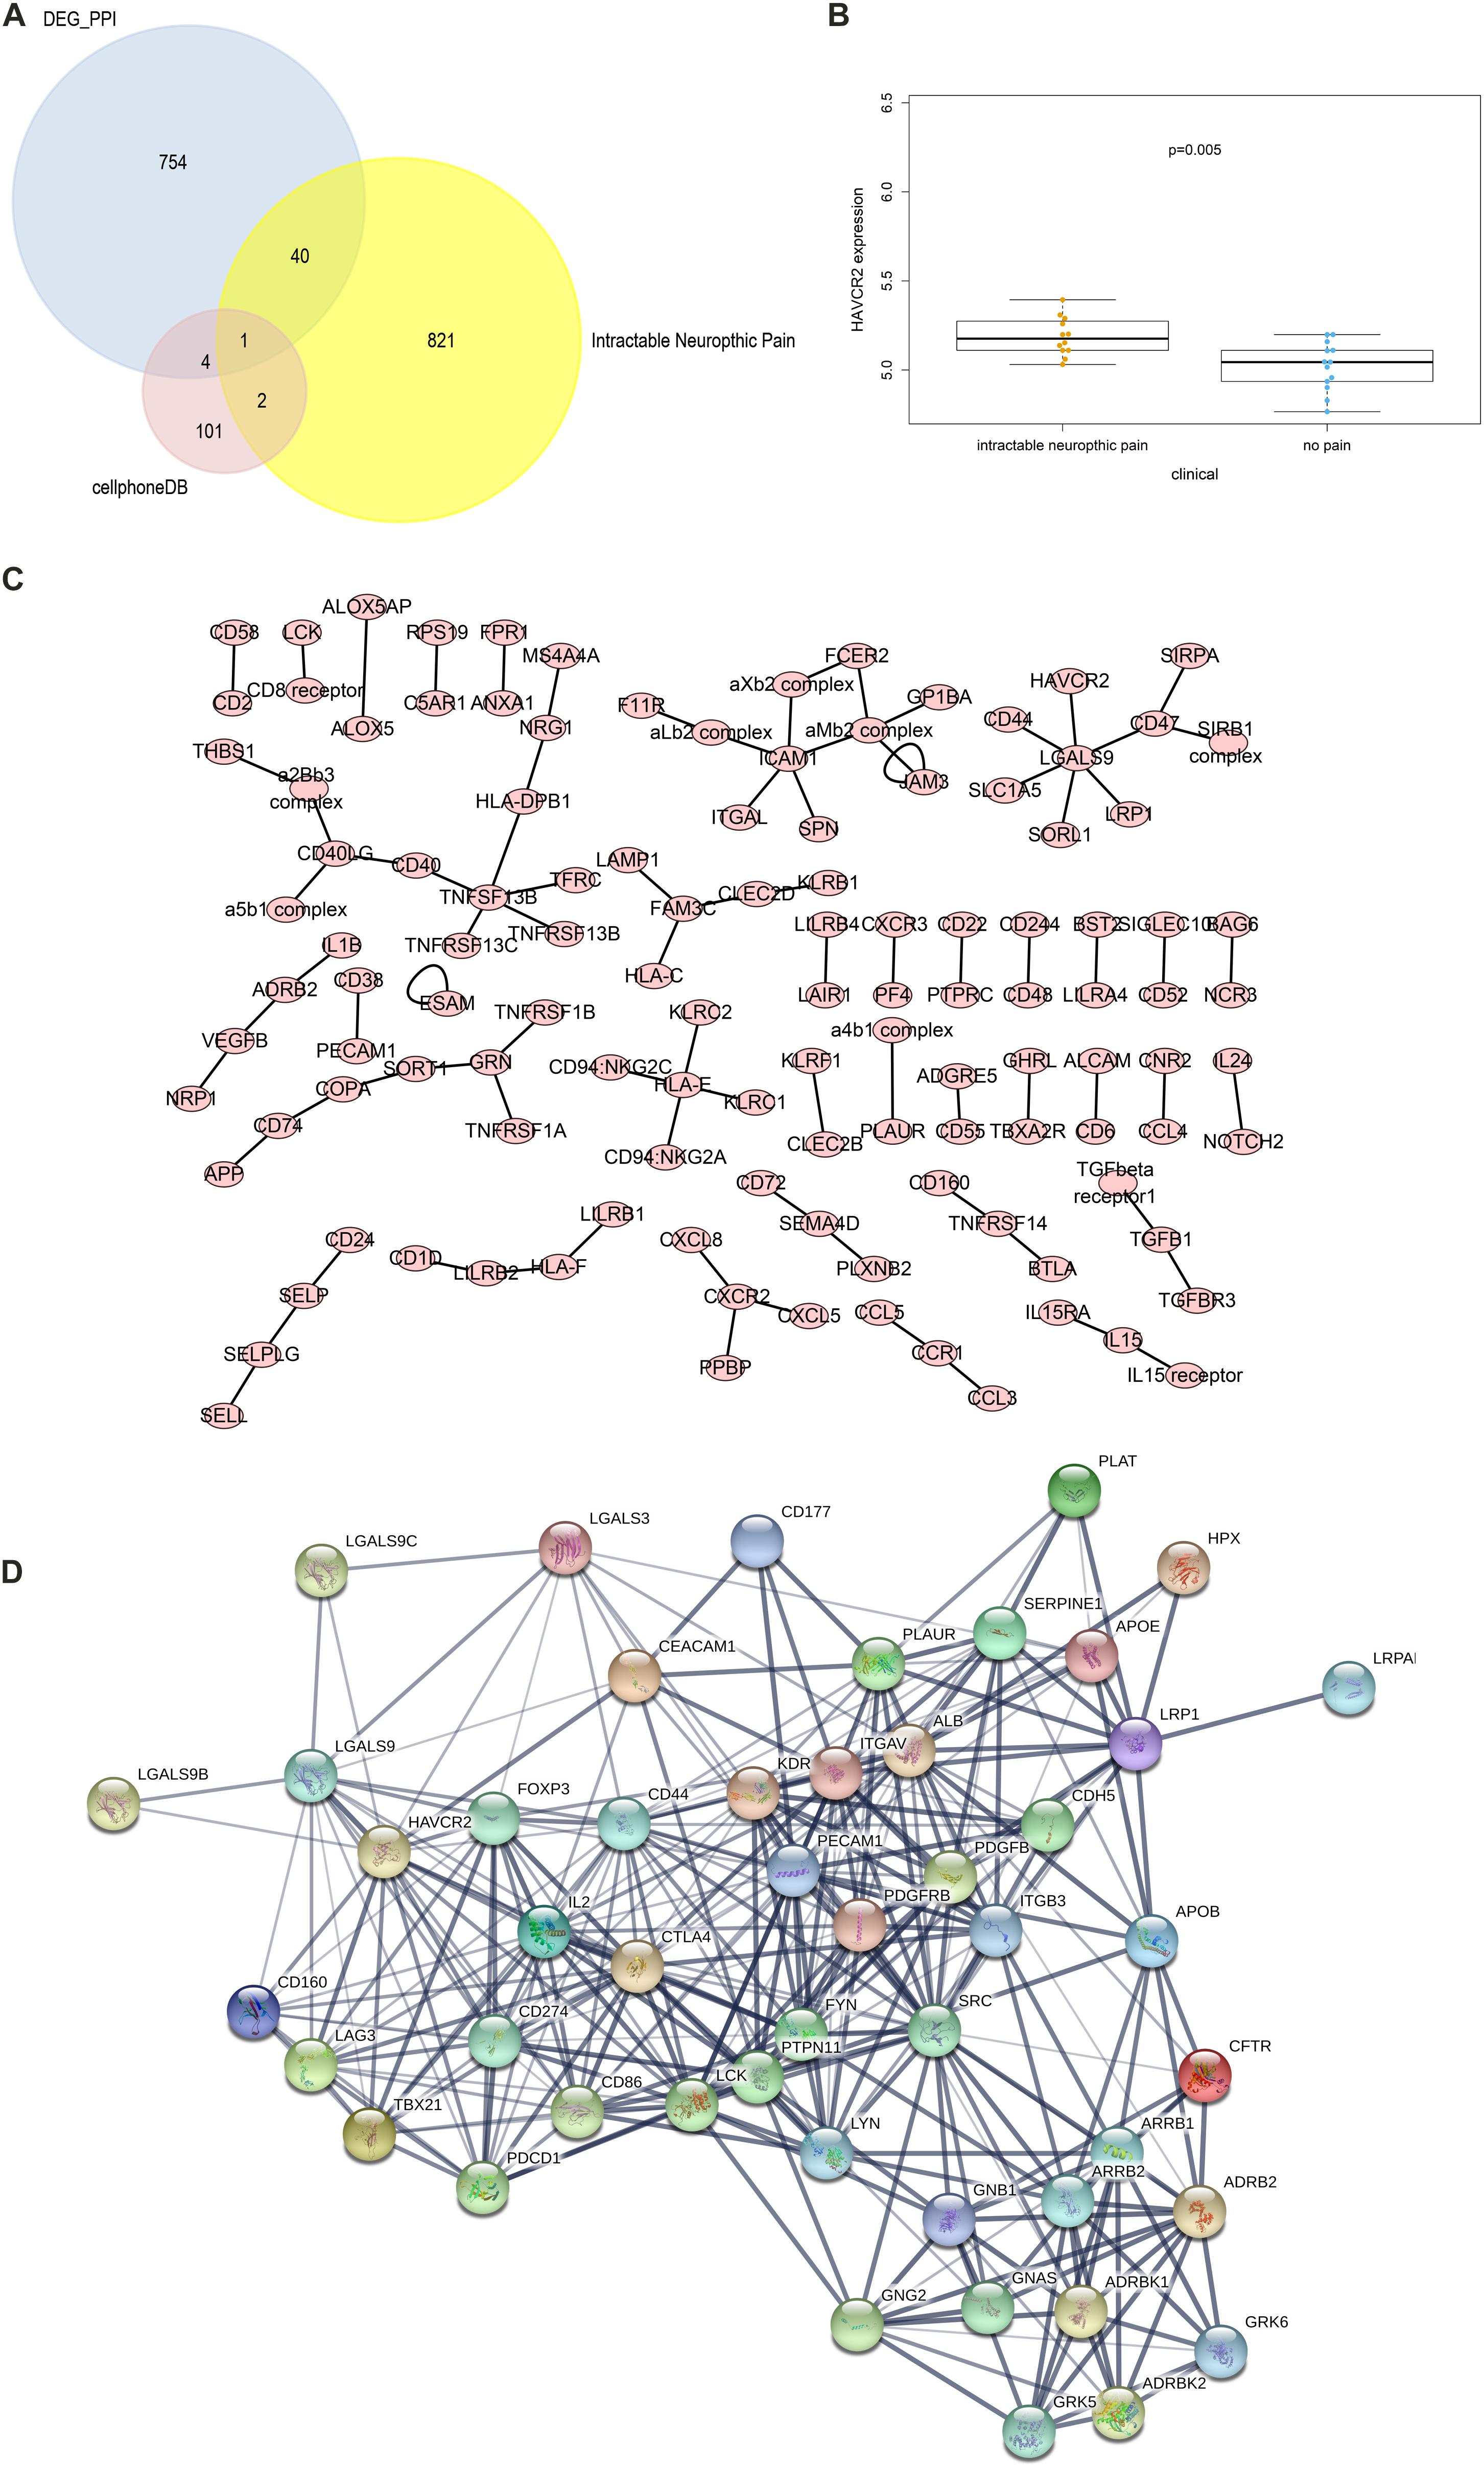
Figure 4. The results of the CellPhoneDB analysis and the Venn plot illustrating five proteins (ADRB2, LGALS9, PECAM1, HAVCR2, LRP1) that not only participated in significant ligand–receptor interactions in peripheral blood mononuclear cells (PBMCs) but Protein-Protein Interaction (PPI) network based on the differentially expressed genes (DEGs). (A) The Venn plot illustrating five proteins (ADRB2, LGALS9, PECAM1, HAVCR2, LRP1) that not only participated in significant ligand–receptor interactions in PBMCs but PPI network based on the DEGs, and only HAVCR2 was significantly associated with neuropathic pain (P = 0.005) (B). (C) The network of 87 significant ligand–receptor interactions (related to 108 proteins); (D) PPI network illustrating the interactions among the ADRB2, LGALS9, PECAM1, HAVCR2, LRP1. PBMC, peripheral blood mononuclear cell; DEG, differentially expressed gene; PPI, Protein-Protein Interaction.
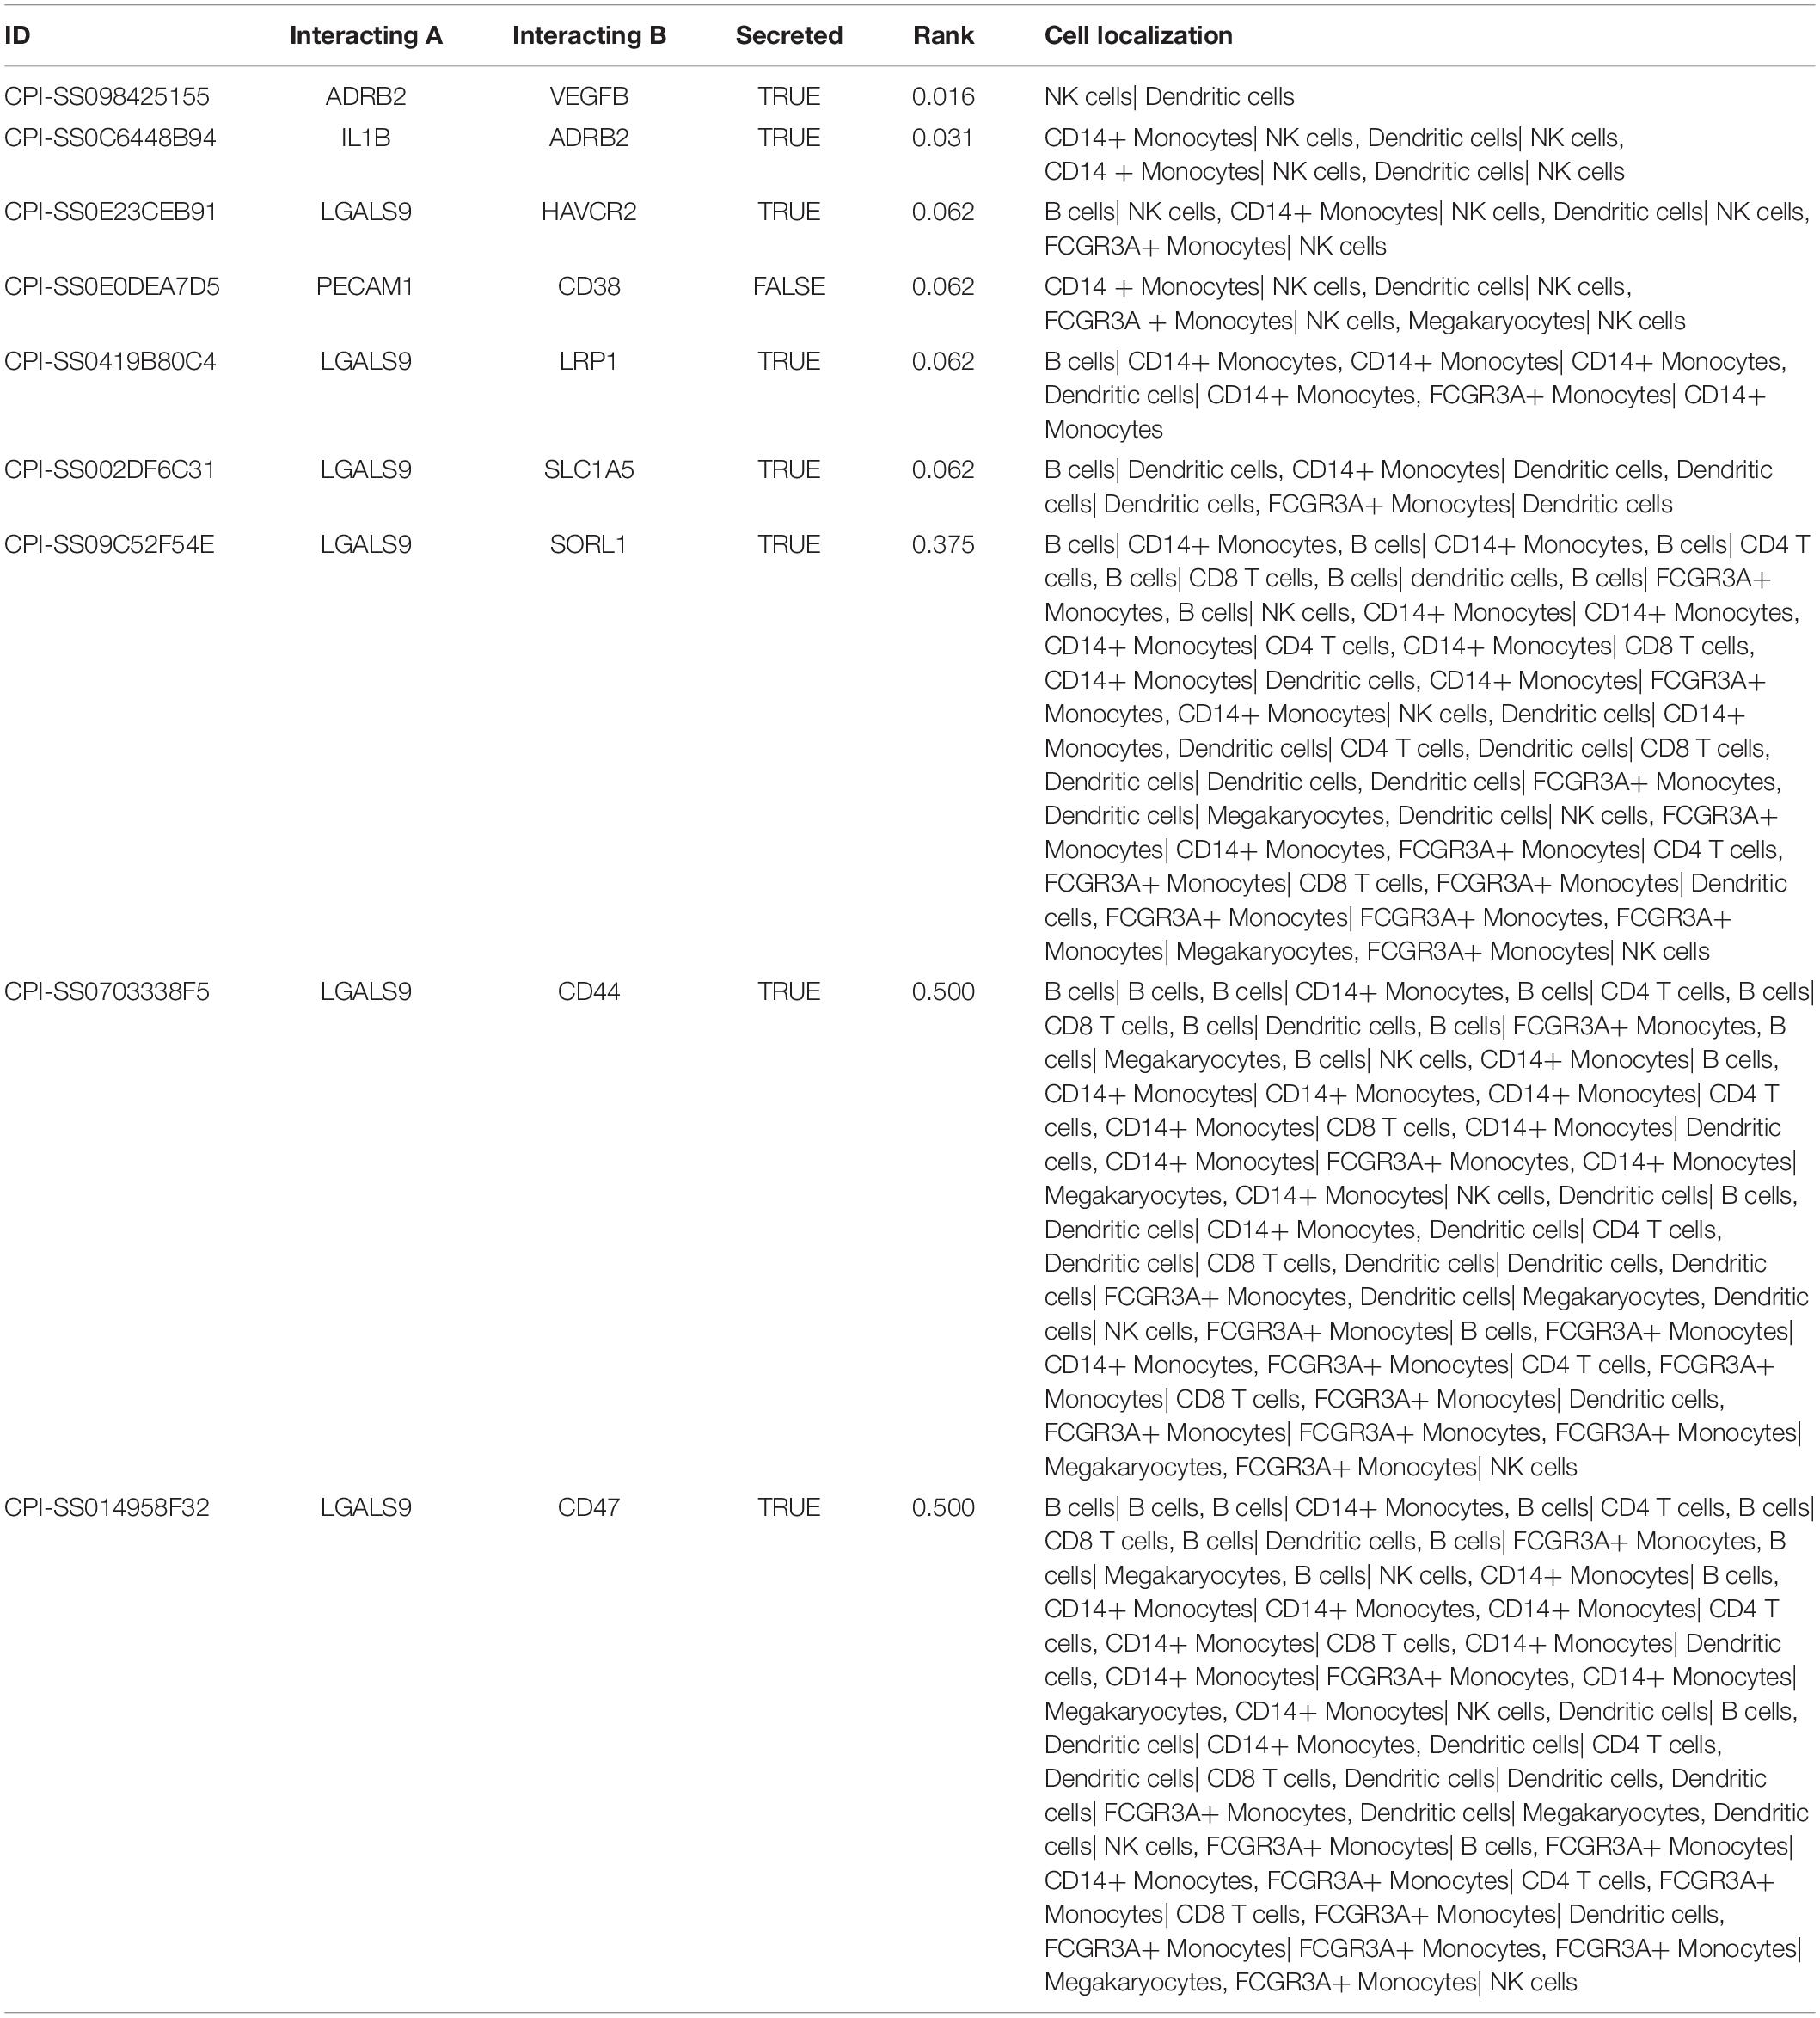
Table 1. The results of CellPhoneDB analysis involved ADRB2, LGALS9, PECAM1, HAVCR2, and LRP1.
The fraction of immune cells in each sample estimated by CIBERSORT algorithm were displayed in Figures 5A,B. The results of the Wilcoxon rank-sum test suggested that the fractions of B cells naive (P < 0.001), plasma cells (P < 0.001), T cells CD4 memory resting (P < 0.001), T cells CD4 memory activated (P < 0.001), T cells follicular helper (P = 0.021), T cells regulatory (Tregs) (P < 0.001), T cells gamma delta (P < 0.001), NK cells resting (P < 0.001), macrophages M1 (P < 0.001), macrophages M2 (P = 0.042), dendritic cells activated (P = 0.001), mast cells resting (P = 0.001) and eosinophils (P < 0.001) had significantly different cellular fractions between peripheral blood samples from SCI patients and normal control samples (Figure 5C). These differential immune cells covered all the cell localizations of ADRB2, LGALS9, PECAM1, HAVCR2, and LRP1. In Addition, the PCA results of all samples suggested the significant differences between the control group and experimental group (Figure 5D). Besides, enable batch correction and disable quantile normalization algorithm of CIBERSORTx were used to eliminate platform effect and batch effect between different dataset. Wilcoxon rank-sum test suggested that the fractions of B cells naive (P < 0.001), plasma cells (P < 0.001), T cells CD4 memory resting (P < 0.001), T cells CD4 memory activated (P < 0.001), T cells follicular helper (P = 0.004), T cells regulatory (Tregs) (P < 0.001), T cells gamma delta (P < 0.001), NK cells resting (P < 0.001), macrophages M1 (P < 0.001), macrophages M2 (P = 0.002), dendritic cells activated (P < 0.001), mast cells resting (P = 0.001), and eosinophils (P < 0.001) also had significantly different cellular fractions between peripheral blood samples from SCI patients and normal control samples (Supplementary Figure S2).
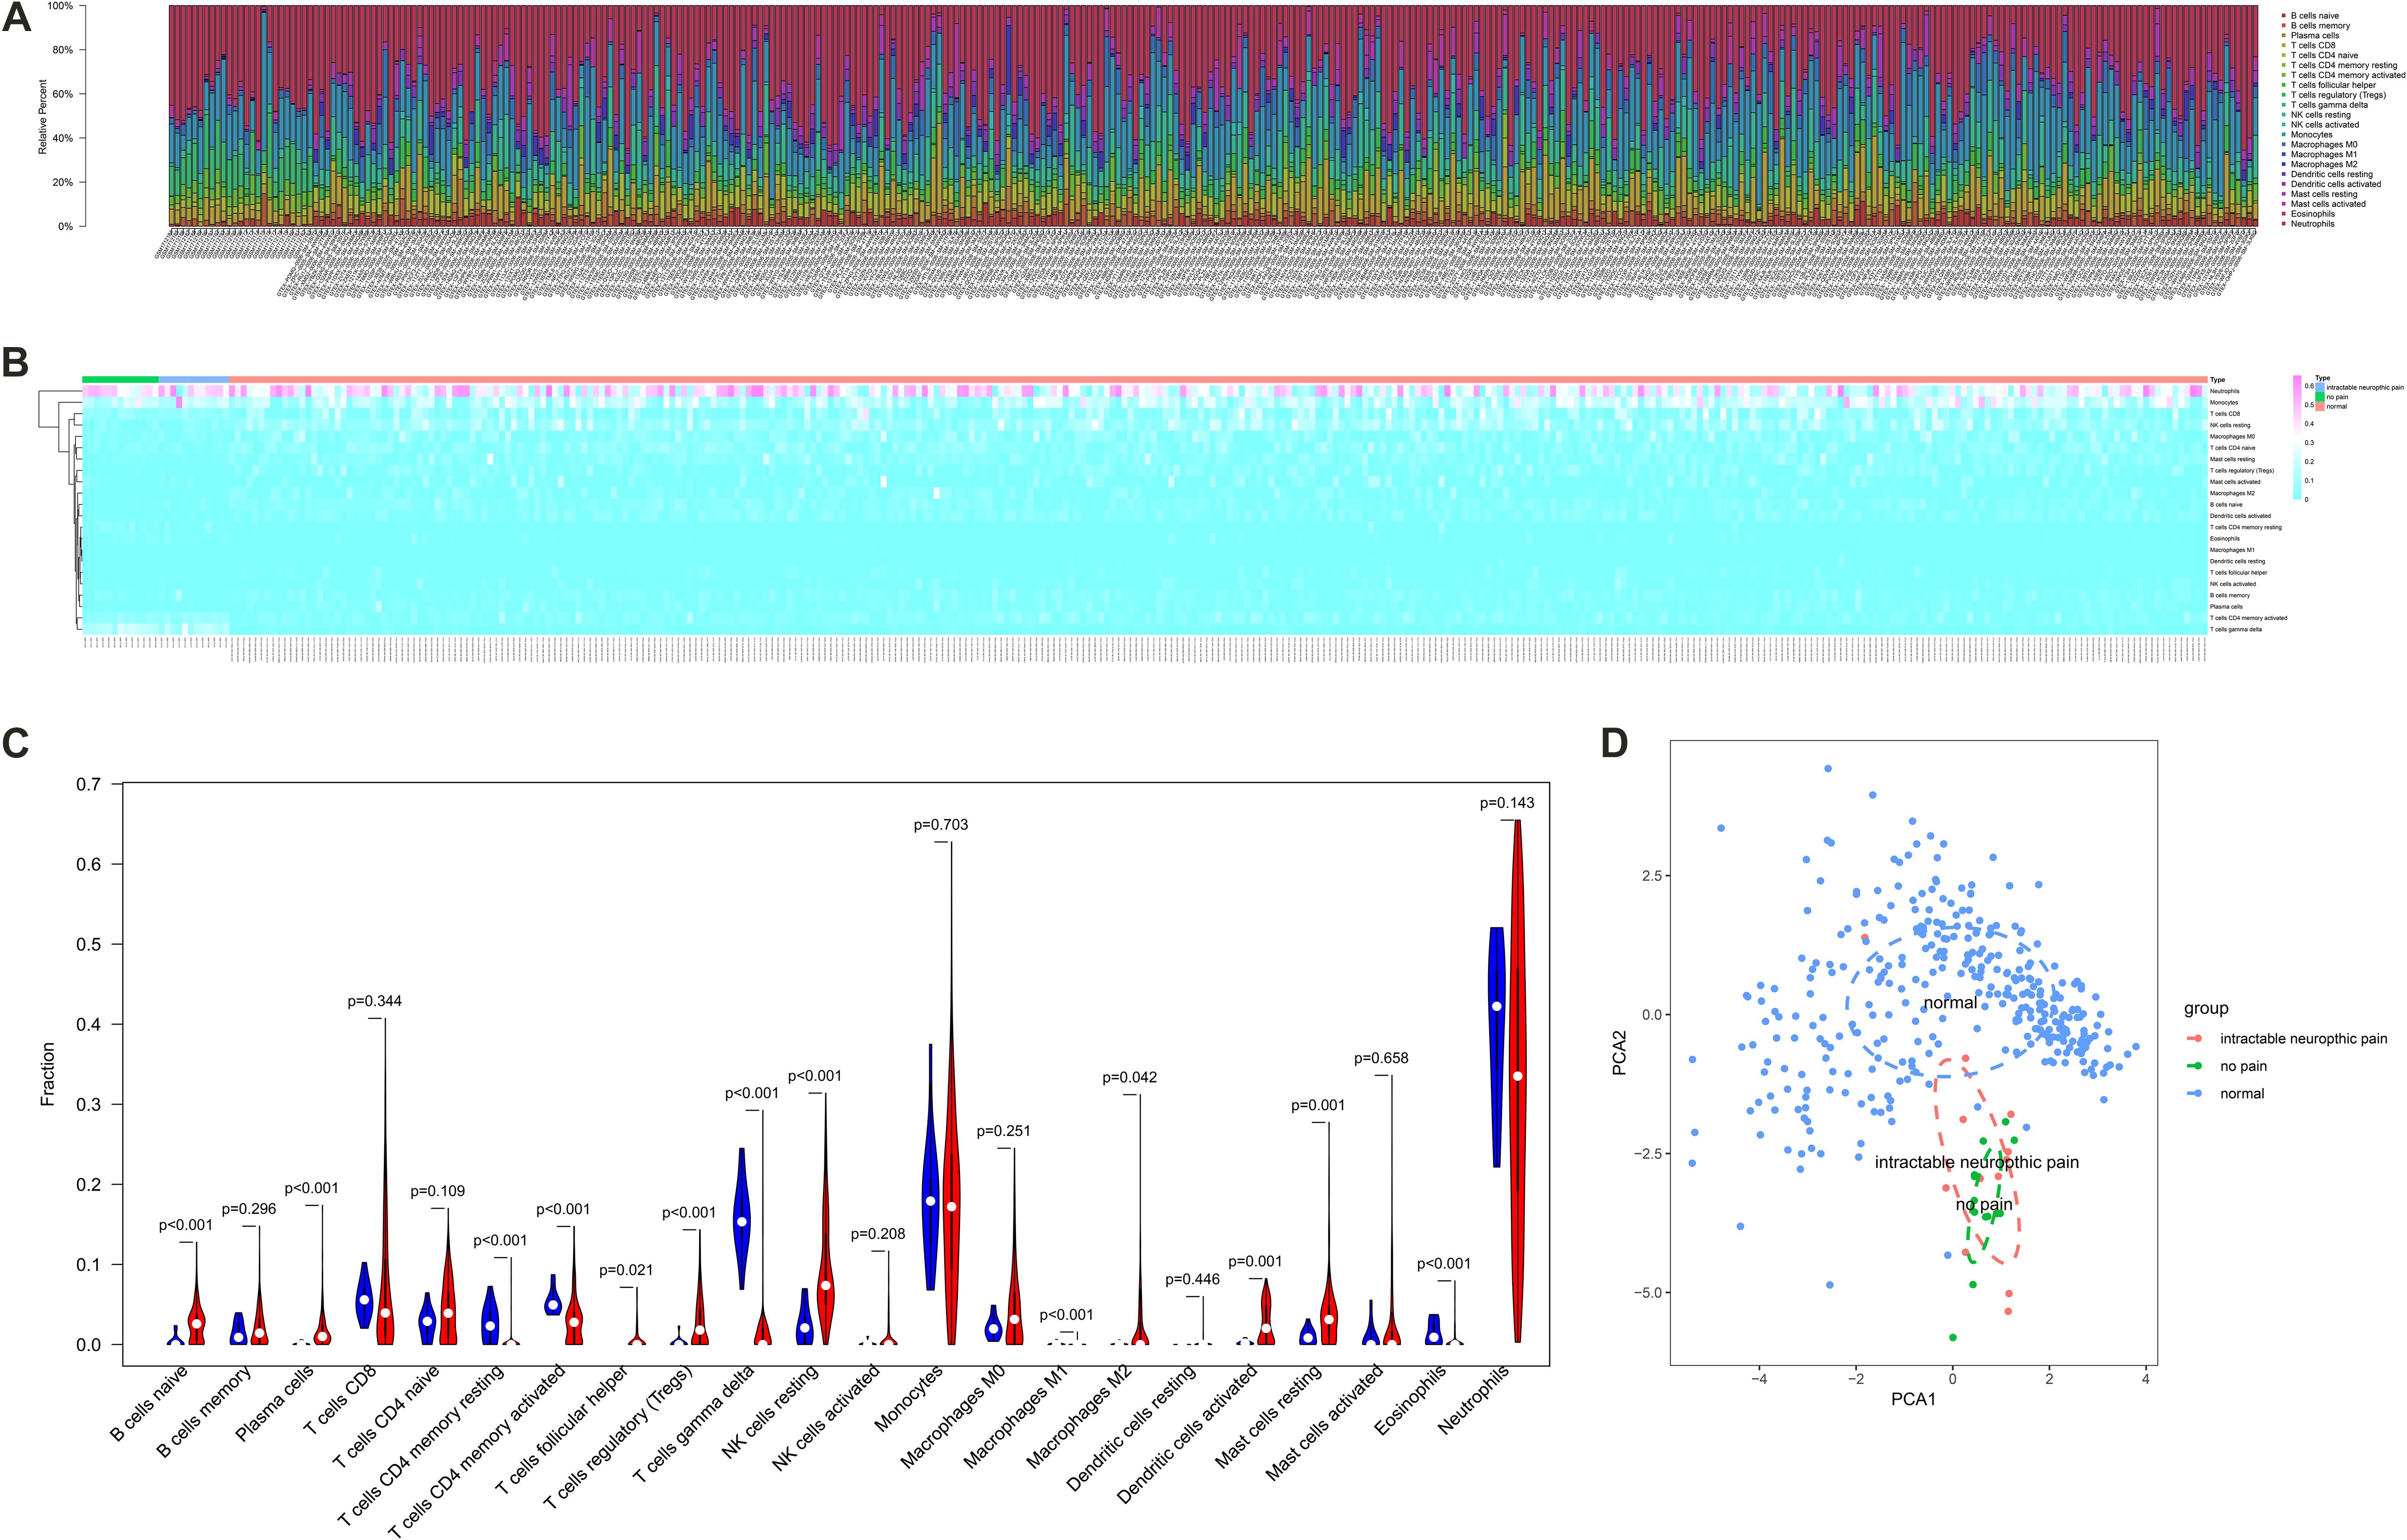
Figure 5. The composition (A) and heat map (B) of immune cells estimated by Cell type identification by estimating relative subsets of RNA transcripts (CIBERSORT) algorithm in peripheral blood samples from spinal cord injury (SCI) patients and normal control samples. (C) The violin plot identifying immune cells different from the two groups (the blue and red bar stand for SCI group and primary normal control samples, respectively). (D) The Principal Component Analysis (PCA) result of all samples suggesting the significant differences between the control group and the experimental group. CIBERSORT, cell type identification by estimating relative subsets of RNA transcripts; SCI, spinal cord injury; PCA, principal component analysis.
Gene Set Variation Analysis was performed to estimate the expression levels of 185 KEGG pathways and 12 pathways were identified as differentially expressed pathways between peripheral blood samples from SCI patients and normal control samples (Figures 6A,B). Especially, some critical pathways were significantly associated with cellular communication and immune response such as “mTOR signaling pathway,” “complement and coagulation cascades pathway,” and “cysteine and methionine metabolism pathway.”
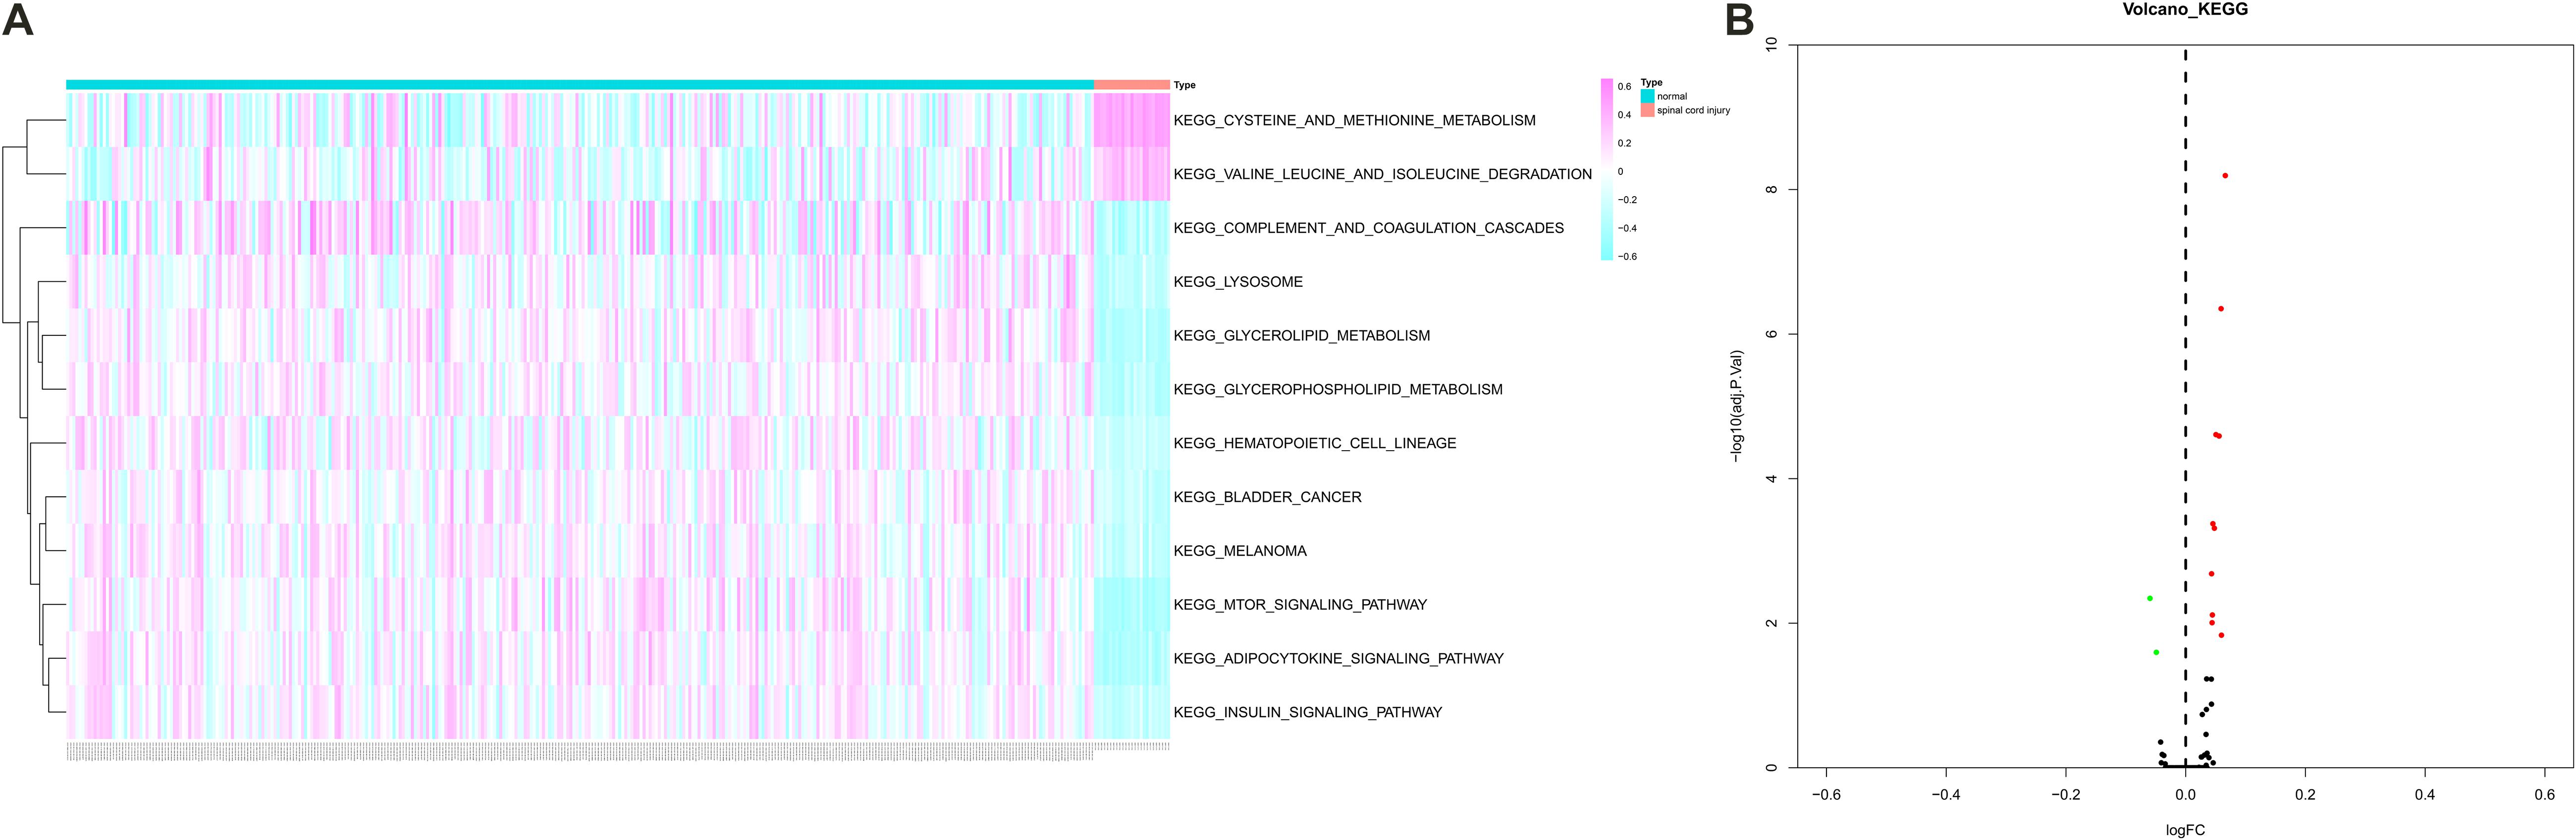
Figure 6. The heat map (A) and volcano plot (B) showing Kyoto Encyclopedia of Genes and Genomes (KEGG) 12 pathways were identified as differentially expressed pathways [Quantitative by Gene Set Variation Analysis (GSVA)] between peripheral blood samples from spinal cord injury (SCI) patients and normal control samples. KEGG, Kyoto Encyclopedia of Genes and Genomes; GSVA, Gene Set Variation Analysis; SCI, spinal cord injury.
The TFs enrichment analysis was firstly performed based on all 2,314 DEGs and a total of 41 TFs were identified with FDR value < 0.05. Moreover, the enrichment analysis revealed that 10 significantly differentially expressed TFs might regulate the promoter regions of ADRB2, LGALS9, PECAM1, HAVCR2, and LRP1 (Table 2).
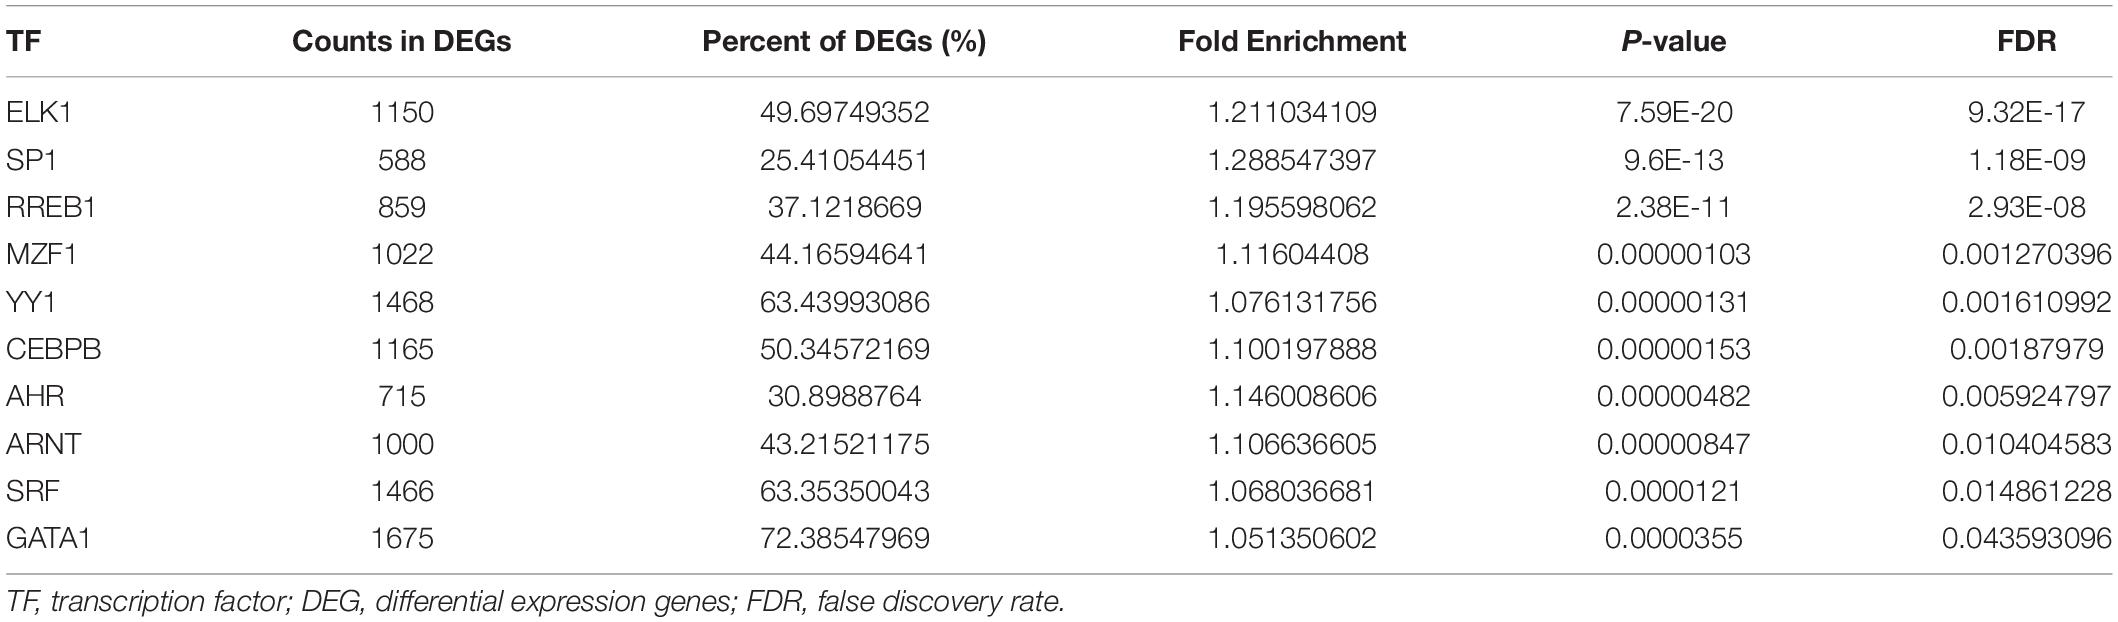
Table 2. Transcription factors enrichment analysis of ADRB2, LGALS9, PECAM1, HAVCR2, and LRP1.
A co-expression Pearson correlation analysis was used among significantly enriched TFs, key cellular communication genes and differentially expressed KEGG pathways. A regulation network was constructed based on TFs and key cellular communication genes (Figure 7A). The bi-clustering heatmap and co-expression heatmap illustrated the expression levels and co-expression patterns of the three components (Figures 7B,C). In the co-expression heatmap, the TF Yin and Yang 1 TF (YY1) had significantly co-expression pattern with cellular communication receptor HAVCR2 (R = −0.54, P < 0.001), while HAVCR2 was also co-expressed with mTOR signaling pathway (R = 0.57, P < 0.001). Besides, the TF CEBPB was significantly co-expressed with LGALS9 (R = −0.52, P < 0.001), which was the ligand of HAVCR2 and also co-expressed with HAVCR2 (R = 0.70, P < 0.001). Moreover, the cellular localizations of the key TFs and target DEGs with co-expression patterns showed that HAVCR2 and LGALS9 were located in NK cells and CD14 + monocytes, respectively (Figures 7D–L). Eventually, the sketch map of the signaling axis with the most significant co-expression pattern including YY1, HAVCR2, CEBPB, LGALS9, NK cell, CD14 + monocyte and mTOR signaling pathway was shown in Figure 8.
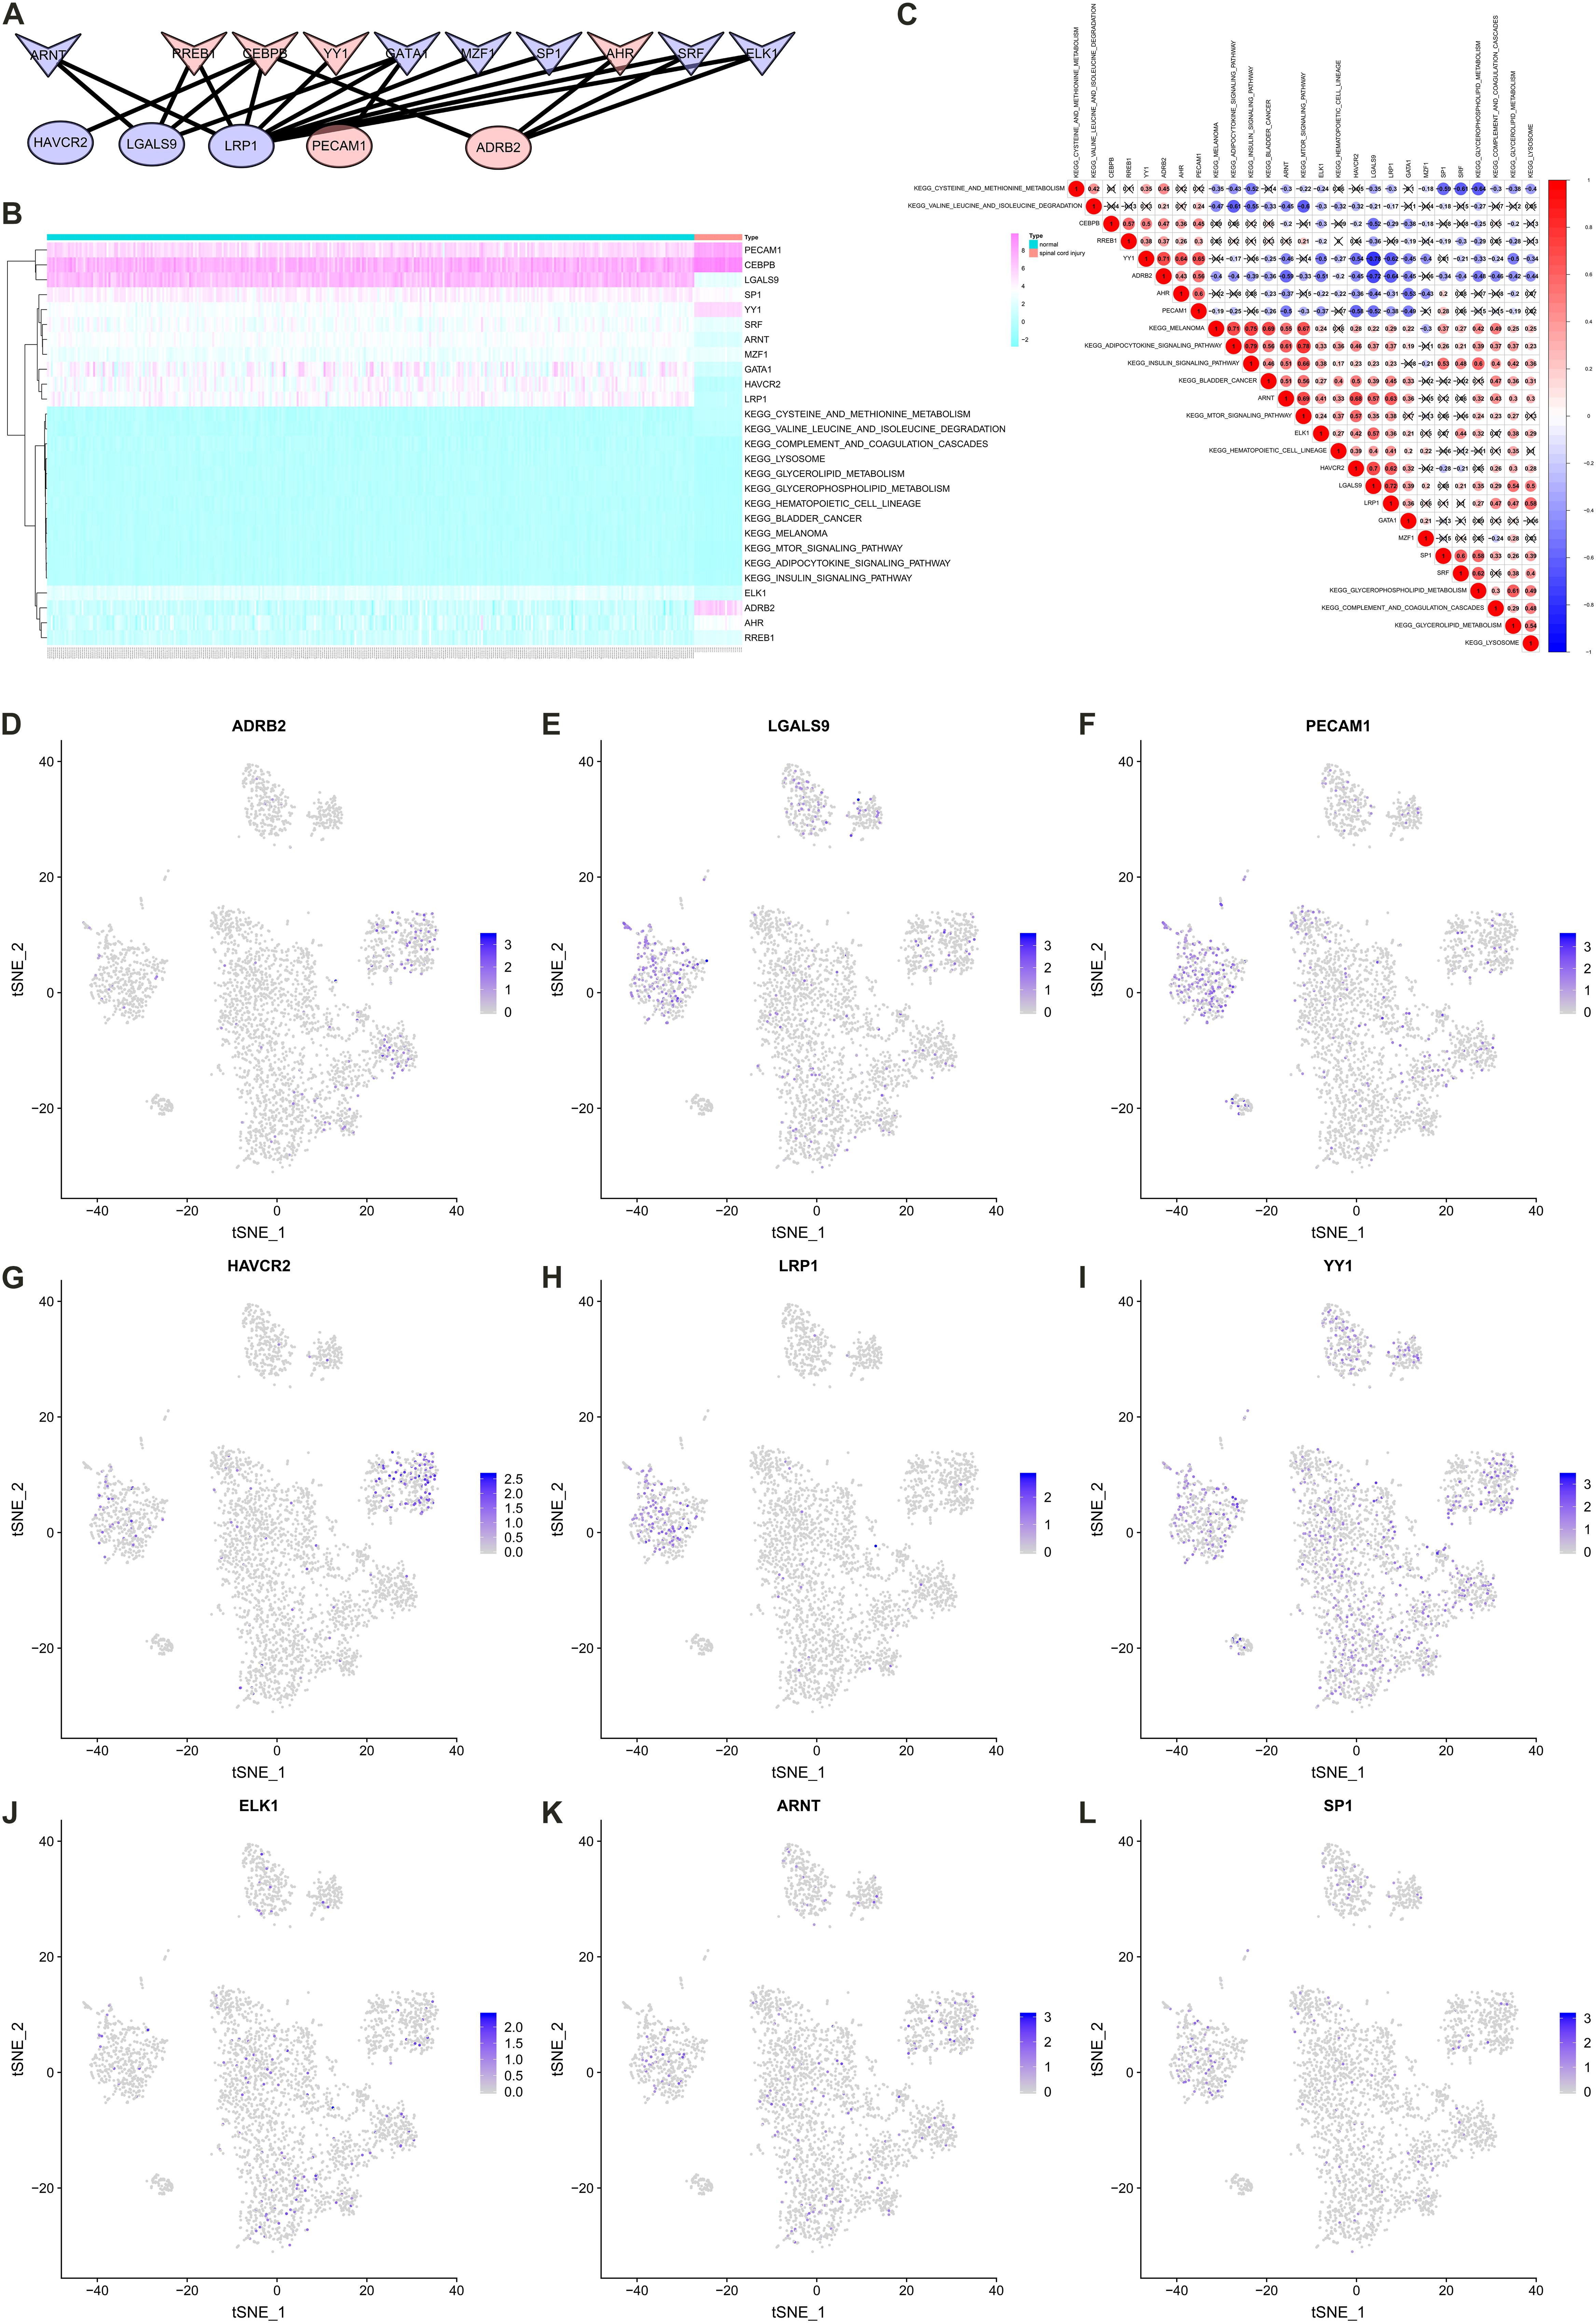
Figure 7. Construct regulation network and identify co-expression patterns among transcription factors (TFs), key cellular communication genes and differentially expressed Kyoto Encyclopedia of Genes and Genomes (KEGG) pathways. (A) The regulation network of TFs and key cellular communication genes (the V symbols represented TFs, the ellipses represented target DEGs; Red represented significant upregulated and blue represented downregulated). (B) The bi-clustering heatmap illustrating the expression levels of TFs, key cellular communication genes and differentially expressed KEGG pathways. (C) The co-expression heatmap illustrating the co-expression patterns of TFs, key cellular communication genes and differentially expressed KEGG pathways (in the co-expression heatmap, the transcription factor YY1 had significantly co-expression pattern with cellular communication receptor HAVCR2 (R = –0.54, P < 0.001), while HAVCR2 was also co-expressed with mTOR signaling pathway (R = 0.57, P < 0.001). (D–L) The feature plots showing the cellular localizations of the key TFs and target DEGs with co-expression patterns. TF, transcription factors; KEGG, Kyoto Encyclopedia of Genes and Genomes; DEG, differentially expressed gene.
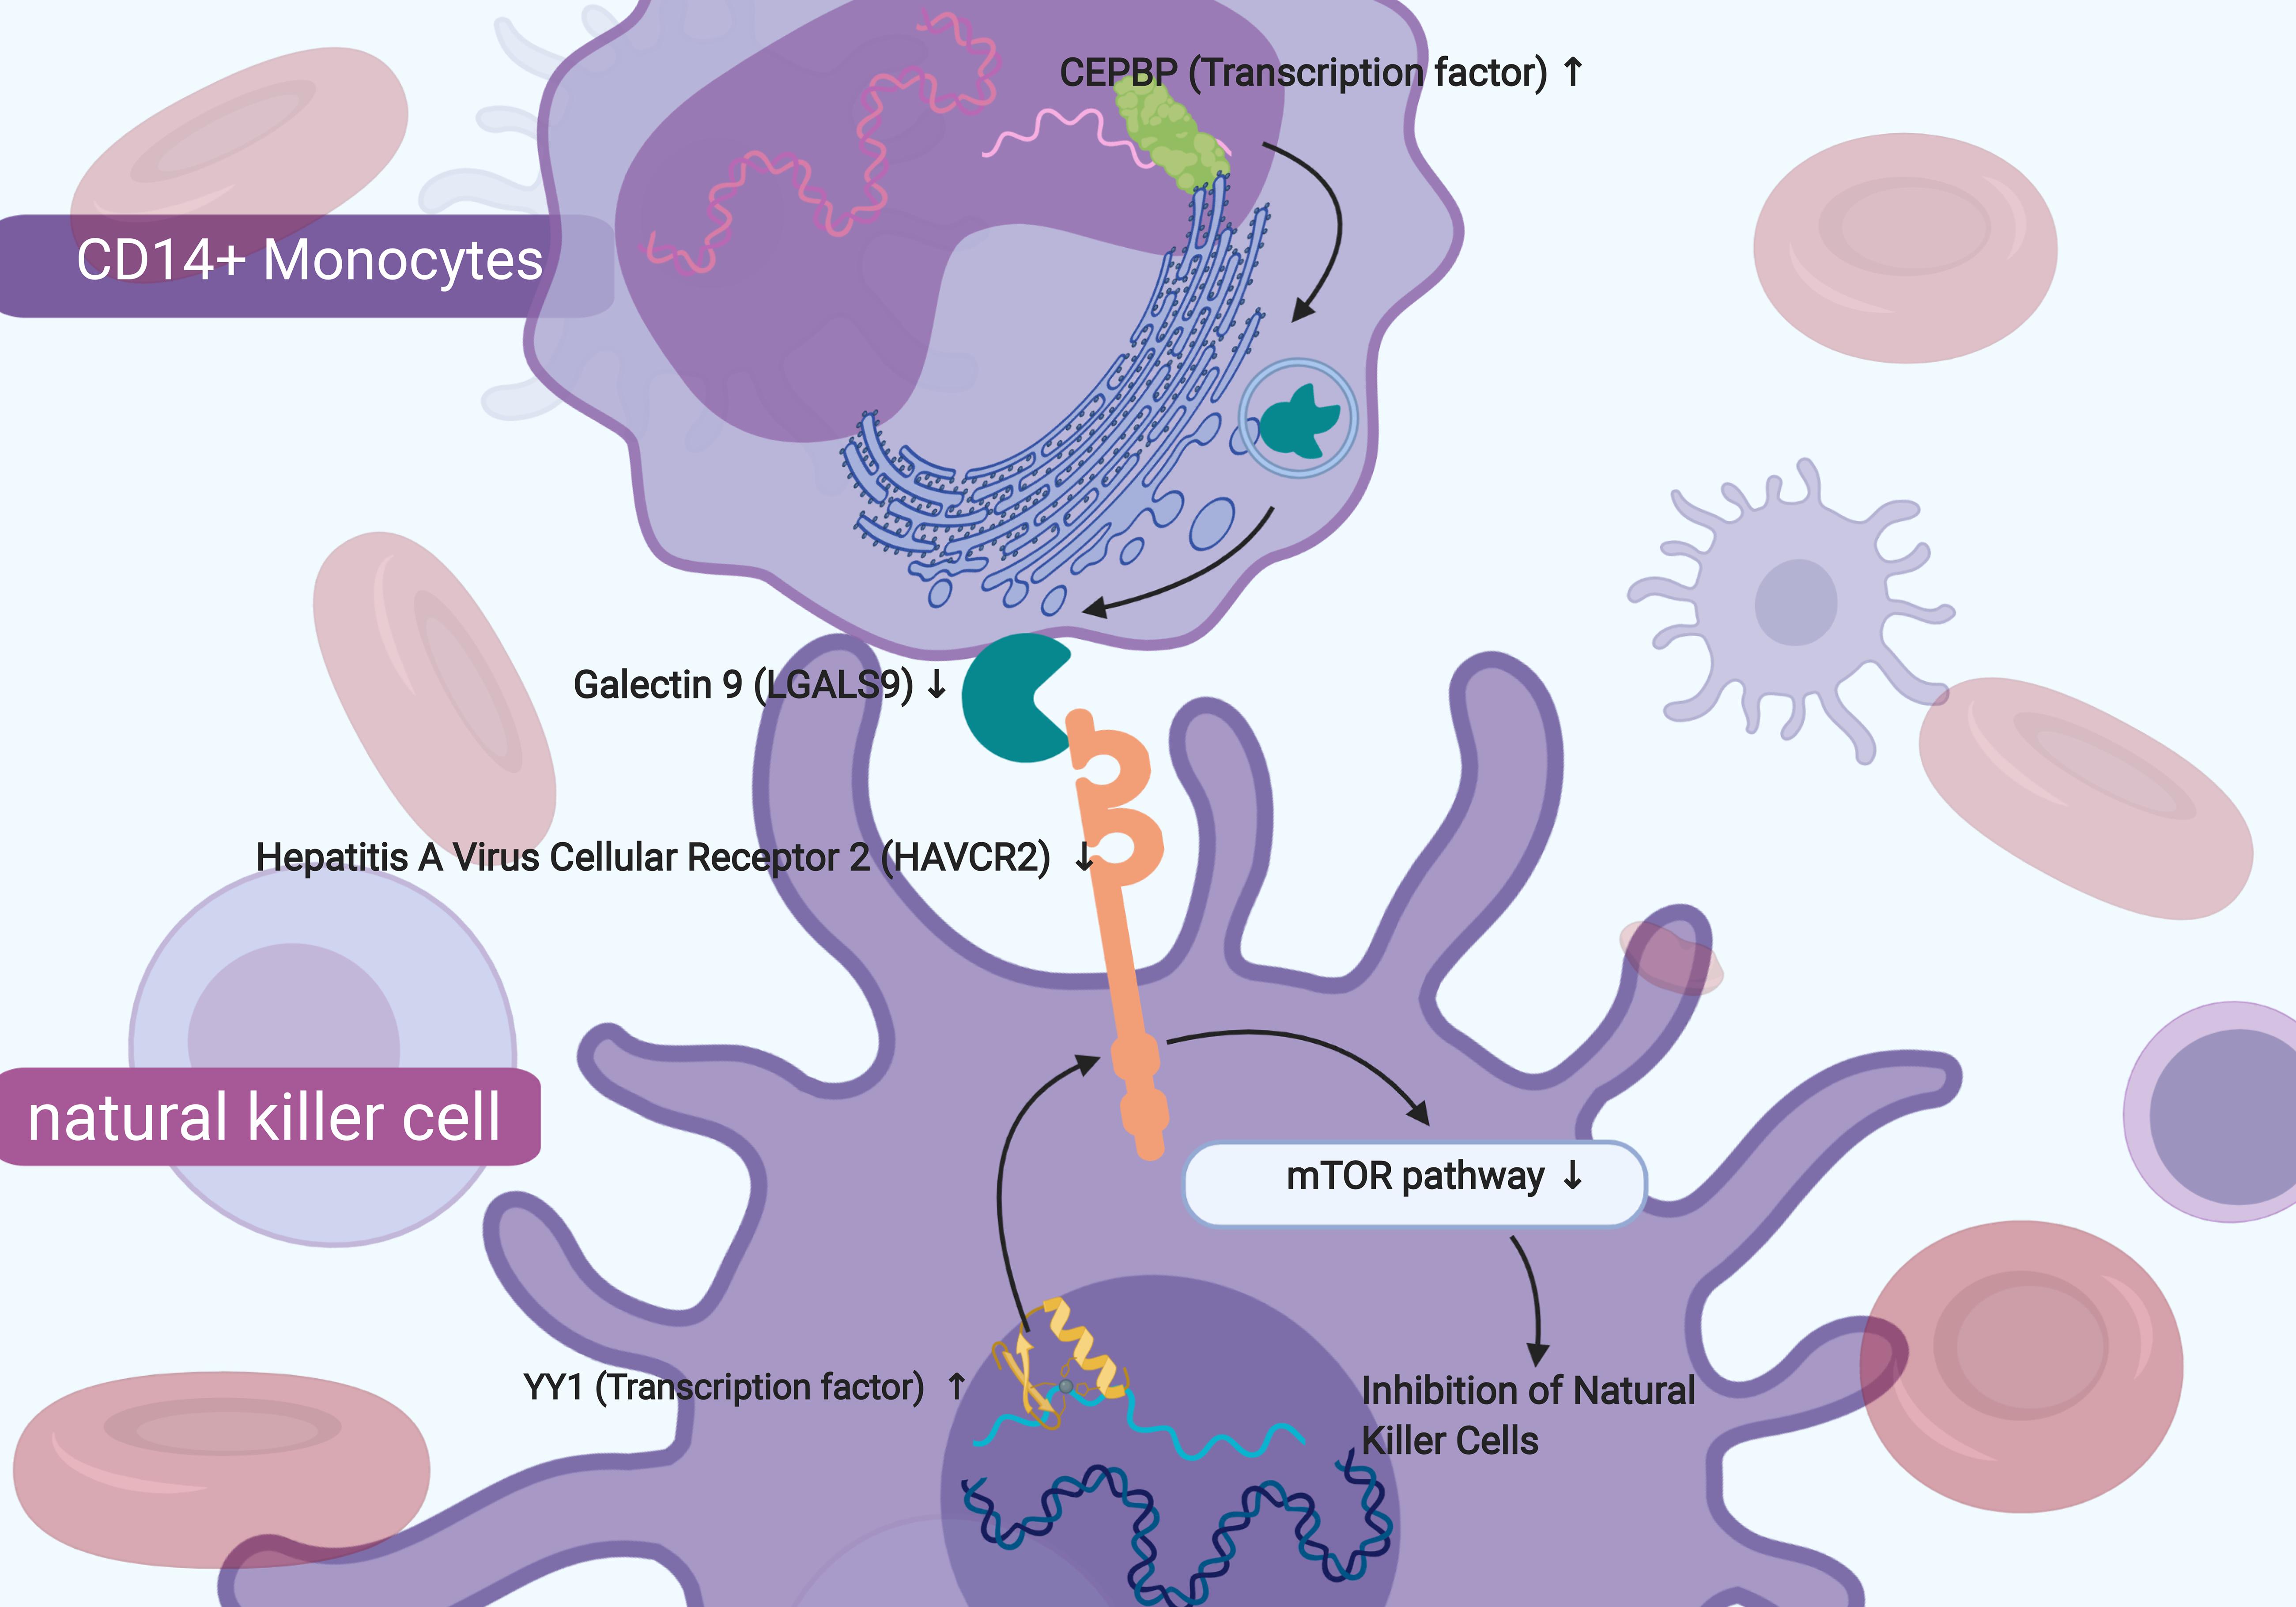
Figure 8. The sketch map of the signaling axis with the most significant co-expression pattern including YY1 (Yin and Yang 1 Transcription Factor), Hepatitis A Virus Cellular Receptor 2 (HAVCR2) and mTOR signaling pathway. In conclusion, this study inferred that the mechanism of YY1 regulating HAVCR2 and mTOR signaling pathway in the NK cells and the cellular communication between NK cells and CD14 + monocytes might play an important role in chronic phase of SCI and neuropathic pain.
Kruskal–Wallis test was used to identity the statistical difference of gene expression among groups. The results suggested that TF YY1 (Figure 9A, P < 0.001) and CEBPB (Figure 9C, P < 0.001) were upregulated in the peripheral blood of patients with SCI compared with patients with fractures but no SCI and normal adults. HAVCR2 (Figure 9B, P < 0.001) and LGALS9 (Figure 9D, P < 0.001) were also abnormally downregulated in peripheral blood of patients with SCI. Some key genes of the mTOR signaling pathway (MTOR, RPS6, RPS6KB1, RPS6KB2) were also identified to be significantly down-regulated in peripheral blood of patients with SCI (Figures 9E–H).
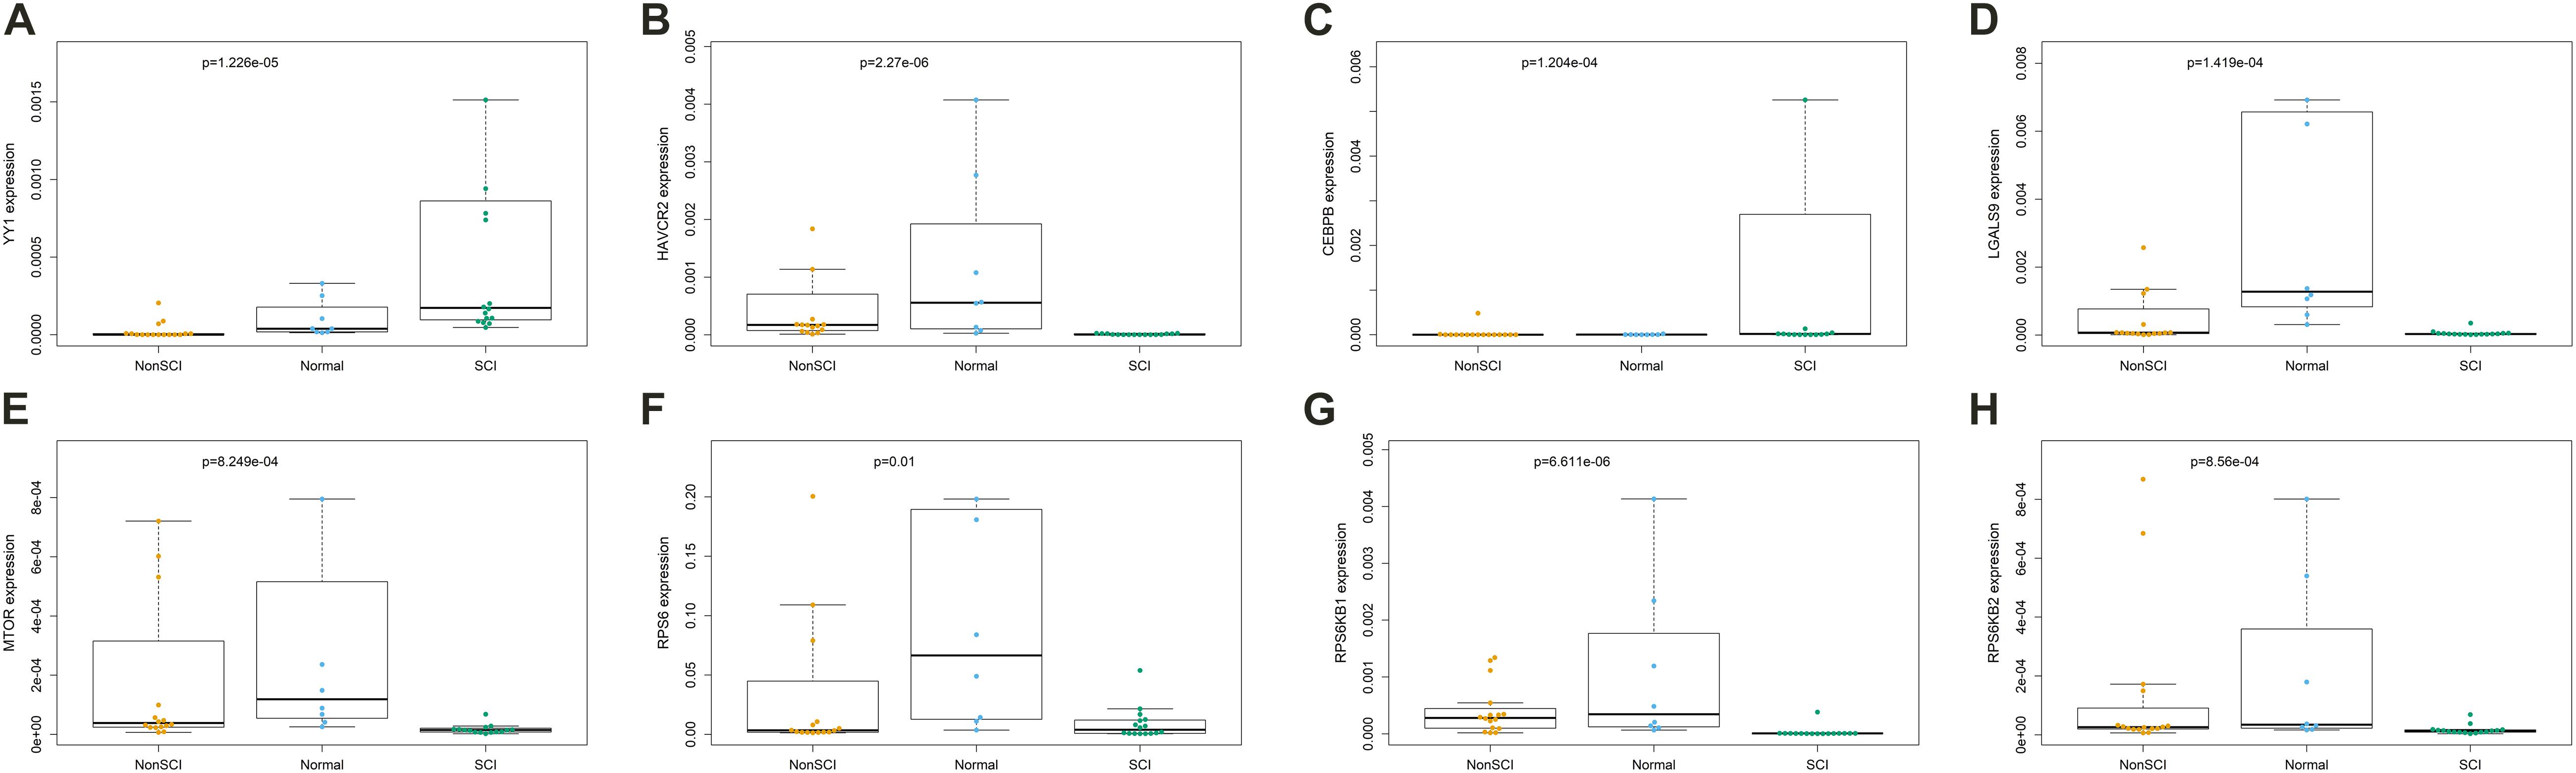
Figure 9. The results of Kruskal-Wallis test identifying the statistical difference of gene expression estimated by Reverse Transcription Quantitative Real-Time PCR (RT-qPCR) Assays. Total RNA was isolated from was extracted from human whole blood of 16 patients with fractures complicated with SCI, 16 patients with fractures but no SCI and 8 normal adults. The results of Kruskal–Wallis test suggested that transcription factor YY1 (A, P < 0.001) and CEBPB (C, P < 0.001) were upregulated in the peripheral blood of patients with SCI compared with patients with fractures but no SCI and normal adults. HAVCR2 (B, P < 0.001) and LGALS9 (D, P < 0.001) were also abnormally downregulated in peripheral blood of patients with SCI. Some key genes of the mTOR signaling pathway (MTOR, RPS6, RPS6KB1, RPS6KB2) were also identified to be significantly down-regulated in peripheral blood of patients with SCI (E–H).
Additionally, since the platform effect and batch effect could inevitably affect the results of the differential genes, two Affy Primeview dataset (GSE82152 and E-MTAB-5151) including normal peripheral blood samples were used as the control group for differential expression analysis. Two volcano plots showing the results of differential expression analysis using two Affy Primeview dataset [GSE82152 (Supplementary Figure S4) and E-MTAB-5151 (Supplementary Figure S4)] including normal peripheral blood samples as the control group. And the differential expression analysis results of YY1, CEBPB, HAVCR2, LGALS9, MTOR, RPS6, RPS6KB1, and RPS6KB2 using GSE82152 and E-MTAB-5151 as control group were summarized in Supplementary Tables S1 and S2, respectively.
Spinal cord injury, one of the most devastating diseases, disrupts communication between the central and peripheral nervous, leading to the loss of essential neurological functions. Due to a large number of traffic and industrial accidents, the incidence rate of SCI is increasing rapidly around the world (Azarhomayoun et al., 2018; Musubire et al., 2019). Chronic phase of SCI may last a long period after the acute phase, which bring physically and psychologically devastating traumas to persons with SCI (Budh and Osteraker, 2007). SCI-related NeP is one of the most common symptoms in chronic phase and severely decreases the quality of life (Bryce et al., 2012). The molecular and cellular features often have some changes during the process of SCI-related NeP, and are often viewed as important predictors (Natinal Spinal Cord Injury Statistical Center [NSCISC], 2014). Thus, the DEGs and cellular communications in peripheral blood attract our interest, which is seldom reported by previous studies.
In the present study, an integrated transcriptome bioinformatics analysis based on bulk RNA sequence and single-cell RNA sequence was performed and the results inferred that the mechanism of YY1 regulating HAVCR2 and the downstream mTOR signaling pathway in the NK cells might be associated with SCI-related NeP. In addition, the cellular communication between NK cells and CD14+ monocytes might also play an important role in the SCI-related NeP. This hypothetical signaling axis might provide prognostic biomarkers and therapeutic targets for the SCI-related NeP.
YY1 was upregulated in the peripheral blood of patients with SCI in our study and almost distributed in all kinds of PBMCs. As a ubiquitously distributed TF, YY1 is involved in activating and repressing a diverse number of promoters. In addition, it modulates a variety of biological processes, particular in nerve and immune cells/tissues (Chen et al., 2017). NF-κB/YY1 signaling was reported to be associated with microglial activation in the progression of glaucoma, characterized with the progressive loss of retinal ganglion cells and optic nerve fibers (Lv et al., 2016). YY1 was expressed initially in pro-myelinating Sox9 + /Sox10 + Schwann cells (SCs) by E18.5 and continued to express in the early postnatal and adult SCs. Following acute nerve injury, YY1 expression was often maintained (Balakrishnan et al., 2016). In Stratton et al.’s (2017) study, YY1 was regarded as SC-associated proteins to promote axonal growth and regenerated axons and formed myelin following transplantation into the injured mouse sciatic nerve. Thus, we supposed that YY1 was a key TF in the SCI-related NeP.
HAVCR2 is also named T-Cell Immunoglobulin Mucin Family Member 3 (Tim-3). In this study, it was abnormally down-regulated in peripheral blood of patients with SCI and significantly correlated with the occurrence of SCI-related NeP. The protein coding by HAVCR2 belongs to the immunoglobulin superfamily and is involved in regulating innate and adaptive immune responses, usually mediating inhibition of target immune cells (Gorman and Colgan, 2014). HAVCR2 was reported to be abnormally expressed in T-cell lymphoma, acute myeloid leukemia, hepatitis A and injured nerve tissue. It regulated the activity of target immune cells through NF-κB signaling pathway, mTOR signaling pathway and RET signaling pathway (Prokhorov et al., 2015; Goncalves Silva et al., 2017; Avery et al., 2018). The role of HAVCR2 in nerve injury was shown in patients with spontaneous intracerebral hemorrhage whose increased HAVCR2 expression on CD14+ monocytes was associated with systemic inflammatory response and sub-acute brain injury (Xu et al., 2018). Besides our results, several previous studies revealed the close interaction between HAVCR2 and LGALS9. The interaction could inhibit the activity and promote the apoptosis of target cells, especially to the immune cells (Zhu et al., 2005; Clayton et al., 2014).
In our study, HAVCR2 was mainly distributed in NK cells in patients with SCI-related NeP, similar to the previous study which reported that HAVCR2 expressed on the surface NK cells was shown to act as a co-receptor to enhance IFN-gamma production in response to LGALS9 (Gleason et al., 2012). NK cells, originated from bone marrow derived lymphocytes, are crucial for immunoreaction against several infections and cancers (Nair et al., 2015). Post-SCI immunological changes impede neurological recovery and mediate common medical consequences of SCI, including NeP (Herman et al., 2018). It was also reported that NK cells were involved in peroneal nerve and their activation was essential in patients with traumatic SCI (Turker et al., 2012; Laginha et al., 2016; Xu et al., 2019). NK cells were observed a significant activation within 24 h after traumatic SCI regarding to the NK cell frequency and the presence of NK cells with the activated phenotype (Xu et al., 2019). During the post-acute and sub-acute phases after SCI, the function of NK cells was impaired (Laginha et al., 2016) and a marked downregulation of NK cell genes was found during chronic SCI (Herman et al., 2018). Therefore, we speculated that in peripheral blood of chronic SCI, HAVCR2 might act as a key receptor on the surface of NK cells and interact with ligand LGALS9 secreted by CD14+ monocytes, inhibiting NK cells through mTOR signaling pathway and ultimately predicting the occurrence of SCI-related NeP.
Furthermore, cell-to-cell communication across multiple cell types and tissues strictly governs proper functions of metazoans and extensively depends on the interactions between ligands and receptors (Hiramoto et al., 1993; Zhou et al., 2017; Cohen et al., 2018; Kumar, 2018; Mukherjee et al., 2018; Zhou et al., 2018). The specific communication utilized by the NK cell system and central nervous system results in conditioned response (Hiramoto et al., 1993). NK cells can engage the homotypic NK-to-NI cell interactions for optimal survival, activation and proliferation (Kim et al., 2014). However, the specific molecular mechanism utilized by the NK cell system and post-SCI central nervous system is not clearly understood. The PPI network is performed based on key genes associated with SCI-related NeP (YY1, HAVCR2, CEBPB, LGALS9), key members of mTOR signaling pathway (MTOR, AKT1, MAPK1, WNT4, PIK3CB) and the surface markers of NK cell (CD56, CD16, CD94, CD3, NKp46) (Supplementary Figure S3). Due to the extensive interaction between NK cell’s surface markers and mTOR signaling pathway, we hypothesized that mTOR signaling pathway might be associated with the NK cells in the SCI-related NeP.
mTOR plays a crucial role in many physiological functions of the CNS, including the regulation of neuronal cell growth and the development of axon and dendrite (Gong et al., 2015). Its function in SCI are associated with the time phase following SCI (Pouw et al., 2011). With regard to the acute phase of SCI, the mTOR signaling pathway participates in the regulation of neuronal apoptosis, autophagy, activation of macrophage/microglia, and local inflammatory response (Kanno et al., 2012). During the chronic phase, mTOR signaling pathway regulate the neuroregeneration and glial scar formation (Kanno et al., 2012). Thus, Rapamycin, an inhibitor of mTOR, is supposed to be a good treatment for SCI by preventing apoptosis of nerve cells (Yuan et al., 2016), promoting axonal regeneration and inhibiting the formation of glial scar (Kanno et al., 2012; Li et al., 2015). Moreover, mTOR regulates the development and maturation of T, B and NK cells and control the activation of macrophage/microglia (Powell et al., 2012; Xie et al., 2014; Almutairi et al., 2019; Rostamzadeh et al., 2019).
Moreover, in addition to HAVCR2 and LGALS9, the results suggested that ADRB2, PECAM1and LRP1 were also potential biomarkers associated with SCI. Adrenoceptor Beta 2 (ADRB2) in our study was also upregulated in the peripheral blood of patients after SCI and dominately distributed in the NK cells. ADRB2 (Adrenoceptor Beta 2) is a member of the G protein-coupled receptor superfamily. It is most abundantly expressed on the vasculature and modulated the release of nitric oxide and is involved in vascular function. Damage to the vasculature is universal consequences after SCI. Importantly, it has already been shown that ADRB2 agonists have neuroprotective effects and they improve the neurological and functional outcome, such as isoproterenol, salmeterol, and clenbuterol (Junker et al., 2002; Loy et al., 2002; Graumann et al., 2011). Treatment with the ADRB2 agonist can enhance the recovery in rats post-SCI (Zeman et al., 1999; Zeman et al., 2006; Brown et al., 2014). Scholpa et al. (2019) performed using an FDA-approved compound with the ability to be repurposed, reinforcing the potential clinical applicability of their findings and demonstrating the pharmacological activation of ADRB2 receptor for the treatment of SCI. However, it seemed no previous studies that reported the association between PECAM1/LRP1 and SCI. And due to the main findings of this study was that HAVCR2 might act as a key receptor on the surface of NK cells and interact with ligand LGALS9 secreted by CD14 + monocytes, inhibiting NK cells through mTOR signaling pathway and ultimately predicting the occurrence of SCI-related NeP. Thus, PECAM1/LRP1 were not discussed in details.
There are several unavoidable limitations in our study that should be taken into consideration. Firstly, although the results of the bioinformatics perdition suggested that the DNA binding domain (DDD) of YY1 could bind the promoter region of HAVCR2, no previous studies proved this interaction relationship by the direct mechanism assays. Secondly, the data released in public datasets are so limited that the clinicopathological features analyzed are not comprehensive, which might lead to potential statistical bias. Thirdly, due to the rapid progress of sequencing technology, there is heterogeneity between different batches and experimental platforms. Lastly, we must admit that there are two major limitation in this study, which are the bias between different platforms in the expression profile data and the absence of PBMC single-cell sequencing data of SCI patients. As the single-cell sequencing data originate from normal PBMCs, the results cannot well reflect the pathological changes of PBMCs following SCI. Therefore, a more comprehensive study is being conducting in our lab with data including bulk-RNA-seq and single-cell RNA-seq data of peripheral blood from patients with different time sequence SCI, and single-cell sequencing data of normal and injured spinal cord tissues in mice, which can not only validate the stability of the results in this study but also identify more biomarkers and therapeutic targets for SCI.
In peripheral blood of chronic SCI, HAVCR2 might act as a key receptor on the surface of NK cells and interact with ligand LGALS9 secreted by CD14+ monocytes, inhibiting NK cells through mTOR signaling pathway and ultimately predicting the occurrence of SCI-related NeP. This hypothetical signaling axis may provide prognostic biomarkers and therapeutic targets for SCI-related NeP.
All datasets for this study are included in the ArrayExpress (E- GEOD-69901, https://www.ebi.ac.uk/arrayexpress/experiments/E-GEOD-69901/ and E-MTAB-5151, https://www.ebi.ac.uk/array express/experiments/E-MTAB-5151/), Gene Expression Omnibus (GSE82152, https://www.ncbi.nlm.nih.gov/geo/query/acc.cgi?acc=GSE82152), Genotype-Tissue Expression Portal (GTEx, https://commonfund.nih.gov/GTEx/) and Sequence Read Archive (SRA) (SRA713577, https://www.ncbi.nlm.nih.gov/sra/SRX4149408[accn]).
The studies involving human participants were reviewed and approved by the Ethics Committee of Tongji Hospital, Tongji University School of Medicine. The patients/participants provided their written informed consent to participate in this study.
RH, TM, RZ, LZ, DS, HY, ZH, LC, and JZ: conception, design, data analysis, interpretation, manuscript writing, and final approval of the manuscript. RH, TM, and JZ: collection and/or assembly of data.
We thank the ArrayExpress (E-GEOD-69901 and E-MTAB-5151), Gene Expression Omnibus (GSE82152), Genotype-Tissue Expression Portal (GTEx), and Sequence Read Archive (SRA) (SRA713577) team for using their data.
The authors declare that the research was conducted in the absence of any commercial or financial relationships that could be construed as a potential conflict of interest.
We thank the ArrayExpress (E-GEOD-69901), Genotype-Tissue Expression Portal (GTEx), and Sequence Read Archive (SRA) (SRA713577) team for using their data.
The Supplementary Material for this article can be found online at: https://www.frontiersin.org/articles/10.3389/fbioe.2020.00101/full#supplementary-material
FIGURE S1 | The protein-protein interaction (PPI) network based on the all 2,314 differentially expressed genes (DEGs), which including 4,807 protein-protein interaction relationships related to 799 proteins. PPI, protein-protein interaction; DEG, differentially expressed gene.
FIGURE S2 | The composition (A) and heat map (B) of immune cells estimated by the next generation Cell type identification by estimating relative subsets of RNA transcripts (CIBERSORTx) algorithm in peripheral blood samples from SCI patients and normal control samples; Enable batch correction and disable quantile normalization algorithm were used to eliminate platform effect and batch effect between different dataset. (C) The violin plot identifying immune cells different from the two groups (the blue and red bar stand for SCI group and primary normal control samples, respectively). (D) The Principal Component Analysis (PCA) result of all samples suggesting the significant differences between the control group and the experimental group. (E) The co-expression heatmap illustrating the co-expression patterns among 22 types of immune cells. CIBERSORT, cell type identification by estimating relative subsets of RNA transcripts; SCI, spinal cord injury; PCA, principal component analysis.
FIGURE S3 | The protein-protein interaction (PPI) network comprised YY1, HAVCR2, CEBPB, LGALS9, key members of mTOR signaling pathway (MTOR, AKT1, MAPK1, WNT4, PIK3CB) and NK cell’s surface markers (CD56, CD16, CD94, CD3, NKp46). PPI, protein-protein interaction.
FIGURE S4 | Two volcano plot showing the results of differential expression analysis using two Affy Primeview dataset [GSE82152 (A) and E-MTAB-5151 (B)] including normal peripheral blood samples as the control group. The standard of DEGs was an absolute log fold change greater than 1 and false discovery rate (FDR) P value < 0.05.
TABLE S1 | The results of differential expression analysis of YY1, CEBPB, HAVCR2, LGALS9, MTOR, RPS6, RPS6KB1, and RPS6KB2 using GSE82152 and E-GEOD-69901 as control group and experimental group, respectively.
TABLE S2 | The results of differential expression analysis of YY1, CEBPB, HAVCR2, LGALS9, MTOR, RPS6, RPS6KB1, and RPS6KB2 using GSE82152 and E-GEOD-69901 as control group and experimental group, respectively.
CIBERSORT, cell type identification by estimating relative subsets of RNA transcripts; DEG, differential expression gene; FDR, false discovery rate; GO, gene ontology; GSVA, Gene Set Variation Analysis; GTEx, Genotype-Tissue Expression Portal; KEGG, Kyoto Encyclopedia of Genes and Genomes; NeP, neuropathic pain; PBMC, peripheral blood mononuclear cells; PCA, principal component analysis; PPI, protein-protein interaction; RPKM, Reads Per Kilobase per Million; SCI, spinal cord injury; SRA, Sequence Read Archive; TF, transcription factor; Tim-3, T-Cell Immunoglobulin Mucin Family Member 3; t-SNE, t-distributed Stochastic Neighbor Embedding; TSO, template switch oligo.
Almutairi, S. M., Ali, A. K., He, W., Yang, D. S., Ghorbani, P., Wang, L., et al. (2019). Interleukin-18 up-regulates amino acid transporters and facilitates amino acid-induced mTORC1 activation in natural killer cells. J. Biol. Chem. 294, 4644–4655. doi: 10.1074/jbc.RA118.005892
Aran, D., Looney, A. P., Liu, L., Wu, E., Fong, V., Hsu, A., et al. (2019). Reference-based analysis of lung single-cell sequencing reveals a transitional profibrotic macrophage. Nat. Immunol. 20, 163–172. doi: 10.1038/s41590-018-0276-y
Avery, L., Filderman, J., Szymczak-Workman, A. L., and Kane, L. P. (2018). Tim-3 co-stimulation promotes short-lived effector T cells, restricts memory precursors, and is dispensable for T cell exhaustion. Proc. Natl. Acad. Sci. U.S.A. 115, 2455–2460. doi: 10.1073/pnas.1712107115
Azarhomayoun, A., Aghasi, M., Mousavi, N., Shokraneh, F., Vaccaro, A. R., Haj Mirzaian, A., et al. (2018). Mortality rate and predicting factors of traumatic thoracolumbar spinal cord injury; a systematic review and meta-analysis. Bull. Emerg. Trauma 6, 181–194. doi: 10.29252/beat-060301
Balakrishnan, A., Stykel, M. G., Touahri, Y., Stratton, J. A., Biernaskie, J., and Schuurmans, C. (2016). Temporal analysis of gene expression in the murine schwann cell lineage and the acutely injured postnatal nerve. PLoS One 11:e0153256. doi: 10.1371/journal.pone.0153256
Brienza, D., Krishnan, S., Karg, P., Sowa, G., and Allegretti, A. L. (2018). Predictors of pressure ulcer incidence following traumatic spinal cord injury: a secondary analysis of a prospective longitudinal study. Spinal Cord 56, 28–34. doi: 10.1038/sc.2017.96
Brown, A., Nabel, A., Oh, W., Etlinger, J. D., and Zeman, R. J. (2014). Perfusion imaging of spinal cord contusion: injury-induced blockade and partial reversal by beta2-agonist treatment in rats. J. Neurosurg. Spine 20, 164–171. doi: 10.3171/2013.10.SPINE13113
Bryce, T. N., Biering-Sorensen, F., Finnerup, N. B., Cardenas, D. D., Defrin, R., Lundeberg, T., et al. (2012). International spinal cord injury pain classification: part I. Background and description. March 6-7, 2009. Spinal Cord 50, 413–417. doi: 10.1038/sc.2011.156
Budh, C. N., and Osteraker, A. L. (2007). Life satisfaction in individuals with a spinal cord injury and pain. Clin. Rehabil. 21, 89–96. doi: 10.1177/0269215506070313
Butler, A., Hoffman, P., Smibert, P., Papalexi, E., and Satija, R. (2018). Integrating single-cell transcriptomic data across different conditions, technologies, and species. Nat. Biotechnol. 36, 411–420. doi: 10.1038/nbt.4096
Chen, F., Sun, H., Zhao, Y., and Wang, H. (2017). YY1 in cell differentiation and tissue development. Crit. Rev. Oncog. 22, 131–141. doi: 10.1615/CritRevOncog.2017021311
Chen, K., Deng, S., Lu, H., Zheng, Y., Yang, G., Kim, D., et al. (2013). RNA-seq characterization of spinal cord injury transcriptome in acute/subacute phases: a resource for understanding the pathology at the systems level. PLoS One 8:e72567. doi: 10.1371/journal.pone.0072567
Cheshire, W. P., Santos, C. C., Massey, E. W., and Howard, J. F. Jr. (1996). Spinal cord infarction: etiology and outcome. Neurology 47, 321–330. doi: 10.1212/wnl.47.2.321
Chung, N. C., and Storey, J. D. (2015). Statistical significance of variables driving systematic variation in high-dimensional data. Bioinformatics 31, 545–554. doi: 10.1093/bioinformatics/btu674
Clayton, K. L., Haaland, M. S., Douglas-Vail, M. B., Mujib, S., Chew, G. M., Ndhlovu, L. C., et al. (2014). T cell Ig and mucin domain-containing protein 3 is recruited to the immune synapse, disrupts stable synapse formation, and associates with receptor phosphatases. J. Immunol. 192, 782–791. doi: 10.4049/jimmunol.1302663
Cohen, M., Giladi, A., Gorki, A. D., Solodkin, D. G., Zada, M., Hladik, A., et al. (2018). Lung single-cell signaling interaction map reveals basophil role in macrophage imprinting. Cell 175, 1031.e18–1044.e18.
Consortium, G. (2015). Human genomics. The Genotype-Tissue Expression (GTEx) pilot analysis: multitissue gene regulation in humans. Science 348, 648–660. doi: 10.1126/science.1262110
Efremova, M., Vento-Tormo, M., Teichmann, S. A., and Vento-Tormo, R. (2019). CellPhoneDB v2.0: inferring cell-cell communication from combined expression of multi-subunit receptor-ligand complexes. bioRxiv [Preprint].
Finnerup, N. B., Attal, N., Haroutounian, S., Mcnicol, E., Baron, R., Dworkin, R. H., et al. (2015). Pharmacotherapy for neuropathic pain in adults: a systematic review and meta-analysis. Lancet Neurol. 14, 162–173. doi: 10.1016/S1474-4422(14)70251-0
Franzen, O., Gan, L. M., and Bjorkegren, J. L. M. (2019). PanglaoDB: a web server for exploration of mouse and human single-cell RNA sequencing data. Database 2019:baz046. doi: 10.1093/database/baz046
Freytag, S., Tian, L., Lonnstedt, I., Ng, M., and Bahlo, M. (2018). Comparison of clustering tools in R for medium-sized 10x Genomics single-cell RNA-sequencing data. F1000Reserach 7:1297. doi: 10.12688/f1000research.15809.2
Gleason, M. K., Lenvik, T. R., Mccullar, V., Felices, M., O’brien, M. S., Cooley, S. A., et al. (2012). Tim-3 is an inducible human natural killer cell receptor that enhances interferon gamma production in response to galectin-9. Blood 119, 3064–3072. doi: 10.1182/blood-2011-06-360321
Goncalves Silva, I., Yasinska, I. M., Sakhnevych, S. S., Fiedler, W., Wellbrock, J., Bardelli, M., et al. (2017). The Tim-3-galectin-9 secretory pathway is involved in the immune escape of human acute myeloid leukemia cells. EBioMedicine 22, 44–57. doi: 10.1016/j.ebiom.2017.07.018
Gong, X., Zhang, L., Huang, T., Lin, T. V., Miyares, L., Wen, J., et al. (2015). Activating the translational repressor 4E-BP or reducing S6K-GSK3beta activity prevents accelerated axon growth induced by hyperactive mTOR in vivo. Hum. Mol. Genet. 24, 5746–5758. doi: 10.1093/hmg/ddv295
Gorman, J. V., and Colgan, J. D. (2014). Regulation of T cell responses by the receptor molecule Tim-3. Immunol. Res. 59, 56–65. doi: 10.1007/s12026-014-8524-1
Graumann, U., Ritz, M. F., and Hausmann, O. (2011). Necessity for re-vascularization after spinal cord injury and the search for potential therapeutic options. Curr. Neurovasc. Res. 8, 334–341. doi: 10.2174/156720211798121007
Herman, P., Stein, A., Gibbs, K., Korsunsky, I., Gregersen, P., and Bloom, O. (2018). Persons with chronic spinal cord injury have decreased natural killer cell and increased toll-like receptor/inflammatory gene expression. J. Neurotrauma 35, 1819–1829. doi: 10.1089/neu.2017.5519
Hiramoto, R., Ghanta, V., Solvason, B., Lorden, J., Hsueh, C. M., Rogers, C., et al. (1993). Identification of specific pathways of communication between the CNS and NK cell system. Life Sci. 53, 527–540. doi: 10.1016/0024-3205(93)90709-c
Hou, R., Denisenko, E., and Forrest, A. R. R. (2019). scMatch: a single-cell gene expression profile annotation tool using reference datasets. Bioinformatics 35, 4688–4695. doi: 10.1093/bioinformatics/btz292
Junker, V., Becker, A., Huhne, R., Zembatov, M., Ravati, A., Culmsee, C., et al. (2002). Stimulation of beta-adrenoceptors activates astrocytes and provides neuroprotection. Eur. J. Pharmacol. 446, 25–36. doi: 10.1016/s0014-2999(02)01814-9
Kanno, H., Ozawa, H., Sekiguchi, A., Yamaya, S., Tateda, S., Yahata, K., et al. (2012). The role of mTOR signaling pathway in spinal cord injury. Cell Cycle 11, 3175–3179. doi: 10.4161/cc.21262
Kim, T. J., Kim, M., Kim, H. M., Lim, S. A., Kim, E. O., Kim, K., et al. (2014). Homotypic NK cell-to-cell communication controls cytokine responsiveness of innate immune NK cells. Sci. Rep. 4:7157. doi: 10.1038/srep07157
Kumar, P. (2018). Future biomaterials for enhanced cell-substrate communication in spinal cord injury intervention. Future Sci. OA 4:Fso268. doi: 10.4155/fsoa-2017-0130
Laginha, I., Kopp, M. A., Druschel, C., Schaser, K. D., Brommer, B., Hellmann, R. C., et al. (2016). Natural killer (NK) cell functionality after human spinal cord injury (SCI): protocol of a prospective, longitudinal study. BMC Neurol. 16:170. doi: 10.1186/s12883-016-0681-5
Lee, J. M., Yan, P., Xiao, Q., Chen, S., Lee, K. Y., Hsu, C. Y., et al. (2008). Methylprednisolone protects oligodendrocytes but not neurons after spinal cord injury. J. Neurosci. 28, 3141–3149. doi: 10.1523/JNEUROSCI.5547-07.2008
Li, C. Y., Li, X., Liu, S. F., Qu, W. S., Wang, W., and Tian, D. S. (2015). Inhibition of mTOR pathway restrains astrocyte proliferation, migration and production of inflammatory mediators after oxygen-glucose deprivation and reoxygenation. Neurochem. Int. 83-84, 9–18. doi: 10.1016/j.neuint.2015.03.001
Loy, D. N., Crawford, C. H., Darnall, J. B., Burke, D. A., Onifer, S. M., and Whittemore, S. R. (2002). Temporal progression of angiogenesis and basal lamina deposition after contusive spinal cord injury in the adult rat. J. Comp. Neurol. 445, 308–324. doi: 10.1002/cne.10168
Lv, B., Huo, F., Zhu, Z., Xu, Z., Dang, X., Chen, T., et al. (2016). Crocin upregulates CX3CR1 expression by suppressing NF-kappaB/YY1 signaling and inhibiting lipopolysaccharide-induced microglial activation. Neurochem. Res. 41, 1949–1957. doi: 10.1007/s11064-016-1905-1
Metz, G. A., Curt, A., Van De Meent, H., Klusman, I., Schwab, M. E., and Dietz, V. (2000). Validation of the weight-drop contusion model in rats: a comparative study of human spinal cord injury. J. Neurotrauma 17, 1–17. doi: 10.1089/neu.2000.17.1
Mukherjee, S., Fried, A., Hussaini, R., White, R., Baidoo, J., Yalamanchi, S., et al. (2018). Phytosomal curcumin causes natural killer cell-dependent repolarization of glioblastoma (GBM) tumor-associated microglia/macrophages and elimination of GBM and GBM stem cells. J. Exp. Clin. Cancer Res. 37:168. doi: 10.1186/s13046-018-0792-5
Musubire, A. K., Meya, D. B., Katabira, E. T., Meyer, A. C. L., Bohjanen, P. R., Boulware, D. R., et al. (2019). Epidemiology of non-traumatic spinal cord injury in Uganda: a single center, prospective study with MRI evaluation. BMC Neurol. 19:10. doi: 10.1186/s12883-019-1236-3
Nair, S., Fang, M., and Sigal, L. J. (2015). The natural killer cell dysfunction of aged mice is due to the bone marrow stroma and is not restored by IL-15/IL-15Ralpha treatment. Aging Cell 14, 180–190. doi: 10.1111/acel.12291
Natinal Spinal Cord Injury Statistical Center [NSCISC], (2014). Spinal cord injury facts and figures at a glance. J. Spinal Cord Med. 37, 355–356.
New, P. W., Cripps, R. A., and Bonne Lee, B. (2014). Global maps of non-traumatic spinal cord injury epidemiology: towards a living data repository. Spinal Cord 52, 97–109. doi: 10.1038/sc.2012.165
Newman, A. M., Liu, C. L., Green, M. R., Gentles, A. J., Feng, W., Xu, Y., et al. (2015). Robust enumeration of cell subsets from tissue expression profiles. Nat. Methods 12, 453–457. doi: 10.1038/nmeth.3337
Newman, A. M., Steen, C. B., Liu, C. L., Gentles, A. J., Chaudhuri, A. A., Scherer, F., et al. (2019). Determining cell type abundance and expression from bulk tissues with digital cytometry. Nat. Biotechnol. 37, 773–782. doi: 10.1038/s41587-019-0114-2
Pinzon, A., Marcillo, A., Quintana, A., Stamler, S., Bunge, M. B., Bramlett, H. M., et al. (2008). A re-assessment of minocycline as a neuroprotective agent in a rat spinal cord contusion model. Brain Res. 1243, 146–151. doi: 10.1016/j.brainres.2008.09.047
Pouw, M. H., Hosman, A. J., Van Kampen, A., Hirschfeld, S., Thietje, R., and Van De Meent, H. (2011). Is the outcome in acute spinal cord ischaemia different from that in traumatic spinal cord injury? A cross-sectional analysis of the neurological and functional outcome in a cohort of 93 paraplegics. Spinal Cord 49, 307–312. doi: 10.1038/sc.2010.114
Powell, J. D., Pollizzi, K. N., Heikamp, E. B., and Horton, M. R. (2012). Regulation of immune responses by mTOR. Annu. Rev. Immunol. 30, 39–68. doi: 10.1146/annurev-immunol-020711-075024
Prokhorov, A., Gibbs, B. F., Bardelli, M., Ruegg, L., Fasler-Kan, E., Varani, L., et al. (2015). The immune receptor Tim-3 mediates activation of PI3 kinase/mTOR and HIF-1 pathways in human myeloid leukaemia cells. Int. J. Biochem. Cell Biol. 59, 11–20. doi: 10.1016/j.biocel.2014.11.017
Ritchie, M. E., Phipson, B., Wu, D., Hu, Y., Law, C. W., Shi, W., et al. (2015). limma powers differential expression analyses for RNA-sequencing and microarray studies. Nucleic Acids Res. 43:e47. doi: 10.1093/nar/gkv007
Rostamzadeh, D., Yousefi, M., Haghshenas, M. R., Ahmadi, M., Dolati, S., and Babaloo, Z. (2019). mTOR Signaling pathway as a master regulator of memory CD8(+) T-cells, Th17, and NK cells development and their functional properties. J. Cell. Physiol. 234, 12353–12368. doi: 10.1002/jcp.28042
Scholpa, N. E., Williams, H., Wang, W., Corum, D., Narang, A., Tomlinson, S., et al. (2019). Pharmacological stimulation of mitochondrial biogenesis using the food and drug administration-approved beta2-adrenoreceptor agonist formoterol for the treatment of spinal cord injury. J. Neurotrauma 36, 962–972. doi: 10.1089/neu.2018.5669
Siddall, P. J., Mcclelland, J. M., Rutkowski, S. B., and Cousins, M. J. (2003). A longitudinal study of the prevalence and characteristics of pain in the first 5 years following spinal cord injury. Pain 103, 249–257. doi: 10.1016/s0304-3959(02)00452-9
Stratton, J. A., Kumar, R., Sinha, S., Shah, P., Stykel, M., Shapira, Y., et al. (2017). Purification and characterization of schwann cells from adult human skin and nerve. eNeuro 4:ENEURO.307-16.2017. doi: 10.1523/ENEURO.0307-16.2017
Szklarczyk, D., Gable, A. L., Lyon, D., Junge, A., Wyder, S., Huerta-Cepas, J., et al. (2019). STRING v11: protein-protein association networks with increased coverage, supporting functional discovery in genome-wide experimental datasets. Nucleic Acids Res. 47, D607–D613. doi: 10.1093/nar/gky1131
Takeura, N., Nakajima, H., Watanabe, S., Honjoh, K., Takahashi, A., and Matsumine, A. (2019). Role of macrophages and activated microglia in neuropathic pain associated with chronic progressive spinal cord compression. Sci. Rep. 9:15656. doi: 10.1038/s41598-019-52234-1
Turker, B., Uz, B., Isik, M., Bektas, O., Demiroglu, H., Sayinalp, N., et al. (2012). Nasal natural killer/T-cell lymphoma with skin, eye, and peroneal nerve involvement. Turk. J. Haematol. 29, 413–419. doi: 10.5505/tjh.2012.03360
Van Niekerk, E. A., Tuszynski, M. H., Lu, P., and Dulin, J. N. (2016). Molecular and cellular mechanisms of axonal regeneration after spinal cord injury. Mol. Cell. Proteom. 15, 394–408. doi: 10.1074/mcp.R115.053751
Vento-Tormo, R., Efremova, M., Botting, R. A., Turco, M. Y., Vento-Tormo, M., Meyer, K. B., et al. (2018). Single-cell reconstruction of the early maternal-fetal interface in humans. Nature 563, 347–353. doi: 10.1038/s41586-018-0698-6
Werhagen, L., Budh, C. N., Hultling, C., and Molander, C. (2004). Neuropathic pain after traumatic spinal cord injury–relations to gender, spinal level, completeness, and age at the time of injury. Spinal Cord 42, 665–673. doi: 10.1038/sj.sc.3101641
Xie, L., Sun, F., Wang, J., Mao, X., Xie, L., Yang, S. H., et al. (2014). mTOR signaling inhibition modulates macrophage/microglia-mediated neuroinflammation and secondary injury via regulatory T cells after focal ischemia. J. Immunol. 192, 6009–6019. doi: 10.4049/jimmunol.1303492
Xu, C., Ge, H., Wang, T., Qin, J., Liu, and Liu, Y. (2018). Increased expression of T cell immunoglobulin and mucin domain 3 on CD14(+) monocytes is associated with systemic inflammatory reaction and brain injury in patients with spontaneous intracerebral hemorrhage. J. Stroke Cerebrovasc. Dis. 27, 1226–1236. doi: 10.1016/j.jstrokecerebrovasdis.2017.11.041
Xu, L., Zhang, Y., Zhang, R., Zhang, H., Song, P., Ma, T., et al. (2019). Elevated plasma BDNF levels are correlated with NK cell activation in patients with traumatic spinal cord injury. Int. Immunopharmacol. 74:105722. doi: 10.1016/j.intimp.2019.105722
Yu, G., Wang, L. G., Han, Y., and He, Q. Y. (2012). clusterProfiler: an R package for comparing biological themes among gene clusters. Omics 16, 284–287. doi: 10.1089/omi.2011.0118
Yuan, Y., Wang, Y., Hu, F. F., Jiang, C. Y., Zhang, Y. J., Yang, J. L., et al. (2016). Cadmium activates reactive oxygen species-dependent AKT/mTOR and mitochondrial apoptotic pathways in neuronal cells. Biomed. Environ. Sci. 29, 117–126. doi: 10.3967/bes2016.013
Yune, T. Y., Lee, J. Y., Jung, G. Y., Kim, S. J., Jiang, M. H., Kim, Y. C., et al. (2007). Minocycline alleviates death of oligodendrocytes by inhibiting pro-nerve growth factor production in microglia after spinal cord injury. J. Neurosci. 27, 7751–7761. doi: 10.1523/jneurosci.1661-07.2007
Zeman, R. J., Feng, Y., Peng, H., and Etlinger, J. D. (1999). Clenbuterol, a beta(2)-adrenoceptor agonist, improves locomotor and histological outcomes after spinal cord contusion in rats. Exp. Neurol. 159, 267–273. doi: 10.1006/exnr.1999.7146
Zeman, R. J., Peng, H., Feng, Y., Song, H., Liu, X., and Etlinger, J. D. (2006). Beta2-adrenoreceptor agonist-enhanced recovery of locomotor function after spinal cord injury is glutathione dependent. J. Neurotrauma 23, 170–180. doi: 10.1089/neu.2006.23.170
Zhang, X., Lan, Y., Xu, J., Quan, F., Zhao, E., Deng, C., et al. (2019). CellMarker: a manually curated resource of cell markers in human and mouse. Nucleic Acids Res. 47, D721–D728. doi: 10.1093/nar/gky900
Zhou, M., Zhao, H., Xu, W., Bao, S., Cheng, L., and Sun, J. (2017). Discovery and validation of immune-associated long non-coding RNA biomarkers associated with clinically molecular subtype and prognosis in diffuse large B cell lymphoma. Mol. Cancer 16:16. doi: 10.1186/s12943-017-0580-4
Zhou, X., Franklin, R. A., Adler, M., Jacox, J. B., Bailis, W., Shyer, J. A., et al. (2018). Circuit design features of a stable two-cell system. Cell 172, 744.e17–757.e17. doi: 10.1016/j.cell.2018.01.015
Keywords: spinal cord injury, neuropathic pain, peripheral blood, single-cell sequencing, cellular communication
Citation: Huang R, Meng T, Zhu R, Zhao L, Song D, Yin H, Huang Z, Cheng L and Zhang J (2020) The Integrated Transcriptome Bioinformatics Analysis Identifies Key Genes and Cellular Components for Spinal Cord Injury-Related Neuropathic Pain. Front. Bioeng. Biotechnol. 8:101. doi: 10.3389/fbioe.2020.00101
Received: 18 November 2019; Accepted: 03 February 2020;
Published: 19 February 2020.
Edited by:
Jianzhong Su, Wenzhou Medical University, ChinaReviewed by:
Michael Poidinger, Royal Children’s Hospital, AustraliaCopyright © 2020 Huang, Meng, Zhu, Zhao, Song, Yin, Huang, Cheng and Zhang. This is an open-access article distributed under the terms of the Creative Commons Attribution License (CC BY). The use, distribution or reproduction in other forums is permitted, provided the original author(s) and the copyright owner(s) are credited and that the original publication in this journal is cited, in accordance with accepted academic practice. No use, distribution or reproduction is permitted which does not comply with these terms.
*Correspondence: Zongqiang Huang, Z3podWFuZ3pxQDE2My5jb20=; Liming Cheng, bWVuZ3RvbmdAbWVkbWFpbC5jb20uY24=; bGltaW5nY2hlbmdAdG9uZ2ppLmVkdS5jbg==; Jie Zhang, amllemhhbmdAdG9uZ2ppLmVkdS5jbg==
†These authors have contributed equally to this work and share first authorship
Disclaimer: All claims expressed in this article are solely those of the authors and do not necessarily represent those of their affiliated organizations, or those of the publisher, the editors and the reviewers. Any product that may be evaluated in this article or claim that may be made by its manufacturer is not guaranteed or endorsed by the publisher.
Research integrity at Frontiers
Learn more about the work of our research integrity team to safeguard the quality of each article we publish.