- Department of Computational Biology, Indraprastha Institute of Information Technology, New Delhi, India
Transcription factors are essential DNA-binding proteins that regulate the transcription rate of several genes and control the expression of genes inside a cell. The prediction of transcription factors with high precision is important for understanding biological processes such as cell differentiation, intracellular signaling, and cell-cycle control. In this study, we developed a hybrid method that combines alignment-based and alignment-free methods for predicting transcription factors with higher accuracy. All models have been trained, tested, and evaluated on a large dataset that contains 19,406 transcription factors and 523,560 non-transcription factor protein sequences. To avoid biases in evaluation, the datasets were divided into training and validation/independent datasets, where 80% of the data was used for training, and the remaining 20% was used for external validation. In the case of alignment-free methods, models were developed using machine learning techniques and the composition-based features of a protein. Our best alignment-free model obtained an AUC of 0.97 on an independent dataset. In the case of the alignment-based method, we used BLAST at different cut-offs to predict the transcription factors. Although the alignment-based method demonstrated excellent performance, it was unable to cover all transcription factors due to instances of no hits. To combine the strengths of both methods, we developed a hybrid method that combines alignment-free and alignment-based methods. In the hybrid method, we added the scores of the alignment-free and alignment-based methods and achieved a maximum AUC of 0.99 on the independent dataset. The method proposed in this study performs better than existing methods. We incorporated the best models in the webserver/Python Package Index/standalone package of “TransFacPred” (https://webs.iiitd.edu.in/raghava/transfacpred).
1 Introduction
Transcription factors (TFs) are DNA-binding proteins that bind to specific DNA segments to control the expression of the genes (Ortet et al., 2012; Lambert et al., 2018; Miyazaki and Miyazaki, 2021). These TFs or regulators control specific cell types, cell differentiation, gene regulatory pathways, and immune responses (Fong and Tapscott, 2013; Lee and Young, 2013; Singh et al., 2014). Recognition of TFs is the first step in understanding the transcription regulatory system (Kim et al., 2021). Mis-regulation and mutations in TFs or their binding regions lead to the development of disorders like Rubinstein–Taybi, CHOPS syndromes, Coffin–Siris, etc. (Lee and Young, 2013; Sim et al., 2015; Izumi, 2016; Kircher et al., 2019). Several biological mechanisms such as chromosomal translocation, aberrant gene expression, point substitutions, and mutations associated with the non-coding DNA result in the alteration of transcription factor binding sites in various cancer types (Kleinjan and van Heyningen, 2005; Herceg and Hainaut, 2007; Bushweller, 2019; Jiramongkol and Lam, 2020; Kishtagari et al., 2020). In addition, several inflammatory autoimmune diseases and improper immune development are associated with the misregulation of the NF-kB transcription factor (Hayden and Ghosh, 2012). Studies have also revealed that, with a better understanding of the transcriptional regulations, it is possible to control gene expression in various genetic perturbations (Munsky et al., 2012; Lee and Young, 2013; Kemmeren et al., 2014). Several attempts in clinical research have been made to target, inhibit, or modulate transcription factor DNA-binding activity in various disease conditions (Bhagwat and Vakoc, 2015; Cheng et al., 2019; Li et al., 2020).
With the availability of enormous genome sequencing datasets, many methods have been developed to identify TFs (Pereira et al., 2020). It is not feasible to identify TFs in genomics using experimental techniques. In order to overcome these limitations, a number of in silico methods have been developed to annotate TFs at the genome scale (Odom, 2011). Zheng and colleagues developed a hybrid strategy utilizing support vector machine (SVM) and error-correcting output coding (ECOC) algorithms to predict distinct categories of TFs, such as helix-turn-helix, beta-scaffold, and zinc-coordinating DNA-binding domains (Zheng et al., 2008). Eichner and colleagues developed a four-step workflow that implemented two complementary tools, TFpredict and SABINE, for identifying the DNA-binding domains and discovering the DNA motif in a protein. TFpredict uses machine/deep learning techniques to predict a transcription factor (Eichner et al., 2013). Another tool, BART, has been developed to predict functional factors that bind at cis-regulatory regions from a gene list or a ChIP-seq dataset (Wang et al., 2018). Recently, Kim et al. developed DeepTFactor, a deep learning-based tool that predicts TFs using a convolutional neural network (Kim et al., 2021). That study created and used the largest possible dataset to develop an accurate and reliable method. The existing methods are computationally expensive and need domain expertise (e.g., understanding sources, types of information, and limitations of the data).
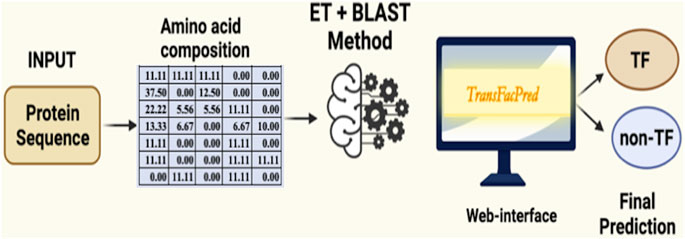
In order to overcome the limitations of existing methods, we developed an improved method for predicting transcription factors with high accuracy. Initially, we developed homology or alignment-based methods for the prediction of the TFs. These alignment-based methods exhibit high performance if the query TF has high similarity with the target TFs in the database. However, these methods fail if a query TF has either poor similarity with the known TFs in the database or high similarity with non-TFs. We developed an alignment-free method to overcome these limitations. In alignment-free methods, different machine learning techniques are used to build prediction models using the composition of TFs as an input feature. To combine the power of both alignment-free and alignment-based methods, we developed a hybrid method. The hybrid method leverages the efficiency and scalability of alignment-free techniques while incorporating the precision of alignment-based approaches, aiming to maximize predictive performance and overcome the limitations inherent in using either method alone. This integrated strategy ensures robust and comprehensive analysis, enhancing the accuracy and reliability of transcription factor predictions. To support the scientific community, we developed the web server and standalone software package TransFacPred, which is freely available at https://webs.iiitd.edu.in/raghava/transfacpred and https://github.com/raghavagps/transfacpred for predicting transcription factors from protein sequences.
2 Materials and methods
2.1 Dataset collection and preprocessing
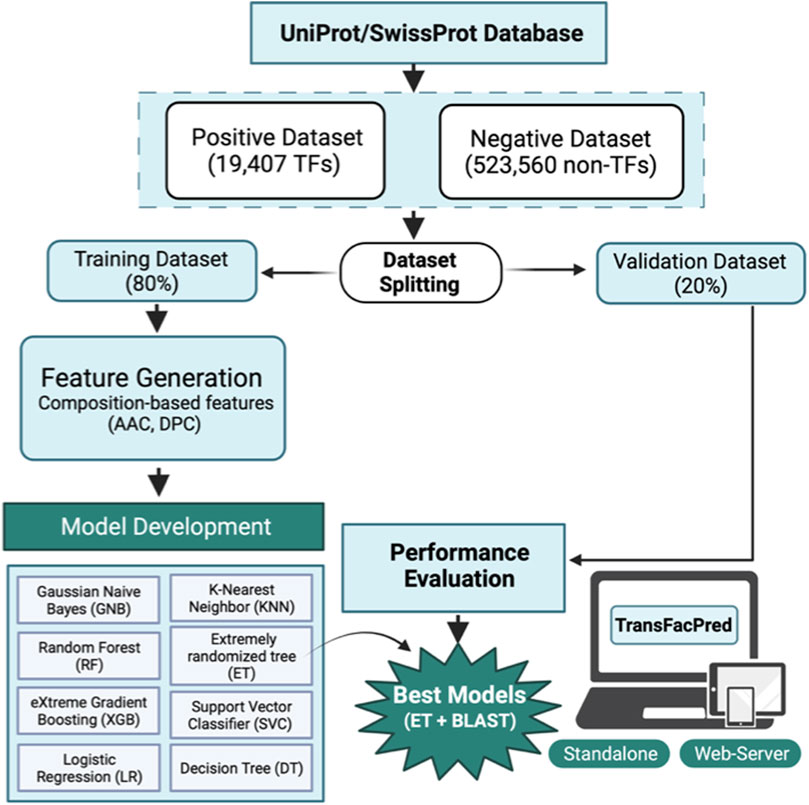
We obtained the TF and non-TF protein sequence dataset, which was released in September 2019, from the UniProt Knowledgebase (UniProtKB)/Swiss-Prot database (Bairoch and Apweiler, 2000; Boutet et al., 2007). The dataset was parsed and classified into TFs and non-TFs using the Gene Ontology (GO) annotation. A protein sequence entry was annotated as a TF if it met the following criteria: a) the entry has a GO annotation for TF activity, or b) the entry has both a DNA-binding-related GO annotation and a transcription regulation-related GO annotation. The complete table for GO terms used to classify the TFs and non-TFs is provided in Supplementary Table S1. Here, we obtained 21,802 TF sequences and 539,374 non-TF sequences. We have developed a generalized method to predict the transcription factor. Therefore, we included transcription factor sequences from a diverse array of organisms. Nearly 9% of the transcription factor sequences in our dataset belong to Homo sapiens, about 8% are derived from Arabidopsis thaliana, approximately 6% come from Mus musculus, and around 2% are from Rattus norvegicus. The remaining sequences encompass a variety of other organisms, ensuring a broad and comprehensive dataset that supports the generalization capabilities of TransFacPred. This diverse inclusion aims to facilitate accurate transcription factor prediction across different species, paving the way for future developments that may include organism-specific methods to further refine and enhance prediction accuracy. We removed redundant sequences and sequences with non-natural amino acids from the TF and non-TF datasets. For the positive dataset, we obtained 19,406 unique TF sequences out of 21,802 sequences. For the negative dataset, we obtained 523,560 non-TF sequences from 539,374 entries. The final dataset comprises 19,406 TFs (positive) and 523,560 non-TFs (negative) protein sequences. Then, we followed the standards used in previous studies (Dhall et al., 2021; Dhall et al., 2022) and split the whole dataset into an 80% training dataset comprising 434,373 sequences (15,525 TFs and 418,848 non-TFs) and a 20% independent dataset containing 108,594 sequences (3,882 TFs and 104,712 non-TFs). As of June 2024, the March 2024 release of Swiss-Prot contains a total of 571,609 proteins, of which 25,052 have been designated as transcription factors based on the above-mentioned criteria. After processing these transcription factor protein sequences, we had a total of 21,125 sequences after removing the redundant sequences and sequences with non-natural amino acids. Among these, 1719 sequences were newly identified and were not available in the September 2019 release. These new sequences, along with additional relevant information, are detailed in Supplementary Table S2.
2.2 Feature generation
2.2.1 Composition-based features
Pfeature (Pande et al., 2023) was used in this study to compute the amino acid composition- (AAC) and dipeptide composition (DPC)-based features of positive and negative datasets. In the case of AAC, a feature vector of length 20 was generated (using Eq. 1), which represents the composition of 20 amino acids in the sequence. Dipeptide composition is used to encapsulate the global information about each sequence, which gives a fixed vector of length 400 (20 × 20) using Eq. 2.
where
where
2.2.2 One-hot encoding (OHE)
We implemented one-hot encoding approach for feature generation using TF and non-TF sequences. It is a representation of categorical variables as binary vectors. First, it requires that the categorical values be mapped to integer values. Then, each integer value is represented as a binary vector that is all zero values except the index of the integer, which is marked with a 1. In OHE, each amino acid is represented by the vector size of length 21; for instance, A is described as 1,0,0,0,0,0,0,0,0,0,0,0,0,0,0,0,0,0,0,0,0; which consists of 20 natural amino acids and one dummy variable, whereas X is represented as 0,0,0,0,0,0,0,0,0,0,0,0,0,0,0,0,0,0,0,0,0.
2.3 Model development
We implemented a number of classifiers to develop prediction models to predict the transcription factors using sequence information. Here, we used Scikit-learn-based traditional machine learning algorithms such as decision tree (DT), eXtreme gradient boosting (XGB), random forest (RF), Gaussian naïve Bayes (GNB), K-nearest neighbor (KNN), extra tree (ET), logistic regression (LR), and support vector classifier (SVC). We implemented a variety of classifiers based on different algorithms, such as DT, RF, and ET, which are tree-based approaches. DT is a non-parametric supervised learning method. It works by splitting the data into subsets based on the most significant feature at each node, leading to a tree-like model of decisions. RF is an ensemble method that constructs multiple decision trees during training. It outputs the class, which is the mode of the classes of the individual trees, improving predictive accuracy and controlling overfitting. ET is similar to RF but differs in the way splits are chosen. ET selects splits randomly, reducing variance and improving the model’s robustness. XGB is a boosting-based approach; it is an advanced implementation of gradient boosting. It builds trees sequentially, with each tree correcting errors from the previous trees, leading to high predictive performance and robustness against overfitting. GNB is a Bayesian-based approach that is based on Bayes’ theorem with the assumption of feature independence. It models the distribution of the data using Gaussian distributions. KNN is an instance-based learning method that classifies a sample based on the majority label among its closest neighbors in the feature space. It is simple and effective but can be computationally intensive. LR models the probability of a binary outcome using a logistic function. It is a linear model used for binary classification, where the output is interpreted as the probability of a particular class. SVC constructs hyperplanes in a high-dimensional space to separate different classes. It optimizes the margin between the classes, which helps improve classification accuracy and generalization.
We employed a hyperparameter tuning technique using the grid search approach available in Python’s Scikit-learn library to identify the optimal parameters for each classifier. This method exhaustively searches over a specified parameter grid to determine the best combination of parameters that yields the highest performance for each model. The most effective parameters and their corresponding values, as determined by grid search, are documented in Supplementary Table S3. This table provides a comprehensive overview of the tuned parameters for each classifier, ensuring reproducibility and transparency of the results.
2.4 Five-fold cross-validation
To avoid the curse of biases and overfitting of models, we performed five-fold cross-validation on the training dataset (Patiyal et al., 2020; Dhall et al., 2021; Patiyal et al., 2022). In this approach, the training dataset is stratified into five sets, where the model is trained on four sets and tested on the remaining one. The same process is repeated five times in such a way that each set acts as a testing dataset. The final performance is the average of performances resulting from each iteration.
2.5 Similarity search approach
We also implemented similarity search using BLAST (McGinnis and Madden, 2004), a widely used tool to annotate the sequences. We used it to classify the sequences as transcription factors or non-transcription factors based on their similarity. The BLASTP suite of NCBI-BLAST + version 2.2.29 was used to perform the similarity search. The training dataset was used to create the custom database, and the makeblastdb application of NCBI-BLAST+ was used for the same. Sequences in the independent dataset were hit against the custom database to assign the class as a transcription factor or non-transcription factor based on their similarity with the sequences in the database. We considered the top hit of BLAST to assign the classes, such that if the top hit of the BLAST is against the transcription factor sequence of the database, then the query protein is assigned as a transcription factor; otherwise, it was labeled as a non-transcription factor. We ran the BLAST at different e-value cut-offs varying from 1e − 6 to 1e + 3 in order to find the optimal value to classify the transcription factors.
2.6 Performance evaluation
We used various performance evaluation parameters such as accuracy, sensitivity, specificity, F1-score, area under the receiver operating characteristics curve (AUC), and Matthews correlation coefficient (MCC). Sensitivity (see Eq. (3)), specificity (see Eq. (4)), accuracy (see Eq. 5), F1-score (see Eq. (6)), and MCC (see Eq. (7)) are threshold-dependent parameters. In contrast, AUC is a threshold-independent parameter. The various performance evaluation parameter equations are provided below.
where
3 Results
3.1 Compositional analysis
We performed the amino acid-based compositional analysis for the TF, non-TF, and general proteome classes to compare the abundance of the residues in these classes. Figure 1 represents the average percent composition of each residue in proteins belonging to the TF and non-TF classes. It compares the same with the average percent composition of general proteome derived from the Swiss-Prot database. As exhibited by the bar plot, transcription factors are rich in E, P, Q, R, and S residues compared to the non-transcription factors, whereas residues A, G, I, and V are abundant in non-transcription factor proteins.
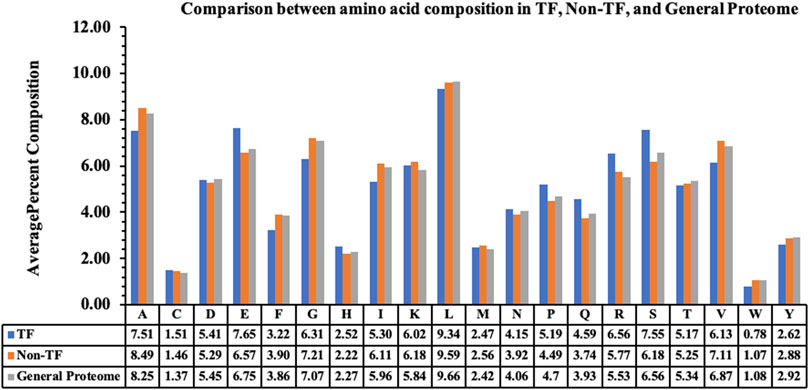
Figure 1. Average percent composition of amino acid residues in TFs, Non-TFs, and the general proteome.
3.2 Performance on alignment-based method
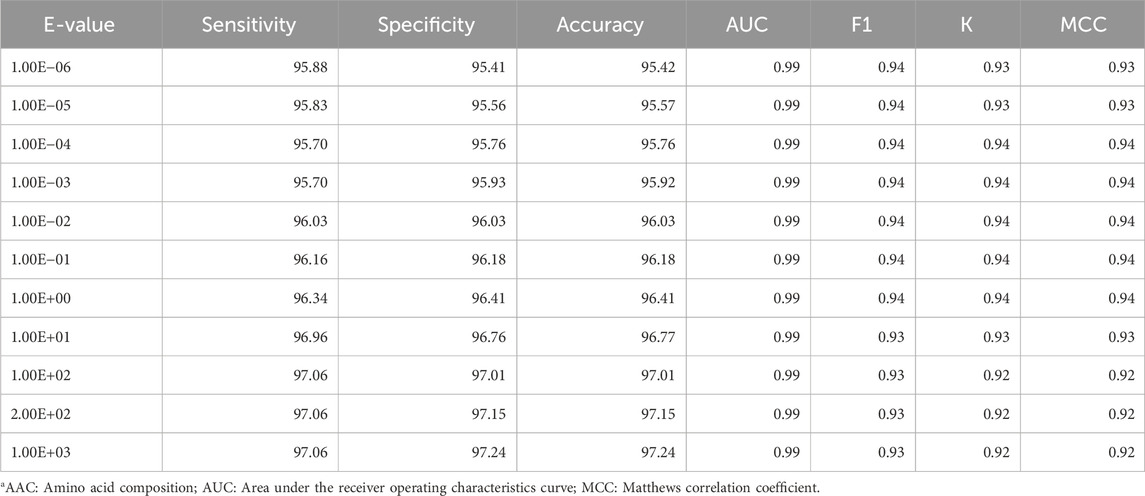
To classify the transcription factors using an alignment-based method, we performed the similarity search using BLAST by varying the e-value from 1.00E−06 to 1.00E+03. In this approach, we created the database using the sequences in the training dataset, hit the query proteins in the independent dataset against it, and considered the top hit to assign the class to each query protein. The performance at each value is reported in Table 1. As shown in Table 1, BLAST achieved a good performance for predicting the transcription factors but could not cover the entire dataset. Moreover, as the e-value increases, the probability of a correct prediction decreases. Hence, BLAST alone is not sufficient for predicting the transcription factors.
3.3 Performance on alignment-free methods
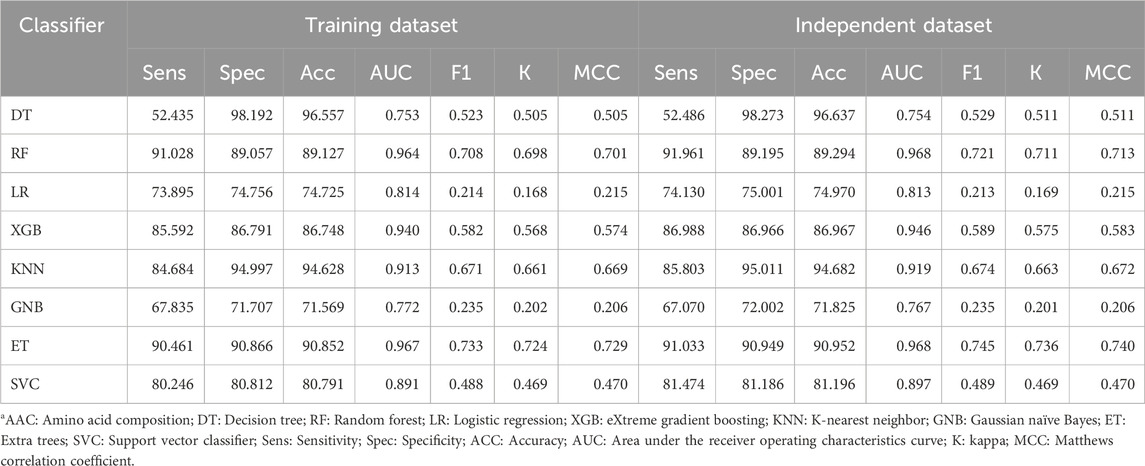
We implemented eight traditional machine learning classifiers, such as DT, RF, LR, XGB, GNB, KNN, ET, and SVC, using various features like AAC, DPC, and AAC + DPC as the input feature to classify the protein sequences into TFs and non-TFs. We trained the model on the 80% training dataset and evaluated its performance on the remaining 20% independent dataset. First, we developed various prediction models using AAC, and the performance of each classifier is reported in Table 2. As shown by Table 2, the ET-based model outperforms the other models with an AUC of 0.97 on the training and independent datasets with balanced sensitivity and specificity.
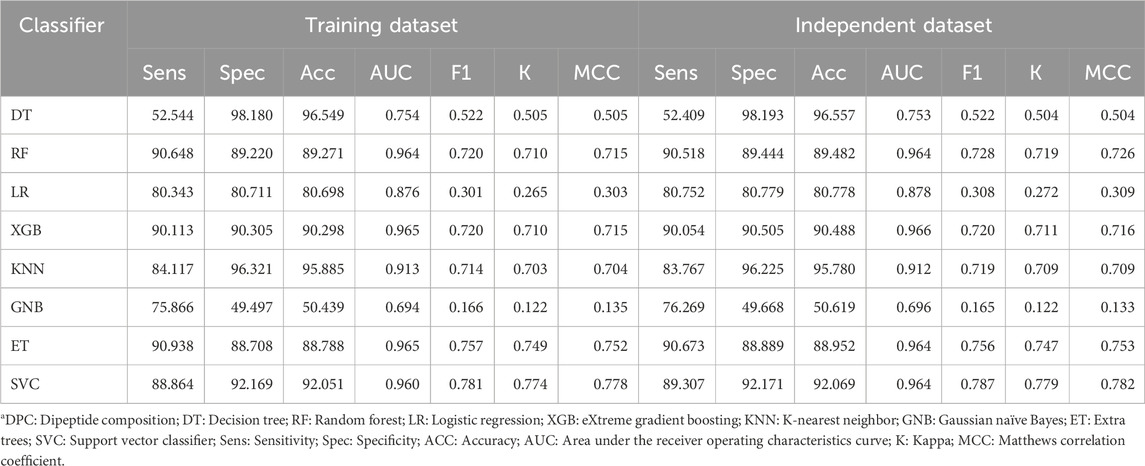
Similarly, various machine learning models were developed to classify TFs using DPC as the input feature. Table 3 represents the performance of models based on each classifier, and the model based on the XGB classifier performed best among the other classifiers with an AUC of 0.96 on the training and validation dataset.
In the next step, we combined the AAC and DPC features, which resulted in a vector of size 420 for each protein, and developed prediction models. We used eight different classifiers, and their performance is reported in Table 4. Similar to the performance on individual features, the XGB-based model performed best among all the other classifiers with an AUC of 0.97 on the training and independent datasets.
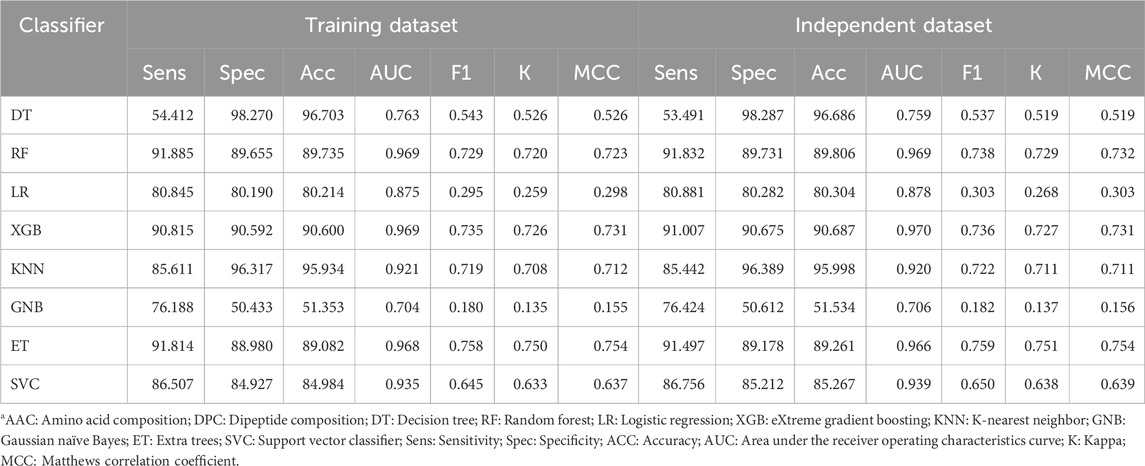
Table 4. Performance of various classifiers using a combination of AAC and DPC as the input feature.
3.4 Performance of deep learning models
We also developed deep learning technique-based prediction models to classify the TFs using different features such as AAC, DPC, AAC + DPC, and one-hot encoding (OHE). Table 5 exhibits the performance of the different models on the validation datasets using different features. As shown in Table 5, the CNN-based model with one-hot encoding as the input feature performed best with an AUC of 0.95 on the independent dataset.

Table 5. Performance of convolutional neural network-based model using various features on the independent dataset.
3.5 Performance of hybrid (alignment-based + alignment-free) model
We also developed a hybrid model for classifying transcription factors by combining alignment-free and alignment-based approaches. The alignment-free component employs machine learning classifiers, while the alignment-based component utilizes similarity search with BLAST, resulting in a more accurate and comprehensive prediction method. In the hybrid approach, we combined the outputs from the ET-based model developed using amino acid composition and BLAST search to make the final prediction. Table 6 exhibits the performance of the hybrid model at different e-values on the independent dataset. As shown in Table 6, at each e-value, the AUC achieved was 0.99, with balanced sensitivity and specificity; in terms of accuracy, an e-value of 1.00E + 02 attained the maximum value of 97.013%. This model has been incorporated into the backend of the server TransFacPred to predict if the submitted protein is a TF or a non-TF.
3.6 Comparison with existing methods
To understand the advantages or disadvantages of the newly proposed method, it is crucial to compare it with the existing methods. Hence, we compared the performance of our model with the published methods such as DeepTFactor, TFpredict, and P2TF (Ortet, et al., 2012; Eichner et al., 2013; Kim et al., 2021). We evaluated our and existing models on the independent dataset, and as signified in Table 7, our model performed better in terms of each evaluation parameter.

Table 7. Comparison of the performance of our best-performing model with existing tools on the independent dataset.
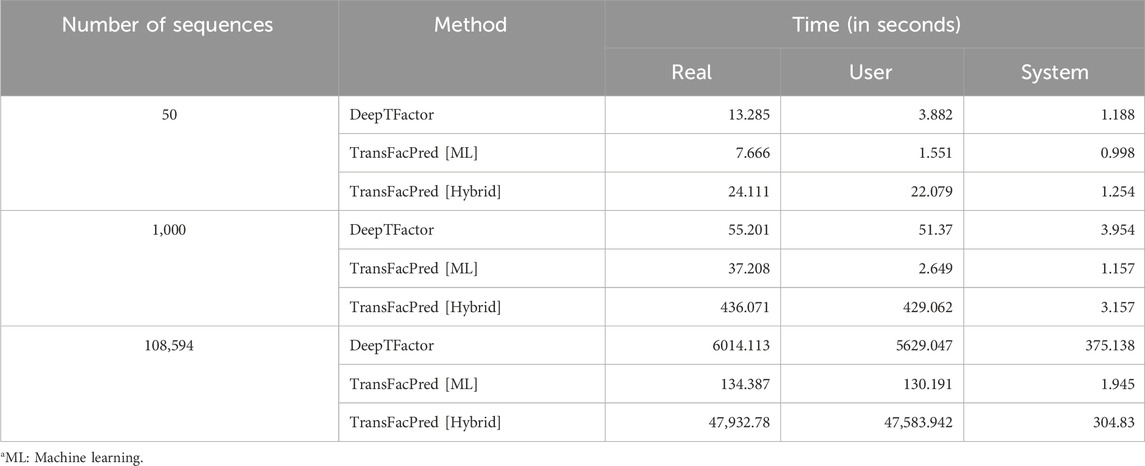
Additionally, we compared the processing times of the recently published DeepTFactor with our proposed method, TransFacPred, using both standalone machine learning and a hybrid model. By testing various numbers of sequences simultaneously, we found that DeepTFactor takes longer as the number of sequences increases, as shown in Table 8. We implemented the AAC-based machine learning model and a hybrid model and compared the performance. The ML-based model took less time than DeepTFactor with an equivalent AUC, whereas the hybrid model performed best but took more time to provide the output.
3.7 Web server implementation
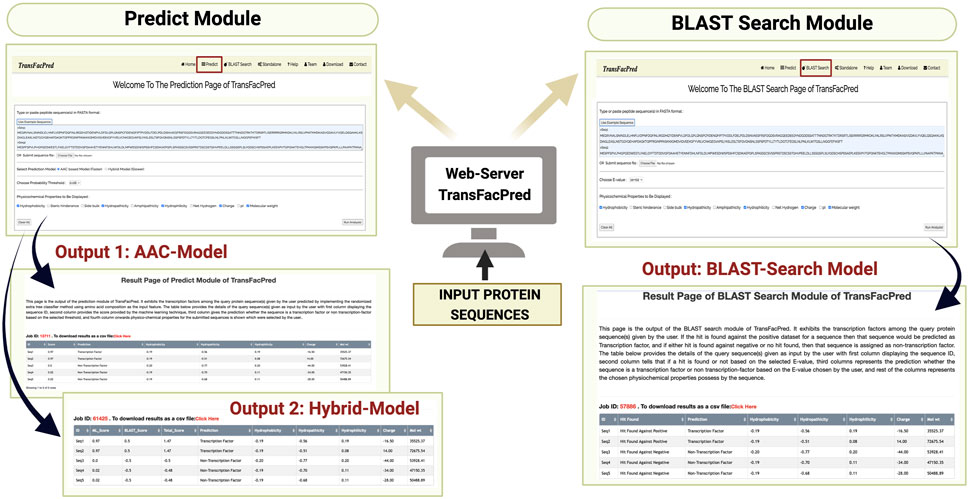
We developed an easy-to-use web server, TransFacPred, and a standalone package. Our web server has two major modules: Predict and BLAST Search. The predictive module allows the users to predict TFs using an alignment-free method or a hybrid method (see Figure 2). The BLAST search module allows users to perform a BLAST search against the database of TFs and non-TFs used in this study. The comprehensive utility of the BLAST Search module and predict module using the AAC- and hybrid-based model is shown in Figure 3. In addition to the web server, we developed a standalone package in Python. This package is suitable for scanning TFs at the genome scale, where it can be run on a local machine.
4 Discussion
TFs initiate the transcription process and hence play a major role in deciding the fate of a cell or cellular process (Rhee et al., 2017; Islam et al., 2021). Identification of novel or unknown TFs using experimental-based techniques such as RNA sequencing (RNA-seq) and Chromatin immunoprecipitation sequencing (ChIP-seq) experiment is a tiring and expensive task (Muhammad et al., 2019). Previously, a number of methods have been developed for the prediction of TFs (Zheng et al., 2008; Eichner et al., 2013; Kim et al., 2021). To assist the researchers working in this field, we made a systematic attempt to develop a highly accurate method capable of classifying TFs using the primary sequence information. Based on GO terms, sequences were assigned as either TFs or non-TFs. At first, there was a total of 561,176 sequences, of which 21,802 were assigned as TFs and 539,374 were designated as non-TFs; after preprocessing the datasets, the final dataset was comprised of 19,406 TFs and 523,560 non-TFs. These sequences are from diverse organisms, which signifies the diversity in the proposed model. Of the TF sequences, approximately 9% are from H. sapiens, 8% from A. thaliana, 6% from M. musculus, 2% from R. norvegicus, and the rest belong to other organisms.
In this study, we employed an imbalanced dataset to train and evaluate the models, where the number of TFs was significantly higher than the number of TF sequences. It is crucial to understand that the use of either balanced datasets or imbalanced/realistic datasets is pertinent not only to this study but to all similar studies. Previous research has thoroughly discussed the importance of both balanced and realistic datasets (Agarwal et al., 2011; Agrawal et al., 2020; Patiyal et al., 2020). Notably, a balanced dataset is essential for training, testing, and evaluating any supervised machine learning technique as it ensures equal preference to all classes. Many data scientists favor using balanced datasets because they facilitate the training and evaluation process through straightforward metrics such as accuracy. However, in real-world scenarios, classes are often imbalanced. For instance, there are typically far more non-transcription factors than transcription factors. A model trained on a balanced dataset might try to predict an equal number of transcription factors and non-transcription factors in a given protein set, which does not represent the real situation accurately. Biologists and other domain experts often prefer to train machine learning models on realistic datasets that reflect the inherent imbalance found in real-world data. However, training such models presents challenges because machine learning techniques tend to favor classes with more samples. Furthermore, simple metrics like accuracy may not be sufficient to evaluate such models adequately. To address this issue, we evaluated the models in this study using metrics that penalize over-prediction and account for class imbalances, such as the MCC. This approach ensures a more accurate and fair evaluation of the models’ performance, highlighting the importance of considering dataset composition in machine learning studies. Although the proposed model was developed using the sequences from an array of organisms, which led to the development of the general model, it is important to recognize that organism-specific methods may provide more precision than general methods. Initially, most methods were developed for a wide range of organisms, but they were later replaced by organism-specific methods due to their better accuracy. For example, in the field of subcellular localization, methods were initially developed for the subcellular localization of eukaryotic proteins, such as ESLpred (Garg and Raghava, 2008). Later, organism-specific methods were developed, such as for human proteins (Zhang et al., 2022) and RSLpred for rice proteins (Kaundal and Raghava, 2009).
The preliminary composition analysis on this dataset showed that the TFs are rich in E, P, Q, R, and S amino acids. Further, sequence-based features were computed using Pfeature software, and various machine learning techniques were implemented to exploit their capabilities to classify the sequences as either TFs or non-TFs. Our models were trained on 80% of the dataset using different sets of features and validated on the remaining previously unseen 20% of the dataset. JWe obtained an AUC of 0.96 on the training and on an independent dataset using amino acid composition-based features. Of all the models, the hybrid model, which is the combination of the ET-based model developed on amino acid composition and BLAST search, performed best with an AUC of 0.99 on the independent dataset with balanced sensitivity and specificity. We also compared our method with the existing methods such as DeepTFactor, TFpredict, and P2TF to predict the transcription factors using sequence information. We trained our models on the training dataset and evaluated the performance of the TransFacPred and existing approaches on the independent dataset. We demonstrated that the proposed model of TransFacPred outperformed the existing approaches to classify the TFs in terms of AUC and other parameters. We anticipate that this research will aid researchers working in genomics and proteomics. Figure 4 represents the complete flow of this study.
5 Potential applications of TransFacPred
TransFacPred has applications in many different areas of biological study. Accurate identification of transcription factors enables researchers to focus on functional analysis and regulatory mechanisms, thereby deepening the understanding of cellular processes and gene expression regulation (Davidson and Erwin, 2006). For instance, transcription factors play crucial roles in controlling developmental processes, responding to environmental stimuli, and regulating cellular differentiation (Lee and Young, 2013). By integrating TransFacPred into genomic studies, researchers can expedite the identification of transcription factors, facilitating a more efficient analysis of large datasets and complex biological systems (Vaquerizas et al., 2009). In practical genomic data analysis, TransFacPred can annotate newly sequenced genomes, assisting in the rapid identification of transcription factors (Wasserman and Sandelin, 2004). This tool is particularly beneficial in comparative genomics, where researchers aim to elucidate evolutionary relationships and functional conservation of transcription factors across different species (Levine and Tjian, 2003). For instance, predicting transcription factors in novel genomes can reveal insights into regulatory networks and gene expression patterns across diverse organisms, contributing to our understanding of evolutionary biology and functional genomics (Wray et al., 2003). Furthermore, TransFacPred can be used in metagenomic studies to identify transcription factors in microbial communities, shedding light on the regulatory mechanisms underlying microbial diversity and ecosystem functions (Moran et al., 2013). In oncology, TransFacPred could be utilized to identify transcription factors involved in cancer development and progression. For example, studies have shown that transcription factors such as MYC and TP53 play critical roles in tumorigenesis (Vousden and Lane, 2007; Dang, 2012). By analyzing protein sequences from tumor samples, TransFacPred can help to select the key regulatory proteins that may serve as potential biomarkers or therapeutic targets, thereby aiding in the development of targeted cancer therapies.
TransFacPred can aid in agricultural studies by identifying transcription factors that regulate stress response and developmental pathways in plants. Transcription factors like DREB and WRKY have been associated with stress responses in crops, playing crucial roles in plant adaptation to abiotic stresses such as drought, salinity, and cold (Yamaguchi-Shinozaki and Shinozaki, 2006; Rushton et al., 2010). This information is valuable for engineering crops with enhanced resistance to environmental stresses, leading to improved yield and sustainability (Hirayama and Shinozaki, 2010). For example, overexpression of DREB1A in transgenic rice has been shown to enhance drought and cold tolerance, demonstrating the practical application of transcription factor research in crop improvement (Datta et al., 2012). Understanding the role of transcription factors in developmental processes is crucial for developmental biology studies. For instance, transcription factors such as SOX2 and OCT4 are key regulators of stem cell pluripotency and differentiation (Masui et al., 2007; Nichols and Smith, 2012). SOX2 and OCT4 form a core regulatory network that maintains the pluripotent state of embryonic stem cells and regulates their differentiation into various cell types (Masui et al., 2007). Disruptions in these transcription factors can lead to developmental disorders and diseases, highlighting their importance in developmental biology (Nichols and Smith, 2012). TransFacPred can assist in identifying key transcription factors involved in differentiation and morphogenesis, providing insights into developmental disorders and regenerative medicine (Slack, 1995).
6 Limitations of the study
While TransFacPred offers substantial benefits, it is essential to acknowledge its limitations. The accuracy of predictions may vary depending on the quality and diversity of input protein sequences. TransFacPred’s performance might be constrained by the availability of comprehensive training data, which could impact its ability to generalize across different organisms and conditions. Moreover, the predictive models used by TransFacPred might not fully capture the complex regulatory interactions and context-dependent activities of transcription factors, necessitating experimental validation to confirm the biological relevance of the predictions. It is also important to consider the potential biases introduced by the training data, which might affect TransFacPred’s applicability to novel or underrepresented species. Although TransFacPred can identify whether an input protein sequence is a transcription factor, it does not provide information about the binding site or affinity scores. Furthermore, while we have provided a generalized model to predict transcription factors by including sequences from various organisms, it is important to recognize that transcription factors in different organisms may have distinct properties and functions. Therefore, it may be possible to develop organism-specific methods to predict transcription factors more accurately.
Data availability statement
Publicly available datasets were analyzed in this study. This data can be found here: https://webs.iiitd.edu.in/raghava/transfacpred/dataset.php.
Author contributions
SP: data curation, formal analysis, methodology, software, validation, visualization, writing–original draft, writing–review and editing. PT: data curation, formal analysis, software, writing–original draft, writing–review and editing. MG: formal analysis, software, validation, writing–original draft, writing–review and editing. AmD: data curation, formal analysis, Software, writing–original draft, writing–review and editing. AnD: validation, writing–original draft, writing–review and editing. GR: conceptualization, funding acquisition, investigation, methodology, project administration, resources, Software, supervision, writing–original draft, writing–review and editing.
Funding
The author(s) declare that financial support was received for the research, authorship, and/or publication of this article. The current work has received a grant from the Department of Bio-Technology (DBT), Govt of India, India.
Acknowledgments
The authors thank the Department of Biotechnology (DBT) and the Department of Science and Technology (DST-INSPIRE) for fellowships and financial support. The authors also thank the Department of Computational Biology, IIITD New Delhi, for infrastructure and facilities.
Conflict of interest
The authors declare that the research was conducted in the absence of any commercial or financial relationships that could be construed as a potential conflict of interest. Author Contributions.
The author(s) declared that they were an editorial board member of Frontiers, at the time of submission. This had no impact on the peer review process and the final decision.
Publisher’s note
All claims expressed in this article are solely those of the authors and do not necessarily represent those of their affiliated organizations, or those of the publisher, the editors and the reviewers. Any product that may be evaluated in this article, or claim that may be made by its manufacturer, is not guaranteed or endorsed by the publisher.
Supplementary material
The Supplementary Material for this article can be found online at: https://www.frontiersin.org/articles/10.3389/fbinf.2024.1425419/full#supplementary-material
References
Agarwal, S., Mishra, N. K., Singh, H., and Raghava, G. P. S. (2011). Identification of mannose interacting residues using local composition. PloS one 6 (9), e24039. doi:10.1371/journal.pone.0024039
Agrawal, P., Mishra, G., and Raghava, G. P. S. (2020). SAMbinder: a web server for predicting s-adenosyl-l-methionine binding residues of a protein from its amino acid sequence. Front. Pharmacol. 10, 1690. doi:10.3389/fphar.2019.01690
Bairoch, A., and Apweiler, R. (2000). The SWISS-PROT protein sequence database and its supplement TrEMBL in 2000. Nucleic Acids Res. 28 (1), 45–48. doi:10.1093/nar/28.1.45
Bhagwat, A. S., and Vakoc, C. R. (2015). Targeting transcription factors in cancer. Trends Cancer 1 (1), 53–65. doi:10.1016/j.trecan.2015.07.001
Boutet, E., Lieberherr, D., Tognolli, M., Schneider, M., and Bairoch, A. (2007). UniProtKB/Swiss-Prot. Methods Mol. Biol. 406, 89–112. doi:10.1007/978-1-59745-535-0_4
Bushweller, J. H. (2019). Targeting transcription factors in cancer - from undruggable to reality. Nat. Rev. Cancer. 19 (11), 611–624. doi:10.1038/s41568-019-0196-7
Cheng, Y., He, C., Wang, M., Ma, X., Mo, F., Yang, S., et al. (2019). Targeting epigenetic regulators for cancer therapy: mechanisms and advances in clinical trials. Signal Transduct. Target Ther. 4, 62. doi:10.1038/s41392-019-0095-0
Datta, K., Baisakh, N., Ganguly, M., Krishnan, S., Yamaguchi-Shinozaki, K., and Datta, S. K. (2012). Overexpression of Arabidopsis and rice stress genes’ inducible transcription factor confers drought and salinity tolerance to rice. Plant Biotechnol. J. 10 (5), 579–586. doi:10.1111/j.1467-7652.2012.00688.x
Davidson, E. H., and Erwin, D. H. (2006). Gene regulatory networks and the evolution of animal body plans. Science 311 (5762), 796–800. doi:10.1126/science.1113832
Dhall, A., Patiyal, S., and Raghava, G. P. S. (2022). HLAncPred: a method for predicting promiscuous non-classical HLA binding sites. Brief. Bioinform. 23 (5), bbac192. doi:10.1093/bib/bbac192
Dhall, A., Patiyal, S., Sharma, N., Devi, N. L., and Raghava, G. P. S. (2021). Computer-aided prediction of inhibitors against STAT3 for managing COVID-19 associated cytokine storm. Comput. Biol. Med. 137, 104780. doi:10.1016/j.compbiomed.2021.104780
Eichner, J., Topf, F., Drager, A., Wrzodek, C., Wanke, D., and Zell, A. (2013). TFpredict and SABINE: sequence-based prediction of structural and functional characteristics of transcription factors. PLoS One 8 (12), e82238. doi:10.1371/journal.pone.0082238
Fong, A. P., and Tapscott, S. J. (2013). Skeletal muscle programming and re-programming. Curr. Opin. Genet. Dev. 23 (5), 568–573. doi:10.1016/j.gde.2013.05.002
Garg, A., and Raghava, G. P. S. (2008). ESLpred2: improved method for predicting subcellular localization of eukaryotic proteins. BMC Bioinforma. 9, 503. doi:10.1186/1471-2105-9-503
Hayden, M. S., and Ghosh, S. (2012). NF-κB, the first quarter-century: remarkable progress and outstanding questions. Genes Dev. 26 (3), 203–234. doi:10.1101/gad.183434.111
Herceg, Z., and Hainaut, P. (2007). Genetic and epigenetic alterations as biomarkers for cancer detection, diagnosis and prognosis. Mol. Oncol. 1 (1), 26–41. doi:10.1016/j.molonc.2007.01.004
Hirayama, T., and Shinozaki, K. (2010). Research on plant abiotic stress responses in the post-genome era: past, present and future. Plant J. 61 (6), 1041–1052. doi:10.1111/j.1365-313X.2010.04124.x
Islam, Z., Ali, A. M., Naik, A., Eldaw, M., Decock, J., and Kolatkar, P. R. (2021). Transcription factors: the fulcrum between cell development and carcinogenesis. Front. Oncol. 11, 681377. doi:10.3389/fonc.2021.681377
Izumi, K. (2016). Disorders of Transcriptional Regulation: an emerging category of multiple malformation syndromes. Mol. Syndromol. 7 (5), 262–273. doi:10.1159/000448747
Jiramongkol, Y., and Lam, E. W. (2020). FOXO transcription factor family in cancer and metastasis. Cancer Metastasis Rev. 39 (3), 681–709. doi:10.1007/s10555-020-09883-w
Kaundal, R., and Raghava, G. P. S. (2009). RSLpred: an integrative system for predicting subcellular localization of rice proteins combining compositional and evolutionary information. Proteomics 9 (9), 2324–2342. doi:10.1002/pmic.200700597
Kemmeren, P., Sameith, K., van de Pasch, L. A., Benschop, J. J., Lenstra, T. L., Margaritis, T., et al. (2014). Large-scale genetic perturbations reveal regulatory networks and an abundance of gene-specific repressors. Cell 157 (3), 740–752. doi:10.1016/j.cell.2014.02.054
Kim, G. B., Gao, Y., Palsson, B. O., and Lee, S. Y. (2021). DeepTFactor: a deep learning-based tool for the prediction of transcription factors. Proc. Natl. Acad. Sci. U. S. A. 118 (2), e2021171118. doi:10.1073/pnas.2021171118
Kircher, M., Xiong, C., Martin, B., Schubach, M., Inoue, F., Bell, R. J. A., et al. (2019). Saturation mutagenesis of twenty disease-associated regulatory elements at single base-pair resolution. Nat. Commun. 10 (1), 3583. doi:10.1038/s41467-019-11526-w
Kishtagari, A., Levine, R. L., and Viny, A. D. (2020). Driver mutations in acute myeloid leukemia. Curr. Opin. Hematol. 27 (2), 49–57. doi:10.1097/MOH.0000000000000567
Kleinjan, D. A., and van Heyningen, V. (2005). Long-range control of gene expression: emerging mechanisms and disruption in disease. Am. J. Hum. Genet. 76 (1), 8–32. doi:10.1086/426833
Lambert, S. A., Jolma, A., Campitelli, L. F., Das, P. K., Yin, Y., Albu, M., et al. (2018). The human transcription factors. Cell 172 (4), 650–665. doi:10.1016/j.cell.2018.01.029
Lee, T. I., and Young, R. A. (2013). Transcriptional regulation and its misregulation in disease. Cell 152 (6), 1237–1251. doi:10.1016/j.cell.2013.02.014
Levine, M., and Tjian, R. (2003). Transcription regulation and animal diversity. Nature 424 (6945), 147–151. doi:10.1038/nature01763
Li, H., Yang, Y., Hong, W., Huang, M., Wu, M., and Zhao, X. (2020). Applications of genome editing technology in the targeted therapy of human diseases: mechanisms, advances and prospects. Signal Transduct. Target. Ther. 5 (1), 1. doi:10.1038/s41392-019-0089-y
Masui, S., Nakatake, Y., Toyooka, Y., Shimosato, D., Yagi, R., Takahashi, K., et al. (2007). Pluripotency governed by Sox2 via regulation of Oct3/4 expression in mouse embryonic stem cells. Nat. Cell Biol. 9 (6), 625–635. doi:10.1038/ncb1589
McGinnis, S., and Madden, T. L. (2004). BLAST: at the core of a powerful and diverse set of sequence analysis tools. Nucleic Acids Res. 32 (Web Server issue), W20–W25. doi:10.1093/nar/gkh435
Miyazaki, K., and Miyazaki, M. (2021). The interplay between Chromatin architecture and lineage-specific transcription factors and the regulation of rag gene expression. Front. Immunol. 12, 659761. doi:10.3389/fimmu.2021.659761
Moran, M. A., Satinsky, B., Gifford, S. M., Luo, H., Rivers, A., Chan, L. K., et al. (2013). Sizing up metatranscriptomics. ISME J. 7 (2), 237–243. doi:10.1038/ismej.2012.94
Muhammad, I. I., Kong, S. L., Abdullah, S. N. A., and Munusamy, U. (2019). RNA-Seq and ChIP-seq as complementary approaches for comprehension of plant transcriptional regulatory mechanism. Int. J. Mol. Sci. 21 (1), 167. doi:10.3390/ijms21010167
Munsky, B., Neuert, G., and van Oudenaarden, A. (2012). Using gene expression noise to understand gene regulation. Science 336 (6078), 183–187. doi:10.1126/science.1216379
Nichols, J., and Smith, A. (2012). Pluripotency in the embryo and in culture. Cold Spring Harb. Perspect. Biol. 4 (8), a008128. doi:10.1101/cshperspect.a008128
Odom, D. T. (2011). Identification of transcription factor-DNA interactions in vivo. Subcell. Biochem. 52, 175–191. doi:10.1007/978-90-481-9069-0_8
Ortet, P., De Luca, G., Whitworth, D. E., and Barakat, M. (2012). P2TF: a comprehensive resource for analysis of prokaryotic transcription factors. BMC Genomics 13, 628. doi:10.1186/1471-2164-13-628
Pande, A., Patiyal, S., Lathwal, A., Arora, C., Kaur, D., Dhall, A., et al. (2023). Pfeature: a tool for computing wide range of protein features and building prediction models. J. Comput. Biol. 30 (2), 204–222. doi:10.1089/cmb.2022.0241
Patiyal, S., Agrawal, P., Kumar, V., Dhall, A., Kumar, R., Mishra, G., et al. (2020). NAGbinder: an approach for identifying N-acetylglucosamine interacting residues of a protein from its primary sequence. Protein Sci. 29 (1), 201–210. doi:10.1002/pro.3761
Patiyal, S., Dhall, A., and Raghava, G. P. S. (2022). A deep learning-based method for the prediction of DNA interacting residues in a protein. Brief. Bioinform. 23 (5), bbac322. doi:10.1093/bib/bbac322
Pereira, R., Oliveira, J., and Sousa, M. (2020). Bioinformatics and computational tools for next-generation sequencing analysis in clinical genetics. J. Clin. Med. 9 (1), 132. doi:10.3390/jcm9010132
Rhee, C., Kim, J., and Tucker, H. O. (2017). Transcriptional regulation of the first cell fate decision. J. Dev. Biol. Regen. Med. 1 (1), 102. doi:10.1038/s41598-021-86919-3
Rushton, P. J., Somssich, I. E., Ringler, P., and Shen, Q. J. (2010). WRKY transcription factors. Trends Plant Sci. 15 (5), 247–258. doi:10.1016/j.tplants.2010.02.006
Sim, J. C., White, S. M., and Lockhart, P. J. (2015). ARID1B-mediated disorders: mutations and possible mechanisms. Intractable Rare Dis. Res. 4 (1), 17–23. doi:10.5582/irdr.2014.01021
Singh, H., Khan, A. A., and Dinner, A. R. (2014). Gene regulatory networks in the immune system. Trends Immunol. 35 (5), 211–218. doi:10.1016/j.it.2014.03.006
Slack, J. M. (1995). Developmental biology of the pancreas. Development 121 (6), 1569–1580. doi:10.1242/dev.121.6.1569
Vaquerizas, J. M., Kummerfeld, S. K., Teichmann, S. A., and Luscombe, N. M. (2009). A census of human transcription factors: function, expression and evolution. Nat. Rev. Genet. 10 (4), 252–263. doi:10.1038/nrg2538
Vousden, K. H., and Lane, D. P. (2007). p53 in health and disease. Nat. Rev. Mol. Cell Biol. 8 (4), 275–283. doi:10.1038/nrm2147
Wang, Z., Civelek, M., Miller, C. L., Sheffield, N. C., Guertin, M. J., and Zang, C. (2018). BART: a transcription factor prediction tool with query gene sets or epigenomic profiles. Bioinformatics 34 (16), 2867–2869. doi:10.1093/bioinformatics/bty194
Wasserman, W. W., and Sandelin, A. (2004). Applied bioinformatics for the identification of regulatory elements. Nat. Rev. Genet. 5 (4), 276–287. doi:10.1038/nrg1315
Wray, G. A., Hahn, M. W., Abouheif, E., Balhoff, J. P., Pizer, M., Rockman, M. V., et al. (2003). The evolution of transcriptional regulation in eukaryotes. Mol. Biol. Evol. 20 (9), 1377–1419. doi:10.1093/molbev/msg140
Yamaguchi-Shinozaki, K., and Shinozaki, K. (2006). Transcriptional regulatory networks in cellular responses and tolerance to dehydration and cold stresses. Annu. Rev. Plant Biol. 57, 781–803. doi:10.1146/annurev.arplant.57.032905.105444
Zhang, Y. H., Ding, S., Chen, L., Huang, T., and Cai, Y. D. (2022). Subcellular localization prediction of human proteins using multifeature selection methods. Biomed. Res. Int. 2022, 1–12. doi:10.1155/2022/3288527
Keywords: transcription factor, alignment-free methods, alignment-based methods, regulation of transcription, hybrid method, DNA-binding proteins
Citation: Patiyal S, Tiwari P, Ghai M, Dhapola A, Dhall A and Raghava GPS (2024) A hybrid approach for predicting transcription factors. Front. Bioinform. 4:1425419. doi: 10.3389/fbinf.2024.1425419
Received: 29 April 2024; Accepted: 03 July 2024;
Published: 25 July 2024.
Edited by:
Tirso Pons, Spanish National Research Council (CSIC), SpainReviewed by:
Shaolei Teng, Howard University, United StatesMamoon Rashid, King Abdullah International Medical Research Center (KAIMRC), Saudi Arabia
Copyright © 2024 Patiyal, Tiwari, Ghai, Dhapola, Dhall and Raghava. This is an open-access article distributed under the terms of the Creative Commons Attribution License (CC BY). The use, distribution or reproduction in other forums is permitted, provided the original author(s) and the copyright owner(s) are credited and that the original publication in this journal is cited, in accordance with accepted academic practice. No use, distribution or reproduction is permitted which does not comply with these terms.
*Correspondence: Gajendra P. S. Raghava, cmFnaGF2YUBpaWl0ZC5hYy5pbg==
 Sumeet Patiyal
 Palak Tiwari
 Anjali Dhall
 Gajendra P. S. Raghava
