- 1Blavatnik School of Computer Science, Tel Aviv University, Tel Aviv, Israel
- 2Department of Human Molecular Genetics and Biochemistry, Sackler Faculty of Medicine, Tel Aviv University, Tel Aviv, Israel
Autism spectrum disorder (ASD) is a highly heritable complex disease that affects 1% of the population, yet its underlying molecular mechanisms are largely unknown. Here we study the problem of predicting causal genes for ASD by combining genome-scale data with a network propagation approach. We construct a predictor that integrates multiple omic data sets that assess genomic, transcriptomic, proteomic, and phosphoproteomic associations with ASD. In cross validation our predictor yields mean area under the ROC curve of 0.87 and area under the precision-recall curve of 0.89. We further show that it outperforms previous gene-level predictors of autism association. Finally, we show that we can use the model to predict genes associated with Schizophrenia which is known to share genetic components with ASD.
Introduction
Autism spectrum disorder (ASD) is a complex neurological and developmental disorder that affects a person’s behavior, communication, and learning abilities. About 1 in 44 children is identified with the disorder according to estimates from Centers for Disease Control and Prevention (CDC) Autism and Developmental Disabilities Monitoring (ADDM) Network (Maenner, 2021). It is thought to be caused by a combination of genetic and environmental factors that impacts the structure and function of the brain and nervous system (Flickr, 2023). Identifying the genetic base of ASD is critical to understanding its underlying biological mechanisms. Such knowledge will impact the development of new interventions and treatments for individuals affected by this disorder.
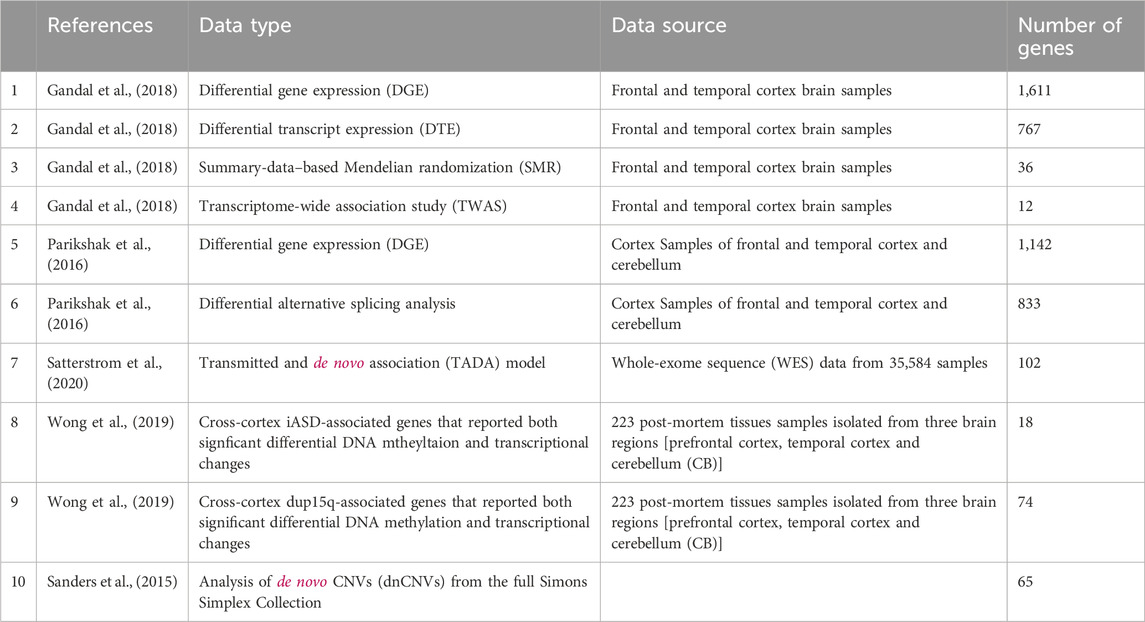
Extensive molecular studies have charted the landscape of ASD with respect to different information layers including genome wide association (GWAS), differential gene expression (Parikshak et al., 2016; Gandal et al., 2018), differential transcript expression (Gandal et al., 2018), alternative splicing changes (Parikshak et al., 2016; Gandal et al., 2018), differential methylation (Wong et al., 2019), copy number variation (Sanders et al., 2015) and more (Satterstrom et al., 2020). Each of these studies have come up with candidate lists of ASD-associated genes, calling for computational methods to consolidate these gene lists.
Machine learning based methods offer a new perspective to the problem by learning from known ASD-related genes and building models that provide ways to prioritize the risk associated with previously unknown genes based on their predicted scores (Liu et al., 2014; Krishnan et al., 2016; Duda et al., 2018; Brueggeman et al., 2020; Lin et al., 2020). These methods differ in their training features and prioritization method. (Duda et al., 2018) and (Krishnan et al., 2016) leveraged brain-specific functional interaction networks to produce genome-wide rankings of ASD associated genes. (Liu et al., 2014) clustered evidence for ASD association within a co-expression network in specific brain regions. (Lin et al., 2020) used features extracted from spatiotemporal gene expression patterns in the human brain. Last, the state-of–the-art forecASD (Brueggeman et al., 2020) integrates network-based information from large gene interaction networks with scores of genetic association and brain gene expression information. In detail, novel features are generated from BrainSpan expression and STRING interaction data. These are combined with literature-derived features from DAWN, DAMAGES, and Krishnan (Liu et al., 2014); (Krishnan et al., 2016; Zhang and Shen, 2017) and used to train a random forest classifier for ASD association.
The methods described above have predominantly relied on a single data source, potentially missing relevant information. Conversely, some approaches such as forecASD utilize multiple data sources that are devoid of network context. To address these limitations, our proposed method leverages a network propagation technique to integrate diverse data sources while accounting for their network context. Our model employs network-propagation on ASD associated genes from different data sets to derive predictive gene scores. Features are then combined using a random forest classifier. We evaluate the performance of our model and compare it to previous methods. Finally, we use our model to predict Schizophrenia-associated genes.
Materials and methods
Classification pipeline
The computational pipeline has two stages. First, network-based gene features are generated using a network propagation technique. Second, a random forest model is applied to these features to yield the prediction score. The classifier is summarized in Figure 1. Its stages are described in the following sections.
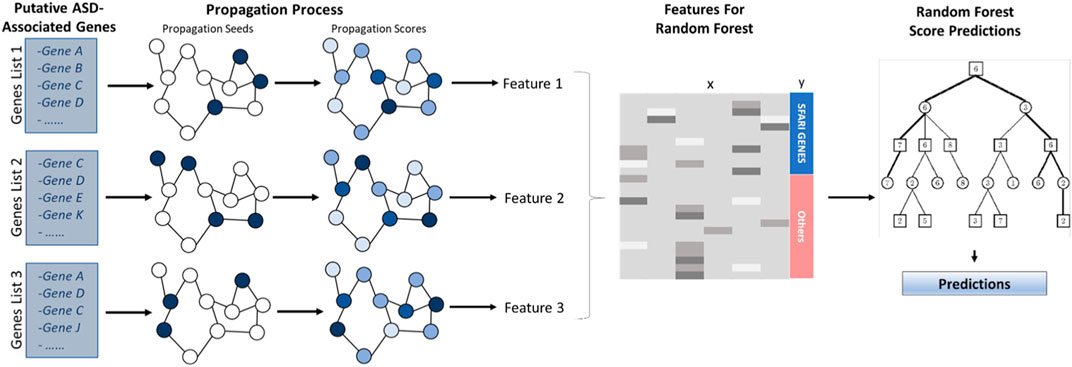
FIGURE 1. ASD Classifier Flowchat. Putative ASD-associated genes serve as seeds to a network propagation process. After propagation, the resulting scores yield classification features for a random forest classifier that is used to compute association scores.
Feature generation
Our starting point is gene lists obtained from the literature as detailed in Table 1. Overall, we use ten gene sets that were suggested to be associated with ASD based on various layers of information.
Each of these ASD related gene lists is used as a seed for a network propagation process that pinpoints other genes with high proximity to the seed set in a protein-protein interaction (PPI) network. The initial value of each seed protein from a list of size s is set to 1/s. We use a human PPI network from (Signorini et al., 2021) which has 20,933 proteins and 251,078 interactions in its main connected component. We run network propagation with default damping parameter ɑ = 0.8. We normalize the results using the eigenvector centrality method (Erten et al., 2011) in order to avoid biases which are caused by the degrees of the proteins. The resulting ten propagation scores for each gene comprise its feature set.
Random forest model
The features of a gene are integrated using a random forest model. To train the model, we use SFARI’s Gene Scoring Module (Abrahams et al., 2013) which offers critical evaluation of the strength of the evidence for each gene’s association with ASD. The genes are assigned to four categories: “Syndromic” (S), “Category 1” (High Confidence), “Category 2” (Strong Candidate) and “Category 3” (Suggestive Evidence). We label “Category 1” genes as positives (206 in total) and randomly pick 206 negative genes that do not appear in the SFARI database.
The random forest model is trained with the “sklearn” Python package using its default parameters which are a maximum of 100 trees, no maximum tree depth and minimum number of samples required to split an internal node of 2.
Results and discussion
Model performance
We tested our classifier using 5-fold cross-validation. Figure 2 depicts ROC and precision-recall graphs showing the final result as the mean between all the five fold scores. The AUROC is 0.87 and the AUPRC is 0.89 indicating the high accuracy of our method.
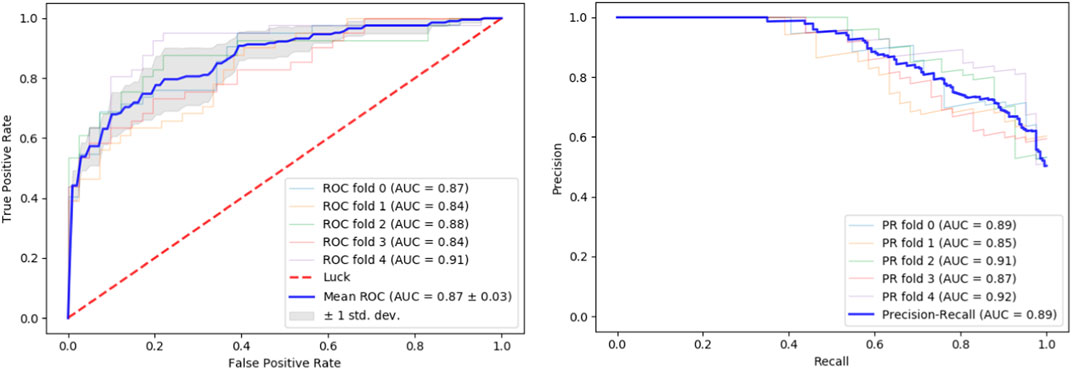
FIGURE 2. Performance evaluation. Performance of our classifier in 5-fold cross validation. The result of each fold and its mean are shown. Left: ROC curves. Right: Precision-recall curves.
To facilitate the model’s application by potential users, we calculated an optimal classification cutoff of 0.86, which maximizes the product of specificity and sensitivity (Liu, 2012). The full model scores can be found in Supplementary Table S2.
To further support our results, we tested our classifier’s predictions on SFARI genes of scores 2 and 3 (which were not used during training), compared to randomly chosen negative genes (Figure 3). The classifier’s score distributions of the groups were compared using the Wilcoxon signed-rank test. Reassuringly, SFARI genes with scores 2 and 3 got significantly higher scores than the random negative genes (p-value < 3.62e-34).
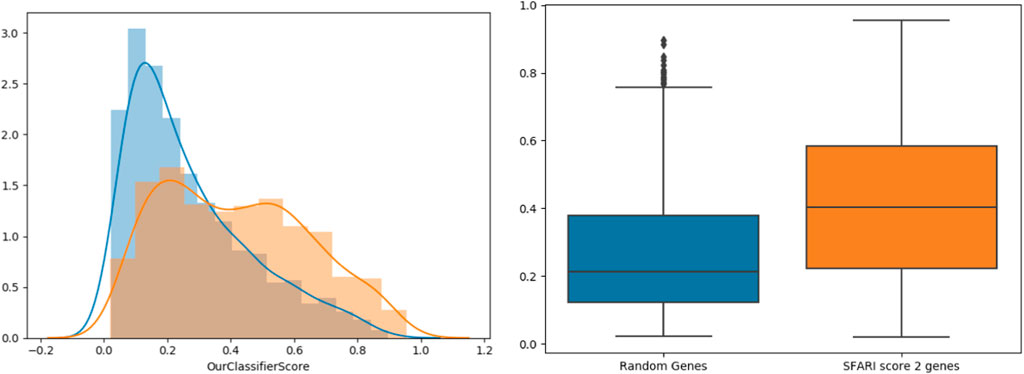
FIGURE 3. Classifier validation. Histograms (left) and box-plots (right) for SFARI (scores 2 and 3, orange) vs. random genes (blue).
After establishing the accuracy of our proposed method, we conducted a comparative analysis with the state-of-the-art forecASD classifier, which was shown to outperform earlier predictors. For this purpose, we employed the same random forest classifier on both our dataset and the features suggested by forecASD, namely BrainSpan and STRING. We additionally assessed the propagation procedure on a random degree-preserving network to act as a negative control. The results are provided in Figure 4 showing the superiority of our method compared to forecASD and the negative control (AUROC of 0.91 vs. 0.87 and 0.82). Notably, the relatively high AUROC of the negative control testifies to the quality of the gene sets that serve as seeds for the network propagation.
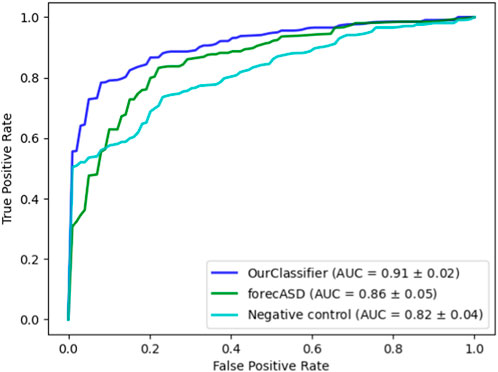
FIGURE 4. Performance comparison against forecASD and a negative control. Shown here are the mean ROCAUC results of each classifier.
Functional annotation analysis
Next, we wished to analyze the functional roles of the top predicted genes. To this end, we set a prediction threshold of 0.947, which maximizes the sum of precision and recall, and focused on the 84 genes passing this threshold. We conducted functional enrichment analysis using g:Profiler (version e109_eg56_p17_1d3191d) with Bonferroni corrected p-values and a significance threshold of 0.001 (Raudvere et al., 2019). The analysis is based on several data sources (GO:MF, GO:BP, Human Phenotype Ontology) (Figure 5).

FIGURE 5. Functional annotation results for genes predicted by our classifier. (A) Manhattan plot created with g:Profiler illustrates the enrichment analysis results. The x-axis represents functional terms that are grouped and color-coded by data sources. The y-axis shows the adjusted enrichment p-values in negative log10 scale. Highlighted points in the plot are the terms which got the highest scores, and highlighted driver terms in GO created by g:Profiler algorithm. The algorithm is used for filtering GO enrichment results, providing a more efficient and reliable approach compared to traditional clustering methods. (B) Detailed information about highlighted circles from the Manhattan graph. Detailed information include data source, id and name of the term together with corresponding p-value.
From Human Phenotype Ontology—Autistic Behavior was the highest enriched phenotype. Using GO:BP (Biological Process) and GO:MF(Molecular Function) data sources, yield several highly enriched pathways known to play important roles in autism etiology including chromatin organization and binding (Haddad Derafshi et al., 2022), histone modification (Sun et al., 2016), neuron cell-cell adhesion (Eve et al., 2022) and zinc ion binding (Walsh et al., 2001; Walsh, 2002; Wang and Zhou, 2010; Yasuda et al., 2011). The full list of the functional annotation analysis results can be found in Supplementary Table S1.
Exploiting schizophrenia genes
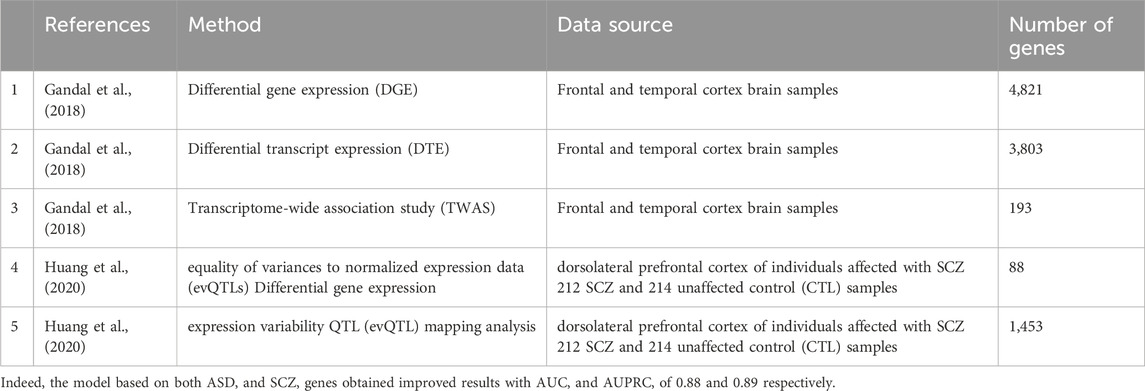
Given the known phenotypic similarity between ASD and schizophrenia (SCZ) (Hommer and Swedo, 2015) we wished to test whether our classification model could be further improved by adding information on SCZ associated genes. Thus, we collected lists of genes that were associated with SCZ (Table 2) and reapplied our computational pipeline.
Next, we checked if our ASD classifier can also predict schizophrenia associated genes. We ran it on genes which are associated with SCZ from a database for Schizophrenia genetic research, SZDB (Wu et al., 2017). Specifically, we focused on 1622 SCZ-associated genes from SZDB with scores higher than 3, and compared their scores to those of the same number of random genes (Figure 6). Wilcoxon signed-rank test showed that the classifier gave the SCZ-associated genes significantly higher scores than the random genes (p-value of 2.275e-11).

FIGURE 6. Classifier Predictions on SCZ Genes. The distribution of SCZ gene scores (Orange) versus that of random genes (Blue). The distribution is shown both in histograms (A) and in box plots (B).
Conclusion
We have presented a classification model for disease association. The classifier uses network propagation which enables us to combine and to amplify signals from individual genes, and uses machine learning to allow us to learn from known genes in order to classify new ones. In application to ASD, our classifier attained high accuracy, outperforming the state of the art. We have further shown its applicability to SCZ, which benefits from the similarity between these diseases but also shows the generality of our approach.
Functional enrichment analysis of our proposed candidate ASD genes has pointed to several pathways and processes that have been previously linked to ASD. For instance, neuron cell-cell adhesion, which may contribute to neuroinflammation in ASD (Eve et al., 2022) and participates in neurodevelopmental pathways associated with the disorder (Gandawijaya et al., 2020). Moreover (Bonsi et al., 2022), demonstrated that genes associated with ASD are frequently involved in the structural organization and functional activity of synapses, as evident in our results indicating enriched pathways such as synapse assembly and presynaptic and postsynaptic membrane assembly. This is interesting, as ASD is sometimes regarded as a disorder of connectivity (Mohammad-Rezazadeh et al., 2016), since its genes have both direct and indirect effect on a range of presynaptic and postsynaptic proteins (Bonsi et al., 2022; Yeo et al., 2022).
The fact that our classifier succeeded in predicting Schizophrenia-associated genes may suggest that previously implied association between ASD and SCZ may evolve from connectivity-related issues (Hommer and Swedo, 2015).
Data availability statement
The original contributions presented in the study are included in the article/Supplementary Material, further inquiries can be directed to the corresponding author.
Ethics statement
Ethical approval was not required for the study involving humans in accordance with the local legislation and institutional requirements. Written informed consent to participate in this study was not required from the participants or the participants’ legal guardians/next of kin in accordance with the national legislation and the institutional requirements.
Author contributions
NZ: Conceptualization, Data curation, Formal Analysis, Investigation, Methodology, Project administration, Software, Validation, Visualization, Writing–original draft. GA: Funding acquisition, Writing–review and editing. RS: Funding acquisition, Writing–review and editing, Conceptualization, Project administration, Supervision.
Funding
The author(s) declare financial support was received for the research, authorship, and/or publication of this article. This research was supported by a research grant from the Israel Science Foundation (IPMP grant no. 2417/20).
Conflict of interest
The authors declare that the research was conducted in the absence of any commercial or financial relationships that could be construed as a potential conflict of interest.
Publisher’s note
All claims expressed in this article are solely those of the authors and do not necessarily represent those of their affiliated organizations, or those of the publisher, the editors and the reviewers. Any product that may be evaluated in this article, or claim that may be made by its manufacturer, is not guaranteed or endorsed by the publisher.
Supplementary material
The Supplementary Material for this article can be found online at: https://www.frontiersin.org/articles/10.3389/fbinf.2024.1295600/full#supplementary-material
References
Abrahams, B. S., Arking, D. E., Campbell, D. B., Mefford, H. C., Morrow, E. M., Weiss, L. A., et al. (2013). SFARI Gene 2.0: a community-driven knowledgebase for the autism spectrum disorders (ASDs). Mol. autism 4 (1), 36–43. doi:10.1186/2040-2392-4-36
Bonsi, P., De Jaco, A., Fasano, L., and Gubellini, P. (2022). Postsynaptic autism spectrum disorder genes and synaptic dysfunction. Neurobiol. Dis. 162, 105564. doi:10.1016/j.nbd.2021.105564
Brueggeman, L., Koomar, T., and Michaelson, J. J. (2020). Forecasting risk gene discovery in autism with machine learning and genome-scale data. Sci. Rep. 10 (1), 4569. doi:10.1038/s41598-020-61288-5
Duda, M., Zhang, H., Li, H. D., Wall, D. P., Burmeister, M., and Guan, Y. (2018). Brain-specific functional relationship networks inform autism spectrum disorder gene prediction. Transl. psychiatry 8 (1), 56. doi:10.1038/s41398-018-0098-6
Erten, S., Bebek, G., Ewing, R. M., and Koyutürk, M. (2011). DADA: degree-aware algorithms for network-based disease gene prioritization. BioData Min. 4, 19. doi:10.1186/1756-0381-4-19
Eve, M., Gandawijaya, J., Yang, L., and Oguro-Ando, A. (2022). Neuronal cell adhesion molecules may mediate neuroinflammation in autism spectrum disorder. Front. psychiatry/Front. Res. Found. 13, 842755. doi:10.3389/fpsyt.2022.842755
Flickr, F. (2023). Us on (no date) about Autism. Available at: https://www.nichd.nih.gov/health/topics/autism/conditioninfo (Accessed February 28, 2023).
Gandal, M. J., Zhang, P., Hadjimichael, E., Walker, R. L., Chen, C., Liu, S., et al. (2018). Transcriptome-wide isoform-level dysregulation in ASD, schizophrenia, and bipolar disorder. Science 362 (6420), eaat8127. Available at:. doi:10.1126/science.aat8127
Gandawijaya, J., Bamford, R. A., Burbach, J. P. H., and Oguro-Ando, A. (2020). Cell adhesion molecules involved in neurodevelopmental pathways implicated in 3p-deletion syndrome and autism spectrum disorder. Front. Cell. Neurosci. 14, 611379. doi:10.3389/fncel.2020.611379
Haddad Derafshi, B., Danko, T., Chanda, S., Batista, P. J., Litzenburger, U., Lee, Q. Y., et al. (2022). The autism risk factor CHD8 is a chromatin activator in human neurons and functionally dependent on the ERK-MAPK pathway effector ELK1. Sci. Rep. 12 (1), 22425. doi:10.1038/s41598-022-23614-x
Hommer, R. E., and Swedo, S. E. (2015). Schizophrenia and autism-related disorders. Schizophr. Bull. 41 (2), 313–314. doi:10.1093/schbul/sbu188
Huang, G., Osorio, D., Guan, J., Ji, G., and Cai, J. J. (2020). Overdispersed gene expression in schizophrenia. NPJ Schizophr. 6 (1), 9. doi:10.1038/s41537-020-0097-5
Krishnan, A., Zhang, R., Yao, V., Theesfeld, C. L., Wong, A. K., Tadych, A., et al. (2016). Genome-wide prediction and functional characterization of the genetic basis of autism spectrum disorder. Nat. Neurosci. 19 (11), 1454–1462. doi:10.1038/nn.4353
Lin, Y., Afshar, S., Rajadhyaksha, A. M., Potash, J. B., and Han, S. (2020). A machine learning approach to predicting autism risk genes: validation of known genes and discovery of new candidates. Front. Genet. 11, 500064. doi:10.3389/fgene.2020.500064
Liu, L., Lei, J., Sanders, S. J., Willsey, A. J., Kou, Y., Cicek, A. E., et al. (2014). DAWN: a framework to identify autism genes and subnetworks using gene expression and genetics. Mol. autism 5 (1), 22–18. doi:10.1186/2040-2392-5-22
Liu, X. (2012). Classification accuracy and cut point selection. Statistics Med. 31 (23), 2676–2686. doi:10.1002/sim.4509
Maenner, M. J. (2021). ‘Prevalence and characteristics of autism spectrum disorder among children aged 8 Years — autism and developmental Disabilities monitoring network, 11 sites, United States, 2018’, morbidity and mortality weekly report. Surveill. Summ., 70. Available at:. doi:10.15585/mmwr.ss7011a1
Mohammad-Rezazadeh, I., Frohlich, J., Loo, S. K., and Jeste, S. S. (2016). Brain connectivity in autism spectrum disorder. Curr. Opin. neurology 29 (2), 137–147. doi:10.1097/wco.0000000000000301
Parikshak, N. N., Swarup, V., Belgard, T. G., Irimia, M., Ramaswami, G., Gandal, M. J., et al. (2016). Genome-wide changes in lncRNA, splicing, and regional gene expression patterns in autism. Nature 540 (7633), 423–427. doi:10.1038/nature20612
Raudvere, U., Kolberg, L., Kuzmin, I., Arak, T., Adler, P., Peterson, H., et al. (2019). g:Profiler: a web server for functional enrichment analysis and conversions of gene lists (2019 update). Nucleic acids Res. 47 (W1), W191–W198. doi:10.1093/nar/gkz369
Sanders, S. J., He, X., Willsey, A., Ercan-Sencicek, A., Samocha, K., Cicek, A., et al. (2015). Insights into autism spectrum disorder genomic architecture and biology from 71 risk loci. Neuron 87 (6), 1215–1233. doi:10.1016/j.neuron.2015.09.016
Satterstrom, F. K., Kosmicki, J. A., Wang, J., Breen, M. S., De Rubeis, S., An, J. Y., et al. (2020). Large-scale exome sequencing study implicates both developmental and functional changes in the neurobiology of autism. Cell. 180 (3), 568–584.e23. doi:10.1016/j.cell.2019.12.036
Signorini, L. F., Almozlino, T., and Sharan, R. (2021). ANAT 3.0: a framework for elucidating functional protein subnetworks using graph-theoretic and machine learning approaches. BMC Bioinforma. 22 (1), 526–6. doi:10.1186/s12859-021-04449-1
Sun, W., Poschmann, J., Cruz-Herrera del Rosario, R., Parikshak, N. N., Hajan, H. S., Kumar, V., et al. (2016). Histone acetylome-wide association study of autism spectrum disorder. Cell. 167 (5), 1385–1397.e11. doi:10.1016/j.cell.2016.10.031
Walsh, W. J., et al. (2002). Metallothionein and autism’, and autism 2nd edn. Naperville, IL: pfeiffer.
Walsh, W. J., Usman, A., and Tarpey, J. (2001). Disordered metal metabolism in a large autism population. walshinstitute.Org. Available at: http://www.walshinstitute.org/uploads/1/7/9/9/17997321/disordered_metal_metabolism_in_a_large_autism_population.pdf (Accessed August 28, 2023).
Wang, X., and Zhou, B. (2010). Dietary zinc absorption: a play of Zips and ZnTs in the gut. IUBMB life 62 (3), 176–182. doi:10.1002/iub.291
Wong, C. C. Y., Smith, R. G., Hannon, E., Ramaswami, G., Parikshak, N. N., Assary, E., et al. (2019). Genome-wide DNA methylation profiling identifies convergent molecular signatures associated with idiopathic and syndromic autism in post-mortem human brain tissue. Hum. Mol. Genet. 28 (13), 2201–2211. doi:10.1093/hmg/ddz052
Wu, Y., Yao, Y.-G., and Luo, X.-J. (2017). SZDB: a database for schizophrenia genetic research. Schizophr. Bull. 43 (2), 459–471. doi:10.1093/schbul/sbw102
Yasuda, H., Yoshida, K., Yasuda, Y., and Tsutsui, T. (2011). Infantile zinc deficiency: association with autism spectrum disorders. Sci. Rep. 1, 129. doi:10.1038/srep00129
Yeo, X. Y., Lim, Y. T., Chae, W. R., Park, C., Park, H., and Jung, S. (2022). Alterations of presynaptic proteins in autism spectrum disorder. Front. Mol. Neurosci. 15, 1062878. doi:10.3389/fnmol.2022.1062878
Keywords: autism spectrum disorder (ASD), network propagation, machine learning, ASD genes, random forest
Citation: Zadok N, Ast G and Sharan R (2024) A network-based method for associating genes with autism spectrum disorder. Front. Bioinform. 4:1295600. doi: 10.3389/fbinf.2024.1295600
Received: 16 September 2023; Accepted: 26 February 2024;
Published: 08 March 2024.
Edited by:
Yovani Marrero-Ponce, University of Valencia, SpainReviewed by:
Hanbing Song, University of California, San Francisco, United StatesGuillermin Agüero-Chapin, University of Porto, Portugal
Copyright © 2024 Zadok, Ast and Sharan. This is an open-access article distributed under the terms of the Creative Commons Attribution License (CC BY). The use, distribution or reproduction in other forums is permitted, provided the original author(s) and the copyright owner(s) are credited and that the original publication in this journal is cited, in accordance with accepted academic practice. No use, distribution or reproduction is permitted which does not comply with these terms.
*Correspondence: Neta Zadok, bmV0YXphQGdtYWlsLmNvbQ==
 Neta Zadok
 Gil Ast2