 Zhihua Chen
 Siyuan Chen2
 Xiaoli Qiang
- 1The Institute of Computing Science and Technology, Guangzhou University, Guangzhou, China
- 2The School of Artificial Intelligence and Automation, Huazhong University of Science and Technology, Wuhan, China
Brain tumor research has been stapled for human health while brain network research is crucial for us to understand brain activity. Here the structural controllability theory is applied to study three human brain-specific gene regulatory networks, including forebrain gene regulatory network, hindbrain gene regulatory network and neuron associated cells cancer related gene regulatory network, whose nodes are neural genes and the edges represent the gene expression regulation among the genes. The nodes are classified into two classes: critical nodes and ordinary nodes, based on the change of the number of driver nodes upon its removal. Eight topological properties (out-degree DO, in-degree DI, degree D, betweenness B, closeness CA, in-closeness CI, out-closeness CO and clustering coefficient CC) are calculated in this paper and the results prove that the critical genes have higher score of topological properties than the ordinary genes. Then two bioinformatic analysis are used to explore the biologic significance of the critical genes. On the one hand, the enrichment scores in several kinds of gene databases are calculated and reveal that the critical nodes are richer in essential genes, cancer genes and the neuron related disease genes than the ordinary nodes, which indicates that the critical nodes may be the biomarker in brain-specific gene regulatory network. On the other hand, GO analysis and KEGG pathway analysis are applied on them and the results show that the critical genes mainly take part in 14 KEGG pathways that are transcriptional misregulation in cancer, pathways in cancer and so on, which indicates that the critical genes are related to the brain tumor. Finally, by deleting the edges or routines in the network, the robustness analysis of node classification is realized, and the robustness of node classification is proved. The comparison of neuron associated cells cancer related GRN (Gene Regulatory Network) and normal brain-specific GRNs (including forebrain and hindbrain GRN) shows that the neuron-related cell cancer-related gene regulatory network is more robust than other types.
1 Introduction
The world has opened its eyes to the threat posed by cancer (McGuire, 2016). Brain tumor is a mass or growth of abnormal cells in the human brain. It can begin in the human brain (primary brain tumors), or begin in other parts of body and spread to brain (secondary, or metastatic, brain tumors) (Cheng et al. 2014). Brain tumor accounts for 85–90% of all primary central nervous system (CNS) tumors (Mehta et al., 2011). There are new cases and deaths from brain tumor and other nervous system tumors estimated around the world every year. Approximately 256,213 new cases of brain and other CNS tumors were diagnosed in the year 2012, with an estimated 189,382 deaths (Ferlay et al., 2012), and there are 296,851 new cases and 241,037 deaths in 2018 (Bray et al., 2018). Furthermore, the cause of most adult brain and spinal cord tumors is not known. It is urgent to study the pathogenic mechanism and treatment for brain tumors.
Many studies have focused on the role of single molecule or single pathway in regulating tissue-specific nuclear structure and gene expression. For example, SATB1, a cell type specific nuclear protein, can recruit chromatin remodeling factors and regulate many genes during thymocyte differentiation. And it is proposed by Cai-s et al. as a novel gene regulator, which can provide sites for tissue-specific and region specific histone modification of DNA sequences (Cai et al., 2003). Fass et al. (2018) studied the role of GPCR-kinase interacting protein 1 (GIT1), and found that GIT1 deletion interferes with the specific network of GIT1 interacting synapses. Although the understanding of individual molecules is crucial, the focus is on understanding the entire gene regulatory network at the system level. Because the properties of gene regulatory networks cannot be fully understood by studying single molecules (Kitano, 2002).
Marbach D et al. Developed a comprehensive resource of 394 cell types and tissue-specific gene regulatory networks with 37 genome wide association studies (GWAS), which clarifies the genome-wide connectivity among transcription factors, enhancers, promoters and genes (Marbach et al., 2016). McKenzie A T et al. identified a novel set of brain cell consistent signatures and robust networks from the integration of multiple data sets, so it goes beyond the limitations associated with each individual research specific technical problem (McKenzie et al., 2018). Therefore, it is feasible to construct brain specific gene regulatory network based on relevant data and it is effective to study it based on network analysis.
Network Science has become an emerging and highly interdisciplinary research area that aims to increase our understanding of complex networks (Barabási, 2009; Börner et al., 2007; Liu et al., 2016; Gao et al., 2015; Peng et al., 2015). At the same time, with the increasing of massive genomic, proteomic, and metabolomics data, the formation of multi-layer biological molecular network is promoted, which lays a foundation for the analysis of biological problems by network science (Liu et al., 2019b; Ortmayr et al., 2019; Malod-Dognin et al., 2019; Liu et al., 2019a). Detailed maps of mammalian brains could lead to a revolution in brain science, which allows us to understand and find the cure of numerous neurological and brain diseases. With that, network science could be applied in brain research widely (Sporns et al., 2005; Barabási and Pósfai, 2016; Liu and Pan, 2016b). It has been applied in many kinds of biological networks, such as mouse inter-region brain networks and human transcription factor regulatory networks (Chang, 2015). Liu et al. used the control theory of structural controllability to analyse numerous models of real networks, for instance, the directed human protein interaction network, which helped us to identify disease genes and drug targets (Vinayagam et al., 2016), the human signaling network to identify driver nodes (Liu and Pan, 2015) and so on. It has been proved that a system’s behaviour can be guided towards a desired state with a suitable choice of control signals to some significant nodes (Liu and Pan, 2016a; Liu et al., 2011; Yan et al., 2017; Liu et al., 2017). Therefore, it’s feasible that we can apply controllability theory of network science on the analysis of brain-specific gene regulatory network.
Network structural controllability analysis (Liu et al., 2011, Liu et al., 2017) has been a general framework in identifying critical nodes that have crucial roles in controlling the state of the whole system. By applying this framework to human liver metabolic networks (Liu and Pan, 2014), the critical driver metabolites tend to be essential. Moreover, this framework can be used to predict potential drug-targets (Liu and Pan, 2015). It is fair to expect that there are some possible connections between the structural controllability theory and the human brain-specific gene regulatory networks, which could provide valuable informations on the brain-specific gene regulatory networks, such as identifying essential genes, brain-related disease genes and drug targets.
In this work, we apply structural controllability method to analyse large-scale directed human brain-specific gene regulatory networks, where nodes are neurons and edges represent the gene expression regulation among the genes. The weight of each edge ranges from 0 to 1, which measures the normalized activity levels of the enhancer. We classify the nodes into two classes: critical genes and ordinary genes. Then we do the topological and biological analyse of these two kinds of genes, and find that critical genes tend to be essential genes. By calculating eight topological properties (out-degree, in-degree, degree, betweenness, closeness, in-closeness, out-closeness and clustering coefficient), we can see that critical genes have higher score of topological properties than ordinary genes. Moreover, the enrichment in several kinds of gene databases is explored, which shows that critical nodes are richer in essential gene, cancer gene and the neuron related disease gene than ordinary nodes. Besides, GO analysis and KEGG pathway analysis also help to infer that critical nodes are useful for us to explore more significant biological information and to identify the biomarker for brain tumor research. Finally, since the gene regulatory network is not complete or there may be some false links, we do sensitivity analysis of the results by perturbing the network. We find that the result of node classification is quite robust, and the neuron associated cells cancer related gene regulatory network is more robust than the health networks. The findings in our paper could help identify potential essential, cancer and neuron related disease genes.
2 Results
2.1 Classification by Driver Nodes
2.1.1 Description of Brain-specific Gene Regulatory Network
We construct three brain-specific gene regulatory networks, which consist of forebrain gene regulatory network (forebrain GRN), hindbrain gene regulatory network (hindbrain GRN) and neuron associated cells cancer related gene regulatory network (neuron associated cells cancer GRN). They are directed networks and their nodes are neuronal genes. Their edges represent the regulation among neuronal genes, specifying the genome-wide connectivity among transcription factors, enhancers, promoters and genes (Marbach et al., 2016). Forebrain GRN and hindbrain GRN are normal and healthy human’s brain-specific gene regulatory networks, while neuron associated cells cancer related GRN is cancer patient’s brain-specific gene regulatory network. In these networks, the edge direction corresponds to the hierarchy of signal flow between the interacting genes and the edge weight corresponds to the confidence of the predicted direction. Generally, we delete the edges whose edge weight is smaller than 0.05 for our study. By this way, the human forebrain GRN consists of 14,435 genes (nodes) and 2,22,867 directed edges, the human hindbrain GRN consists of 14,601 genes and 2,28,708 directed edges, and the neuron associated cells cancer related GRN consists of 15,320 genes and 2,56,434 edges.
2.1.2 Classification of Brain-specific Gene Regulatory Networks’ Nodes
By structural controllability theory, the minimum set of driver nodes is identified and the size of it is calculated as ND. Then the nodes are classified as critical or ordinary, based on the change of ND upon their removal. The node is critical if ND has no change or increases because of its removal, or the node is ordinary if ND decreases. The results are shown in Table 1. The number of forebrain GRN’s critical nodes is 642, while the number of hindbrain GRN’s and neuron associated cells cancer related GRN’s critical nodes are both 643.
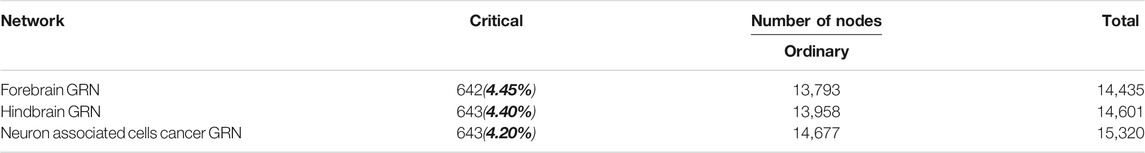
TABLE 1. Classification by driver nodes.
2.2 Topological Analysis
Different centralities of each gene in the three brain-specific gene regulatory networks are calculated, which including out-degree DO, in-degree DI, degree D, betweenness B, closeness CA, in-closeness CI, out-closeness CO, betweenness B and clustering coefficient CC. The average values of each topological property are shown in Table 2. It is clear that there are some similar topological properties among the three brain-specific gene regulatory networks, so we can make topological analysis from two aspects.
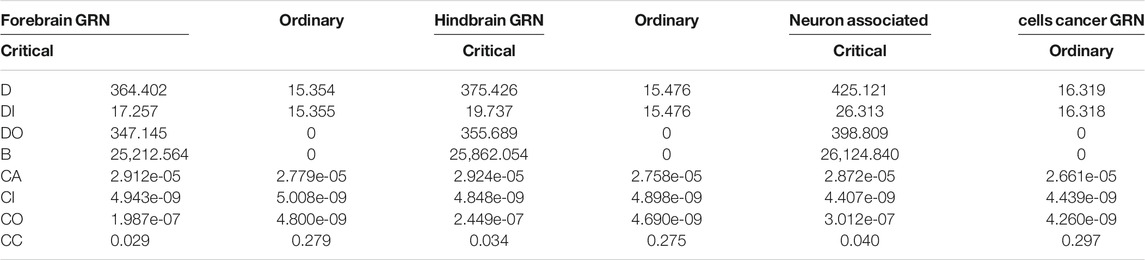
TABLE 2. Topological analysis of each gene in human brain network.
On one aspect of single network, taking the hindbrain GRN into account, the ordinary nodes’ out-degree is 0, as shown in Figures 1B,D, which means that the ordinary genes in the networks are all just signal receivers. And the degree distribution suggests that critical nodes have higher degree than ordinary nodes as shown in Figure 1, (degree distribution of forebrain GRN and neuron associated cells cancer related GRN are shown in Supplementary Figure S1, and it shows the same result as hindbrain GRN). The average of the ordinary nodes’ betweenness is also 0. What’s more, the average out-closeness of critical nodes is much bigger than ordinary nodes, and it is proved convincing by significance testing (Mann Whitney U test, p-value is smaller than 0.05, significance level = 0.05, see Table 3). These results imply that critical nodes are more important or useful for further study.
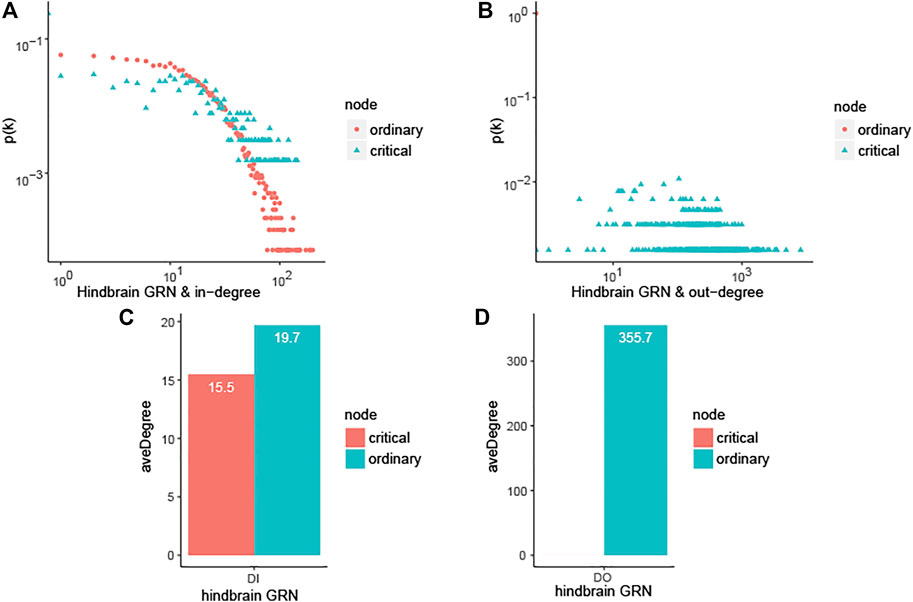
FIGURE 1. Characterizing the controllability of human brain-specific gene regulatory network and topological analysis. In the figure, hindbrain GRN is hindbrain gene regulatory network, forebrain GRN is forebrain gene regulatory network, neuron associated cells cancer related GRN is neural gene regulatory network associated cells cancer (Table 2).The values in Table 2 are the average of those topological characteristics that consist of out-degree DO, in-degreeDI, degree D, betweenness B, closeness CA, in-closeness CI, out-closeness CO, betweenness B and clustering coefficient CC. (A) In-degree distribution of hindbrain GRN. (B) Out-degree distribution of hindbrain GRN. (C) Average in-degree for ordinary and critical nodes in hindbrain GRN. (D) Average out-degree for ordinary and critical nodes in hindbrain GRN.
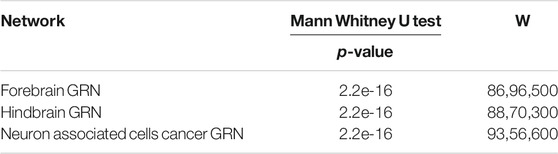
TABLE 3. The significance test of CO.
On the other aspect of comparison of the three brain-specific gene regulatory networks, the average in-degree, average out-degree, average betweenness and average clustering coefficient of neuron associated cells cancer related GRN are bigger than forebrain GRN and hindbrain GRN, no matter critical or ordinary nodes. It can be explained that the connection of neuron associated cells cancer related GRN is tighter than the normal brain network.
2.3 Biological Enrichment Analysis
The enrichment scores of the critical genes and ordinary genes in different biofunctional gene databases are calculated, and GO analysis and KEGG pathway analysis are adopted on critical genes to explore the biological significance.
2.3.1 Enrichment Score Calculating Analysis
The nodes in the databases which consist of essential genes, cancer genes, and the neuron related disease genes respectively are characterized as critical and ordinary nodes. Essential genes are necessary for cellular survivor. The gene essentiality analysis indicates that critical nodes are enriched in essential genes, whereas essential genes are underrepresented among ordinary nodes (Figure 2). Furthermore, the critical nodes are enriched in cancer genes and the related disease genes in the Figure 2, and it indicates that the disease genes are most likely among the critical nodes. Supplementary Figures S2, S3 show the biological enrichment analysis of forebrain GRN and neuron associated cells cancer related GRN, respectively. These results indicate that the proposed classification method is a reliable and useful tool for the prediction of brain tumor biomarkers. The critical genes mined in this way have bioinformatics significance and have a strong correlation with brain tumors.
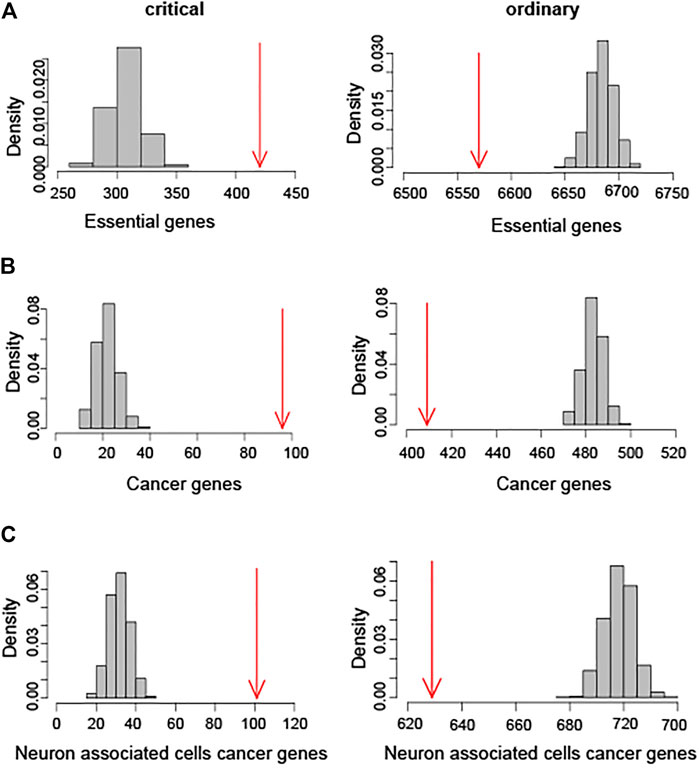
FIGURE 2. Biological enrichment score calculating analysis of hindbrain GRN. (A) Enrichment analysis of essential genes. Numbers of essential genes overlapping with critical and ordinary nodes are shown in red arrows. (B) Enrichment analysis of cancer genes. Numbers of cancer genes overlapping with critical and ordinary nodes are shown in red arrows. (C) Biological enrichment analysis of neuron associated cells cancer genes. Numbers of these genes overlapping with critical and ordinary nodes are shown in red arrows.
2.3.2 GO Analysis and KEGG Pathway Analysis on Critical Genes
GO (Gene Ontology) analysis (du Plessis et al., 2011) has the largest resource for cataloguing gene function, which is subdivided into three non-overlapping ontologies, Molecular Function (MF), Biological Process (BP) and Cellular Component (CC). KEGG (Kyoto Encyclopedia of Genes and Genomes) (Kanehisa and Goto, 2000) is a knowledge base for systematic analysis of gene functions, linking genomic information with higher order functional information. More detailed biological function of the genes can be obtained from GO analysis and KEGG pathway analysis.
David, the online biological enrichment analysis software, is used to realize the GO analysis and KEGG pathway analysis on critical genes. The results are shown in Figure 3 and Table 4. GO analysis points out that critical genes are rich in nucleus (93.4%), nucleoplasm (42.7%), cytoplasm (33.3%) and so on. Their molecular functions mostly consist of transcription factor activity, sequence-specific DNA binding and protein binding. What’s more, the critical genes mainly play important roles in 7 biological processes, which are positive regulation of transcription from RNA polymerase II promoter (56.1%), DNA-templated (56.0%), etc. KEGG pathway analysis shows that the critical genes are rich in 14 KEGG pathways, which are confirmed with brain tumor from the Comparative Toxicogenomics Database (CTD, http://ctdbase.org/).
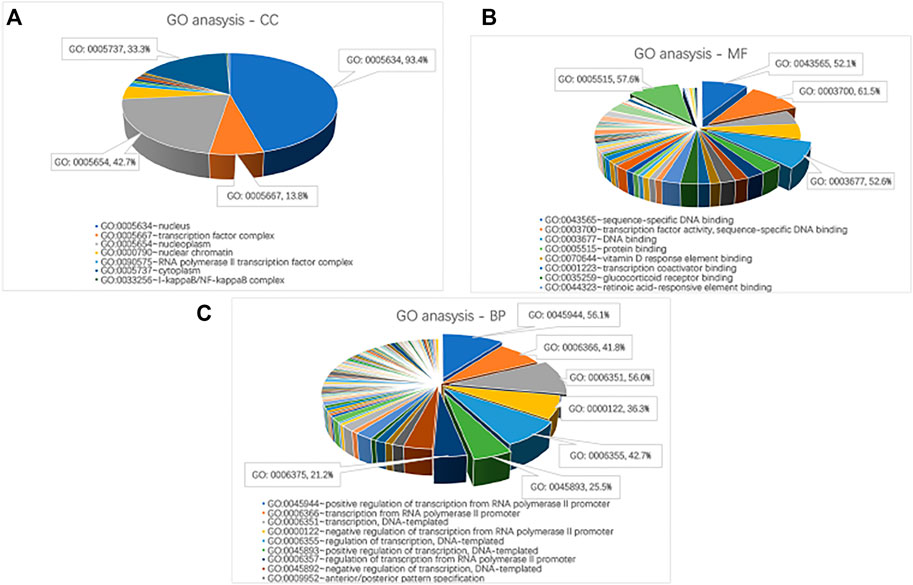
FIGURE 3. Go analysis on critical genes. (A) CC. (B) MF. (C) BP.
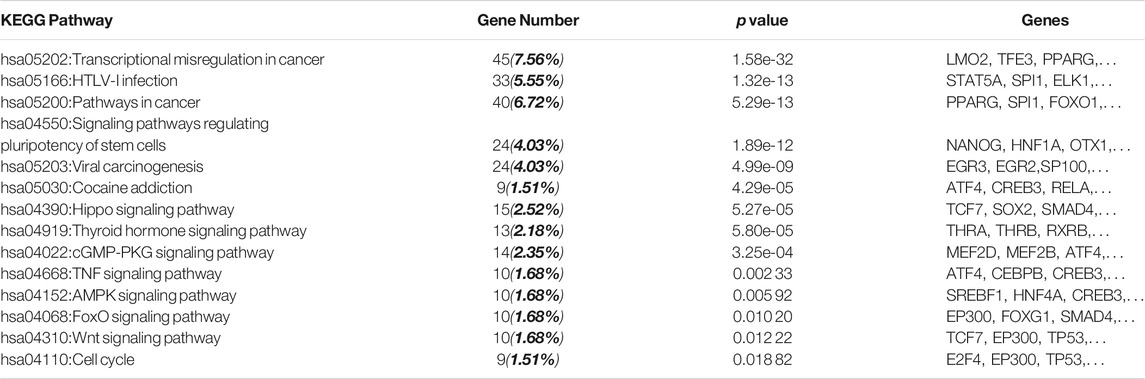
TABLE 4. KEGG Pathway analysis on critical genes.
From the above analysis, we can find that the critical genes we find are important and have an association with brain tumor. And GO analysis and KEGG pathway analysis provide the reference for further study on brain tumor.
2.4 Robustness Analysis of Node Classification
Since the critical nodes are vital and significant, it’s necessary to know whether the classification is robustness if the network is attacked. Therefore, the robustness of node classification is systematically tested by deleting edges or nodes.
2.4.1 Deleting Edges
Over 96% edges’ weights are between 0 and 0.10 in the three brain-specific gene regulatory networks. The detailed information can be seen in Table 5. Therefore, the edges, whose edge weight are smaller than 0.01, 0.02, … , 0.10, are deleted respectively to get new networks. Then the same method is used to identify the new networks’ critical nodes and ordinary nodes. Finally, the proportions of the critical nodes of the new networks to the original network are compared in Figure 4A and Supplementary Figure S4. It can be seen that the node classification is robust with respect to deleting edges in the three brain-specific gene regulatory networks. What’s more, through comparing the three curves in Figure 4B, we can know that the neuron associated cells cancer related GRN has higher value than the others, which means the neuron associated cells cancer related GRN is more robust than the health brain-specific gene regulatory networks.
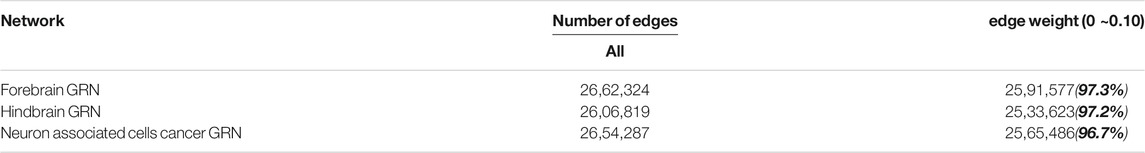
TABLE 5. The Edge weight ratios of three GRN networks.
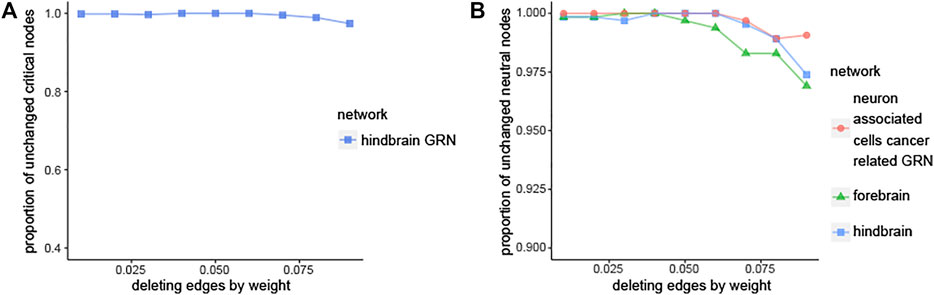
FIGURE 4. Robustness analysis of node classification. (A) Plot showing the fraction of ciritical nodes in new networks that overlaps with the original hindbrain GRN, the new networks are obtained by deleting edges from original hindbrain gene regulatory networks. (B) The comparison of three networks in case of deleting edges.
2.4.2 Deleting Nodes by Critical Nodes
In this part, the change of giant strongly connected component (GSCC) and giant weakly connected component (GWCC) are compared under three deleting strategies. It is applied to the three brain-specific gene regulatory networks in the same way, so we take hindbrain GRN for example. Firstly, deleting nodes randomly in the whole hindbrain GRN (noted as randomly—all). Secondly, deleting critical nodes randomly (noted as critical). Finally, deleting the same number of nodes as the second strategy in the whole hindbrain GRN, and whose nodes are deleted is randomly (noted as randomly—critical - all). Compared the curve of critical with randomly—all and randomly—critical—all, the results are shown in Figures 5A,B indicate that the maximal connected subgraph becomes smaller and smaller with the decrease of the critical nodes. It means that the critical nodes are crucial for the connection of the whole network. It is consistent with the results of forebrain GRN and neuron associated cells cancer related GRN from Supplementary Figure S5. Moreover, the maximal connected subgraph is bigger than the others as described in Figures 5C–H, which are the comparisons among three brain networks in the same strategy. It means that neuron associated cells cancer related GRN is more robust than normal and healthy brain-specific gene regulatory network.
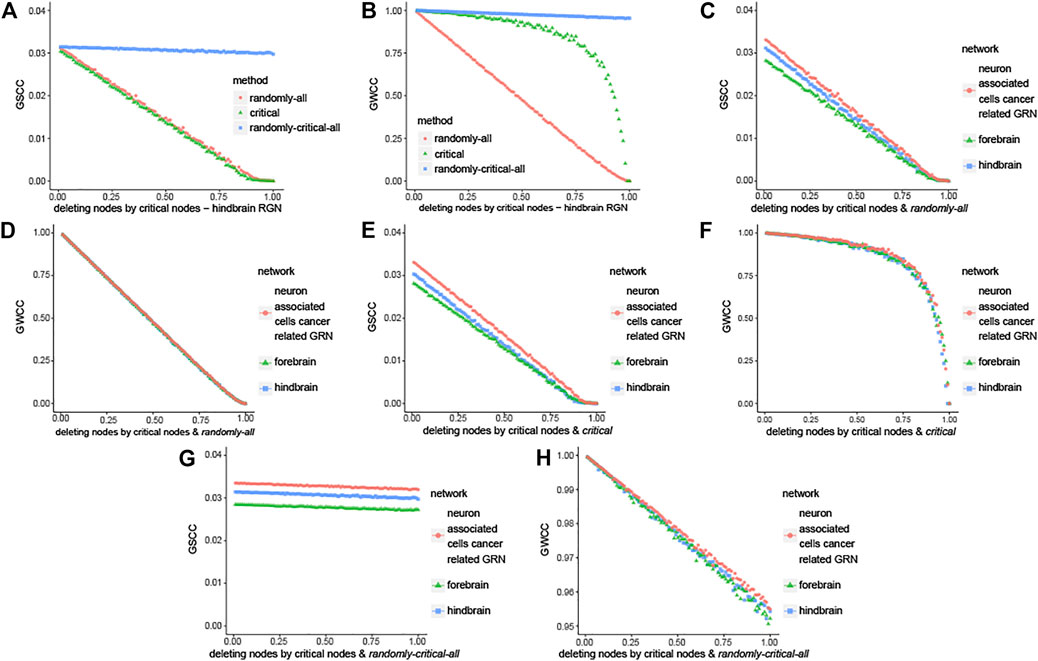
FIGURE 5. Robustness analysis of node classification. Here we noted the three strategies by the following ways: Firstly, deleting nodes randomly in the whole hindbrain GRN (noted as randomly—all). Secondly, deleting critical nodes randomly (noted as critical). Lastly deleting the same number of nodes as the second strategy in the whole hindbrain GRN, and which nodes are deleted is randomly (noted as randomly—critical—all). (A) The change of giant strongly connected component (GSCC) in hindbrain GRN with three methods that are different in the way of deleting critical nodes. (B) The change of giant weakly connected component (GWCC) in hindbrain GRN with three methods that are different in the way of deleting critical nodes. (C, D) Comparison in the way of deleting nodes randomly in the whole brain-specific GRN respectively. (E, F) Comparison in the way of critical. (G, H) Comparison in the way of randomly—critical—all.
3 Discussion
In this paper, the genes in human brain-specific genes regulatory networks (forebrain GRN, hindbrain GRN and neuron associated cells cancer related GRN) are divided into the critical genes and ordinary genes. By calculating eight topological properties (out-degree DO, in-degree DI, degree D, betweenness B, closeness CA, in-closeness CI, out-closeness CO and clustering coefficient CC), we find that the critical genes play important roles in the human brain-specific GRN networks. For example, the critical genes have larger score of CO than the ordinary genes. Biological enrichment analysis in essential genes database shows that critical genes are richer than the ordinary genes, so we predict that critical genes are more significant for us to explore biological information. Furthermore, the enrichments in cancer genes database and neuron related disease genes database are explored, and it is consistent with our prediction. Because the critical nodes are richer than the ordinary nodes in these gene databases. It indicates that the critical genes can contribute to identifying the disease genes related to brain. GO analysis and KEGG pathway analysis indicate that critical genes are associated with brain tumor and hint that they are rich in transcriptional misregulation in cancer, pathways in cancer and so on, which provide references for further study on brain tumor. Finally, tests show that the nodes classification method is robust when the network is attacked. And the tests indicate that the neuron associated cells cancer related GRN is more robust than normal and healthy brain-specific gene regulatory networks (forebrain GRN and hindbrain GRN), which is straightaway that a person gets sick easily but regains health difficultly.
In conclusion, controllability theory is also a useful tool to analyse human brain-specific gene regulatory network. It can provide a feasible direction for biologists to study whether the biomarker mined by the proposed method is related to brain tumor or not. In addition, the research work also raises a number of questions. For instance, how can we quantify the influence of each critical genes for the network? Can the work expand to the structure of function brain network? Answers to these questions can further provide theoretical foundation for designing experiments.
4 Methods
4.1 Brain-specific Gene Regulatory Networks
There are three kinds of brain-specific gene regulatory networks. For convenience, we called them hindbrain GRN, forebrain GRN and neuron associated cells cancer related GRN respectively. Hindbrain GRN and forebrain GRN are normal and healthy adult’s brain-specific gene regulatory networks, while the neuron associated cells cancer related GRN is the patient’s brain-specific gene regulatory network, who suffers from brain tumor. They all are dealt with by deleting edges whose edge weights are smaller than 0.05 before we use them to analyse in this paper.
4.2 Structural Controllability and Its Applications to Biological Networks
Biological networks are complex nonlinear systems. The controllability of nonlinear systems is structurally similar to that of linear systems (Slotine and Li, 1991; Liu et al., 2011). We study a system with canonical linear, time-invariant dynamics formulated by Lombardi and Hörnquist (2007).
where the vector
In control theory, a system is controllable if it can be driven from any initial state to any desired final state during a finite time period (Kalman, 1963). According to Kalman’s controllability rank condition (Kalman, 1963), the system represented by Eq. 1 is controllable if and only if the N × NM controllability matrix C has full rank, i.e.,
This controllability rank condition indicates that to control the full network we must identify the number of signals and the nodes into which the signals are injected, called driver nodes. Liu et al. (2011) recently showed that a full system can be structurally controlled by inputting signals into a minimum set of driver nodes. A system is structurally controllable if it is possible to choose non-zero weights in A and B such that Eq. 2 holds (Liu et al., 2011). The minimum number of driver nodes for controlling a full network is denoted ND and the minimum driver node density is nD = ND/N. The minimum driver node density required to control the full complex network quantifies its structural controllability (Liu et al., 2011; Liu et al., 2015).
Structural controllability analysis has been applied to some biological networks, where interesting properties on the biological system and drug-targets have been discovered (Liu and Pan, 2014; Liu and Pan, 2015; Vinayagam et al., 2016). According to the frequency of appearing in the minimum driver node sets, or the impact of removing a node on the minimum number of driver nodes, the nodes can be classified in to different classes: critical, redundant and ordinary (as explained in the following subsection). In biological molecular networks, biological molecules can be classified with different roles. By doing biological enrichment analysis of these different biological roles, candidate essential genes or drug-targets can be identified.
4.3 Node Classification
According to the control theory, a dynamical system is controllable if, with a suitable choice of inputs, it can be driven from any initial state to any desired final state within finite time (Kalman, 1963; Luenberger, 1979). By using the analytical tool developed by Liu et al. (2011), we can identify the set of driver nodes in an arbitrary complex directed network, with time-dependent control that can guide the systems entire dynamics to study its controllability. Moreover, the minimum number of driver nodes is determined for a determined network. Hence, the mathematical framework and analytical tools that have been developed by Vinayagam et al. (2016) can be used to compute the minimum number, and denote it as ND. After removing a node, we denote the minimum number of driver nodes of the damaged network as
4.4 Biological Enrichment Score Calculating Analysis
Biological enrichment score calculating analysis is a method for enrichment analysis of gene sets, which is used to identify gene classes that are over-expressed in a large group of genes and may be related to disease phenotypes. This method uses statistical methods to identify significantly enriched or missing genomes. Microarray and proteomic results usually identify thousands of genes for analysis (Subramanian et al., 2005).
As described in Figure 6, the oval part represents the gene set of the network under study, which is represented by S. here, it refers to the genes that need to be analyzed in the brain gene regulatory network (the network can be the forebrain GRN, hindbrain GRN and neuron associated cells cancer related GRN respectively; the gene can be the critical gene set or the ordinary gene set). The rectangular part represents some known functional gene databases, such as essential genes, cancer genes, conserved genes or other disease-related genes respectively, which is represented by DB. Overlap means that there will be some intersection of genetic data between them. Biological enrichment score calculating analysis is used to quantify the ratio of the critical genes after classification to the known functional gene databases.
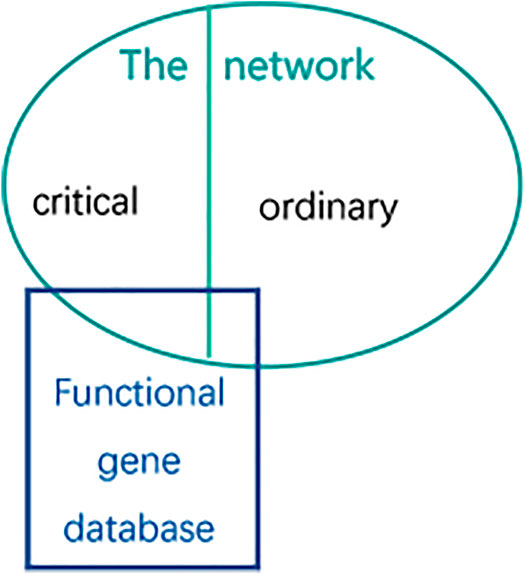
FIGURE 6. The method of Biological enrichment analysis. The circle represents genes of the network which represents forebrain GRN, hindbrain GRN and neuron associated cells cancer related GRN respectively. And the rectangle represents the functional gene database which is on behalf of essential genes, conserved genes, cancer genes or the related genes respectively.
Then the z score is calculated to estimate the enrichment by the Eq. 3:
where SDB is the number of genes in the intersection of set DB and S. RDB is the number of intersection genes between the set DB and the extracted gene set, which are extracted SDB genes randomly from S. And the mean of RDB is the mean value of RDB calculated after 1,000 random samples, while SD of RDB is the standard deviation calculated after 1,000 random samples. It’s obvious that critical genes are rich in database DB if z score is bigger than 0.
Essential genes are obtained from DEG database, whose number is 8,254 for human (Zhang et al., 2004). Cancer genes are in COSMIC database (Futreal et al., 2004, and we collect 616 cancer genes for our work. Finally, the related disease genes are found in the Gene database (NCBI, https://www.ncbi.nlm.nih.gov/).
4.5 Survival Analysis
To validate whether the expression of critical genes are related to the survival time of prognosis, we conducted survival analysis by GEPIA (Tang et al., 2017). In the tool, we selected two brain-correlated cancers including brain lower grade glioma (LGG) and glioblastoma multiforme (GBM) from TCGA for analysis. The median value of the gene was selected as a cut-off to divide the samples into high and low expression group. As shown in Figure 7, the top 6 critical genes are highly related to the survival time of prognosis on both LGG and GBM. This indicates that the identified critical genes based on structural controllability analysis may also serve as potential biomarkers for the survival time of prognosis.
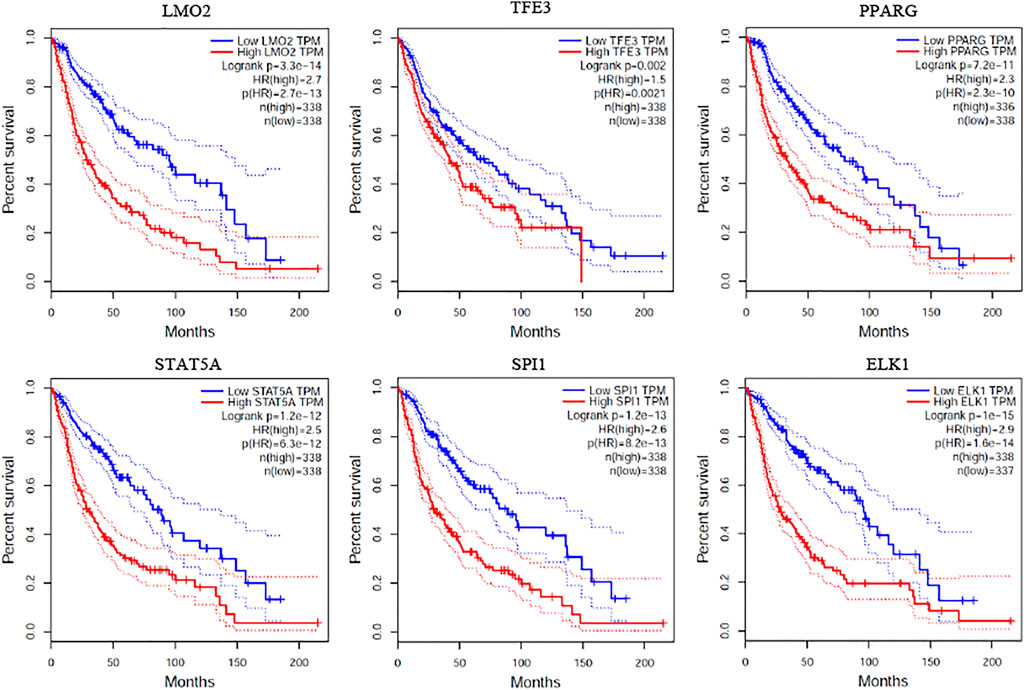
FIGURE 7. Survival analysis.
5 Conclusion
The comparison of neuron associated cells cancer related GRN and normal brain-specific GRNs (including forebrain and hindbrain GRN) shows that the neuron-related cell cancer-related gene regulatory network is more robust than other types. In order to obtain more network analysis results, we can consider combining disease-gene relationship data with gene-gene action relationship data to further improve the network topology and effective description, and explore more pathogenic mechanisms. At the same time, in terms of biological function analysis, we can further explore the biological function significance of the screened genes through more biological function analysis methods, so as to provide more specific tips for the research of glioma.
Data Availability Statement
The original contributions presented in the study are included in the article/Supplementary Material, further inquiries can be directed to the corresponding author.
Author Contributions
ZC and SC did genetic analysis, performed the statistical analysis and drafted the manuscript. XQ designed this study and revised the manuscript. All authors read and approved the final manuscript.
Funding
This work was supported by Grants from the National Natural Science Foundation of China (Grant No.61876047).
Conflict of Interest
The authors declare that the research was conducted in the absence of any commercial or financial relationships that could be construed as a potential conflict of interest.
Publisher’s Note
All claims expressed in this article are solely those of the authors and do not necessarily represent those of their affiliated organizations, or those of the publisher, the editors, and the reviewers. Any product that may be evaluated in this article, or claim that may be made by its manufacturer, is not guaranteed or endorsed by the publisher.
Acknowledgments
We are grateful to Xueming Liu for revision and editing English-writing. And we also thank the financial support for this work from the Chinese National Natural Science Foundation 61876047.
Supplementary Material
The Supplementary Material for this article can be found online at: https://www.frontiersin.org/articles/10.3389/fbinf.2022.812314/full#supplementary-material
References
Barabási, A. L. (2009). Scale-free Networks: a Decade and beyond. Science 325, 412–413. doi:10.1126/science.1173299
Börner, K., Sanyal, S., and Vespignani, A. (2007). Network Science. Ann. Rev. Info. Sci. Tech. 41, 537–607. doi:10.1002/aris.2007.1440410119
Bray, F., Ferlay, J., Soerjomataram, I., Siegel, R. L., Torre, L. A., and Jemal, A. (2018). Global Cancer Statistics 2018: Globocan Estimates of Incidence and Mortality Worldwide for 36 Cancers in 185 Countries. CA Cancer J. Clin. 68, 394–424. doi:10.3322/caac.21492
Chang, L. (2015). Local Controllability of Biological Networks. Ph.D. thesis. Available at: http://scholarbank.nus.edu.sg/handle/10635/121343
Cai, S., Han, H. J., and Kohwi-Shigematsu, T. (2003). Tissue-specific Nuclear Architecture and Gene Expression Regulated by SATB1. Nat. Genet. 34, 42–51. doi:10.1038/ng1146
Cheng, Y., Morshed, R. A., Auffinger, B., Tobias, A. L., and Lesniak, M. S. (2014). Multifunctional Nanoparticles for Brain Tumor Imaging and Therapy. Adv. Drug Deliv. Rev. 66, 42–57. doi:10.1016/j.addr.2013.09.006
du Plessis, L., Škunca, N., and Dessimoz, C. (2011). The what, where, How and Why of Gene Ontology-Aa Primer for Bioinformaticians. Brief Bioinform 12, 723–735. doi:10.1093/bib/bbr002
Fass, D. M., Lewis, M. C., Ahmad, R., Szucs, M. J., Zhang, Q., Fleishman, M., et al. (2018). Brain-specific Deletion of Git1 Impairs Cognition and Alters Phosphorylation of Synaptic Protein Networks Implicated in Schizophrenia Susceptibility. bioRxiv, 290312. doi:10.1101/290312
Ferlay, J., Soerjomataram, I., Ervik, M., Dikshit, R., Eser, S., Mathers, C., et al. (2012). Cancer Incidence and Mortality Worldwide: Iarc Cancerbase. GLOBOCAN 2012 v10 11, 11.
Futreal, P. A., Coin, L., Marshall, M., Down, T., Hubbard, T., Wooster, R., et al. (2004). A Census of Human Cancer Genes. Nat. Rev. Cancer 4, 177–183. doi:10.1038/nrc1299
Gao, J., Liu, X., Li, D., and Havlin, S. (2015). Recent Progress on the Resilience of Complex Networks. Energies 8, 12187–12210. doi:10.3390/en81012187
Kalman, R. E. (1963). Mathematical Description of Linear Dynamical Systems. J. Soc. Ind. Appl. Maths. Ser. A Control. 1, 152–192. doi:10.1137/0301010
Kanehisa, M., and Goto, S. (2000). Kegg: Kyoto Encyclopedia of Genes and Genomes. Nucleic Acids Res. 28, 27–30. doi:10.1093/nar/28.1.27
Kitano, H. (2002). Systems Biology: a Brief Overview. science 295, 1662–1664. doi:10.1126/science.1069492
Liu, X., and Pan, L. (2014). Detection of Driver Metabolites in the Human Liver Metabolic Network Using Structural Controllability Analysis. BMC Syst. Biol. 8, 51. doi:10.1186/1752-0509-8-51
Liu, X., Pan, L., Stanley, H. E., and Gao, J. (2017). Controllability of Giant Connected Components in a Directed Network. Phys. Rev. E 95, 042318. doi:10.1103/PhysRevE.95.042318
Liu, X., Pan, L., Stanley, H. E., and Gao, J. (2019b). Multiple Phase Transitions in Networks of Directed Networks. Phys. Rev. E 99, 012312. doi:10.1103/PhysRevE.99.012312
Liu, X., Stanley, H. E., and Gao, J. (2016). Breakdown of Interdependent Directed Networks. Proc. Natl. Acad. Sci. U S A. 113, 1138–1143. doi:10.1073/pnas.1523412113
Liu, X., Maiorino, E., Halu, A., Loscalzo, J., Gao, J., and Sharma, A. (2019a). Robustness and Lethality in Multilayer Biological Molecular Networks. Nat. Commun. 11, 6043. doi:10.1101/818963
Liu, X., and Pan, L. (2016a). Controllability of the Better Chosen Partial Networks. Physica A: Stat. Mech. its Appl. 456, 120–127. doi:10.1016/j.physa.2016.03.013
Liu, X., and Pan, L. (2016b). Predicating Candidate Cancer-Associated Genes in the Human Signaling Network Using Centrality. Cbio 11, 87–92. doi:10.2174/1574893611888160106154456
Liu, X., Peng, H., and Gao, J. (2015). Vulnerability and Controllability of Networks of Networks. Chaos, Solitons & Fractals 80, 125–138. doi:10.1016/j.chaos.2015.08.009
Liu, Y. Y., Slotine, J. J., and Barabási, A. L. (2011). Controllability of Complex Networks. nature 473, 167–173. doi:10.1038/nature10011
Lombardi, A., and Hörnquist, M. (2007). Controllability Analysis of Networks. Phys. Rev. E Stat. Nonlin Soft Matter Phys. 75, 056110. doi:10.1103/PhysRevE.75.056110
Luenberger, D. G. (1979). Introduction to Dynamic Systems: Theory, Models and Applications, 1. New York: Wiley.
Malod-Dognin, N., Petschnigg, J., Windels, S. F. L., Povh, J., Hemingway, H., Ketteler, R., et al. (2019). Towards a Data-Integrated Cell. Nat. Commun. 10, 805. doi:10.1038/s41467-019-08797-8
Marbach, D., Lamparter, D., Quon, G., Kellis, M., Kutalik, Z., and Bergmann, S. (2016). Tissue-specific Regulatory Circuits Reveal Variable Modular Perturbations across Complex Diseases. Nat. Methods 13, 366–370. doi:10.1038/nmeth.3799
McGuire, S. (2016). World Cancer Report 2014. Geneva: World health organization, international agency for research on cancer, who press.
McKenzie, A. T., Wang, M., Hauberg, M. E., Fullard, J. F., Kozlenkov, A., Keenan, A., et al. (2018). Brain Cell Type Specific Gene Expression and Co-expression Network Architectures. Sci. Rep. 8, 8868. doi:10.1038/s41598-018-27293-5
Mehta, M., Vogelbaum, M. A., Chang, S., and Patel, N. (2011). Neoplasms of the central Nervous System. Cancer principles Pract. Oncol. 9, 1700–1749.
Ortmayr, K., Dubuis, S., and Zampieri, M. (2019). Metabolic Profiling of Cancer Cells Reveals Genome-wide Crosstalk between Transcriptional Regulators and Metabolism. Nat. Commun. 10, 1841. doi:10.1038/s41467-019-09695-9
Peng, H., Zhao, D., Liu, X., and Gao, J. (2015). Collective Motion in a Network of Self-Propelled Agent Systems. PloS one 10, e0144153. doi:10.1371/journal.pone.0144153
Slotine, J.-J. E., and Li, W. (1991). Applied Nonlinear Control, 199. Englewood Cliffs, NJ: Prentice-Hall.
Sporns, O., Tononi, G., and Kötter, R. (2005). The Human Connectome: a Structural Description of the Human Brain. Plos Comput. Biol. 1, e42. doi:10.1371/journal.pcbi.0010042
Subramanian, A., Tamayo, P., Mootha, V. K., Mukherjee, S., Ebert, B. L., Gillette, M. A., et al. (2005). Gene Set Enrichment Analysis: a Knowledge-Based Approach for Interpreting Genome-wide Expression Profiles. Proc. Natl. Acad. Sci. U S A. 102, 15545–15550. doi:10.1073/pnas.0506580102
Tang, Z., Li, C., Kang, B., Gao, G., Li, C., and Zhang, Z. (2017). Gepia: a Web Server for Cancer and normal Gene Expression Profiling and Interactive Analyses. Nucleic Acids Res. 45, W98. doi:10.1093/nar/gkx247
Vinayagam, A., Gibson, T. E., Lee, H. J., Yilmazel, B., Roesel, C., Hu, Y., et al. (2016). Controllability Analysis of the Directed Human Protein Interaction Network Identifies Disease Genes and Drug Targets. Proc. Natl. Acad. Sci. U S A. 113, 4976–4981. doi:10.1073/pnas.1603992113
Xueming Liu, X., and Linqiang Pan, L. (2015). Identifying Driver Nodes in the Human Signaling Network Using Structural Controllability Analysis. Ieee/acm Trans. Comput. Biol. Bioinf. 12, 467–472. doi:10.1109/tcbb.2014.2360396
Yan, G., Vértes, P. E., Towlson, E. K., Chew, Y. L., Walker, D. S., Schafer, W. R., et al. (2017). Network Control Principles Predict Neuron Function in the caenorhabditis Elegans Connectome. Nature 550, 519–523. doi:10.1038/nature24056
Keywords: brain-specific gene regulatory network, controllability analysis, biomarker, brain tumor research, robustness analysis
Citation: Chen Z, Chen S and Qiang X (2022) Identification of Biomarker in Brain-specific Gene Regulatory Network Using Structural Controllability Analysis. Front. Bioinform. 2:812314. doi: 10.3389/fbinf.2022.812314
Received: 10 November 2021; Accepted: 05 January 2022;
Published: 26 January 2022.
Edited by:
Christine Brun, Centre National de la Recherche Scientifique (CNRS), FranceReviewed by:
Jin-Xing Liu, Qufu Normal University, ChinaRuiqing Zheng, Central South University, China
Copyright © 2022 Chen, Chen and Qiang. This is an open-access article distributed under the terms of the Creative Commons Attribution License (CC BY). The use, distribution or reproduction in other forums is permitted, provided the original author(s) and the copyright owner(s) are credited and that the original publication in this journal is cited, in accordance with accepted academic practice. No use, distribution or reproduction is permitted which does not comply with these terms.
*Correspondence: Xiaoli Qiang, cWlhbmd4bEBnemh1LmVkdS5jbg==