 Kerstin Schmid
 Andreas Knote
 Alexander Mück
 Keram Pfeiffer
 Sebastian von Mammen
 Sabine C. Fischer
94% of researchers rate our articles as excellent or good
Learn more about the work of our research integrity team to safeguard the quality of each article we publish.
Find out more
ORIGINAL RESEARCH article
Front. Bioinform., 26 January 2022
Sec. Data Visualization
Volume 1 - 2021 | https://doi.org/10.3389/fbinf.2021.774300
This article is part of the Research Topic11th International Meeting on Visualizing Biological Data (VIZBI 2021)View all 12 articles
In interdisciplinary fields such as systems biology, good communication between experimentalists and theorists is crucial for the success of a project. Theoretical modeling in physiology usually describes complex systems with many interdependencies. On one hand, these models have to be grounded on experimental data. On the other hand, experimenters must be able to understand the interdependent complexities of the theoretical model in order to interpret the model’s results in the physiological context. We promote interactive, visual simulations as an engaging way to present theoretical models in physiology and to make complex processes tangible. Based on a requirements analysis, we developed a new model for gas exchange in the human alveolus in combination with an interactive simulation software named Alvin. Alvin exceeds the current standard with its spatio-temporal resolution and a combination of visual and quantitative feedback. In Alvin, the course of the simulation can be traced in a three-dimensional rendering of an alveolus and dynamic plots. The user can interact by configuring essential model parameters. Alvin allows to run and compare multiple simulation instances simultaneously. We exemplified the use of Alvin for research by identifying unknown dependencies in published experimental data. Employing a detailed questionnaire, we showed the benefits of Alvin for education. We postulate that interactive, visual simulation of theoretical models, as we have implemented with Alvin on respiratory processes in the alveolus, can be of great help for communication between specialists and thereby advancing research.
Systems biology is a highly interdisciplinary research field that integrates theoretical modeling and experimental data (Gavaghan et al., 2006). A key component of projects with valuable scientific progress is close cooperation between experimentalists and theorists (Byrne et al., 2006; Drubin and Oster, 2010; Welsh et al., 2006). However, this entails certain challenges. Different ways of thinking and terminologies or jargon often hinder communication between the disciplines. Ongoing efforts to bridge the gap include educational reviews [e.g., (Sharpe, 2017; Fischer, 2019)], summer schools, special research programs (https://www.newton.ac.uk/event/cgp/) and large multi-laboratory initiatives such as the Virtual Physiological Human (Viceconti et al., 2008) or The Virtual Brain (https://www.thevirtualbrain.org). Key components of these approaches are informative visualizations and the possibility of hands-on experience.
The goal of our study was to create a tool to better present modeling results to experimenters. To this end, we consider communicating results of mathematical modeling in physiology. In publications, models are usually presented as follows (Mogilner et al., 2011): The model definition is given in terms of mathematical equations, occasionally supported by schematic diagrams describing the model structure. For the corresponding simulations, all parameter values are listed and the output is visualized in graphs and compared with experimental data, where appropriate. When modeling spatial structures and processes, the simulation output is presented in still images or, if possible, animations (Chao, 2003; Lin et al., 2004; Saber and Heydari, 2012). As an alternative for the communication of state of the art theoretical models, we promote interactive, visual simulation. Previous approaches include computer-aided diagnosis software (Xiong et al., 2017; Conover et al., 2018) or systems for medical education (Jacob et al., 2012; Jamniczky et al., 2012; Costabile, 2021). We focus on the human lung. Existing interactive systems for teaching in this field address respiratory mechanics (Kuebler et al., 2007; Warliah et al., 2012) or gas exchange (Kapitan, 2008). All above systems for teaching convey established educational content. They have not been intended to advance the current state of research. In contrast, (Winkler et al., 1995) argue that their interactive system has great utility beyond its educational use. They have developed an application that provides an interactive interface with a simulation of a multi-compartment model. Ventilation mechanics, gas transport, gas mixing and gas exchange are considered. However, the actual process of gas exchange, the key functionality of the human lung, remains as abstract as the site where it occurs.
We thus focused on the smallest functional unit of the lung - the alveolus. The overarching goal was to provide an interactive visualization of the process of gas exchange in the human alveolus for research and education. We refined and combined existing models (Weibel et al., 1993; Dash et al., 2016) to cover the complete transport of oxygen into hemoglobin. The resulting model provided the computational core for an interactive simulation software named Alvin. Alvin facilitates investigations of relationships between morphological and physiological factors and the course of gas exchange. The software enables systematic investigations of our model with respect to experimental data. We aimed to maximize the usability of Alvin for both research-related and educational usage. As an exemplary use case in research, we present a plausibility check of pulmonary diffusion capacity measurements. Concerning the applicability of Alvin in teaching, we present the details of its integration into a digital physiology lab course for undergraduate students and the results of a corresponding survey among its participants. The software is available for download at https://go.uniwue.de/alvin.
Particular about our work is the development of the mathematical model with the aim of visualization in combination with the requirements-based engineering of the simulation software. This resulted in an advanced gas exchange model and an interactive application that exceed the existing standard. Specifically, design features as the ability to run and compare multiple simulation instances at the same time and the combination of providing parameter value presets as well as allowing parameter configurations by the user are key contributions to the field. This results in an educationally valuable application that also allows revealing unknown underlying assumptions of results presented in the literature. Taken together, our work demonstrates that an interactive, visual simulation is a versatile and powerful tool to visualize modeling results for both researchers and students.
On the basis of our goals, corresponding requirements were defined in a user-centered engineering approach. Our interdisciplinary team included a development team (AK, AM, KS) and supervising experts (SvM for games engineering, SCF for mathematical modelling, KP for physiology education). Concepts on requirements were first drafted within the development team. These concepts were then either acknowledged by experts/stakeholders in a quality gateway or returned for revision. The higher-level requirements could be categorized into three groups: Scientific (S), educational (E) and accessibility (A) requirements.
S.1. Gas exchange model suitable for interactive configuration.
S.2. Interfaces for interaction.
S.3. Quantitative simulation output.
S.4. Visual feedback that emphasizes the connection between structure and function of the alveolus.
E.1. Presentation of educationally relevant respiratory phenomena.
E.2. Facilitate autonomous work with the application.
A.1. Compatibility with common devices (computers or tablets with windows, iOS or linux).
A.2. Simple and clear GUI (to enhance the intuitive use of the system).
A.3. Applicability to the widest possible range of scientific issues.
In an iterative process, system requirements and final design requirements were developed from these higher-level user requirements (and recorded in a total of 166 GitLab issues). The complete set of requirements is listed in Section S1.1 of the Supplementary Material.
The human lung consists of progressively branching bronchi and bronchioles, and blood vessels follow this structure (Hsia et al., 2016). The respiratory zone begins where the first alveoli adjoin the bronchioles (Haefeli-Bleuer and Weibel, 1988). Alveoli are hollow protrusions that have a large surface area and a thin tissue barrier. They are surrounded by a dense network of fine capillaries (Weibel and Gomez, 1962). Within an alveolus, inhaled air passes through the cavity and gas exchange with the capillary blood takes place through the tissue barrier (Weibel, 2009). An alveolus thus represents the smallest functional unit of the lung. We established a spatio-temporal model of gas exchange in the human alveolus based on empirically established models (Weibel et al., 1993; Dash et al., 2016) (requirement S.1). This entailed the integration of the established models and the alignment of their numerical scales. Any gaps in the model had to be identified and closed. Finally, the new model was validated against data from the literature.
The process of gas exchange in an alveolus can be divided into two sequential steps (Roughton and Forster, 1957): 1. The diffusion of oxygen through the tissue barrier into the blood and red blood cells and 2. its binding to hemoglobin (Hb). For each step, we adopted an established model describing this process (Weibel et al., 1993; Dash et al., 2016). By integrating the two sub-models into a complete model we can simulate the entire process of gas exchange inside an alveolus. The diffusion of oxygen across the alveolar wall is calculated based on Fick’s law (Weibel et al., 1993), resulting in
The oxygen flow ν across the barrier is a function of the pressure gradient ΔpO2 between air and blood and morphological parameters that contribute to the so called membrane diffusing capacity for oxygen DMO2. More precisely, DMO2 comprises the ratio between surface area s and barrier thickness τ multiplied by the permeability coefficient
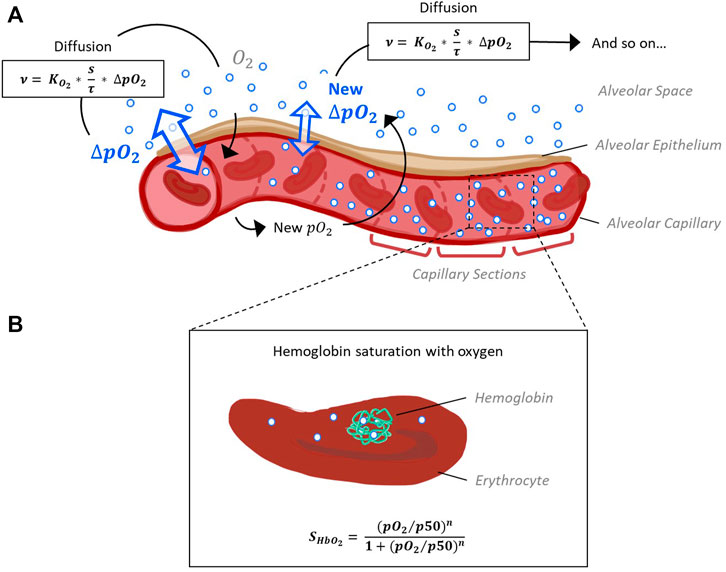
FIGURE 1. Schematic representation of the model capillary with erythrocytes, separated from alveolar space by a single cell layer of alveolar epithelium. (A) In order to reconstruct O2 and CO2 pressure gradients along the capillary, it is divided into sections of equal size. The pressure gradient between alveolar space and blood (ΔpO2) and the resulting flow of oxygen along this gradient is calculated for each section subsequently, as oxygen flow into one section affects pO2 and thus ΔpO2 of the next section. Calculation of oxygen diffusion depending on ΔpO2 is based on Fick’s law (Weibel et al., 1993). (B) According to the pO2 and pCO2 gradients along the capillary sections determined in step 1, hemoglobin oxygen saturation (SHbO2) is calculated for each section. The corresponding Hill equation has been defined and fitted to experimental data (Dash et al., 2016).
The quantity of CO2 diffusing out of the capillary and into the alveolus is determined via the respiratory exchange ratio from the quantity of oxygen that is taken up by the blood. The respiratory exchange ratio is defined as the amount of CO2 produced divided by the amount of O2 consumed. This ratio is assessed by analyzing exhaled air in comparison with the environmental air and its average value for the human diet is around 0.82 (Sharma et al., 2020). Taken together, this provides a time-resolved model for the first step of gas exchange: The diffusion of oxygen from inhaled air into the capillary blood of the alveolus and of carbon dioxide in the reverse direction.
In a second step, the binding of O2 and CO2 to hemoglobin was adopted from (Dash et al., 2016), such that
Hemoglobin oxygen saturation (SHbO2) is expressed as a Hill function depending on pO2, the Hill coefficient nH and p50, the value of pO2 at which hemoglobin is 50% saturated with O2. The parameter nH, in turn, depends on pO2. Polynomial expressions describe the dependence of p50 on pCO2 in the blood, blood temperature, the pH inside erythrocytes (pHrbc) and concentration of the organic phosphate 2,3-bisphosphoglycerate ([2,3]-DPG). These dependencies have been described and fitted to several experimental data sets (Dash et al., 2016) for a wide range of parameter values (fulfills requirement A.3.1). In our model, SHbO2 is calculated for each section according to the pO2 and pCO2 gradients along the capillary sections determined in step 1. Hence, we obtain the distribution of blood oxygen saturation along the capillary as the main output of our model.
Together, this yields a model for the complete process of oxygen transport from inhaled air into hemoglobin in the blood with spatio-temporal resolution. All parameters essential for the model and their default values were collected from the literature and represent a normal, healthy condition (Table 1).
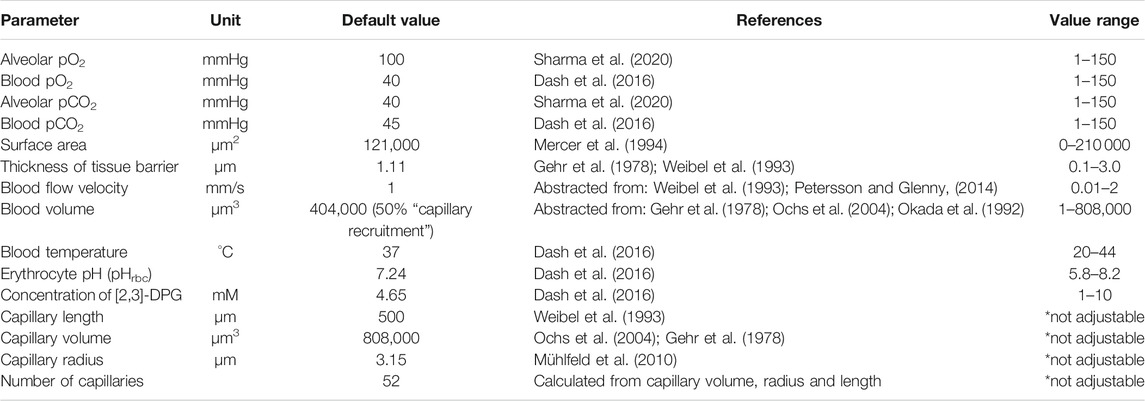
TABLE 1. Model parameters and their default values. Values of morphological and physiological parameters of the gas exchange model were collected from literature. All values given are mean values referring to a single alveolus.
In a first step of model validation, we analysed whether the two sub models from step 1 and step 2 had been sensibly adapted from the literature. In our model, oxygen diffusion is estimated for a single alveolus with a surface area of 121,000 μm2. Other parameters affecting DMO2 (namely tissue barrier thickness and permeability coefficient, see Eq. 1) were adopted without change. DMO2 of the whole lung in relation to body weight (bw) was estimated as 0.079 ml/(s × mmHg × kg) (Weibel et al., 1993). To compare our model result (DMO2(model) = 6 × 10⁻⁹ ml/(s × mmHg)) with Weibel’s estimate, it needs to be extrapolated to the organ scale. Multiplying DMO2(model) by the number of alveoli in the human lung (480 × 106 (Ochs et al., 2004)) results in a DMO2(model, extrapolated) of 2.88 ml/(s × mmHg). This value is distinctly lower than the DMO2 estimated by Weibel et al., assuming a standard body weight of 70 kg: DMO2(Weibel, bw 70 kg) = 5.53 ml/(s × mmHg). This estimate has been based on morphometric studies in fully inflated, fluid-filled lungs (Weibel et al., 1993). It is recognized that in an air-filled lung, however, only about 60–70% of the alveolar surface is exposed to air (Gil et al., 1979; Bachofen et al., 1987). The default value for surface area in our model was taken from studies on perfusion-fixed, air-filled lungs (Mercer et al., 1994). Hence, our combination of parameter values for the surface area of a single alveolus (Mercer et al., 1994) and the number of alveoli in the human lung (Ochs et al., 2004) produce a result that falls short of the previous estimate. However, the discrepancy is explained by known differences in the morphometric methods used. We deliberately chose the surface value from the study on an air-filled lung to be as close as possible to the in vivo situation. The sub model describing hemoglobin oxygen saturation was adopted from the literature (Dash et al., 2016) without further modifications. Hb-O2 dissociation curves across the different parameter ranges from this publication [Figure 4 E-H in (Dash et al., 2016)] were recreated and indicate a correct implementation of the model (Figure 2).
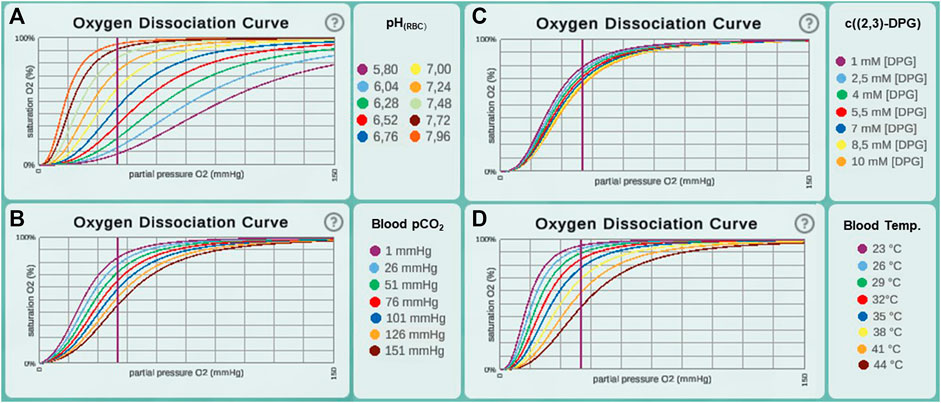
FIGURE 2. Oxygen dissociation curves recreated in Alvin for different ranges of parameter values from the original paper (Dash et al., 2016). This includes value ranges for the parameters (A) pH in erythrocytes (pHrbc), (B) blood pCO2, (C) concentration of [2,3]-DPG and (D) blood temperature.
In a second step, the complete integrative model was validated. We used published experimental data to validate our model. A key contribution of our model is the temporal and spatial resolution. Rather than determining mean values, oxygen partial pressure and saturation gradients along the alveolar capillary are generated. This allows validation of the model in a physiological context. For default parameter settings, 50% of the oxygenation that blood undergoes during its transit along the alveolus is completed after 0.04 s (Figure 3). This measurement was performed for an increase in saturation from 81 to 97%, reaching the reaction half-time at 89%. The corresponding measurement in mice is 0.037 s (Tabuchi et al., 2013) and it has been argued that there are only slight differences between species (Lindstedt, 1984). In summary, we showed that we have correctly adopted and sensibly modified the individual models. Our new integrative model provides results that are consistent with experimental data.
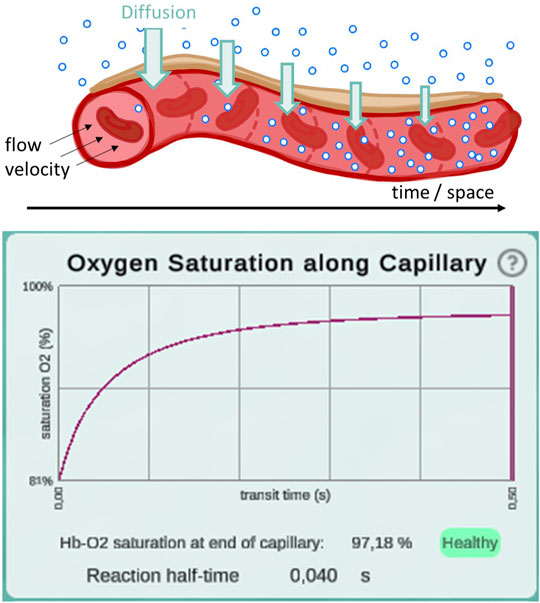
FIGURE 3. Illustration of the diffusion gradient along the model capillary (top) and a screenshot of the plot displaying oxygen saturation along capillary between 81 and 97% (bottom). This screenshot was taken from a simulation with pO2 values of 97 mmHg in the alveolar space and 46 mmHg in the deoxygenated blood. All other parameters remained at their default settings. Reaction half-time is defined as the time point at which 50% of the oxygenation that blood undergoes during its transit along the alveolus is reached.
Our mathematical model was assembled from two existing sub models (Weibel et al., 1993; Dash et al., 2016). One sub model describes the diffusion rate of oxygen from the air into the blood depending on morphological properties (Weibel et al., 1993). In this preceding work, the lung has been defined simplistically as a single container of air and the partial pressure of oxygen in the blood has been considered constant. Some simplifications still exist in our new model. For example, the introduction of a breathing pattern was neglected: Partial pressure changes in alveolar space only occur when respective parameter values are modified by the user (suggests that O2 diffusing out of the alveolus is instantly replaced and CO2 diffusing into the alveolus is evacuated immediately). Also, blood flow was approximated as a continuous flow of a homogeneous plasma/erythrocyte mixture. However, our new integrative model also features improvements compared to the original models. Instead of steady states, it provides information about oxygen transport over the continuous course of time. It has already been noted that a time-dependent modeling approach is better suited to reconstruct gas exchange in lung tissue than steady-state approaches (Sapoval et al., 2020). Accordingly, the temporal resolution is a valuable improvement to the model.
For validation, we compared reaction half-time results from our model with what has been reported in the literature (Tabuchi et al., 2013). Reaction half-time is defined as the time that elapses until 50% of the oxygenation that blood undergoes during its transit along the alveolus is complete. We measured 40 ms with default parameter settings. Experimentally, a half-time of 37 ms has been determined in mice (Tabuchi et al., 2013). Corresponding theoretical predictions have been slightly lower at 18–32 ms. Tabuchi et al. argue that this discrepancy is due to the fact that the oxygenation process already takes place in the precapillary arterioles, but for the prediction only capillaries were considered. Since only capillaries are considered in Alvin as well, we may suspect that our value underestimates the in vivo human reaction half-time slightly.
In our model, capillaries are divided into an arbitrary number of sections. The finer grained this discretisation, i.e. the smaller the individual sections and the larger their number, the larger is the resolution of calculated gas dynamics and, thus, the resulting accuracy. However, as described in the following section, our model forms the basis of a visual simulation. With higher resolution, the computational demand grows, especially due to the three-dimensional rendering of the respective capillary sections. Therefore, we manually optimised this detail to maximise the accuracy without jeopardising the simulation’s interactivity.
Interaction with content positively influences its conception (Pike et al., 2009; He et al., 2021) and helps to explore concepts. In parallel with the mathematical model, we developed the Alvin simulation software to support the conception and exploration of the gas exchange process in a single alveolus. Addressing the scientific, educational and accessibility requirements (see Methods), we aimed at maximal usability of the software for both research-related and educational applications. Overall, Alvin should impart an understanding of the relationship between structure and function of the alveolus.
Alvin is a desktop-based application implemented in Unity. It is available for Windows, macOS and Linux (fulfills (A.1)). The user interface of Alvin consists of the following core components: a three-dimensional model of an alveolus illustrating the simulation process, a configuration menu for model parameter values and a panel displaying dynamic graphs (Figure 4) (fulfills A.2.1). A key feature is the ability to run and compare multiple simulation instances at the same time.
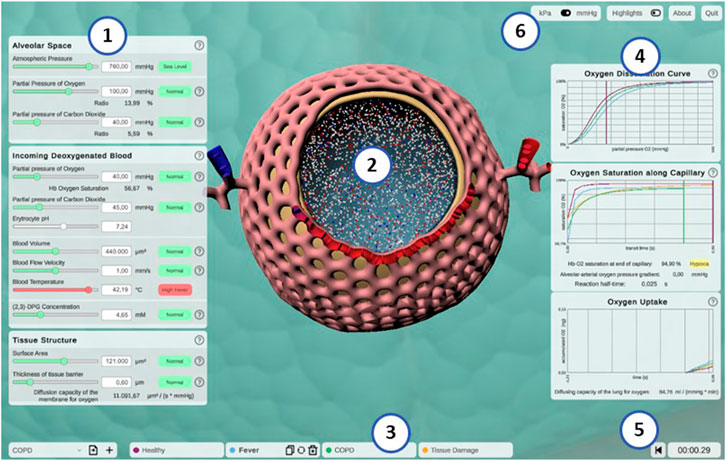
FIGURE 4. Screenshot of the interactive application Alvin. (1) Model parameters are grouped in categories and can be configured by the user. Colors and information text provide possible real-world interpretation of the values. (2) Animated simulation of an alveolus for the active parameter set provides visualization of the effect of the model parameter values. (3) To increase exploratory value, multiple simulation instances can be compared. (4) Quantitative simulation output is displayed with plots color-coded for each active instance of the simulation. (5) Simulation time is displayed and can be reset. (6) Utility functions and settings are available.
The animated, three-dimensional model of an alveolus illustrates the current state of the simulation (Figure 4, center, see also Section S1.3 of the Supplementary Material for further details) (fulfills S.4.1). The alveolus is visually filled with small representations for air molecules, animated to signify Brownian motion. Each one is representing roughly 2 × 10⁹ molecules of oxygen (red spheres), carbon dioxide (blue spheres) or nitrogen (white spheres), respectively. Thickening or thinning of the tissue layer indicates value changes of the model parameter “thickness of tissue barrier”. Erythrocytes are animated and move along the cut-open capillary. The number of erythrocytes proportionally corresponds to a standard value of 5 × 10⁶ cells per μL blood (Pagana et al., 2019). Their relative position on this path is constantly tracked. Oxygen partial pressure (Eq. 1) and hemoglobin oxygen saturation (Eq. 2) gradients are calculated along the same path. This information is combined to color erythrocytes according to their oxygen saturation and to cumulatively total the amount of oxygen taken up by the erythrocytes over the course of the simulation (see Figure 4, graph “oxygen uptake”).
Hence, simulated gas exchange can be retraced by observing the amount of gas spheres crossing the tissue barrier from one side to the other and changes in capillary and erythrocyte coloring (S.4.2). Quantitative outcome of the simulation can be monitored on three different graphs (S.3.1) (Figure 4, right). They show hemoglobin oxygen saturation as a function of pO2 in the blood (oxygen dissociation curve) (E.1.2), or of time (oxygen saturation along capillary). Finally, the total amount of oxygen taken up is tracked as a function of the time since the simulation was started or reset. Graphs of different simulation instances are indicated by their respective instance color.
The parameter panel (Figure 4, left) allows users to configure model parameter values. Changes in parameter values yield run-time updates in the 3D visualization and the quantitative graphs (S.2.1). A traffic light color code and keywords provide classification of the chosen parameter values with regard to their healthy or pathological ranges (E.2.2). More information can be obtained by clicking the respective info button (indicated by a question mark) (E.2.1). Model parameters are grouped in terms of the tissue components to which they relate (A.2.2). Visual highlighting in the 3D alveolus model emphasizes these connections (S.4.3). For instance, all tissue components except the capillary are grayed out when the cursor is over the window for model parameters relating to the blood. To examine the process in the 3D model in more detail, it can be moved, rotated or zoomed. Detailed quantitative information can be obtained by hovering over a graph with the mouse. The instance menu allows direct comparison of different parameter settings by running several simulation instances simultaneously (S.2.2) (Figure 4, bottom). Characteristic coloring and custom naming facilitate distinguishing between different simulation instances. A selected instance can be copied, deleted or reset to its initial parameter values. Parameter presets for healthy and common pathogenic conditions are provided (E.1.1) (Table 2). Finally, the user interface contains control elements to monitor or reset simulation time (S.2.3 and S.3.2) and to toggle between pressure units (A.3.2) and visual highlighting modes. More technical details on the implementation of Alvin are provided in Section S1.2 of the Supplementary Material. Taken together, these features present interrelationships of the gas exchange process as one explores the system. For example, the user can decrease the alveolar partial pressure of oxygen and observe how this affects the progression of oxygen binding to hemoglobin along the alveolar capillary. One could also observe at what alveolar pO2 the blood O2 saturation reaches a critically low value at the end of the process. Another example would be to increase the tissue barrier thickness and observe how much the blood oxygen saturation decreases despite unchanged alveolar partial pressures.
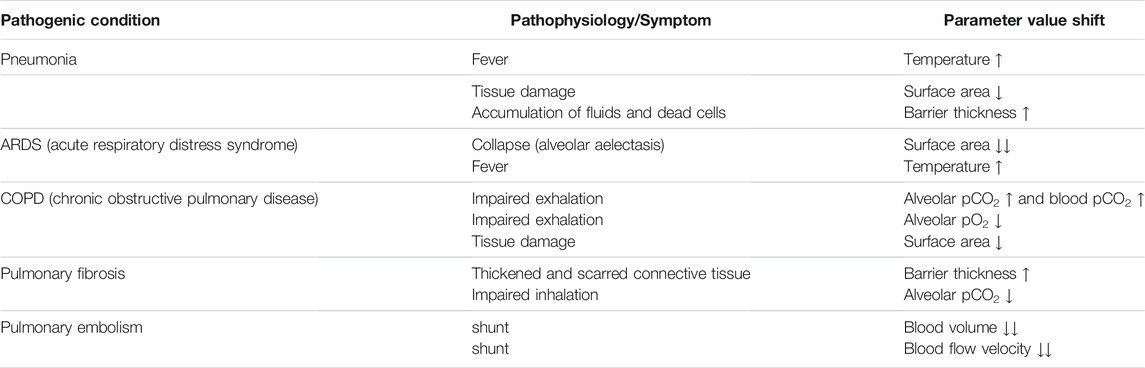
TABLE 2. Parameter value shifts in presets representing pathogenic conditions. For every condition, pathophysiological issues or symptoms are represented by increased (↑) or decreased (↓) values of the respective model parameters.
Alvin intends to increase understanding of the complex relationships of gas exchange by highlighting connections and allowing comparison of multiple simulations. Previous interactive systems for gas exchange have pursued a similar goal. (Winkler et al., 1995) have modeled the lung as a complex of abstract gas exchange units (compartments) that can be simulated under individual conditions. (Kapitan, 2008) have created a model of gas exchange that is based on the alveolar gas equation (Sharma et al., 2020) and takes the ratio of ventilation to perfusion into account. Both systems enable simulation of inhomogeneous distribution of ventilation and perfusion. This provides valuable insights into higher-level relationships. In both systems, individual gas exchange units and the whole complex are visualized by means of abstract schematic representations. What happens in detail and how it looks like remains unanswered. Alvin fills this gap. The site of gas exchange is no longer abstract—a 3D model illustrates an alveolus in realistic proportions. It conveys the structure of important components (capillary net, tissue barrier). The connection between structure and function is interactively explored in the simulation. Blood flow and tissue thickness in the 3D model adapt to the parameter settings and directly affect the simulation process. What further sets Alvin apart from the two systems mentioned above is the possibility of running multiple simulation instances simultaneously. This allows different conditions to be compared directly instead of being modeled and explored one after the other. However, the design of the instance menu in Alvin still has a limitation. While qualitative output of several simulation instances can be compared directly, the user is required to switch tabs along the instance menu to compare parameter settings and visual output on the 3D model. This issue should be addressed in future improvements to the system.
The combination of providing parameter value presets as well as allowing parameter configurations by the user enables a presentation of the model that expands existing best-practice (Mogilner et al., 2011). Alvin includes a multitude of visualization elements and interaction possibilities. They aim at an intuitive usage of the application and understanding of the gas exchange simulation. It should be assessed whether the use of Alvin is actually perceived as intuitive. For this purpose, in the context of a use case study (described in Section 3.3.2), we had a group of users fill out a standardized questionnaire to measure intuitive usability.
We provide two concrete examples for the application of Alvin. One of our goals was to ensure that researchers can flexibly explore the model simulation. Here, we demonstrate how the interactive simulation can be used to interpret data from the literature. Second, we report on Alvin’s integration into a university level virtual class. The application was used to convey basic and important respiratory processes in the context of a given instructional framework that combined a traditional lecture and instructor based- as well as self-learning.
To present a possible use case of Alvin for research, we employ the application to check the plausibility of pulmonary diffusion capacity measurements. The pulmonary diffusion capacity (DLO2) describes the lungs’ capacity to transport oxygen from the air to the blood. It is defined as the oxygen consumption
Physiological estimates of DLO2 are usually derived from measurements of diffusion capacity for carbon monoxide (DLCO) (Forster, 1964; Crapo and Crapo, 1983). Normal values of DLO2 at rest are around 30 ml/(mmHg × min) (Hsia et al., 2016). Determination of DLO2 based on morphometric data has resulted in a value of 158 ml/(mmHg × min) (Weibel, 2009) and thereby exceeds physiological approximations considerably. There are several reasons for this discrepancy (Hsia et al., 2016). One of them is that for the morphological estimation, a complete perfusion of the capillaries is assumed and the entire alveolar surface is included in the calculations (Weibel, 1970). Under normal conditions, only about 50% of capillary segments in the alveolar wall are perfused by erythrocytes and thus contribute to gas exchange (Okada et al., 1992) (Figure 5A). Increasing blood pressure (e.g., due to increased cardiac output) leads to recruitment of further capillary segments. In the perfusion fixed, air-filled lung, only about 60–70% of the alveolar surface area is exposed to air (Gil et al., 1979; Bachofen et al., 1987). In addition, lung volume changes during respiration depending on the transpulmonary pressure. It has been proposed that alveolar recruitment may be responsible for these volume changes, i.e., opening and closing of alveoli (Carney et al., 1999). However, in situ studies rather suggest an increase in alveolar size (D’Angelo, 1972). In terms of the model parameters in Alvin, both hypotheses manifest themselves in changes in the alveolar surface area available for gas exchange. A surface area of 207,000 μm2, measured in inflation-fixed lung tissue (Stone et al., 1992), describes a maximum surface exposure of 100%. The default surface area setting in Alvin is 121,000 μm2 and thus corresponds to an exposure of 58%. This value was taken from a study in which the tissue was perfusion fixed (Mercer et al., 1994). Capillary recruitment in Alvin is reflected in capillary blood volume, for which the default value 404,000 μm3 represents 50% recruitment. By mimicking the ratios of capillary recruitment and alveolar surface area in Alvin, one can directly trace the effect on DLO2. 100% alveolar surface exposure and 100% capillary recruitment in Alvin yield a DLO2 of 200 ml/(mmHg × min). 58% alveolar surface exposure and 50% capillary recruitment result in a DLO2 of 61 ml/(mmHg × min).
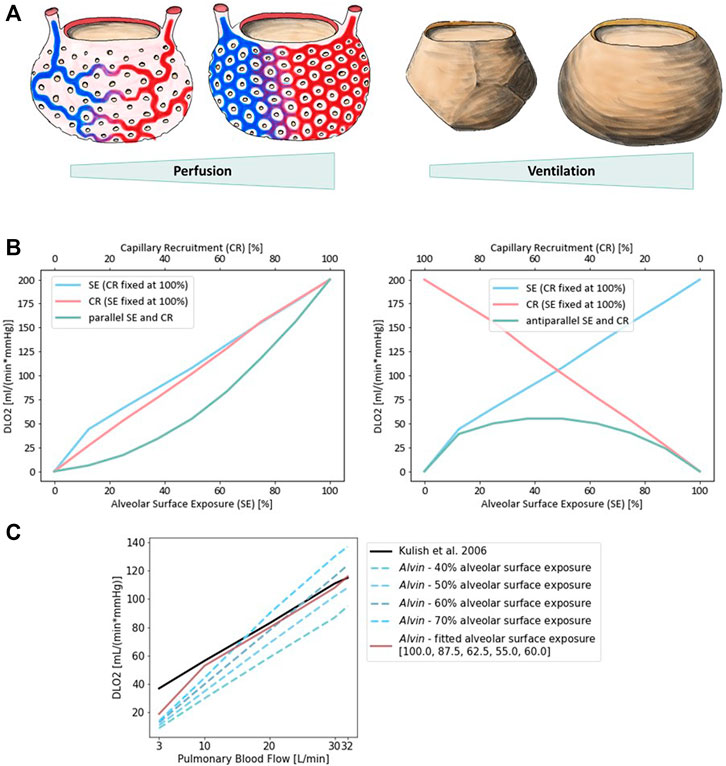
FIGURE 5. Diffusion capacity of the lung for oxygen (DLO2) strongly depends on perfusion and ventilation. (A) Illustration of capillary recruitment (left) and alveolar expansion (right). (B) Diffusion capacity of the lung for oxygen (DLO2) depending on capillary recruitment and alveolar expansion for a parallel (left) and antiparallel combination (right). Alveolar expansion and the ensuing surface exposure are simulated in Alvin by increasing alveolar surface area from 0 (0%) to 207,000 μm2 (100%) in steps of 12.5%. Capillary recruitment is represented by capillary blood volume increase from 0 (0%) to 808,000 μm3 (100%) in steps of 12.5% in Alvin. (C) Comparison to published DLO2 estimates (Kulish, 2006) (black). Pulmonary blood flow was interpreted as blood volume in Alvin, assuming a flow velocity of 1.5 mm/s and morphological features (mean capillary length of 500 μm (Weibel et al., 1993) and maximum volume of alveolar capillary bed 808,000 μm3 (Gehr et al., 1978; Ochs et al., 2004)). Alveolar surface exposure was fixed at constant values (blue dashed lines) and adjusted with increasing pulmonary blood flow (red line).
Alveolar surface area and capillary recruitment impact DLO2 estimates almost linearly (Figure 5B). Additionally, it is interesting to observe their synergistic effect, as ventilation and perfusion are regulated to match (reviewed in (Wagner, 1981; Petersson and Glenny, 2014)). Parallel increase of both alveolar surface exposure and capillary recruitment lead to a non-linear increase in DLO2, slowly at first and then more rapidly. Consistently, anti-parallel combination of these factors yields generally low DLO2 estimates, with a peak at 50% each. Quantification of this relationship in Alvin can be used to interpret other data from the literature. For instance, DLO2 has been estimated from measurements of DLCO and pulmonary blood flow (Kulish, 2006). To recreate these estimates, pulmonary blood flow, expressed in volume per unit time, was interpreted as alveolar blood volume in Alvin. Assuming a constant blood flow velocity of 1.5 mm/s, the alveolar blood volume was obtained from the mean capillary length of 500 μm (Weibel et al., 1993) and the maximum volume of alveolar capillary bed 808,000 μm3 (Ochs et al., 2004; Gehr et al., 1978). Under these conditions, DLO2 was determined in Alvin with varying alveolar surface area settings (Figure 5C). The resulting DLO2 graphs all differed in slope from the published data (Kulish, 2006). Thus, Kulish’s predictions did not appear to have been based on constant alveolar surface exposure. By adjusting alveolar surface area values (100, 87.5, 62.5, 55.0 and 60% surface exposure) along with increasing blood flow (3, 10, 20, 30 and 32 L/min), the results could finally be reconstructed. This fitting was not successful at very low blood flow values.
This is only one example of how to employ Alvin to investigate correlations in a broader sense or to reproduce data from the literature to gain further insight. Further questions could address the kinetics of gas exchange. One possibility would be to investigate the threshold conditions under which the blood is still sufficiently oxygenated within the transit time.
For application in teaching, the benefits of an interactive simulation have been perceived and exploited since the 1980s (Dewhurst et al., 1988; Davis and Mark, 1990) and are still being pursued today (Jacob et al., 2012; Tworek et al., 2013). Therefore, we integrated Alvin into a university level class on human biology, specifically an online practical session on blood and respiration. Alvin was used to support the online session by providing an interactive model of the cooperation of the bloodstream and the respiratory system. The suitability of Alvin for this course was measured with an online questionnaire.
The course was scheduled for 2 h and 45 min. The participants consisted of students of teaching Biology, specifically of the German levels of Grundschule (elementary school/grades 1–4, mostly third year students), Mittelschule (secondary school/grades 5–8, mostly third year students) and Gymnasium (grammar school/grades 5–13, mostly fifth year students). After an introduction into the topic “Blood and Respiration” in the form of a 45 min lecture, Alvin was presented briefly, explaining how to use the application and interpret the 3D model and graphs. Participants were given a few minutes to familiarize themselves with Alvin. They were then asked for feedback as they worked with the application. An online questionnaire was provided to collect responses. Participation was voluntary and could be withdrawn throughout the event. Submitting the questionnaire as a whole, or answering individual questions, was not mandatory. The questionnaire was split in four parts. The entire questionnaire, translated from German, can be found in the Supplementary Material (Supplementary Section S2.1).
The first part consisted of a generic demographic questionnaire, extended by specific questions to assess the formal background of the students and their experience with the subject. We received N = 73 valid submissions which were at least partially answered. Of the N = 73 surveys received, 11 self-identified as male, 56 as female. The participants all had some prior knowledge of respiratory physiology acquired in a physiology lecture in the previous semester and/or in school or training. In this lecture, basics about the structure and physiology of the lungs as well as the functions of the blood as a transporter of respiratory gases were explained. About half of the group (N = 34) could be assumed to have even deeper prior knowledge, as they stated that they had studied further literature in addition to the lecture in question. Participants could be divided into groups with prior knowledge level 1 and 2 accordingly. None of the participants reported being affected by color blindness. The second part contained 13 different exercises addressing respiratory processes in the alveolus. These exercises provided instructions on how to integrate Alvin into solution approaches. Among other things, these exercises highlighted well-known relationships and phenomena such as the Bohr effect (Riggs, 1988). Responses were rated on a scale of 1–4 (with 1 indicating perfect answers). The individual exercises were answered by different numbers of participants (Figure 6A). Exercise 7 and 10 were answered by less than half of the participants and were therefore not included in the mean overall score of 1.6. Participants with prior knowledge of level 1 performed similarly well to participants with prior knowledge of level 2 (Supplementary Figure S1).
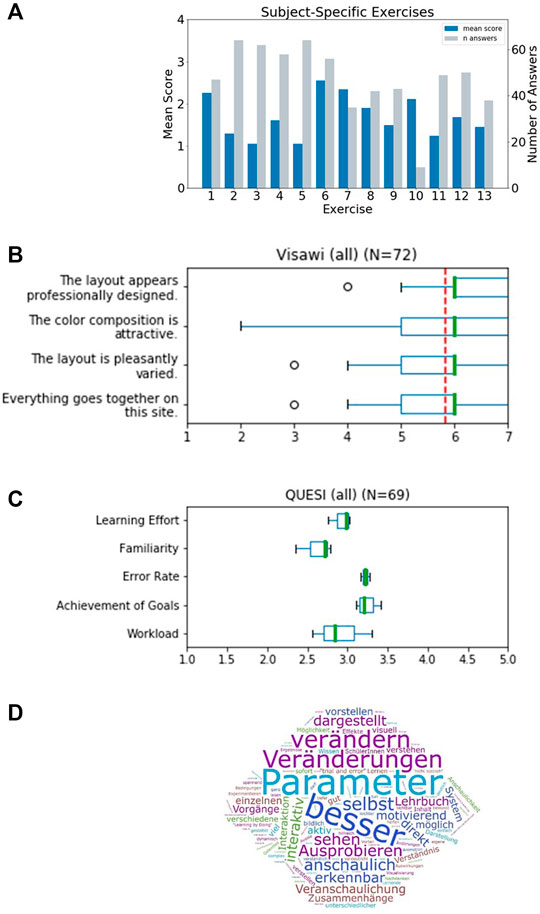
FIGURE 6. Results of a survey for undergraduate students that worked with Alvin in a physiology lab course. (A) Evaluation of thirteen subject-specific exercises. Responses were scored 1 - correct, 2 - partially correct (e.g., subsequent faults), 3 - unclear to 4 - incorrect. The mean score for every exercise was determined. The individual exercises were answered by different numbers of participants (grey bars). (B) The standardized Visawi-s survey (Moshagen and Thielsch, 2021) addresses design features. The 72 participants rated from 1 (strongly disagree) to 7 (strongly agree). The mean score over all four categories was 5.8 (red, dashed line). (C) Results on usability from the standardized survey QUESI (Hurtienne and Naumann, 2010). Five subscales are assessed, with higher scores obtained the more intuitive the use of the system was perceived to be. The mean overall QUESI score from 69 forms was 2.98. (D) Participants were asked “which benefits do you see in this system compared to a traditional text book?“. A frequency analysis on the answers was performed. The most recurrent terms were (translated from German): “parameter”, “better”, “modifiy”, “changes”, “by oneself”, “illustrative”, “testing”, “see”, “illustrated”, “apparent”, “interactive” and “immediate”.
The third part consisted of two standardized questionnaires to assess the visual aesthetics and the usability of the application: Visawi-s (Visual Aesthetics of Websites Inventory- short version) (Moshagen and Thielsch, 2021) and QUESI (Questionnaire for Measuring the Subjective Consequences of Intuitive Use) (Hurtienne and Naumann, 2010). Visawi-s (Moshagen and Thielsch, 2021) captures four central aspects of aesthetics from the user’s perspective: simplicity, diversity, colorfulness and craftsmanship. Participants were presented with statements targeting these four aspects. They rated them on a scale from 1 (strongly disagree) to 7 (strongly agree). The mean overall (N = 72) Visawi-s score was 5.8 (see Figure 6B). The standardized QUESI provided a measure of usability (Hurtienne and Naumann, 2010). It is based on the assumption that intuitive use is the unconscious application of prior knowledge leading to effective interaction. It can be divided into the following subscales: Subjective mental workload, perceived achievement of goals, perceived effort of learning, familiarity, and perceived error rate. The total score of the questionnaire is equal to the mean across all five subscales. Generally, higher scores represent a higher probability of intuitive use. Participants’ (N = 69) assessments of the use of Alvin resulted in a QUESI score of 2.98 (Figure 6C). Published benchmark values for mobile devices and applications (Naumann and Hurtienne, 2010) range from 2.39 (Alcatel One Touch 311) to 4.23 (Nintendo Wii). Familiar products generally perform better in the QUESI (Naumann and Hurtienne, 2010). Hence, participants’ prior experience with similar systems in a broader sense, for example, with computer games in general, is important. The majority of our participants (N = 59) reported rarely (yearly to never) playing computer games. The minority (N = 29) reported using computer games frequently (monthly to daily).
Finally, the questionnaire included customized questions on the use of Alvin (evaluation can be found in Supplementary Section S2.2) and free-form questions aimed at the acceptance of the software in the educational context. One of them was “Which benefits do you see in this system compared to a traditional text book?”. A frequency analysis on answers revealed the highest recurrence for the terms “parameter”, “better”, “modifiy”, “changes”, “by oneself”, “illustrative”, “testing”, “see”, “illustrated”, “apparent”, “interactive” and “immediate” (Figure 6D). A question asking for general feedback was responded to in part with constructive criticism. In particular, it was noted that the content of Alvin and the subject-specific tasks were too complex for this introductory event. Or that more time would have been necessary to familiarize oneself with the application. In addition, some reported problems switching between the German lecture content and the English-language application. The participants solved the subject-specific exercises for the most part correctly. It can thus be concluded that Alvin is suitable to assist in solving such tasks. Responses to free-text questions suggest which aspects of working with Alvin stood out as particularly positive. These include the possibility to interact with the simulation by configuring model parameters and the freedom to independently test different conditions. It was also perceived positively that the simulated processes are presented very illustratively in Alvin.
Our exemplary use cases show the applicability of Alvin in research and in education. We showed an investigation of the dependencies of DLO2 on surface area and blood flow in Alvin. Physiological estimates often only consider information about blood flow (Kulish, 2006). By reproducing these estimates in Alvin, one can draw conclusions about the alveolar surface. At particularly low blood flow values, it is not possible to reproduce the physiological estimates for DLO2 in Alvin. This could have different causes. In the logic of the model and the definition of DLO2, it is ensured that DLO2 is zero when the blood volume is zero. The physiological estimates in (Kulish, 2006) do not seem to meet this criterion. (note: One cannot be certain, however, because in Kulish et al. (Kulish, 2006) the lowest reported value for blood flow is 3 L/min). It is possible that our model does not produce reliable results in the range of low blood volume values. Another possibility is that the derivation of DLO2 from DLCO is not reliable in low ranges. This plausibility check shows how Alvin can be used to support or challenge published data. Drawing on known relationships, additional information can be obtained from previous results.
We also showed that Alvin is helpful for communicating respiratory processes in the training of undergraduate students. Well-known processes or phenomena like the Bohr-Effect (Riggs, 1988) can be recreated in Alvin and compared with results reported in the literature. Interactivity of the simulation enables experimentation with the model and exploration of its limitations. This aspect was also positively highlighted by participants of the physiology lab course in free-form answers of our questionnaire. The results of the QUESI and VISAWI questionnaires on their own do not allow for quantitative conclusions on usability or aesthetics of the application. This would require comparing them to corresponding results from comparable test situations (for example, about similar systems). At this point, one can only state that the replies did not hint at unknown issues. Instead, they were aligned with our expectations that participants should be able to operate the system autonomously and find its use appealing and relatively intuitive.
In summary, the integration of Alvin into physiology classes at the university level was successful. Beyond that, issues were pointed out where the implementation could be optimized in the future. Prominent and consistent were requests for more time to engage with Alvin. We deliberately refrained from providing the application to the participants in advance of this course to avoid a mutual influence of the participants regarding their experience with Alvin. This was important for the evaluation with the standardized questionnaires. For general use in teaching, however, this does not have to be taken into account. On the contrary, an exchange between students about the system could increase its learning value. We conclude that Alvin is less suitable to be included in a single physiology lesson. Instead, we recommend that students be made aware of the app ahead of time or to invest several course sessions.
Interactive, visual simulations allow communicating modeling results and thereby help to further our understanding of the process under study. We presented Alvin, an application for simulating gas exchange in a single alveolus. The simulation is based on a mathematical model for the entire transport process of oxygen from the air to hemoglobin of the blood. We claim that having the goal of an interactive, visual simulation in mind when developing a mathematical model is beneficial for the modeling process. It resulted in a specific requirement for the model: In order to be able to map the course of the simulation on a three-dimensional tissue model, it had to be temporally and spatially resolved. Models evolve by being revised and improved over and over again (Drubin and Oster, 2010). If one assumes that a model can be better developed the more experts review it, then it is advantageous to make the model freely and intuitively accessible.
We argue that interactive visualization offers an engaging way to communicate theoretical models to other scientists and students. When cooperating with experimenters, it is important for theorists to present their models in the most accessible way possible. This creates as large a basis for discussion as possible in order to jointly plan further experiments or model refinements. By making model parameters intuitively configurable, any experimenter can compare his or her own measurements with the modeling results. By including undergraduate students in the target group for Alvin, we ensured that only a minimum of prior knowledge is required for its usage.
In the future, we plan to extend our model to encompass a system of multiple alveoli and their associated vessels. This will allow us to address further questions and complex relationships regarding gas exchange in lung tissue. It is known that the ventilation-perfusion relationship, and therefore the diffusion-perfusion relationship, has a strong influence on DLO2 (Hyde et al., 1967; Hammond and Hempleman, 1987). An evolution of Alvin that includes an alveolar sac or a whole acinus with differently ventilated and perfused alveoli can provide valuable insights. This could also be used, for example, to further investigate the hypothesis of precapillary oxygen uptake (Tabuchi et al., 2013). It states that the oxygenation process already takes place in the precapillary arterioles before the blood reaches the alveolar capillary bed.
Rather than just presenting the data that results from a newly developed model, it is worthwhile to implement the model in a way that allows for interaction. Visualizing the simulation makes the engagement with the model more intuitive and accessible to a broader target group. Empiricists and theorists look at a system from different angles. Some work in a bottom-up fashion and take local samples and draw conclusions for the overall system. Others create abstract models for the overall system top-down and try to approach the truth by introducing more and more details. Only by working closely together can these two perspectives efficiently contribute to reliable results and become a “middle-out” approach (Noble, 2008). The communication of the achieved findings or predictions plays an important role here. We contend that interactive, visual simulations of theoretical models, as we have implemented with Alvin on respiratory processes in the alveolus, will make an important contribution to bridging the gap between empiricists and theorists.
The original contributions presented in the study are included in the article/Supplementary Material, further inquiries can be directed to the corresponding author. We provide the source code of Alvin at https://github.com/scfischer/schmid-et-al-2022.
Ethical review and approval was not required for the study on human participants in accordance with the local legislation and institutional requirements. The patients/participants provided their written informed consent to participate in this study.
Alvin concept and design: AK, AM, KS. Implementation of Alvin: AK, AM, KS. Model development and validation: KS. Planning and supervision of the use case in teaching: KP, AK, KS. Demonstration of possible application in research: KS. Supervision: SF, SvM, KP. Manuscript preparation: KS, SF, AK, SvM. All authors contributed to the article and approved the submitted version.
The authors declare that the research was conducted in the absence of any commercial or financial relationships that could be construed as a potential conflict of interest.
All claims expressed in this article are solely those of the authors and do not necessarily represent those of their affiliated organizations, or those of the publisher, the editors, and the reviewers. Any product that may be evaluated in this article, or claim that may be made by its manufacturer, is not guaranteed or endorsed by the publisher.
We thank Andreas Hocke and Katja Hönzke for inspiring discussions and support of the project. We thank Wolfgang Kübler and Matthias Ochs for valuable feedback on Alvin and members of the CCTB for testing Alvin. KS and SCF acknowledge the support by a grant from Universitätsbund Würzburg (AZ21-16).
The Supplementary Material for this article can be found online at: https://www.frontiersin.org/articles/10.3389/fbinf.2021.774300/full#supplementary-material
Bachofen, H., Schürch, S., Urbinelli, M., and Weibel, E. R. (1987). Relations Among Alveolar Surface Tension, Surface Area, Volume, and Recoil Pressure. J. Appl. Physiol. (1985) 62, 1878–1887. doi:10.1152/jappl.1987.62.5.1878
Byrne, H. M., Alarcon, T., Owen, M. R., Webb, S. D., and Maini, P. K. (2006). Modelling Aspects of Cancer Dynamics: a Review. Philos. Trans. A. Math. Phys. Eng. Sci. 364, 1563–1578. doi:10.1098/rsta.2006.1786
Carney, D. E., Bredenberg, C. E., Schiller, H. J., Picone, A. L., McCANN, U. G., Gatto, L. A., et al. (1999). The Mechanism of Lung Volume Change during Mechanical Ventilation. Am. J. Respir. Crit. Care Med. 160, 1697–1702. doi:10.1164/ajrccm.160.5.9812031
Chao, E. Y. (2003). Graphic-based Musculoskeletal Model for Biomechanical Analyses and Animation. Med. Eng. Phys. 25, 201–212. doi:10.1016/S1350-4533(02)00181-9
Conover, T., Hlavacek, A. M., Migliavacca, F., Kung, E., Dorfman, A., Figliola, R. S., et al. (2018). An Interactive Simulation Tool for Patient-specific Clinical Decision Support in Single-Ventricle Physiology. J. Thorac. Cardiovasc. Surg. 155, 712–721. doi:10.1016/j.jtcvs.2017.09.046
Costabile, M. (2021). Design, Implementation, and Assessment of an Interactive Simulation to Teach Undergraduate Immunology Students Hemolytic Disease of the Newborn. Adv. Physiol. Educ. 45, 299–306. doi:10.1152/advan.00008.2021
Crapo, J. D., and Crapo, R. O. (1983). Comparison of Total Lung Diffusion Capacity and the Membrane Component of Diffusion Capacity as Determined by Physiologic and Morphometric Techniques. Respir. Physiol. 51, 183–194. doi:10.1016/0034-5687(83)90039-7
D’Angelo, E. (1972). Local Alveolar Size and Transpulmonary Pressure In Situ and in Isolated Lungs. Respiration Physiol. 14, 251–266. doi:10.1016/0034-5687(72)90032-1
Dash, R. K., Korman, B., and Bassingthwaighte, J. B. (2016). Simple Accurate Mathematical Models of Blood HbO2 and HbCO2 Dissociation Curves at Varied Physiological Conditions: Evaluation and Comparison with Other Models. Eur. J. Appl. Physiol. 116, 97–113. doi:10.1007/s00421-015-3228-3
Davis, T. L., and Mark, R. G. (1990). Teaching Physiology through Simulation of Hemodynamics. Proc. Comput. Cardiol. 1990, 649–652. doi:10.1109/CIC.1990.144303
Dewhurst, D. G., Brown, G. J., and Meehan, A. S. (1988). Microcomputer Simulations of Laboratory Experiments in Physiology. Altern. Lab. Anim. 15, 280–289. doi:10.1177/026119298801500403
Drubin, D. G., and Oster, G. (2010). Experimentalist Meets Theoretician: A Tale of Two Scientific Cultures. Mol. Biol. Cel 21, 2099–2101. doi:10.1091/mbc.E10-02-0143
Fischer, S. C. (2019). “An Introduction to Image-Based Systems Biology of Multicellular Spheroids for Experimentalists and Theoreticians,” in Computational Biology. Editor H. Husi (Brisbane, AU: Codon Publications). doi:10.15586/computationalbiology.2019.ch1
Forster, R. E. (1964). “Diffusion of Gases,” in Handbook of Physiology (Baltimore, MD, USA: Waverly Press), 839872.
Gavaghan, D., Garny, A., Maini, P. K., and Kohl, P. (2006). Mathematical Models in Physiology. Philos. Trans. A. Math. Phys. Eng. Sci. 364, 1099–1106. doi:10.1098/rsta.2006.1757
Gehr, P., Bachofen, M., and Weibel, E. R. (1978). The normal Human Lung: Ultrastructure and Morphometric Estimation of Diffusion Capacity. Respir. Physiol. 32, 121–140. doi:10.1016/0034-5687(78)90104-4
Gil, J., Bachofen, H., Gehr, P., and Weibel, E. R. (1979). Alveolar Volume-Surface Area Relation in Air- and saline-filled Lungs Fixed by Vascular Perfusion. J. Appl. Physiol. Respir. Environ. Exerc. Physiol. 47, 990–1001. doi:10.1152/jappl.1979.47.5.990
Haefeli-Bleuer, B., and Weibel, E. R. (1988). Morphometry of the Human Pulmonary Acinus. Anat. Rec. 220, 401–414. doi:10.1002/ar.1092200410
Hammond, M. D., and Hempleman, S. C. (1987). Oxygen Diffusing Capacity Estimates Derived from Measured VA/Q Distributions in Man. Respir. Physiol. 69, 129–147. doi:10.1016/0034-5687(87)90022-3
He, C., Micallef, L., He, L., Peddinti, G., Aittokallio, T., and Jacucci, G. (2021). Characterizing the Quality of Insight by Interactions: A Case Study. IEEE Trans. Vis. Comput. Graph 27, 3410–3424. doi:10.1109/TVCG.2020.2977634
Hsia, C. C. W., Hyde, D. M., and Weibel, E. R. (2016). Lung Structure and the Intrinsic Challenges of Gas Exchange. Compr. Physiol., 827–895. doi:10.1002/cphy.c150028
Hurtienne, J., and Naumann, A. (2010). “QUESI – A Questionnaire For Measuring The Subjective Consequences Of Intuitive Use,” in Interdisciplinary College 2010. Focus Theme: Play, Act and Learn. Editors R. Porzel, N. Sebanz, and M. Spitzer (Sankt Augustin: Fraunhofer Gesellschaft), 536.
Hyde, R. W., Rynes, R., Power, G. G., and Nairn, J. (1967). Determination of Distribution of Diffusing Capacity in Relation to Blood Flow in the Human Lung. J. Clin. Invest. 46, 463–474. doi:10.1172/JCI105548
Jacob, C., von Mammen, S., Davison, T., Sarraf-Shirazi, A., Sarpe, V., Esmaeili, A., et al. (2012). “LINDSAY Virtual Human: Multi-Scale, Agent-Based, and Interactive,” in Advances in Intelligent Modelling and Simulation: Artificial Intelligence-Based Models and Techniques in Scalable Computing. Studies in Computational Intelligence. Editors J. Kołodziej, S. U. Khan, and T. Burczy nski (Berlin, Heidelberg: Springer), 327–349. doi:10.1007/978-3-642-30154-4_14
Jamniczky, H., Jacob, C., Novakowski, S., Davison, T., Mammen, S. v., Gingras, C., et al. (2012). The LINDSAY Virtual Human Project: Anatomy and Physiology Come to Life. FASEB J. 26, lb28. doi:10.1096/fasebj.26.1_supplement.lb28
Kapitan, K. S. (2008). Teaching Pulmonary Gas Exchange Physiology Using Computer Modeling. Adv. Physiol. Educ. 32, 61–64. doi:10.1152/advan.00099.2007
Kuebler, W. M., Mertens, M., and Pries, A. R. (2007). A Two-Component Simulation Model to Teach Respiratory Mechanics. Adv. Physiol. Educ. 31, 218–222. doi:10.1152/advan.00001.2007
Kulish, V. (2006). Human Respiration: Anatomy and Physiology, Mathematical Modeling, Numerical Simulation and Applications. Chilworth, Southampton, USA: WIT Press. Google-Books-ID: J2rQCwAAQBAJ.
Lin, D. W., Johnson, S., and Hunt, C. A. (2004). Modeling Liver Physiology: Combining Fractals, Imaging and Animation. Conf. Proc. IEEE Eng. Med. Biol. Soc. 2, 3120–3123. doi:10.1109/IEMBS.2004.1403881
Lindstedt, S. L. (1984). Pulmonary Transit Time and Diffusing Capacity in Mammals. Am. J. Physiol. 246, R384–R388. doi:10.1152/ajpregu.1984.246.3.R384
Mercer, R. R., Russell, M. L., and Crapo, J. D. (1994). Alveolar Septal Structure in Different Species. J. Appl. Physiol. (1985) 77, 1060–1066. doi:10.1152/jappl.1994.77.3.1060
Mogilner, A., Edelstein-Keshet, L., and Bloom, K. (2011). Guidelines for Publishing Papers Containing Theory and Modeling. MBoC 22, 907–908. doi:10.1091/mbc.E11-01-0088
Moshagen, M., and Thielsch, M. T. (2010). Facets of Visual Aesthetics. Int. J. Human-Computer Stud. 68, 689–709. doi:10.1016/j.ijhcs.2010.05.006
Mühlfeld, C., Weibel, E. R., Hahn, U., Kummer, W., Nyengaard, J. R., and Ochs, M. (2010). Is Length an Appropriate Estimator to Characterize Pulmonary Alveolar Capillaries? A Critical Evaluation in the Human Lung. Anat. Rec. (Hoboken) 293, 1270–1275. doi:10.1002/ar.21158
Naumann, A., and Hurtienne, J. (2010). “Benchmarks for Intuitive Interaction with mobile Devices,” in Proceedings of the 12th International Conference on Human Computer Interaction with mobile Devices and Services - MobileHCI ’10 (Lisbon, Portugal: ACM Press), 401. doi:10.1145/1851600.1851685
Noble, D. (2008). “The Orchestra: Organs and Systems of the Body,” in The Music of Life: Biology beyond Genes (Oxford, United Kingdom: OUP Oxford), 74–87.
Ochs, M., Nyengaard, J. R., Jung, A., Knudsen, L., Voigt, M., Wahlers, T., et al. (2004). The Number of Alveoli in the Human Lung. Am. J. Respir. Crit. Care Med. 169, 120–124. doi:10.1164/rccm.200308-1107OC
Okada, O., Presson, R. G., Kirk, K. R., Godbey, P. S., Capen, R. L., and Wagner, W. W. (1992). Capillary Perfusion Patterns in Single Alveolar walls. J. Appl. Physiol. (1985) 72, 1838–1844. doi:10.1152/jappl.1992.72.5.1838
Pagana, K., Pagana, T., and Pagana, T. (2019). Mosby’s Diagnostic and Laboratory Test Reference. 14 edn. Amsterdam, Netherlands: Elsevier.
Petersson, J., and Glenny, R. W. (2014). Gas Exchange and Ventilation-Perfusion Relationships in the Lung. Eur. Respir. J. 44, 1023–1041. doi:10.1183/09031936.00037014
Pike, W. A., Stasko, J., Chang, R., and O'Connell, T. A. (2009). The Science of Interaction. Inf. Visualization 8, 263–274. doi:10.1057/ivs.2009.22
Powers, K. A., and Dhamoon, A. S. (2019). “Physiology, Pulmonary, Ventilation and Perfusion,” in StatPearls (Treasure Island, FL: StatPearls Publishing).
Riggs, A. F. (1988). The Bohr Effect. Annu. Rev. Physiol. 50, 181–204. doi:10.1146/annurev.ph.50.030188.001145
Saber, E. M., and Heydari, G. (2012). Flow Patterns and Deposition Fraction of Particles in the Range of 0.1-10μm at Trachea and the First Third Generations under Different Breathing Conditions. Comput. Biol. Med. 42, 631–638. doi:10.1016/j.compbiomed.2012.03.002
Sapoval, B., Kang, M. Y., and Dinh-Xuan, A. T. (2020). Modeling of Gas Exchange in the Lungs. Compr. Physiol. 11, 1289–1314. doi:10.1002/cphy.c190019
Sharma, S., Hashmi, M. F., and Burns, B. (2020). “Alveolar Gas Equation,” in StatPearls (Treasure Island, FL: StatPearls Publishing).
Sharpe, J. (2017). Computer Modeling in Developmental Biology: Growing Today, Essential Tomorrow. Development 144, 4214–4225. doi:10.1242/dev.151274
Stone, K. C., Mercer, R. R., Gehr, P., Stockstill, B., and Crapo, J. D. (1992). Allometric Relationships of Cell Numbers and Size in the Mammalian Lung. Am. J. Respir. Cel Mol Biol 6, 235–243. doi:10.1165/ajrcmb/6.2.235
Tabuchi, A., Styp-Rekowska, B., Slutsky, A. S., Wagner, P. D., Pries, A. R., and Kuebler, W. M. (2013). Precapillary Oxygenation Contributes Relevantly to Gas Exchange in the Intact Lung. Am. J. Respir. Crit. Care Med. 188, 474–481. doi:10.1164/rccm.201212-2177OC
Tworek, J. K., Jamniczky, H. A., Jacob, C., Hallgrímsson, B., and Wright, B. (2013). The LINDSAY Virtual Human Project: An Immersive Approach to Anatomy and Physiology. Anat. Sci. Ed. 6, 19–28. doi:10.1002/ase.1301
Viceconti, M., Clapworthy, G., and Van Sint Jan, S. (2008). The Virtual Physiological Human - a European Initiative for In Silico Human Modelling -. J. Physiol. Sci. 58, 441–446. doi:10.2170/physiolsci.RP009908
Wagner, P. D. (1981). Ventilation/perfusion Relationships. Clin. Physiol. 1, 437–451. doi:10.1111/j.1475-097x.1981.tb00911.x
Warliah, L., Rohman, A. S., and Rusmin, P. H. (2012). Model Development of Air Volume and Breathing Frequency in Human Respiratory System Simulation. Proced. - Soc. Behav. Sci. 67, 260–268. doi:10.1016/j.sbspro.2012.11.328
Weibel, E. R., Federspiel, W. J., Fryder-Doffey, F., Hsia, C. C., König, M., Stalder-Navarro, V., et al. (1993). Morphometric Model for Pulmonary Diffusing Capacity. I. Membrane Diffusing Capacity. Respir. Physiol. 93, 125–149. doi:10.1016/0034-5687(93)90001-Q
Weibel, E. R., and Gomez, D. M. (1962). Architecture of the Human Lung. Use of Quantitative Methods Establishes Fundamental Relations between Size and Number of Lung Structures. Science 137, 577–585. doi:10.1126/science.137.3530.577
Weibel, E. R. (1970). Morphometric Estimation of Pulmonary Diffusion Capacity. I. Model and Method. Respir. Physiol. 11, 54–75. doi:10.1016/0034-5687(70)90102-7
Welsh, E., Jirotka, M., and Gavaghan, D. (2006). Post-genomic Science: Cross-Disciplinary and Large-Scale Collaborative Research and its Organizational and Technological Challenges for the Scientific Research Process. Philos. Trans. A. Math. Phys. Eng. Sci. 364, 1533–1549. doi:10.1098/rsta.2006.1785
Winkler, T., Krause, A., and Kaiser, S. (1995). Simulation of Mechanical Respiration Using a Multicompartment Model for Ventilation Mechanics and Gas Exchange. Int. J. Clin. Monit. Comput. 12, 231–239. doi:10.1007/BF01207204
Keywords: interactive simulation, visualization, theoretical modeling, lung physiology, requirements analysis, spatio-temporal resolution, education
Citation: Schmid K, Knote A, Mück A, Pfeiffer K, von Mammen S and Fischer SC (2022) Interactive, Visual Simulation of a Spatio-Temporal Model of Gas Exchange in the Human Alveolus. Front. Bioinform. 1:774300. doi: 10.3389/fbinf.2021.774300
Received: 11 September 2021; Accepted: 17 December 2021;
Published: 26 January 2022.
Edited by:
Lydia Gregg, Johns Hopkins University, United StatesReviewed by:
Anamaria Crisan, Salesforce, United StatesCopyright © 2022 Schmid, Knote, Mück, Pfeiffer, von Mammen and Fischer. This is an open-access article distributed under the terms of the Creative Commons Attribution License (CC BY). The use, distribution or reproduction in other forums is permitted, provided the original author(s) and the copyright owner(s) are credited and that the original publication in this journal is cited, in accordance with accepted academic practice. No use, distribution or reproduction is permitted which does not comply with these terms.
*Correspondence: Kerstin Schmid, a2Vyc3Rpbi5zY2htaWRAdW5pLXd1ZXJ6YnVyZy5kZQ==
Disclaimer: All claims expressed in this article are solely those of the authors and do not necessarily represent those of their affiliated organizations, or those of the publisher, the editors and the reviewers. Any product that may be evaluated in this article or claim that may be made by its manufacturer is not guaranteed or endorsed by the publisher.
Research integrity at Frontiers
Learn more about the work of our research integrity team to safeguard the quality of each article we publish.