 Seán I. O'Donoghue1,2,3*
- 1Garvan Institute of Medical Research, Darlinghurst, NSW, Australia
- 2School of Biotechnology and Biomolecular Sciences, University of New South Wales, Kensington, NSW, Australia
- 3CSIRO Data61, Eveleigh, NSW, Australia
Introduction
Increasingly, the life sciences rely on data science, an emerging discipline in which visualization plays a critical role. Visualization is particularly important with challenging data from cutting-edge experimental techniques, such as 3D genomics, spatial transcriptomics, 3D proteomics, epiproteomics, high-throughput imaging, and metagenomics. Data visualization also plays an increasing role in how research is communicated. Some scientists still think of data visualization as optional; however, as more realize it is an essential tool for revealing insights buried in complex data, bioinformatics visualization is emerging as a subdiscipline. This article outlines current and future grand challenges in bioinformatics data visualization, and announces the first publication venue dedicated to this subdiscipline.
Over the past two decades, life science data have increased rapidly in volume and complexity, with the result that data analysis is often the major bottleneck (O’Donoghue et al., 2010a). For example, “All major genomics breakthroughs so far have been accompanied by the development of ground-breaking statistical and computational methods” (Green et al., 2020). Thus, in the remaining decades of the 21st century, life scientists will become increasingly reliant on the emerging tools and methods of data science (Blei and Smyth, 2017; Altman and Levitt, 2018).
One of these methods is data visualization (a.k.a. DataVis), which plays a critical role in transforming data and analysis outcomes into insight (Card et al., 1999). Data visualization involves analysis, design, and rendering, as well as observation and cognitive processing (Figure 1). Some scientists think of DataVis as an optional step mostly aimed at aesthetics — however, there is growing recognition that it is an essential tool in the analysis of complex data; two indicators of this recognition are the recent sales of DataVis companies Looker and Tableau for US$3B and $16B, respectively.
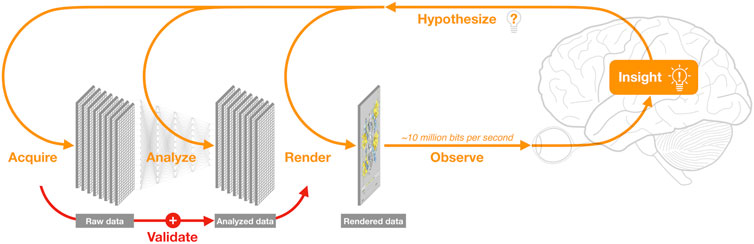
FIGURE 1. The data science cycle. Analysis of newly acquired data increasingly relies on integration with large, accumulating volumes of complex, pre-existing data, and requires frequent re-analysis and re-rendering. Visualization is the main way researchers observe both raw and analysed data; an overarching grand challenge of data visualization is to leverage human visual capabilities—which involve most of the brain and can process ∼10 million bits per second (Koch et al., 2006) to recognize patterns within ∼100 ms (Healey and Enns, 2012) — thereby transforming data into insight. These insights, in turn, lead to new hypotheses, thus continuing the cycle. Unfortunately, the critical step of manually validating derived models by visually comparing raw vs. analysed data (Anscombe, 1973) is often overlooked.
Currently, however, most attention is focused on another aspect of data science, namely, the use of machine learning to develop artificial intelligence systems. Such systems have recently led to exciting advances in the life sciences (e.g., Callaway, 2020a) — but also to some hyperbole. Clearly, machine learning methods are increasingly critical for research; but these methods also have limitations (Challen et al., 2019; Heaven, 2019; Yu and Kohane, 2019). More fundamentally, automated methods are insufficient, since analysis outcomes must be observed and understood by an analyst before insight can occur (Figure 1). Most analysts use data visualization as an integral part of their cognitive processes—especially important is manual validation, which involves checking for errors and outliers in raw data, and for wrong assumptions used in automated analysis methods (Anscombe, 1973).
Automated data analysis (including machine learning) and data visualization are just components of the larger goal of data science, which the eminent computer scientist Fred Brooks argues should focus on ‘Intelligence Amplification’ (a.k.a. I.A.) — i.e., on amplifying our abilities to manage more complex data (Brooks, 1996). In my opinion, helping achieve the goal of I.A. is the overarching grand challenge of DataVis.
Prioritizing Grand Challenges in Bioinformatics
Since data visualization aims to amplify human intelligence, we could ask ourselves1: of all our colleagues working across different life sciences, whose intelligence most needs amplifying? Or, humor aside, which fields are creating data that are both important and urgently need improvements in visual analysis?
Addressing this question is the core mission of an annual series of international meetings on ‘Visualizing Biological Data’ (VIZBI2). From my perspective as chair of this meeting series, it is clear that the biological and biomedical sciences are currently awash with vexing data challenges where current analysis methods and tools are fundamentally inadequate. Thus, researchers looking for grand challenges in bioinformatics data visualization (a.k.a. BioVis) are spoilt for choice; of very many worthy challenges, below are six that have been highlighted repeatedly by VIZBI speakers over the past decade, as cases in which innovations in visual analysis are likely to lead to significant breakthroughs in our understanding of life. Figure 2 showcases some of the visual methods currently being used to partly address these challenges. This list of challenges is far from comprehensive; researchers already focused in a particular field of the life sciences (e.g., drug design, medicine, ecology) would likely prioritize very different lists of worthy challenges.
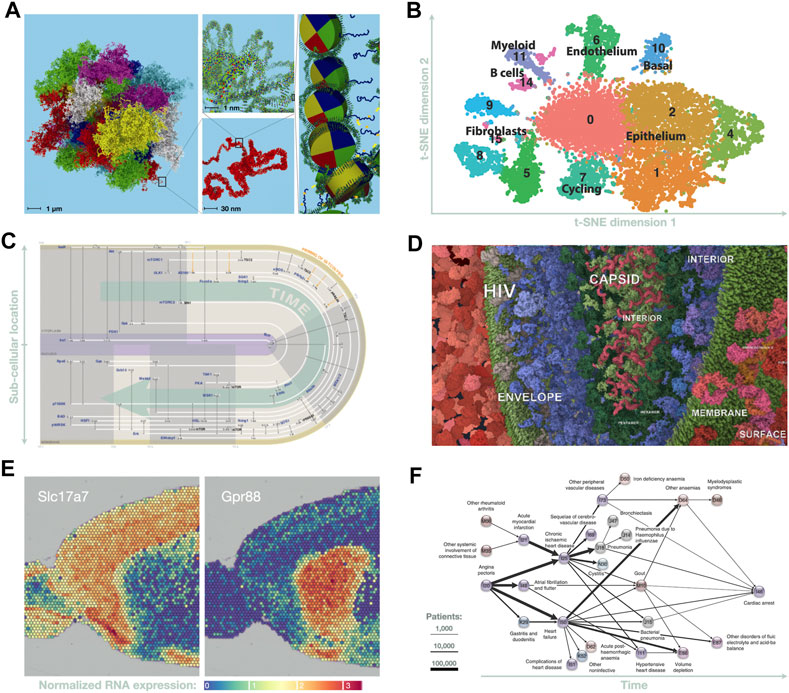
FIGURE 2. Six data visualization methods currently used in bioinformatics grand challenges. (A) A molecular-scale, 3D model of the human genome may soon be feasible; in preparation, visualization tools are being developed to enable interactive, multiscale exploration of such models (adapted from Asbury et al. (2010)). (B) t-SNE analysis of scRNA-seq data on breast cancer metastasis (adapted from Valdes-Mora et al. (2019)). (C) Spatiotemporal graph of phosphorylation events in fat cells following insulin stimulation (adapted from Ma et al. (2015), by Jenny Vuong). (D) Here, an interactive, web-based data integration environment is used to explore and curate a molecular-scale model of a subcellular landscape showing HIV-host interactions (Klein et al., 2018; Autin et al., 2020). (E) Portion of spatial transcriptomics analysis showing expression of two genes in an anterior slice from mouse brain (adapted from Vandenbon and Diez (2020)). (F) Disease trajectory graph showing progression from heart pain to cardiac arrest across the entire Danish population (adapted from Jensen et al. (2014)).
I. In genomics, there is rapid progress towards the goal of determining the spatiotemporal organization of chromosomes at molecular-scale resolution (Figure 2A); this is driven by advances in sequencing technologies that can infer spatial contacts (Lieberman-Aiden et al., 2009), as well as in high resolution imaging (Ou et al., 2017). Integrating these multiscale and multimodal data poses formidable visualization challenges (Ay and Noble, 2015; Serra et al., 2015); however, achieving this goal would transform our understanding of what gets transcribed, and how and when transcription is controlled in different cell types.
II. In transcriptomics, rapid advances in single-cell RNA-seq (scRNA-seq) techniques now make it possible to track behaviors of individual cells in unprecedented detail, providing a window into events that were previously hidden (Wills et al., 2013). For example, scRNA-seq can be used to track cell differentiation and the evolution of cell-cell contacts during the growth of cancerous tumours (e.g., Valdes-Mora et al., 2019). Also, in combination with imaging methods, these techniques can be used to resolve the spatial location of RNA transcripts within single cells (Chen et al., 2015). Each type of scRNA-seq experiment produces data that are both highly multidimensional but also very specific; tailoring effective data analysis strategies for each type of experiment requires development of innovative visual analysis methods to overcome limitations with existing, generic approaches such as t-SNE (‘t-distributed stochastic neighbor embedding’; Figure 2B) (Van der Maaten and Hinton, 2008) or diffusion maps (Coifman et al., 2005). This challenge currently engages many bioinformaticians, driven by the promise of discovering the key mechanisms used to control cellular processes.
III. In proteomics, advances in high-throughput mass-spectroscopy (Kim et al., 2006; Morelle et al., 2006; Olsen et al., 2006) have begun to provide first glimpses into the highly dynamic epiproteome, i.e., the set of all post-translational modifications (PTMs) made to all proteins in a cell (Zheng et al., 2016; Kaur et al., 2019). So far, at least 200 distinct types of PTMs are known3, and related advances are revealing that comparable levels of complexity occur in modifications seen to both RNA (Roundtree et al., 2017) and lipids (Shevchenko and Simons, 2010). Currently, most of these modifications are poorly studied; even phosphorylation of human proteins—one of the best studied PTMs—gives rise to a phosphoproteome that is still largely unknown or ‘dark’ (Needham et al., 2019). However, this is set to change rapidly over the next few years, although extracting insights from the dynamic, highly multidimensional datasets from epiproteomics (Figure 2C), epitranscriptomics, and lipidomics remains a major challenge (Kaur et al., 2019; Kaur et al., 2020). Nonetheless, the insights gained are likely to fundamentally advance our understanding of cellular processes in health and diseases—for example, by revealing molecular events that occur during illness or following therapeutic interventions.
IV. In cell biology, a convergence of several experimental techniques and computational methods are driving work towards an audacious goal: determining the spatiotemporal organization of a human cell at molecular resolution (Tomita, 2001; Singla et al., 2018). The spatial location of proteins can be mapped at sub-cellular resolution using imaging and mass-spectrometry techniques (Boisvert et al., 2012; Gatto et al., 2019; Lundberg and Borner, 2019); the molecular structure of these proteins can be determined using cryogenic electron microscopy (Bai et al., 2015; Callaway, 2020b) — even when they occur in large complexes. Transient protein complexes can be either measured experimentally, inferred from sequence information (Elofsson, 2021), or modelled in large-scale molecular simulations (e.g., McGuffee and Elcock, 2010; Feig et al., 2015). Still largely unmet (Figure 2D) is the formidable challenge of developing visual methods that integrate these data with information on protein-protein interactions (Gehlenborg et al., 2010; Ghosh et al., 2011), protein-small molecule interactions (Krone et al., 2016), protein 3D structure (O’Donoghue et al., 2010b; Johnson et al., 2015; Kozlíková et al., 2017; Olson, 2018), and protein dynamics (Humphrey et al., 1996; Rysavy et al., 2014; Ferina and Daggett, 2019). If this challenge can be met, this would provide a structural framework for understanding the molecular basis of cell behavior; this, in turn, could have profound impact, similar to how the structure of DNA advanced our understanding of the molecular basis of information storage and replication (Watson and Crick, 1953).
V. Multiple advances in tissue-scale imaging are driving other audacious goals: for example, two-photon fluorescence microscopy (Pittet and Weissleder, 2011) is being used to construct 3D maps of neural connectivity in mammalian brains (e.g., Economo et al., 2016), and also to track real-time movements of cells and subcellular structures within living tissues, including tumors (e.g., Kedrin et al., 2008; Conway et al., 2018). In addition, combining tissue imaging with fluorescence in situ hybridization methods now enables spatial mapping of RNA transcription (Ståhl et al., 2016; Burgess, 2019) at near-cellular resolution (Figure 2E) (Stickels et al., 2020; Marx, 2021). Combining these data with tissue-scale or whole-body kinetic modeling (Alqahtani, 2017) has potential to revolutionize our understanding of physiology and the body’s responses to events such as tumor growth or therapeutic interventions. However, extracting insight from such massive, complex datasets requires development of highly tailored, innovative visual analysis methods (e.g., Santos et al., 2015; GTEx Consortium, 2017; Uhlen et al., 2017) to address the many challenges of bridging molecular information with tissue- and whole-organism scale data (Walter et al., 2010; O’Donoghue et al., 2018).
VI. Finally, a set of daunting challenges lie in comparing temporal changes in clinical records across cohorts (Karczewski and Snyder, 2018). The complexity and volume of these data are increasing rapidly due to wearable devices (Kim et al., 2019; Ray et al., 2019); however, data dimensionality dramatically increases when microbiome analysis is also included (e.g., Schüssler-Fiorenza Rose et al., 2019). Current visual analysis methods are often inadequate even when exploring the microbiome of a single person (Procter et al., 2010; Pasolli et al., 2019). Addressing these many challenges calls for innovative new approaches in how we visualize phylogenetic (e.g., Rosindell and Harmon, 2012; Letunic and Bork, 2019) and pan-genomic relationships (e.g., Ding et al., 2018), how we compare microbiomes (e.g., Caporaso et al., 2010; Darling, 2004; Waterhouse et al., 2009), and how we explore clinical information gathered from large cohorts (Figure 2F) (e.g., Jensen et al., 2014).
Communicating Science Visually
Once any of the above grand challenges are addressed, a new challenge is created: how to convey the significance of this breakthrough to others. “Science isn’t complete until it’s communicated” (Day, 1998); but the highly specific nature of the life sciences can make it difficult to communicate a breakthrough even to researchers working in closely related fields, let alone to the general public. Here again data visualization plays an increasingly central role. Many of the visualization methods and tools designed for analysis can be repurposed for communication; but often dedicated communication approaches need to be developed to address specific data challenges, especially when conveying complex or unfamiliar ideas.
For example, an intrinsic difficulty with communicating insights from a molecular-scale model of a human cell (challenge IV, above) is that ‘mesoscale’ molecules (Johnson et al., 2015; Goodsell et al., 2018) behave very differently to macroscopic objects. This difficulty is driving development of innovative communication approaches to convey these dynamic behaviors, e.g., via 2D illustration (e.g., Gardner et al., 2018) or 3D graphics (Goodsell et al., 2020; e.g., Muzic et al., 2015; Waldin et al., 2019). In turn, such methods are being used to create informative and inspiring videos4 (McGill, 2008; Johnson and Hertig, 2014; Iwasa, 2015) and to build interactive environments that can be explored with virtual reality techniques (Johnston et al., 2018).
In contrast to visual analysis, subjective qualities such as aesthetics and novelty become important when using visual methods for outreach. However, the impact of visual storytelling goes beyond outreach; the difficult process of assembling our hypotheses into clear, visual narratives (Nayak et al., 2020) invariably involves integrating pre-existing data in new ways, often revealing hidden assumptions and knowledge gaps. This, in turn, often leads to new insights and hypotheses (e.g., Reilly and Ingber, 2017), thereby continuing the data science cycle (Figure 1). Thus, visual communication should also be considered as an intrinsic part of any grand challenge in bioinformatics data visualization.
Bridging Bioinformatics and Visualization Research
Addressing the above grand challenges requires combining expertise in visual analysis with specific knowledge about the biological context of each experiment, and about what can be inferred, given expected errors and given prior knowledge. This, in turn, requires an exchange of knowledge between researchers in computer science and in various life sciences. Unfortunately, these communities rarely attend the same meetings, have very different publication practices, and are strongly disincentivized to collaborate, since their work performance and funding are assessed using fundamentally different metrics.
To help counteract these obstacles, a range of resources have been created for life scientists that showcase how data visualization is transforming biology; these include: special issues of Nature Methods5 (Evanko, 2010) and of the Journal of Molecular Biology6; a section of BMC Bioinformatics dedicated to advances in either data visualization or image analysis7; a Nature Methods article series on visualization issues8; and the VIZBI9 meeting series (mentioned above), which was highlighted in Nature News (Callaway, 2016). Corresponding resources have also been created for computer scientists, including several Dagstuhl reports (Görg et al., 2013; Aerts et al., 2018) and regular meetings, including the VCBM10 (‘Visual Computing for Biology and Medicine’) and BioVis11 workshops, co-located with the annual conferences Eurographics12 and ISMB13/IEEE VIS14, respectively. In addition, other international meetings bridge related communities, but with more targeted focus—for example, biomedical data visualization (Holzinger, 2012; O’Donoghue et al., 2018) is the focus of MediVis15, while molecular graphics (Olson, 2018; Martinez et al., 2019) is the focus of MolVA16 and of several Shonan meetings (Schafferhans et al., 2016; Baaden et al., 2018).
These activities have catalyzed adoption of emerging visualization methods in the life sciences; notable examples include: use of ggplot2 (Wickham, 2009) for offline analysis, use of D3 (Bostock et al., 2011) for interactive data exploration in websites; use of virtual reality in molecular graphics (Muzic et al., 2015; Sommer et al., 2018); use of augmented reality in surgery (Bernhardt et al., 2017; Maier-Hein et al., 2017); and the use of interactive volume rendering for full-body virtual autopsies (Ljung et al., 2006).
Looking forward, advances in computer hardware and software are set to provide greatly improved graphics as well as new paradigms for user interaction. One of the overarching grand challenges in BioVis is to use these advances to improve research, communication, training, and clinical practices.
Publishing Advances in Bioinformatics Data Visualization
As with all frontier, interdisciplinary work, publishing advances in BioVis can be problematic. Publication venues in computer science often reject manuscripts describing novel methods that lack broad applicability, or describing novel tools that lack a user study—even when the advances described are obviously of very high value to domain experts. Life science journals often reject manuscripts describing novel visual analysis approaches that are too technical or have not yet been used to derive significant, novel biological insights—even when the advances described are highly innovative or required enormous effort. Even journals specializing in bioinformatics often reject manuscripts that describe user studies, design studies, or improvements to existing tools.
Advances in BioVis could lead to tremendous impact, by improving the tools used by life science researchers. However, publication decisions are often driven by perceived potential impact, a criterion that frequently rejects even the most ground-breaking work (Bjørk, 2020). To address this issue, several open-access publishers such as Frontiers17, BMC18, and PeerJ19 have emerged in the past decades with the mandate to base publication decisions solely on scientific rigor and reproducibility.
As part of this process, this ‘grand challenge’ article has been written to accompany the launch of the Data Visualization section in the newly created journal Frontiers in Bioinformatics—the first publication venue dedicated to bioinformatics data visualization. By collecting advances across all life sciences, the Data Visualization section will facilitate exchange of knowledge and best practises between research groups that may otherwise never cross paths; mostly, these groups will comprise bioinformaticians, biomedical researchers, computer scientists, and science communicators—but BioVis also engages educators, user-experience designers, as well as visual arts practitioners, particularly graphic designers and medical illustrators.
Conclusion
It is fortunate that bioinformatics data visualization engages a broad community with diverse backgrounds and perspectives, since one of our core processes is to overcome current cognitive biases in analysis, and to find more effective ways of seeing, analyzing, and thinking about our data. A historical exemplar of this process is the inspiring, interdisciplinary work of Jane and David Richardson20, who devised a method for transforming complex, all-atom representations of large protein structural models into ribbon representations that are greatly simplified and often insightful (Richardson, 1981; Richardson and Richardson, 1989).
Our task going forward is to find analogous ways to reimagine the much larger and more complex datasets in today’s grand challenges, and—using current and future advances in computer graphics—to invent simplifying transformations that are also insightful. Each such invention can be thought of as a step in creating a new visual language (Lima, 2011) that will enhance how we explore, describe, and communicate the processes of life.
Given the daunting data challenges already at hand, creating this visual language will likely be difficult, and will require considerable creativity combined with statistical and mathematical rigor. Given the even more daunting data challenges that are set to come, we could say that bioinformatics data visualization has barely begun (O’Donoghue et al., 2010a).
Author Contributions
SIOD was the sole author of this article.
Conflict of Interest
The author declares that the research was conducted in the absence of any commercial or financial relationships that could be construed as a potential conflict of interest.
Acknowledgments
The perspectives presented in this article have emerged from discussions with participants of the ten VIZBI meetings to date. I would like to thank my VIZBI co-chair James Procter, as well as Andrea Schafferhans, Neblina Sikta, and Sandeep Kaur for helpful discussions and feedback. Finally, thanks to WikiMedia user ‘Hankem’ for creating the brain illustration used as part of Figure 1, and for releasing this illustration into the public domain.
Footnotes
1Paraphrasing from Fred Brooks (1996).
3https://www.uniprot.org/docs/ptmlist
4https://clarafi.com/showcase/
5https://www.nature.com/collections/iecaaechei
6https://www.sciencedirect.com/journal/journal-of-molecular-biology/special-issue/10VZQRR6PS7
7https://bmcbioinformatics.biomedcentral.com/articles/sections/imaging-image-analysis-and-data-visualization
8http://blogs.nature.com/methagora/2013/07/data-visualization-points-of-view.html
10https://dblp.org/db/conf/vcbm
13https://www.iscb.org/about-ismb
15http://www.graphicslink.co.uk/MediVis2021/
16http://decibel.fi.muni.cz/∼xbyska/molva/
17“Frontiers does not reject manuscripts based on their perceived potential impact” - https://www.frontiersin.org/about/review-system
18“We do not make editorial decisions on the basis of the interest of a study or its likely impact” - https://bmcbioinformatics.biomedcentral.com/about
19https://peerj.com/about/FAQ/#quality
20https://stories.duke.edu/sciences-mother-of-ribbon-diagrams-celebrates-50-years-at-duke
References
Aerts, J., Gehlenborg, N., Marai, G. E., and Nieselt, K. K. (2018). Visualization of Biological Data - Crossroads (Dagstuhl Semin. 18161). Dagstuhl Rep. 8 (4), 32–71. doi:10.4230/DAGREP.8.4.32
Alqahtani, S. (2017). In Silico ADME-Tox Modeling: Progress and Prospects. Expert Opin. Drug Metab. Toxicol. 13, 1147–1158. doi:10.1080/17425255.2017.1389897
Altman, R. B., and Levitt, M. (2018). What Is Biomedical Data Science and Do We Need an Annual Review of it? Annu. Rev. Biomed. Data Sci. 1, i–iii. doi:10.1146/annurev-bd-01-041718-100001
Anscombe, F. J. (1973). Graphs in Statistical Analysis. Am. Stat. 27, 17–21. doi:10.1080/00031305.1973.1047896610.2307/2682899
Asbury, T. M., Mitman, M., Tang, J., and Zheng, W. J. (2010). Genome3D: a Viewer-Model Framework for Integrating and Visualizing Multi-Scale Epigenomic Information within a Three-Dimensional Genome. BMC Bioinformatics 11, 444. doi:10.1186/1471-2105-11-444
Autin, L., Maritan, M., Barbaro, B. A., Gardner, A., Olson, A. J., Sanner, M., et al. (2020). Mesoscope: A Web-Based Tool for Mesoscale Data Integration and Curation. Workshop Mol. Graph. Vis. Anal. Mol. Data 9, 23–31. doi:10.2312/MOLVA.20201098
Ay, F., and Noble, W. S. (2015). Analysis Methods for Studying the 3D Architecture of the Genome. Genome Biol. 16, 183. doi:10.1186/s13059-015-0745-7
Baaden, M., O’Donoghue, S., and Sekijima, M. (2018). Web Molecular Graphics: Emerging Technologies & Standards. NII Shonan Meeting Report, Number 142. Available at: https://shonan.nii.ac.jp/docs/No-142.pdf.
Bai, X., McMullan, G., and Scheres, S. H. W. (2015). How Cryo-EM Is Revolutionizing Structural Biology. Trends Biochem. Sci. 40, 49–57. doi:10.1016/j.tibs.2014.10.005
Bernhardt, S., Nicolau, S. A., Soler, L., and Doignon, C. (2017). The Status of Augmented Reality in Laparoscopic Surgery as of 2016. Med. Image Anal. 37, 66–90. doi:10.1016/j.media.2017.01.007
Bjørk, R. (2020). The Journals in Physics that Publish Nobel Prize Research. Scientometrics 122, 817–823. doi:10.1007/s11192-019-03312-8
Blei, D. M., and Smyth, P. (2017). Science and Data Science. Proc. Natl. Acad. Sci. 114, 8689–8692. doi:10.1073/pnas.1702076114
Boisvert, F.-M., Ahmad, Y., Gierliński, M., Charrière, F., Lamont, D., Scott, M., et al. (2012). A Quantitative Spatial Proteomics Analysis of Proteome Turnover in Human Cells. Mol. Cel. Proteomics 11, M111.011429. doi:10.1074/mcp.M111.011429
Bostock, M., Ogievetsky, V., and Heer, J. (2011). D3: Data-Driven Documents. IEEE Trans. Vis. Comput. Graph. 17, 2301–2309. doi:10.1109/TVCG.2011.185
Brooks, F. P. (1996). The Computer Scientist as Toolsmith II. Commun. ACM 39, 61–68. doi:10.1145/227234.227243
Burgess, D. J. (2019). Spatial Transcriptomics Coming of Age. Nat. Rev. Genet. 20, 317. doi:10.1038/s41576-019-0129-z
Callaway, E. (2016). The Visualizations Transforming Biology. Nature 535, 187–188. doi:10.1038/535187a
Callaway, E. (2020a). ‘It Will Change Everything’: DeepMind’s AI Makes Gigantic Leap in Solving Protein Structures. Nature 588, 203–204. doi:10.1038/d41586-020-03348-4
Callaway, E. (2020b). Revolutionary Cryo-EM Is Taking over Structural Biology. Nature 578, 201. doi:10.1038/d41586-020-00341-9
Caporaso, J. G., Kuczynski, J., Stombaugh, J., Bittinger, K., Bushman, F. D., Costello, E. K., et al. (2010). QIIME Allows Analysis of High-Throughput Community Sequencing Data. Nat. Methods 7, 335–336. doi:10.1038/nmeth.f.303
Card, S. K., Mackinlay, J. D., and Shneiderman, B. (1999). Readings in Information Visualization: Using Vision to Think, the Morgan Kaufmann Series in Interactive Technologies. San Francisco, Calif: Morgan Kaufmann Publishers.
Challen, R., Denny, J., Pitt, M., Gompels, L., Edwards, T., and Tsaneva-Atanasova, K. (2019). Artificial Intelligence, Bias and Clinical Safety. BMJ Qual. Saf. 28, 231–237. doi:10.1136/bmjqs-2018-008370
Chen, K. H., Boettiger, A. N., Moffitt, J. R., Wang, S., and Zhuang, X. (2015). Spatially Resolved, Highly Multiplexed RNA Profiling in Single Cells. Science 348, aaa6090. doi:10.1126/science.aaa6090
Coifman, R. R., Lafon, S., Lee, A. B., Maggioni, M., Nadler, B., Warner, F., et al. (2005). Geometric Diffusions as a Tool for Harmonic Analysis and Structure Definition of Data: Diffusion Maps. Proc. Natl. Acad. Sci. 102, 7426–7431. doi:10.1073/pnas.0500334102
Conway, J. R. W., Warren, S. C., Herrmann, D., Murphy, K. J., Cazet, A. S., Vennin, C., et al. (2018). Intravital Imaging to Monitor Therapeutic Response in Moving Hypoxic Regions Resistant to PI3K Pathway Targeting in Pancreatic Cancer. Cell Rep. 23, 3312–3326. doi:10.1016/j.celrep.2018.05.038
Darling, A. C. E. (2004). Mauve: Multiple Alignment of Conserved Genomic Sequence with Rearrangements. Genome Res. 14, 1394–1403. doi:10.1101/gr.2289704
Ding, W., Baumdicker, F., and Neher, R. A. (2018). panX: Pan-Genome Analysis and Exploration. Nucleic Acids Res. 46, e5. doi:10.1093/nar/gkx977
Economo, M. N., Clack, N. G., Lavis, L. D., Gerfen, C. R., Svoboda, K., Myers, E. W., et al. (2016). A Platform for Brain-wide Imaging and Reconstruction of Individual Neurons. eLife 5, e10566. doi:10.7554/eLife.10566
Elofsson, A. (2021). Towards Characterising the Cellular 3D-Proteome. Front. Bioinform. 1, 598878. doi:10.3389/fbinf.2021.598878
Evanko, D. (2010). Supplement on Visualizing Biological Data. Nat. Methods 7, S1. doi:10.1038/nmeth0310-S1
Feig, M., Harada, R., Mori, T., Yu, I., Takahashi, K., and Sugita, Y. (2015). Complete Atomistic Model of a Bacterial Cytoplasm for Integrating Physics, Biochemistry, and Systems Biology. J. Mol. Graph. Model. 58, 1–9. doi:10.1016/j.jmgm.2015.02.004
Ferina, J., and Daggett, V. (2019). Visualizing Protein Folding and Unfolding. J. Mol. Biol. 431, 1540–1564. doi:10.1016/j.jmb.2019.02.026
Gardner, A., Autin, L., Barbaro, B., Olson, A. J., and Goodsell, D. S. (2018). CellPAINT: Interactive Illustration of Dynamic Mesoscale Cellular Environments. IEEE Comput. Graph. Appl. 38, 51–66. doi:10.1109/MCG.2018.2877076
Gatto, L., Breckels, L. M., and Lilley, K. S. (2019). Assessing Sub-cellular Resolution in Spatial Proteomics Experiments. Curr. Opin. Chem. Biol. 48, 123–149. doi:10.1016/j.cbpa.2018.11.015
Gehlenborg, N., O’Donoghue, S. I., Baliga, N. S., Goesmann, A., Hibbs, M. A., Kitano, H., et al. (2010). Visualization of Omics Data for Systems Biology. Nat. Methods 7, S56–S68. doi:10.1038/nmeth.1436
Ghosh, S., Matsuoka, Y., Asai, Y., Hsin, K.-Y., and Kitano, H. (2011). Software for Systems Biology: from Tools to Integrated Platforms. Nat. Rev. Genet. 12, 821–832. doi:10.1038/nrg3096
Görg, C., Hunter, L., Kennedy, J., O’Donoghue, S., and Van Wijk, J. J. (2013). Biological Data Visualization (Dagstuhl Seminar 12372). Dagstuhl Rep. 2 (9), 131–164. doi:10.4230/DAGREP.2.9.131
Goodsell, D. S., Franzen, M. A., and Herman, T. (2018). From Atoms to Cells: Using Mesoscale Landscapes to Construct Visual Narratives. J. Mol. Biol. 430, 3954–3968. doi:10.1016/j.jmb.2018.06.009
Goodsell, D. S., Olson, A. J., and Forli, S. (2020). Art and Science of the Cellular Mesoscale. Trends Biochem. Sci. 45, 472–483. doi:10.1016/j.tibs.2020.02.010
Green, E. D., Gunter, C., Biesecker, L. G., Di Francesco, V., Easter, C. L., Feingold, E. A., et al. (2020). Strategic Vision for Improving Human Health at the Forefront of Genomics. Nature 586, 683–692. doi:10.1038/s41586-020-2817-4
GTEx Consortium (2017). Genetic Effects on Gene Expression across Human Tissues. Nature 550, 204–213. doi:10.1038/nature24277
Healey, C. G., and Enns, J. T. (2012). Attention and Visual Memory in Visualization and Computer Graphics. IEEE Trans. Vis. Comput. Graph. 18, 1170–1188. doi:10.1109/TVCG.2011.127
Heaven, D. (2019). Why Deep-Learning AIs Are So Easy to Fool. Nature 574, 163–166. doi:10.1038/d41586-019-03013-5
Holzinger, A. (2012). “On Knowledge Discovery and Interactive Intelligent Visualization of Biomedical Data,” in Proceedings of the International Conference on Data Technologies and Applications DATA 2012. Editors M. Helfert, C. Fancalanci, and J. Filipe (Rome (Italy):Elsevier), 5–16.
Humphrey, W., Dalke, A., and Schulten, K. (1996). VMD: Visual Molecular Dynamics. J. Mol. Graph. 14, 33–38. doi:10.1016/0263-7855(96)00018-5
Iwasa, J. H. (2015). Bringing Macromolecular Machinery to Life Using 3D Animation. Curr. Opin. Struct. Biol. 31, 84–88. doi:10.1016/j.sbi.2015.03.015
Jensen, A. B., Moseley, P. L., Oprea, T. I., Ellesøe, S. G., Eriksson, R., Schmock, H., et al. (2014). Temporal Disease Trajectories Condensed from Population-wide Registry Data Covering 6.2 Million Patients. Nat. Commun. 5, 4022. doi:10.1038/ncomms5022
Johnson, G. T., and Hertig, S. (2014). A Guide to the Visual Analysis and Communication of Biomolecular Structural Data. Nat. Rev. Mol. Cel Biol. 15, 690–698. doi:10.1038/nrm3874
Johnson, G. T., Autin, L., Al-Alusi, M., Goodsell, D. S., Sanner, M. F., and Olson, A. J. (2015). cellPACK: a Virtual Mesoscope to Model and Visualize Structural Systems Biology. Nat. Methods 12, 85–91. doi:10.1038/nmeth.3204
Johnston, A. P. R., Rae, J., Ariotti, N., Bailey, B., Lilja, A., Webb, R., et al. (2018). Journey to the Centre of the Cell: Virtual Reality Immersion into Scientific Data. Traffic 19, 105–110. doi:10.1111/tra.12538
Karczewski, K. J., and Snyder, M. P. (2018). Integrative Omics for Health and Disease. Nat. Rev. Genet. 19, 299–310. doi:10.1038/nrg.2018.4
Kaur, S., Baldi, B., Vuong, J., and O’Donoghue, S. I. (2019). Visualization and Analysis of Epiproteome Dynamics. J. Mol. Biol. 431, 1519–1539. doi:10.1016/j.jmb.2019.01.044
Kaur, S., Peters, T. J., Yang, P., Luu, L. D. W., Vuong, J., Krycer, J. R., et al. (2020). Temporal Ordering of Omics and Multiomic Events Inferred from Time-Series Data. Npj Syst. Biol. Appl. 6, 22. doi:10.1038/s41540-020-0141-0
Kedrin, D., Gligorijevic, B., Wyckoff, J., Verkhusha, V. V., Condeelis, J., Segall, J. E., et al. (2008). Intravital Imaging of Metastatic Behavior through a Mammary Imaging Window. Nat. Methods 5, 1019–1021. doi:10.1038/nmeth.1269
Kim, S. C., Sprung, R., Chen, Y., Xu, Y., Ball, H., Pei, J., et al. (2006). Substrate and Functional Diversity of Lysine Acetylation Revealed by a Proteomics Survey. Mol. Cel 23, 607–618. doi:10.1016/j.molcel.2006.06.026
Kim, J., Campbell, A. S., de Ávila, B. E.-F., and Wang, J. (2019). Wearable Biosensors for Healthcare Monitoring. Nat. Biotechnol. 37, 389–406. doi:10.1038/s41587-019-0045-y
Klein, T., Autin, L., Kozlikova, B., Goodsell, D. S., Olson, A., Groller, M. E., et al. (2018). Instant Construction and Visualization of Crowded Biological Environments. IEEE Trans. Vis. Comput. Graph. 24, 862–872. doi:10.1109/TVCG.2017.2744258
Koch, K., McLean, J., Segev, R., Freed, M. A., Berry, M. J., Balasubramanian, V., et al. (2006). How Much the Eye Tells the Brain. Curr. Biol. 16, 1428–1434. doi:10.1016/j.cub.2006.05.056
Kozlíková, B., Krone, M., Falk, M., Lindow, N., Baaden, M., Baum, D., et al. (2017). Visualization of Biomolecular Structures: State of the Art Revisited: Visualization of Biomolecular Structures. Comput. Graph. Forum 36, 178–204. doi:10.1111/cgf.13072
Krone, M., Kozlíková, B., Lindow, N., Baaden, M., Baum, D., Parulek, J., et al. (2016). Visual Analysis of Biomolecular Cavities: State of the Art. Comput. Graph. Forum 35, 527–551. doi:10.1111/cgf.12928
Letunic, I., and Bork, P. (2019). Interactive Tree of Life (iTOL) V4: Recent Updates and New Developments. Nucleic Acids Res. 47, W256–W259. doi:10.1093/nar/gkz239
Lieberman-Aiden, E., van Berkum, N. L., Williams, L., Imakaev, M., Ragoczy, T., Telling, A., et al. (2009). Comprehensive Mapping of Long-Range Interactions Reveals Folding Principles of the Human Genome. Science 326, 289–293. doi:10.1126/science.1181369
Lima, M. (2011). Visual Complexity: Mapping Patterns of Information. New York: Princeton Architectural Press. doi:10.7476/9788523209308
Ljung, P., Winskog, C., Persson, A., Lundstrom, C., and Ynnerman, A. (2006). Full Body Virtual Autopsies Using a State-Of-The-Art Volume Rendering Pipeline. IEEE Trans. Vis. Comput. Graph. 12, 869–876. doi:10.1109/TVCG.2006.146
Lundberg, E., and Borner, G. H. H. (2019). Spatial Proteomics: a Powerful Discovery Tool for Cell Biology. Nat. Rev. Mol. Cel Biol. 20, 285–302. doi:10.1038/s41580-018-0094-y
Ma, D. K. G., Stolte, C., Krycer, J. R., James, D. E., and O’Donoghue, S. I. (2015). SnapShot: Insulin/IGF1 Signaling. Cell 161, 948–948.e1. doi:10.1016/j.cell.2015.04.041
Maier-Hein, L., Vedula, S. S., Speidel, S., Navab, N., Kikinis, R., Park, A., et al. (2017). Surgical Data Science for Next-Generation Interventions. Nat. Biomed. Eng. 1, 691–696. doi:10.1038/s41551-017-0132-7
Martinez, X., Krone, M., Alharbi, N., Rose, A. S., Laramee, R. S., O’Donoghue, S., et al. (2019). Molecular Graphics: Bridging Structural Biologists and Computer Scientists. Structure 27, 1617–1623. doi:10.1016/j.str.2019.09.001
Marx, V. (2021). Method of the Year: Spatially Resolved Transcriptomics. Nat. Methods 18, 9–14. doi:10.1038/s41592-020-01033-y
McGill, G. (2008). Molecular Movies…Coming to a Lecture Near You. Cell 133, 1127–1132. doi:10.1016/j.cell.2008.06.013
McGuffee, S. R., and Elcock, A. H. (2010). Diffusion, Crowding & Protein Stability in a Dynamic Molecular Model of the Bacterial Cytoplasm. PLoS Comput. Biol. 6, e1000694. doi:10.1371/journal.pcbi.1000694
Morelle, W., Canis, K., Chirat, F., Faid, V., and Michalski, J.-C. (2006). The Use of Mass Spectrometry for the Proteomic Analysis of Glycosylation. Proteomics 6, 3993–4015. doi:10.1002/pmic.200600129
Muzic, M. L., Autin, L., Parulek, J., and Viola, I. (2015). cellVIEW: a Tool for Illustrative and Multi-Scale Rendering of Large Biomolecular Datasets. Eurographics Workshop Vis. Comput. Biol. Med. 2015, 61–70. doi:10.2312/VCBM.20151209
Nayak, S., Liu, H., Hsu, G. I., and Iwasa, J. H. (2020). Using 3D Animation to Visualize Hypotheses. Trends Biochem. Sci. 45, 633–634. doi:10.1016/j.tibs.2020.04.009
Needham, E. J., Parker, B. L., Burykin, T., James, D. E., and Humphrey, S. J. (2019). Illuminating the Dark Phosphoproteome. Sci. Signal. 12, eaau8645. doi:10.1126/scisignal.aau8645
O’Donoghue, S. I., Gavin, A.-C., Gehlenborg, N., Goodsell, D. S., Hériché, J.-K., Nielsen, C. B., et al. (2010a). Visualizing Biological Data—Now and in the Future. Nat. Methods 7, S2–S4. doi:10.1038/nmeth.f.301
O’Donoghue, S. I., Goodsell, D. S., Frangakis, A. S., Jossinet, F., Laskowski, R. A., Nilges, M., et al. (2010b). Visualization of Macromolecular Structures. Nat. Methods 7, S42–S55. doi:10.1038/nmeth.1427
O’Donoghue, S. I., Baldi, B. F., Clark, S. J., Darling, A. E., Hogan, J. M., Kaur, S., et al. (2018). Visualization of Biomedical Data. Annu. Rev. Biomed. Data Sci. 1, 275–304. doi:10.1146/annurev-biodatasci-080917-013424
Olsen, J. V., Blagoev, B., Gnad, F., Macek, B., Kumar, C., Mortensen, P., et al. (2006). Global, In Vivo, and Site-specific Phosphorylation Dynamics in Signaling Networks. Cell 127, 635–648. doi:10.1016/j.cell.2006.09.026
Olson, A. J. (2018). Perspectives on Structural Molecular Biology Visualization: From Past to Present. J. Mol. Biol. 430, 3997–4012. doi:10.1016/j.jmb.2018.07.009
Ou, H. D., Phan, S., Deerinck, T. J., Thor, A., Ellisman, M. H., and O’Shea, C. C. (2017). ChromEMT: Visualizing 3D Chromatin Structure and Compaction in Interphase and Mitotic Cells. Science 357, eaag0025. doi:10.1126/science.aag0025
Pasolli, E., Asnicar, F., Manara, S., Zolfo, M., Karcher, N., Armanini, F., et al. (2019). Extensive Unexplored Human Microbiome Diversity Revealed by over 150,000 Genomes from Metagenomes Spanning Age, Geography, and Lifestyle. Cell 176, 649–662.e20. doi:10.1016/j.cell.2019.01.001
Pittet, M. J., and Weissleder, R. (2011). Intravital Imaging. Cell 147, 983–991. doi:10.1016/j.cell.2011.11.004
Procter, J. B., Thompson, J., Letunic, I., Creevey, C., Jossinet, F., and Barton, G. J. (2010). Visualization of Multiple Alignments, Phylogenies and Gene Family Evolution. Nat. Methods 7, S16–S25. doi:10.1038/nmeth.1434
Ray, T. R., Choi, J., Bandodkar, A. J., Krishnan, S., Gutruf, P., Tian, L., et al. (2019). Bio-Integrated Wearable Systems: A Comprehensive Review. Chem. Rev. 119, 5461–5533. doi:10.1021/acs.chemrev.8b00573
Reilly, C., and Ingber, D. E. (2017). Art Advancing Science: Filmmaking Leads to Molecular Insights at the Nanoscale. ACS Nano 11, 12156–12166. doi:10.1021/acsnano.7b05266
Richardson, J. S., and Richardson, D. C. (1989). “Principles and Patterns of Protein Conformation,” in Prediction of Protein Structure and the Principles of Protein Conformation. Editor G. D. Fasman (Boston, MA: Springer US), 1–98. doi:10.1007/978-1-4613-1571-1_1
Richardson, J. S. (1981). The Anatomy and Taxonomy of Protein Structure. Adv. Protein Chem. 34, 167–339. doi:10.1016/s0065-3233(08)60520-3
Rosindell, J., and Harmon, L. J. (2012). OneZoom: A Fractal Explorer for the Tree of Life. PLoS Biol. 10, e1001406. doi:10.1371/journal.pbio.1001406
Roundtree, I. A., Evans, M. E., Pan, T., and He, C. (2017). Dynamic RNA Modifications in Gene Expression Regulation. Cell 169, 1187–1200. doi:10.1016/j.cell.2017.05.045
Rysavy, S. J., Beck, D. A. C., and Daggett, V. (2014). Dynameomics: Data-Driven Methods and Models for Utilizing Large-Scale Protein Structure Repositories for Improving Fragment-Based Loop Prediction: Dynameomics: Improving Fragment-Based Loop Prediction. Protein Sci. 23, 1584–1595. doi:10.1002/pro.2537
Santos, A., Tsafou, K., Stolte, C., Pletscher-Frankild, S., O’Donoghue, S. I., and Jensen, L. J. (2015). Comprehensive Comparison of Large-Scale Tissue Expression Datasets. PeerJ 3, e1054. doi:10.7717/peerj.1054
Schafferhans, A., O’Donoghue, S., and Nakamura, H. (2016). “Web-based 809 Molecular Graphics,” in NII Shonan Meeting Report, Number 2016-12. Available at: https://shonan.nii.ac.jp/No.2016-12.pdf.
Schüssler-Fiorenza Rose, S. M., Contrepois, K., Moneghetti, K. J., Zhou, W., Mishra, T., Mataraso, S., et al. (2019). A Longitudinal Big Data Approach for Precision Health. Nat. Med. 25, 792–804. doi:10.1038/s41591-019-0414-6
Serra, F., Di Stefano, M., Spill, Y. G., Cuartero, Y., Goodstadt, M., Baù, D., et al. (2015). Restraint-based Three-Dimensional Modeling of Genomes and Genomic Domains. FEBS Lett. 589, 2987–2995. doi:10.1016/j.febslet.2015.05.012
Shevchenko, A., and Simons, K. (2010). Lipidomics: Coming to Grips with Lipid Diversity. Nat. Rev. Mol. Cel Biol. 11, 593–598. doi:10.1038/nrm2934
Singla, J., McClary, K. M., White, K. L., Alber, F., Sali, A., and Stevens, R. C. (2018). Opportunities and Challenges in Building a Spatiotemporal Multi-Scale Model of the Human Pancreatic β Cell. Cell 173, 11–19. doi:10.1016/j.cell.2018.03.014
Sommer, B., Baaden, M., Krone, M., and Woods, A. (2018). From Virtual Reality to Immersive Analytics in Bioinformatics. J. Integr. Bioinforma. 15, 20180043. doi:10.1515/jib-2018-0043
Ståhl, P. L., Salmén, F., Vickovic, S., Lundmark, A., Navarro, J. F., Magnusson, J., et al. (2016). Visualization and Analysis of Gene Expression in Tissue Sections by Spatial Transcriptomics. Science 353, 78–82. doi:10.1126/science.aaf2403
Stickels, R. R., Murray, E., Kumar, P., Li, J., Marshall, J. L., Di Bella, D. J., et al. (2020). Highly Sensitive Spatial Transcriptomics at Near-Cellular Resolution with Slide-seqV2. Nat. Biotechnol. 39, 313–319. doi:10.1038/s41587-020-0739-1
Tomita, M. (2001). Whole-cell Simulation: a Grand Challenge of the 21st Century. Trends Biotechnol. 19, 205–210. doi:10.1016/S0167-7799(01)01636-5
Uhlen, M., Zhang, C., Lee, S., Sjöstedt, E., Fagerberg, L., Bidkhori, G., et al. (2017). A Pathology Atlas of the Human Cancer Transcriptome. Science 357, eaan2507. doi:10.1126/science.aan2507
Valdes-Mora, F., Salomon, R., Gloss, B., Law, A. M. K., Castillo, L., Murphy, K. J., et al. (2019). Single Cell Transcriptomics Reveals Involution Mimicry during the Specification of the Basal Breast Cancer Subtype. Cel. Rep. 35, 108945. doi:10.1101/624890
Van der Maaten, L., and Hinton, G. (2008). Visualizing Data Using T-SNE. J. Mach. Learn. Res. 9, 2579–2605.
Vandenbon, A., and Diez, D. (2020). A Clustering-independent Method for Finding Differentially Expressed Genes in Single-Cell Transcriptome Data. Nat. Commun. 11, 4318. doi:10.1038/s41467-020-17900-3
Waldin, N., Waldner, M., Le Muzic, M., Gröller, E., Goodsell, D. S., Autin, L., et al. (2019). Cuttlefish: Color Mapping for Dynamic Multi‐Scale Visualizations. Comput. Graph. Forum 38, 150–164. doi:10.1111/cgf.13611
Walter, T., Shattuck, D. W., Baldock, R., Bastin, M. E., Carpenter, A. E., Duce, S., et al. (2010). Visualization of Image Data from Cells to Organisms. Nat. Methods 7, S26–S41. doi:10.1038/nmeth.1431
Waterhouse, A. M., Procter, J. B., Martin, D. M. A., Clamp, M., and Barton, G. J. (2009). Jalview Version 2--a Multiple Sequence Alignment Editor and Analysis Workbench. Bioinformatics 25, 1189–1191. doi:10.1093/bioinformatics/btp033
Watson, J. D., and Crick, F. H. C. (1953). Molecular Structure of Nucleic Acids: A Structure for Deoxyribose Nucleic Acid. Nature 171, 737–738. doi:10.1038/171737a0
Wills, Q. F., Livak, K. J., Tipping, A. J., Enver, T., Goldson, A. J., Sexton, D. W., et al. (2013). Single-cell Gene Expression Analysis Reveals Genetic Associations Masked in Whole-Tissue Experiments. Nat. Biotechnol. 31, 748–752. doi:10.1038/nbt.2642
Yu, K.-H., and Kohane, I. S. (2019). Framing the Challenges of Artificial Intelligence in Medicine. BMJ Qual. Saf. 28, 238–241. doi:10.1136/bmjqs-2018-008551
Keywords: bioinformatics, data science, data visualization, visual analytics, computational biology, science communication
Citation: O'Donoghue SI (2021) Grand Challenges in Bioinformatics Data Visualization. Front. Bioinform. 1:669186. doi: 10.3389/fbinf.2021.669186
Received: 18 February 2021; Accepted: 30 April 2021;
Published: 17 June 2021.
Edited by:
Barbora Kozlikova, Masaryk University, CzechiaReviewed by:
Pere-Pau Vázquez, Universitat Politecnica de Catalunya, SpainCopyright © 2021 O'Donoghue. This is an open-access article distributed under the terms of the Creative Commons Attribution License (CC BY). The use, distribution or reproduction in other forums is permitted, provided the original author(s) and the copyright owner(s) are credited and that the original publication in this journal is cited, in accordance with accepted academic practice. No use, distribution or reproduction is permitted which does not comply with these terms.
*Correspondence: Seán I. O'Donoghue, c2VhbkBvZG9ub2dodWVsYWIub3Jn