 Heming Zhang
 Yixin Chen1*
 Fuhai Li
- 1Department of Computer Science, Washington University in St. Louis, St. Louis, MO, United States
- 2Institute for Informatics, Washington University School of Medicine, St. Louis, MO, United States
- 3Department of Pediatrics, Washington University School of Medicine, Washington University in St. Louis, St. Louis, MO, United States
Thanks to the availability of multiomics data of individual cancer patients, precision medicine or personalized medicine is becoming a promising treatment for individual cancer patients. However, the association patterns, that is, the mechanism of response (MoR) between large-scale multiomics features and drug response are complex and heterogeneous and remain unclear. Although there are existing computational models for predicting drug response using the high-dimensional multiomics features, it remains challenging to uncover the complex molecular mechanism of drug responses. To reduce the number of predictors/features and make the model more interpretable, in this study, 46 signaling pathways were used to build a deep learning model constrained by signaling pathways, consDeepSignaling, for anti–drug response prediction. Multiomics data, like gene expression and copy number variation, of individual genes can be integrated naturally in this model. The signaling pathway–constrained deep learning model was evaluated using the multiomics data of ∼1000 cancer cell lines in the Broad Institute Cancer Cell Line Encyclopedia (CCLE) database and the corresponding drug–cancer cell line response data set in the Genomics of Drug Sensitivity in Cancer (GDSC) database. The evaluation results showed that the proposed model outperformed the existing deep neural network models. Also, the model interpretation analysis indicated the distinctive patterns of importance of signaling pathways in anticancer drug response prediction.
Introduction
Precision medicine or personalized medicine is becoming feasible and widely adopted in cancer treatment due to the availability of multiomics data that comprehensively characterize individual cancer samples. For example, comprehensive multiomics data, like gene expression, copy number variation (CNV), genetic mutation, methylation, and proteomics, as well as clinical outcome information of over 20,000 cancer patients across 33 cancer types and subtypes are available in the cancer genome atlas (TCGA) program (Goldman et al., 2018). On the other hand, the cancer cell lines are important experimental models for evaluating important biomarkers and screening effective drugs in laboratories. The comprehensive multiomics data of >1,000 cancer cell lines were generated and available in the Broad Institute Cancer Cell Line Encyclopedia (CCLE) database (Barretina et al., 2012; Wang et al., 2019). In addition, the drug response of ∼1,000 cancer cell lines against ∼100 drugs and compounds is available in the Genomics of Drug Sensitivity in Cancer (GDSC) database (Garnett et al., 2012; Yang et al., 2013), with the aim of uncovering the potential associations between genetic biomarkers and drug response. Also, about 5,232 drug combination screening of 104 drugs against 60 cancer cell lines are available in the NCI-ALMANAC Drug Combination database (Holbeck et al., 2017). These valuable data sets provide a basis for fully understanding the potential molecular mechanism of cancer heterogeneity and diversity, as well as for understanding the potential mechanism of response (MoR) to anticancer drug treatments.
However, it remains challenging to integrate and interpret the diverse and large number of data points in the high-dimensional multiomics data in a biologically meaningful manner. Though associations between individual biomarkers and drug response have been identified, it is still challenging to decode and uncover the complex signaling networks (interactions of a group of molecules to control specific cellular functions) that regulate the anticancer drug response based on the high-dimensional multiomics data sets. For example, an elastic net model was employed in CCLE and GDSC data analysis to associate the individual biomarkers to the drug response (Barretina et al., 2012; Garnett et al., 2012; Yang et al., 2013; Wang et al., 2019). A support vector machine (SVM)–based model was proposed to predict drug response based on chemical structures and multiomics-based cancer cell line similarity (Wang et al., 2016). Also, drug–cancer cell line similarity–based network models (Sheng et al., 2015; Zhang et al., 2015) were proposed to predict the drug response, and the recommender system was used for drug response prediction (Suphavilai et al., 2018).
Deep learning models have also been proposed for drug response prediction. For example, chemical structure features and omics data have been used as the input of an auto-encoder to reduce the dimension of features and then predict the drug response using deep neural network (DNN) (Li et al., 2019). In addition, a DNN framework was developed to predict anticancer drug response based on gene expression data (Sakellaropoulos et al., 2019), and the results showed that the DNN models outperformed the current machine learning frameworks. Similar models were also proposed to predict drug combination response to anticancer drugs. For example, DeepSynergy (Preuer et al., 2018) and AuDNNsynergy (Zhang et al., 2018) were proposed by integrating chemical structure and genomics features of cancer cell lines and cancer patients in auto-encoders. To understand the mechanism of model prediction in the “black boxes” of deep learning models, the visible neural network (VNN) models (e.g., DCell and DrugCell) (Yu et al., 2018; Kong et al., 2020; Kuenzi et al., 2020) were proposed, using large hierarchical deep learning architecture to model the hierarchical organization of biological processes and to predict drug response with important biomarkers. In DrugCell, large-scale omics data and chemical structure data were used. However, the pathway-level activity was not specifically investigated. Moreover, PASNet (Hao et al., 2018) and Path-DNN (Deng et al., 2020) were proposed to incorporate biological network information. In PASNet, cancer patients’ survival was predicted based on gene expression data. In Path-DNN (Deng et al., 2020), the gene expression data of a set of landmark genes and all general KEGG pathways were used to predict drug response.
In this study, we aimed to improve these models, by developing a deep learning model constrained by signaling pathways, consDeepSignaling, which investigated the activity of 46 signaling pathways (the 45 pathways named with signaling pathways plus the cell cycle pathway) collected from the KEGG signaling pathway database (Ogata et al., 1999; Kanehisa and Goto, 2000; Feng et al., 2020; Zhang et al., 2020) using both the gene expression and copy number variation data of individual genes. Besides that, we leveraged the powerful tool to interpret our models in a global view, which will facilitate the study of signaling pathways in the biomedicine field. In cancer studies, signaling pathways are important concepts that define the signaling cascades among a set of gene/proteins and are therefore biologically meaningful and interpretable to explain the drug response (Sanchez-Vega et al., 2018). For example, the 10 major cancer-related signaling pathways were analyzed using the comprehensive multiomics data of TCGA cancer samples (Sanchez-Vega et al., 2018). The analysis results indicated that about 89% of cancer samples had at least one driver alteration among these signaling pathways. Therefore, we aim to investigate the possibility of using a deep learning model constrained by 46 signaling pathways to predict anticancer drug response. The proposed model was evaluated and compared with existing models using the omics data of cancer cell lines in CCLE and drug response data in the GDSC data set.
Materials and Methodology
Genomics of Drug Sensitivity in Cancer Fitted Dose Response Data and Multi-Omics Data
The drug–dose response and omics data of cancer cell lines were obtained from the GDSC database (Table 1). From this data set, the area under the experimental dose–response curve of a given cancer cell line was used to indicate drug effects on the cancer cell line, with a 3-element tuple: <
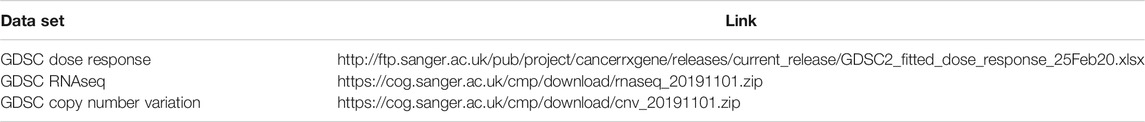
TABLE 1. Data sets collected from public GDSC database.
Drug–Target Information
There are 54 common drugs between DrugBank (Wishart et al., 2018) and GDSC data set. The drug target information was derived from DrugBank database; and 24 out of the 54 drugs were selected for this study, whose target genes are on the 46 signaling pathways (see Table 2).

TABLE 2. Twenty-four drugs used in the proposed model.
Kyoto Encyclopedia of Genes and Genomes (KEGG) Signaling Pathways
In the KEGG signaling database, 46 signaling pathways were collected (the 45 pathways named with signaling pathways plus the cell cycle pathway). These signaling pathways were MAPK, FoxO, TGF-beta, ErbB, VEGF, Ras, Rap1, p53, Hippo, TNF, mTOR, PI3K-Akt, estrogen, NF-kappa B, notch, JAK-STAT, Wnt, hedgehog, HIF-1, T-cell receptor, adipocytokine, sphingolipid, B-cell receptor, oxytocin, phospholipase D, apelin, Fc epsilon RI, glucagon, relaxin, calcium, toll-like receptor, neurotrophin, AGE-RAGE, cGMP-PKG, NOD-like receptor, insulin, cell cycle, cAMP, AMPK, RIG-I–like receptor, GnRH chemokine, C-type lectin receptor, prolactin, IL-17, and thyroid hormone. There were 929 genes that had both gene expression and copy number variation data in these 46 signaling pathways.
The ConsDeepSignaling Model
Figure 1 illustrated the overview architecture of the consDeepSignaling model. We denote the input layer node vector with by
and then we use matrix
Similarly, the pathway layer is denoted by
From the pathway layer to the output layer, all of the layers are fully connected to obtain a scalar with a value which is our prediction
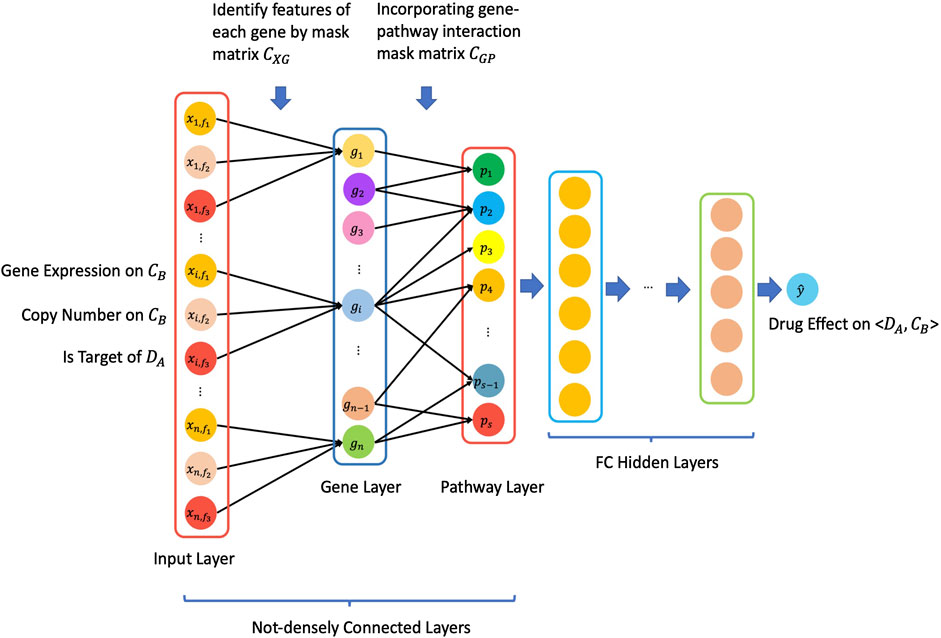
FIGURE 1. Schematic architecture of the proposed consDeepSignaling model.
For this specific study, in the “input layer,” there were 3 input features, that is, gene expression (rnaseq_fpkm), copy number (cnv_gistic), and is_target_of_Drug (0: this gene is not a target of a drug; 1: this gene is a target of a drug), for each of 929 genes on cancer cell lines. Therefore, we have
Experiment Results
To evaluate the performance of the proposed consDeepSignaling model, the drug responses of 24 drugs on the 791 cancer cell lines collected data from the GDSC database were used. For all of the following models, we leveraged five-fold cross-validation. In the 1st to 4th splits of training and test data sets, it contained 13,409 and 3,352 points, respectively, and in the 5th split of training and test data set, it contained 13,408 and 3,353 points. For the proposed model, to avoid oscillation, we used varying learning rate schedule to adjust the learning rate in different stages of epoch: for 1–30, 31–40, 41–50, 51–70, and 71–100 epochs, the learning rates

FIGURE 2. Average MSE loss (upper panel) and Pearson correlation coefficients (bottom panel) on the 5 training and testing data sets of four models.
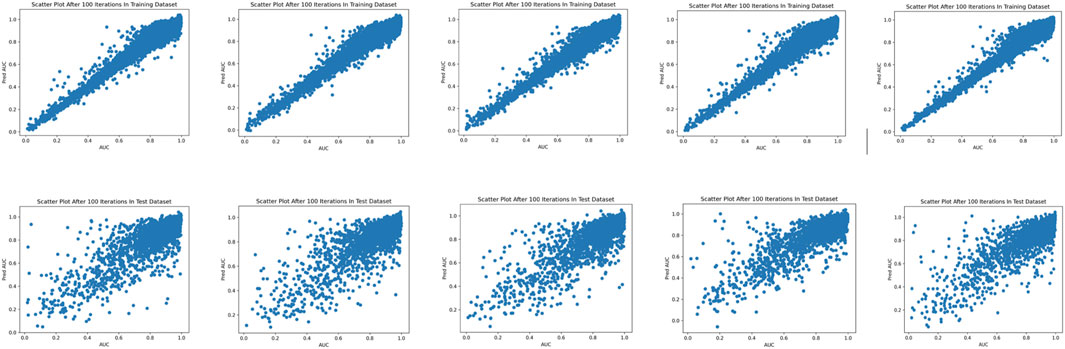
FIGURE 3. Scatterplots of the predicted and experimental drug response scores on the five-fold training (upper panel) and test (bottom panel) data sets.
We further compared the proposed model with the deep neural network (DNN) model. The input layer still contained the same information as the proposed model. For 1st and 2nd hidden layers, we set 256 nodes in each layer, and we used fully connected layers with LeakyReLU as activation functions by setting the parameter
To understand the predictive importance of individual signaling pathways and drug response, the “SmoothGrad” model in the “iNNvestigate” package was employed to interpret the deep learning model at the signaling pathway layer. Figure 4 showed the importance score distributions of individual signaling pathways of all the samples, by pooling the importance scores of individual signaling pathways in all samples in the 5 testing data sets. The important distributions were a global analysis of the signaling pathways using all the samples. As seen, compared with other signaling pathways, the ErbB, Ras, Calcium, FoxO, mTOR, Wnt, hedgehog, NOD-like receptor, T-cell receptor, Fc epsilon RI, neurotrophin, insulin, prolactin, and cell cycle signaling pathways have much larger range of importance scores, which indicated the importance of these signaling pathways in anticancer drug response prediction.
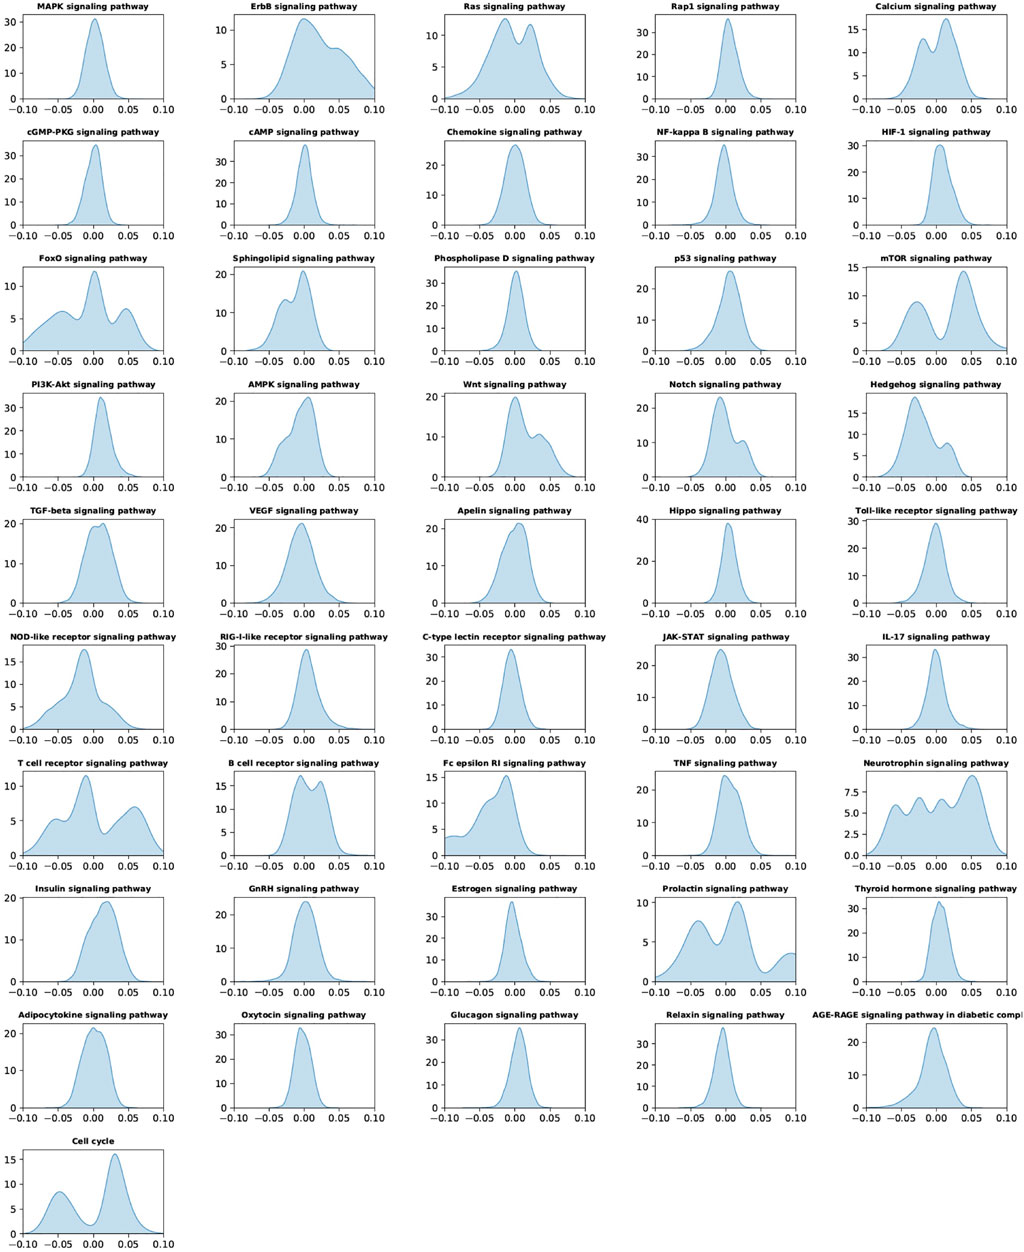
FIGURE 4. Importance of score distribution patterns of the 46 signaling pathways in all samples by pooling all the testing data sets of the five-fold cross-validation.
Discussion and Conclusion
Large-scale and high-dimensional multiomics data, like gene expression, copy number variation, methylation, genetic mutation, and microRNA, of individual cancer patients and >1,000 cancer cell lines have been generated, which provide the basis to fully understand the molecular mechanisms of tumor heterogeneity and diversity, as well as the heterogeneous response to anticancer drugs. It also enables precision medicine or personalized medicine selects the right and optimal treatments for individual patients based on their omics profiles and biomarkers. A few databases have been generated and publicly available to access these valuable data resources, like CCLE (Barretina et al., 2012; Wang et al., 2019), and GDSC (Garnett et al., 2012; Yang et al., 2013).
Though the machine learning– and deep learning–based association studies have been reported to identify potential biomarkers correlating with distinct drug response, it remains challenging to integrate the large-scale and high-dimensional data features in a biologically meaningful manner and to further decode and uncover the mysterious molecular mechanisms of drug response for the purpose of precision medicine. In this study, we proposed a novel deep learning model–constrained integrating gene expression and copy number data constrained by signaling pathways, consDeep signaling, to model the pathway activity and their capacity to predict the drug response. The advantages of the consDeepSignaling are 1) it used a small set of genes and modeled the gene activity using multiomics data; 2) it used only 46 signaling pathways to predict the drug response, which has a smaller number of parameters than the existing DNN models; 3) the model was more interpretable; and 4) the model interpretation analysis was conducted to identify the potentially important signaling pathways to inhibit the tumor growth. The evaluation and comparison results indicated that the proposed model outperformed the existing models.
It is an exploratory study to integrate biologically meaningful signaling pathways with the deep learning for anticancer drug response on the 791 cancer cell lines. There are some limitations to be further investigated. For example, though it might be challenging, further functional analysis on the important signaling pathways of individual cancer cell lines might be able to identify the specific cancer cell line–specific dysfunctional targets that are responsible for drug response. Also, in addition to the signaling pathways, more biological processes (BPs), for example, the gene ontologies (GOs) (Ashburner et al., 2000) should be considered. Then, more drugs whose targets are not on the 46 signaling pathways could be included. Moreover, the graph neural network (GNN) model might be able to model the signaling cascades directly to identify the unknown molecular mechanisms (in terms of signaling network modules) that are responsible for the drug response. We will investigate these challenges in future work. In the analysis, it is assumed that drugs with the same targets should have similar effects. The status of target genes will be decided (learned by the model) by the gene expression, copy number, and if it is a drug target (not drug-specific). Then, the status of the target genes will affect (parameters to be learned by the model) the pathway activities to influence the drug response prediction. It is interesting to study the drug-specific effects on the target genes. Moreover, different drugs and cell lines could have drug- and cell-specific signaling pathways that are informative for the drug response prediction. Thus, it is interesting and important to investigate the drug- and cell-specific pathway activity as well as identify the potentially important genes that can affect the activity of individual signaling pathways. As seen in the results, a larger difference in performance between the training and test sets in the proposed model, than other models, indicated the overfitting on the training data sets. We will systematically evaluate some widely used techniques to reduce the overfitting problem, for example, early stopping, adding noise to the input data, and adding a penalty term to control the nonzero parameters.
Data Availability Statement
Publicly available data sets were analyzed in this study. This data can be found here: The drug response data can be found at the GDSC database: https://www.cancerrxgene.org. The multiomics data of cancer cell lines can be found at the CCLE database: https://portals.broadinstitute.org/ccle. The signaling pathway information can be found at the KEGG signaling pathway database: https://www.genome.jp/kegg/pathway.html. The drug-target information can be found at the drugBank database: https://go.drugbank.com/.
Author Contributions
HZ and FL conducted the data analysis and manuscript preparation. FL and YC supervised the project, the model development, and revised the manuscript.
Funding
This study was partially supported by the Children’s Discovery Institute (CDI) M-II-2019-802 to Li.
Conflict of Interest
The authors declare that the research was conducted in the absence of any commercial or financial relationships that could be construed as a potential conflict of interest.
Supplementary Material
The Supplementary Material for this article can be found online at: https://www.frontiersin.org/articles/10.3389/fbinf.2021.639349/full#supplementary-material
References
Alber, M., Lapuschkin, S., Seegerer, P., Hägele, M., Schütt, K. T., Montavon, G., et al. (2018). iNNvestigate neural networks!. ArXiv.
Ashburner, M., Ball, C. A., Botstein, D., Botstein, D., Butler, H., Michael Cherry, J., et al. Gene Ontology Consortium (2000). Gene Ontology: tool for the unification of biology NIH public access author manuscript. Nat. Genet. 25 (1), 25–29. doi:10.1038/75556
Barretina, J., Caponigro, G., Stransky, N., Venkatesan, K., Margolin, A. A., Kim, S., et al. (2012). The Cancer Cell Line Encyclopedia enables predictive modelling of anticancer drug sensitivity. Nature 483 (7391), 603–607. doi:10.1038/nature11003
Deng, L., Cai, Y., Zhang, W., Yang, W., Gao, B., and Liu, H. (2020). Pathway-guided deep neural network toward interpretable and predictive modeling of drug sensitivity. J. Chem. Inf. Model. 60 (10), 4497–4505. doi:10.1021/acs.jcim.0c00331
Feng, J., Zhang, H., and Li, F. (2020). Investigate the relevance of major signaling pathways in cancer survival using a biologically meaningful deep learning model. Biorxiv.
Garnett, M. J., Edelman, E. J., Heidorn, S. J., Greenman, C. D., Dastur, A., Lau, K. W., et al. (2012). Systematic identification of genomic markers of drug sensitivity in cancer cells. Nature 483 (7391), 570–575. doi:10.1038/nature11005
Goldman, M., Craft, B., Brooks, A. N., and Jingchun Zhu, D. H. (2018). The UCSC Xena Platform for cancer genomics data visualization and interpretation. Biorxiv.
Hao, J., Kim, Y., Kim, T.-K., and Kang, M. (2018). PASNet: pathway-associated sparse deep neural network for prognosis prediction from high-throughput data. BMC Bioinformatics 19 (1), 1–13. doi:10.1186/s12859-018-2500-z
Holbeck, S. L., Camalier, R., Crowell, J. A., Govindharajulu, J. P., Hollingshead, M., Anderson, L. W., et al. (2017). The National Cancer Institute ALMANAC: a comprehensive screening resource for the detection of anticancer drug pairs with enhanced therapeutic activity. Cancer Res. 77 (13), 3564–3576. doi:10.1158/0008-5472.CAN-17-0489
Kanehisa, M., and Goto, S. (2000). KEGG: kyoto encyclopedia of genes and genomes. Nucleic Acids Res. 28, 27–30. doi:10.1093/nar/28.1.27
Kong, J., Lee, H., Kim, D., Han, S. K., Ha, D., Shin, K., et al. (2020). Network-based machine learning in colorectal and bladder organoid models predicts anti-cancer drug efficacy in patients. Nat. Commun. 11 (1), 1–13. doi:10.1038/s41467-020-19313-8
Kuenzi, B. M., Park, J., Fong, S. H., Sanchez, K. S., Lee, J., Kreisberg, J. F., et al. (2020). Predicting drug response and synergy using a deep learning model of human cancer cells. Cancer Cell 38 (5), 672–684. doi:10.1016/j.ccell.2020.09.014
Li, M., Wang, Y., Zheng, R., Shi, X., li, y., Wu, F., et al. (2019). DeepDSC: a deep learning method to predict drug sensitivity of cancer cell lines. Ieee/acm Trans. Comput. Biol. Bioinf. [Epub ahead of print]. doi:10.1109/TCBB.2019.2919581
Ogata, H., Goto, S., Sato, K., Fujibuchi, W., Bono, H., and Kanehisa, M. (1999). KEGG: kyoto encyclopedia of genes and genomes. Nucleic Acids Res. 27, 29. doi:10.1093/nar/27.1.29
Preuer, K., Lewis, R. P. I., Hochreiter, S., Bender, A., Bulusu, K. C., and Klambauer, G. (2018). DeepSynergy: predicting anti-cancer drug synergy with deep learning. Bioinformatics 34, 1538. doi:10.1093/bioinformatics/btx806
Sakellaropoulos, T., Vougas, K., Narang, S., Koinis, F., Kotsinas, A., Polyzos, A., et al. (2019). A deep learning framework for predicting response to therapy in cancer. Cell. Rep. 29 (11), 3367–3373. doi:10.1016/j.celrep.2019.11.017
Sanchez-Vega, F., Mina, M., Armenia, J., Chatila, W. K., Luna, A., La, K. C., et al. (2018). Oncogenic signaling pathways in the cancer genome atlas. Cell 173 (2), 321–e10. doi:10.1016/j.cell.2018.03.035
Sheng, J., Li, F., and Wong, S. T. C. (2015). Optimal drug prediction from personal genomics profiles. IEEE J. Biomed. Health Inform. 19 (4), 1264–1270. doi:10.1109/JBHI.2015.2412522
Smilkov, D., Thorat, N., Kim, B., Viégas, F., and Wattenberg, M. (2017). SmoothGrad: removing noise by adding noise, arXiv:1706.03825.
Suphavilai, C., Bertrand, D., and Nagarajan, N. (2018). Predicting cancer drug response using a recommender system. Bioinformatics 34 (22), 3907–3914. doi:10.1093/bioinformatics/bty452
Wang, S., Huang, E., Cairns, J., Peng, J., Wang, L., and Sinha, S. (2019). Identification of pathways associated with chemosensitivity through network embedding. PLOS Comput. Biol. 15 (3), e1006864. doi:10.1371/journal.pcbi.1006864
Wang, Y., Fang, J., and Chen, S. (2016). Inferences of drug responses in cancer cells from cancer genomic features and compound chemical and therapeutic properties. Sci. Rep. 6 (1), 32679. doi:10.1038/srep32679
Wishart, D. S., Feunang, Y. D., Guo, A. C., Lo, E. J., Marcu, A., Grant, J. R., et al. (2018). DrugBank 5.0: a major update to the DrugBank database for 2018. Nucleic Acids Res. 46 (D1), D1074–D1082. doi:10.1093/nar/gkx1037
Yang, W., Soares, J., Greninger, P., Edelman, E. J., Lightfoot, H., Forbes, S., et al. (2013). Genomics of Drug Sensitivity in Cancer (GDSC): a resource for therapeutic biomarker discovery in cancer cells. Nucleic Acids Res. 41 (D1), D955–D961. doi:10.1093/nar/gks1111
Yu, M. K., Ma, J., Fisher, J., Kreisberg, J. F., Raphael, B. J., and Ideker, T. (2018). Visible machine learning for biomedicine. Cell 173 (7), 1562–1565. doi:10.1016/j.cell.2018.05.056
Zhang, H., Feng, J., Zeng, A., Payne, P., and Li, F. (2020). Predicting tumor cell response to synergistic drug combinations using a novel simplified deep learning model. AMIA 2020 Annu. Symp. [Epub ahead of print]. doi:10.1101/2020.04.10.036491
Zhang, N., Wang, H., Fang, Y., Wang, J., Zheng, X., and Liu, X. S. (2015). Predicting anticancer drug responses using a dual-layer integrated cell line-drug network model. Plos Comput. Biol. 11 (9), e1004498. doi:10.1371/journal.pcbi.1004498
Keywords: precision medicine, mechanism of response, cancer, artificial intelligence, deep learning, drug response prediction, signaling pathways
Citation: Zhang H, Chen Y and Li F (2021) Predicting Anticancer Drug Response With Deep Learning Constrained by Signaling Pathways. Front. Bioinform. 1:639349. doi: 10.3389/fbinf.2021.639349
Received: 19 January 2021; Accepted: 25 March 2021;
Published: 29 April 2021.
Edited by:
Tatsuya Akutsu, Kyoto University, JapanReviewed by:
Chloe-Agathe Azencott, Mines ParisTech, FranceGeoffrey Siwo, University of Notre Dame, United States
Copyright © 2021 Zhang, Chen and Li. This is an open-access article distributed under the terms of the Creative Commons Attribution License (CC BY). The use, distribution or reproduction in other forums is permitted, provided the original author(s) and the copyright owner(s) are credited and that the original publication in this journal is cited, in accordance with accepted academic practice. No use, distribution or reproduction is permitted which does not comply with these terms.
*Correspondence: Heming Zhang, aGVtaW5nemhhbmdAd3VzdGwuZWR1; Yixin Chen, Y2hlbkBjc2Uud3VzdGwuZWR1; Fuhai Li, RnVoYWkuTGlAd3VzdGwuZWR1