 Artoghrul Alishbayli
 Noah J. Schlegel
 Bernhard Englitz
94% of researchers rate our articles as excellent or good
Learn more about the work of our research integrity team to safeguard the quality of each article we publish.
Find out more
ORIGINAL RESEARCH article
Front. Audiol. Otol., 19 September 2023
Sec. Technology and Innovation in Auditory Implants and Hearing Aids
Volume 1 - 2023 | https://doi.org/10.3389/fauot.2023.1226946
This article is part of the Research TopicTrends in Digital Hearing Health and Computational AudiologyView all 12 articles
Introduction: Human communication often occurs under adverse acoustical conditions, where speech signals mix with interfering background noise. A substantial fraction of interfering noise can be characterized by a limited set of statistics and has been referred to as auditory textures. Recent research in neuroscience has demonstrated that humans and animals utilize these statistics for recognizing, classifying, and suppressing textural sounds.
Methods: Here, we propose a fast, domain-free noise suppression method exploiting the stationarity and spectral similarity of sound sources that make up sound textures, termed Statistical Sound Filtering (SSF). SSF represents a library of spectrotemporal features of the background noise and then compares this against instants in speech-noise-mixtures to subtract contributions that are statistically consistent with the interfering noise.
Results: We evaluated the performance of SSF using multiple quality measures and human listeners on the standard TIMIT corpus of speech utterances. SSF improved the sound quality across all performance metrics, capturing different aspects of the sound. Additionally, human participants reported reduced background noise levels as a result of filtering, without any significant damage to speech quality. SSF executes rapidly (~100× real-time) and can be retrained rapidly and continuously in changing acoustic contexts.
Discussion: SSF is able to exploit unique aspects of textural noise and therefore, can be integrated into hearing aids where power-efficient, fast, and adaptive training and execution are critical.
- Acoustic textures are defined by time-independent statistics and occur frequently.
- Learning a library of spectrotemporal features rapidly filters out acoustic textures.
- Filtering suppresses background noises across different auditory textures.
- Human and automatic performance evaluation demonstrate suppression.
- Filtering is fast and can thus be integrated into mobile devices and hearing aids.
Auditory signals rarely arrive at the ear in pure and unambiguous form but are usually mixed with other competing sounds. Masking of relevant information by irrelevant noise is not unique to the auditory system: occlusion of surfaces in a complex visual scene poses an analogous signal processing problem that requires disambiguation and segregation of sources (Handel, 2006; Minaee et al., 2022). However, unlike in the visual domain, in the auditory domain, the noise is superimposed onto the signal which creates an ill-posed source separation problem for the auditory system (McDermott, 2009). During the course of evolution, the auditory system evolved an impressive ability to extract relevant information from complex scenes with multiple interfering sources, an effect known as the cocktail party effect (Middlebrooks et al., 2017). Although the specific neural mechanisms responsible for this ability remain poorly understood, extensive research has documented the processes through which the auditory system of an organism responds to the noise in complex auditory scenes. These processes include segregation by fundamental frequency, dip listening, better-ear listening, binaural unmasking, etc. (see Culling and Stone, 2017 for an overview).
However, what is achieved seamlessly by a normally functioning system, becomes a challenge with hearing loss (Koole et al., 2016). To address the issue, various noise reduction approaches have been developed over the past few decades (Loizou, 2013b; Henry et al., 2021). They vary in multiple dimensions: some of the methods use real-time data (Braun et al., 2021) collected using a single channel microphone (Huang and Benesty, 2012; Lee and Theunissen, 2015), while others are used in post-processing and utilize multiple recording channels (Tzirakis et al., 2021), which can provide extra spatial cues that can aid in solving the problem. While noise reduction approaches typically do not improve speech intelligibility itself, the subjective listening experience does improve with indications of less cognitive load for normal hearing persons (Sarampalis et al., 2009) and reduced listening effort for less distorted speech in people with hearing loss (Fiedler et al., 2021). Classically, noise reduction algorithms use signal processing methods, but recent developments in the field have led to increased use of machine learning techniques that allow more flexibility in terms of target selection and enhancement in more complex, non-stationary background noise conditions because they make fewer assumptions about the nature of noise.
Sounds with relatively constant statistical features over time have been categorized as acoustic textures, for example, the sound of rain, fire, or flocks of birds (McDermott and Simoncelli, 2011). Most auditory textures are physically generated by the superposition of a limited range of constituent sounds, which occur independently or with limited statistical dependencies between the constituent sounds. Previous research has shown that humans can recognize and differentiate acoustic textures on the basis of their statistics (McDermott and Simoncelli, 2011; McDermott et al., 2013). However, previous approaches in noise reduction have not made use of this inherent structure of acoustic textures, despite their frequent role as background sounds during every-day audition.
In this study, we propose a noise reduction method that utilizes these inherent statistical regularities to attenuate background sounds and thus improve the signal-to-noise ratio of embedded speech sounds. Specifically, we represent the ensemble of constituent sounds using samples of background sounds, identified around or between speech samples. Assuming an additive mixture, we then clean the speech-in-noise sample by identifying exemplars that provide the best match to the instantaneous spectrogram. This approach extends previous approaches of spectral noise subtraction (Boll, 1979) by relating it to the statistics of natural background sounds. Importantly, we do not create an explicit statistical model of the background noise, as (i) this usually requires more data to be well-constrained and (ii) the internal, statistical predictability would be too limited to remove specific instantaneous sounds randomly occurring inside the auditory textures (see Discussion for details).
Applied to the TIMIT database in the context of artificial and natural acoustic textures, the filtered result exhibited an improved representation of the speech as measured by a standard deep neural network (DNN) based speech recognition system, spectrogram correlations, and automated estimation of speech quality. Similarly, online psychoacoustic experiments on human participants also indicated an improvement in the quality of the sounds. In comparison with other machine learning approaches, our system does not require extensive training but rapidly adapts to the recent history of background noise, and runs faster-than-real-time on computational resources currently available in mobile phones. If translated to specialized processors in hearing aids, it may be feasible to run on preprocessors for hearing aids and cochlear implants.
Auditory textures used as background noise were generated using a slight modification of the “Sound Texture Synthesis Toolbox” developed by McDermott and Simoncelli (2011). The changes allowed the mixing of statistical features from different sound sources while sampling the statistical space of natural sounds in a controlled fashion. In total, we generated six different textures with different combinations of marginal (mean, variance) and correlation statistics taken from real textures (Table 1). The algorithm calculates marginal moments and/or correlations from the example sound which are then taken as target statistics for synthesis. The synthesis starts from a Gaussian white noise which is then iteratively shaped to match predetermined target statistics using the conjugate gradient method. Those statistics were transformed per frequency bin, which makes the resulting sound rather similar to the original if that sound is well-defined by the used statistics. In the case of sound textures, it has been shown that this procedure is able to produce compelling sounds that are indistinguishable from original sources in many cases (McDermott and Simoncelli, 2011). Multiple 50 s texture files were generated for each set of statistics, which was long enough for the combination with a few speech samples while still ensuring convergence of the synthesis. Figure 1A shows spectrograms of generated textures.
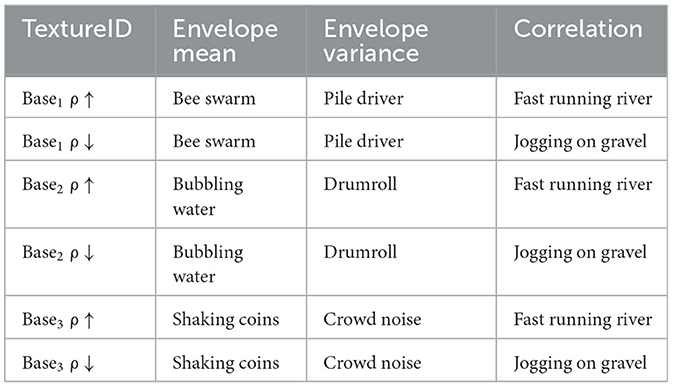
Table 1. Source sounds for artificial texture generation.
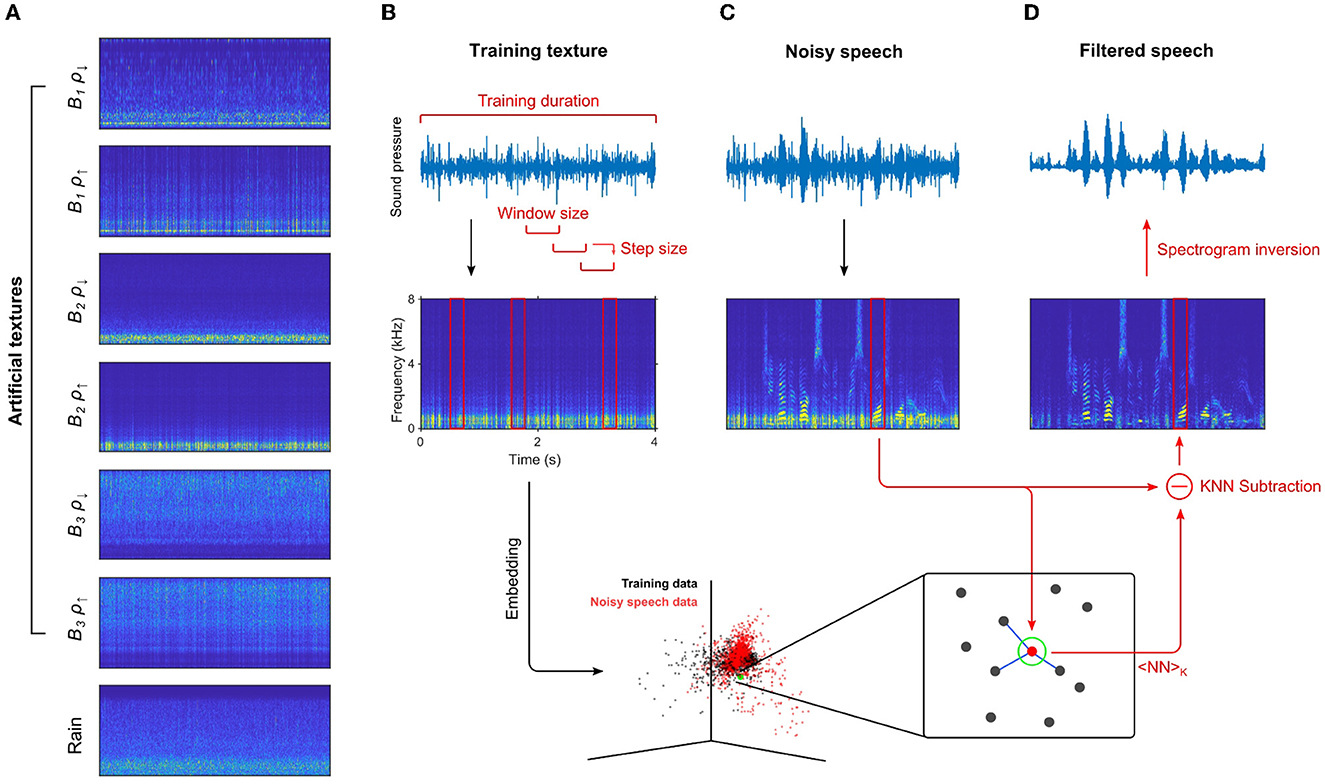
Figure 1. Speech and noise sources used and filtering principle architecture. (A) Spectrograms of artificial and natural textures used as background noise in testing of the algorithm. (B) Filter training and evaluation on noisy data. The training data (top) is converted to a spectrogram, governed by the window length, step size and window function. In the training step, short sections of the spectrogram are high-pass filtered and then embedded (bottom, black) in high-dimensional vector space (dimension: NFFT × NWindowSteps) to represent the short-term spectrotemporal statistics. (C) Samples of speech with added noise are transformed to spectrograms (top) and embedded into the same space as the training data (bottom, red). (D) Filtering of the noisy speech sample is performed by selecting a number of nearest neighbors inside the embedding for each time-instant, averaging them and subtracting them from the noisy data. A playback-capable sound pressure representation of the filtered spectrogram is then generated via spectrogram inversion using the original phases from the noisy speech sample (top).
To also test the process with a real texture, we needed a natural texture example with constant statistics and a duration of at least 90 min (the test part of TIMIT is roughly 87 min long). We chose a 3-h continuous rain recording (The Relaxed Guy, 2014) with subjectively little change over time. The first 30 s of the file were discarded to reduce the potential statistical effects of fading in, it was then downsampled to 16 kHz and saved as a WAV file.
Human speech samples used in this study were obtained from the TIMIT corpus (Garofolo et al., 1993), which contains broadband recordings of 630 speakers of eight major dialects of American English, each reading ten phonetically rich sentences. For objective testing of the algorithm, the entire test set of TIMIT was used, comprising 1,680 files. For human evaluation of the algorithm, due to overall time limitation (1h), we selected a subset of 36 unique speech files where variables such as gender (n = 2), dialect (n = 8), speaker ID (n = 33) and sentence type (n = 3) were made as diverse as possible (see below for other details on the human experiment).
For each texture type, a speech-texture mix was created with the TIMIT test set. Every speech file was mixed with an individual texture sequence after both signals were normalized to a standard deviation of 1. For testing of the algorithm, a constant SNR of 0 dB was set for the mixture, except when SNR was varied during parameter exploration. After combining, the signal was normalized to a fixed standard deviation of 0.05 to avoid clipping in the WAV files which occurs at absolute values above 1. Texture samples were drawn uniquely and continuously without overlap from the created or real texture files.
Briefly, the filtering process was a matched subtraction on the spectrogram level using a fast k-nearest neighbors (KNN) search over the training data as an estimator of the texture contribution to the sound (subtrahend), with appropriate transformations between sound pressure and spectrogram representations.
The internal representation of the filter was spectrotemporal snippets from the training data represented as vectors. For this purpose, the training data was first transformed from sound pressure to a spectrogram using the short-term Fourier transform, represented as ST(t, f) below, where T indicates the training data. As usual, this transformation is parameterized by the window size and the step size. Typical values were 16 and 2 ms, respectively, but we explore the effect of these and other parameters in Figures 2E–K. The spectrogram was high-pass filtered, by subtracting the local context, i.e., the temporal average over a bidirectional window of length TMultistep = 50 ms per frequency bin, which deemphasizes speech contributions to the instantaneous spectrum. The training data was then represented as points in a high-dimensional space, by linearizing short segments of dimension NFFT × NWindowSteps, where NWindowSteps is number of subsequent time-steps embedded, i.e.,
The resulting representation discretely approximates the distribution of the texture in the coordinates of the spectrotemporal snippets by sampling it. This representation captures the joint occurrence of different frequencies over adjacent time points in the texture. We also tried directly representing products of frequency channels, which, however, did not improve performance, while strongly increasing the runtime.
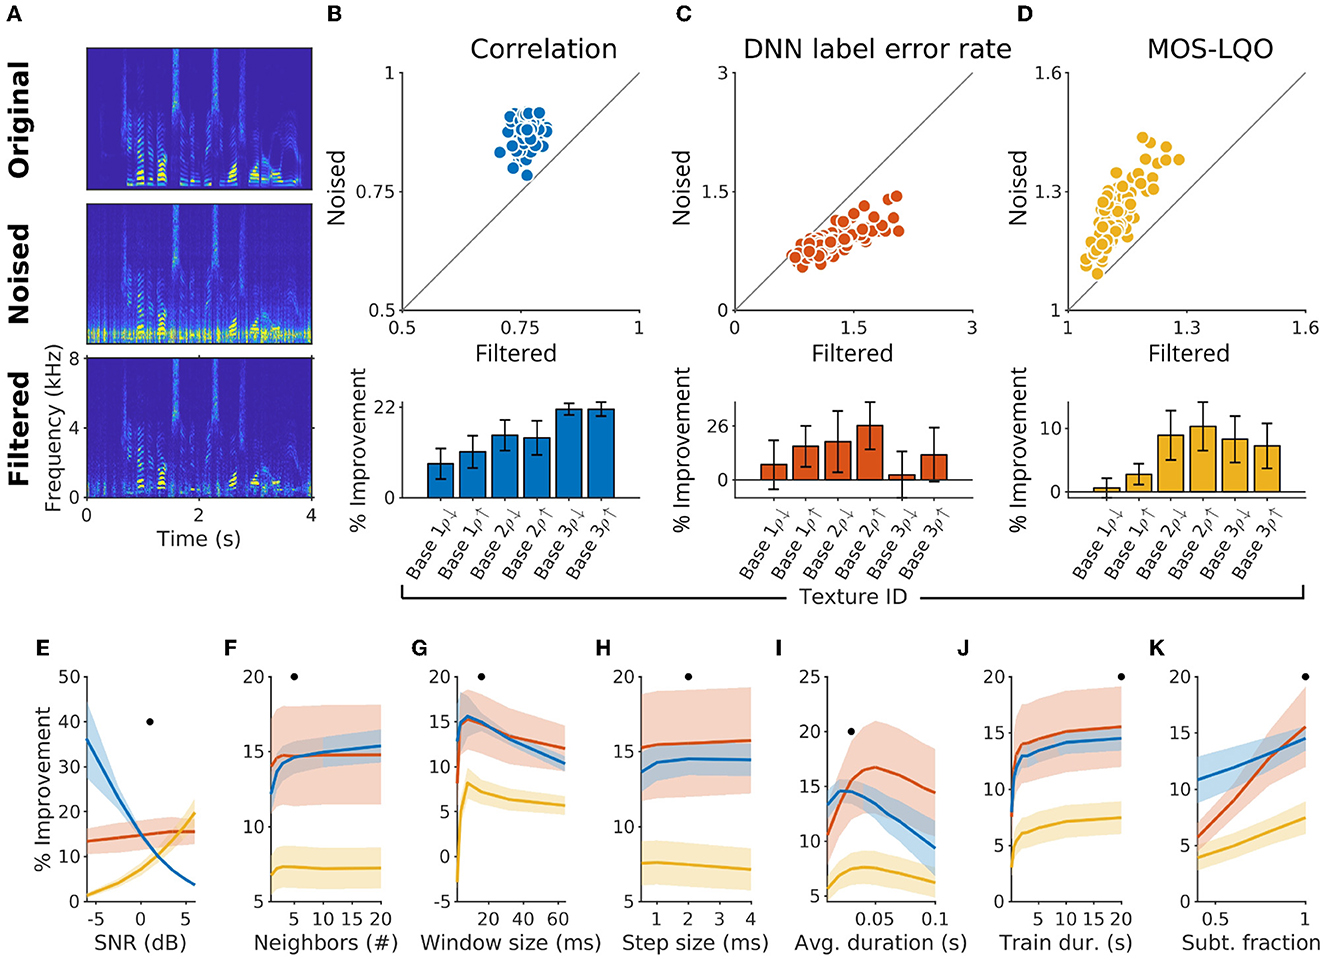
Figure 2. Performance of statistical filtering on speech in noise. (A) Sample spectrograms of original speech, speech within noise and filtered speech within noise. (B) Improvement via statistical filtering was first evaluated using pointwise correlation of the spectrograms (for Base 2 ρ↑; each dot corresponds to a sound clip; n = 1,680). In this case an average improvement of 13.9% (SD = 3.9%) was achieved, with generally positive, but varying improvements for the seven different textures used (bottom). (C) Improvement in phoneme recognition error rate using an LSTM Deep Neural Network (DNN) trained on the TIMIT corpus. Improvement here corresponds to dots below the diagonal. Absolute values of improvement were similar in magnitude as for correlation (bottom), with larger variation across the different texture types (μ = 10.1%; SD = 15.2%). (D) Improvement in mean opinion score—listening quality objective (MOS-LQO) estimated with the PESQ algorithm (μ = 6.2%; SD = 4.1). (E–K) Dependence of the improvement in speech quality on different parameters of the sounds [(E) signal-to-noise ratio and filtering algorithm, (F) number of neighbors, (G) window size for spectrogram creation, (H) step-size for moving the window, (I) local averaging duration in filtering the noisy speech signal, (J) training duration, (K) scaling of the estimated noise contribution, given as a fraction]. Overall, all measures improved across the range of tested parameters. We chose a value for each parameter as the default for the other parameters (black dot in each plot), which was also used in the subsequent figures.
The training data was provided in two different ways: either, a single textural sound of length LTrain was provided (which we refer to as “supervised”); or a speech-in-noise sample with a total amount of texture LTrain was provided (which we refer to as “unsupervised”). In the first case, the algorithm knew the training data, in the second case, we used an unsupervised method of training data extraction based on voice activity detection (VAD), similar to an earlier study (Xu et al., 2020). In this approach, we used a method called robust voice activity detection (rVAD), described in detail elsewhere (Tan et al., 2020), to detect speech-free regions of noised sound clips and use the extracted sound fragments to train the filter as described above.
After the filter had been trained, it was applied continuously to speech-in-texture mixtures. The latter were short-term Fourier-transformed using the same parameters as the training data, including the referencing to the local temporal average over the window TMultistep. For each time step, the distance of all training data samples to the current, brief spectrogram was then computed (Matlab function: KDTreeSearcher). The average of the NNeighbor closest training points was then computed as an approximation to the current noise. The resulting texture spectrogram was then subtracted from the sound mixture in the dB scale, after which the sound was reverted back to a linear scale. More specifically, the spectrogram of the current noisy speech sample SN(t, f) was embedded:
then for each time point t find
In the latter, the set of closest points of size NNeighbor was chosen, and then subtracted from the current spectrogram, i.e.,
After subtraction, the linear magnitude was transformed back into a sound pressure wave using the original phases for all frequencies (using the idgtreal function, Pruša et al., 2014). Further exploiting the stationarity, the estimated texture was limited to the 95th percentile of the marginal amplitudes of the training data. This approach reflects the temporally invariant composition of auditory textures by estimating the noise component using the known “repertoire” of sounds. Naturally, longer training data will improve this estimate, however, a near-plateau was already reached after only a few seconds of training data (see Figure 2J).
This metric is computed as the correlation of the spectrograms of the filtered or noised sounds with that of the clean speech sound: the higher the correlation to the clean speech, the better the filtering at the spectrogram level. The improvement as a result of filtering is reported as a percent increase in correlation with the clean speech [i.e., (ρfiltered – ρnoised)/ρnoised].
Another test for speech intelligibility is the performance of automatic speech recognition software. Since this is also a potential field of usage for the filtering method, this kind of performance measurement was a sensible choice. We employed a bi-directional LSTM (Graves et al., 2006) as a speech recognition neural network, which was trained on the TIMIT dataset (see Supplementary material for details). For each timestep in the spectrotemporal domain of the sound, a phoneme probability result was calculated with 62 softmax values for the 62 possible phoneme labels (including one empty/repeat label). Using the phoneme prediction logits (input of the softmax function) of a sound file's time steps, the phoneme label was predicted using a beam-search decoder. This predicted label was used to compute the LER as its mean edit distance to the true label. Improvement in DNN label error rate was computed as a percent decrease of LER in filtered sound in comparison to the LER under noisy conditions.
PESQ is a standard method for objectively measuring listening quality based on the comparison between clean reference sound and the given sound (Rix et al., 2001). In our case, comparisons to clean speech were made separately for noised speech and for filtered output of the noise reduction algorithm. The difference between the two scores obtained this way is interpreted as an objective estimate of the improvement in speech quality. In this study, we used a MATLAB wrapper function pesq_mex_vec.m provided with Sound Zone Tools (Donley, 2022), and a wideband version of the algorithm which maps raw PESQ score to MOS-LQO score for wideband sounds (ITU-T, 2007).
To compare our method with an existing method we used the EM algorithm also commonly referred to as Minimum Mean Square Error-Short-Time Spectral Amplitude (MMSE-STSA) method which is a standard algorithm for single microphone noise reduction (Ephraim and Malah, 1985). It operates on short overlapping frames of the input signal in the frequency domain. By estimating the statistical properties of speech and noise, the algorithm computes a gain function that minimizes the mean square error between the estimated clean speech and the observed noisy signal. The gain function is determined based on the estimated speech presence probability in each frequency bin. The “ssubmmse.m” MATLAB routine from the VOICEBOX package (Brookes, 2002) was employed as the implementation of this algorithm. The default values were used for all user-specific parameters of the EM algorithm. See Table 2 for the full list of external software packages used in this study.
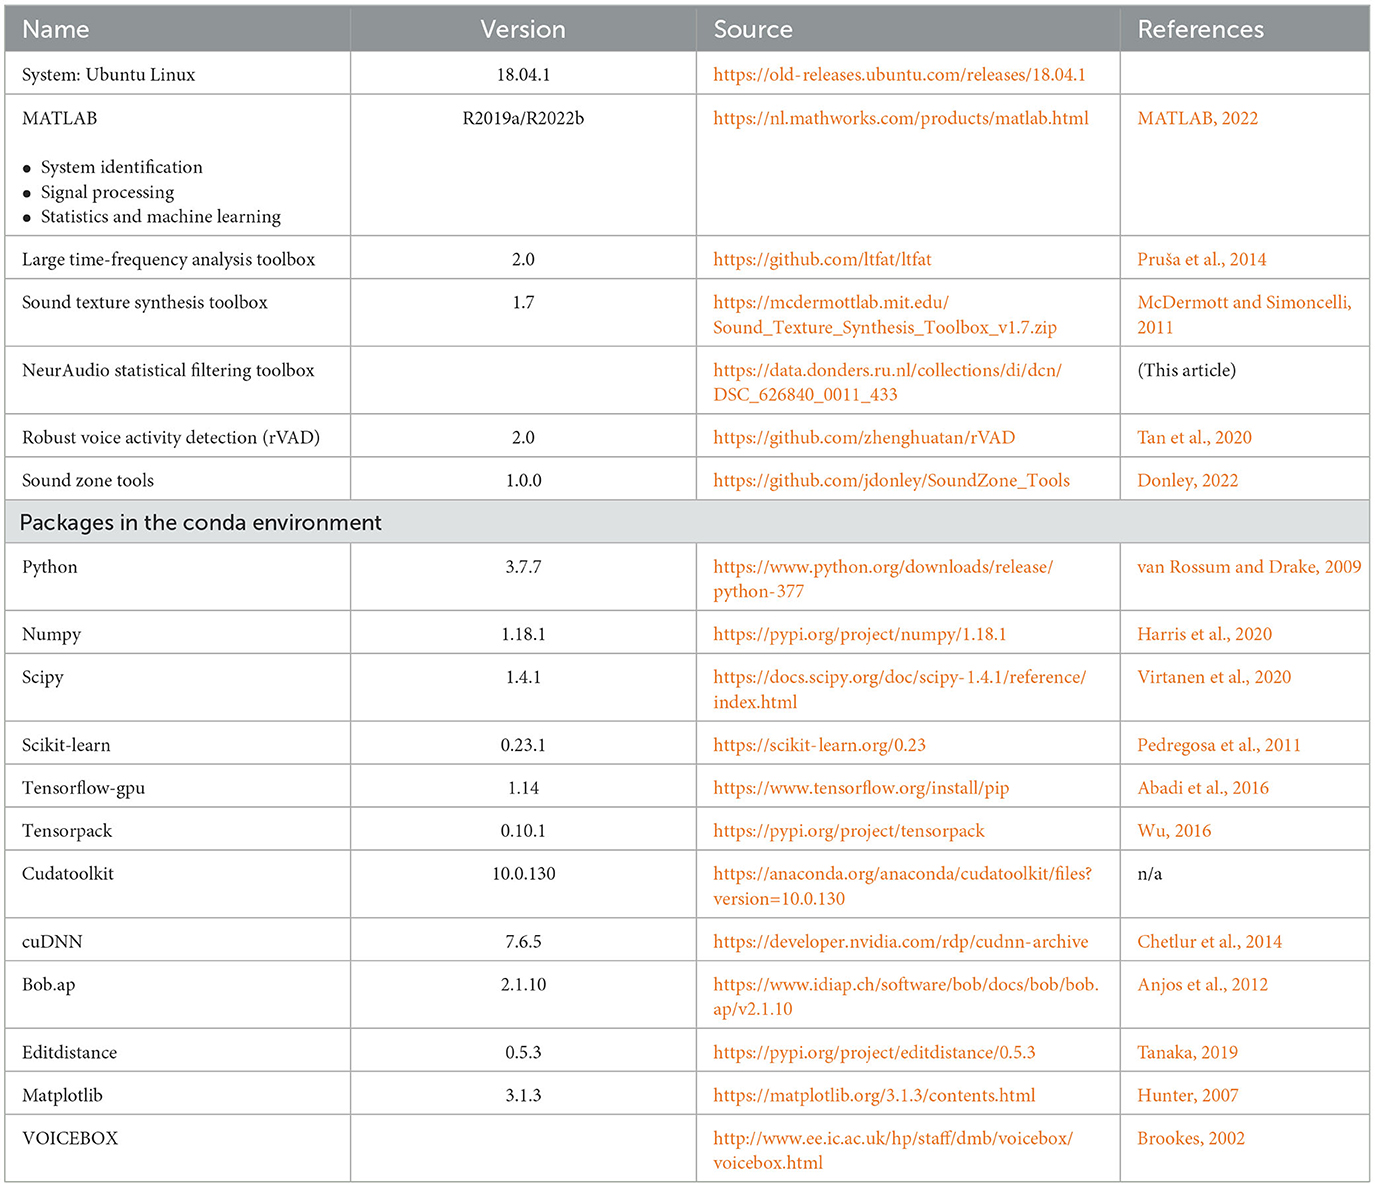
Table 2. External software.
In order to evaluate the speed at which the algorithm can be run, we used a Desktop PC (AMD Threadripper 2920X, 12 cores) running the algorithm on 100 speech samples randomly selected from TIMIT dataset mixed with all seven texture types. To quantify the speed, the average time spent on running the processing of a single frame was divided by the step size (default value = 2 ms) to obtain a real-time factor. The average time spent on a single frame is estimated by estimating the time it takes to filter a given speech sample divided by the number of frames in the spectrogram, which is determined by the window (16 ms) and step size (2 ms) parameters. Real-time factors < 1 indicate that the algorithm can run faster than real-time on our setup (see Figure 6).
To evaluate the human-perceivable change in sound quality, we performed an online experiment where we asked participants to rate speech and background components of the delivered sound. The experiment lasted on average about 1 h and 10 participants (six male, four female, average age: 33.6 y, SD = 7.6 y) took part in the study. Participants were recruited through Prolific (www.prolific.co), where we chose to recruit individuals with no hearing difficulties, hearing aids or cochlear implants, and those who spoke English as their first language. Experimental code was generated using PsychoPy3 Builder (Peirce et al., 2019) and hosted on Pavlovia (pavlovia.org). All participants gave written informed consent to take part in the experiment, which was approved by the Ethics Committee of the Faculty of Social Sciences at Radboud University Nijmegen.
To ensure that the participants using a variety of different hardware could hear the sounds in a comparable manner, and to check that they were using headphones as instructed, we started the session with a headphone screening test described in detail elsewhere (Woods et al., 2017). In this section, participants were asked to report which of the three pure tones was quietest, with one of the tones presented 180° out of phase across the stereo channels. The task is trivial with headphones but gets harder to perform without headphones due to phase cancellation. Nine out of 10 participants were able to perform this task with 100% accuracy (n trials = 12). The outlier was included in the analysis due to the similarity of the behavioral results to other participants, suggesting that this individual was still engaged in the task. Participants were financially compensated for their time once the experiment had finished; no additional motivation was provided.
Experimental trials started with the presentation of a sound clip. After the sound played, a new screen with continuous vertical scales for speech and background ratings was shown (see Figure 3A). Speech rating scale ran from 1 (distorted) to 5 (clear), while the background rating scale ran in an analogous fashion from 1 (very quiet) to 5 (very loud). The participant could report their evaluation by clicking and adjusting the indicator point on the scale with a mouse. We tested a total of 518 sound clips which included filtered and noised versions of the same speech fragments mixed with different types of background noise. The order of sound delivery was randomized to avoid direct comparison of filtered and unfiltered versions of the same speech sample.

Figure 3. Comparison of individual and combined performances of SSF and EM. Combination of SSF and EM outperforms the separate filtering runs for correlation (A), DNN label error rate (B), and MOS-LQO score (C) for all textures and speech samples used in this study (n = 7 textures; n = 1,680 speech samples). Bar plots represent the mean performance for each filtering condition across all textures and speech samples (n = 11,760) and all differences between these means were highly significant (p < ϵ), except for the DNN label error rate difference between SSF and EM (p < 0.01). Error bars here represent the SD, as SEMs are visually indistinguishable from 0 (due to the high number of speech samples).
We designed and implemented a fast noise-filtering algorithm (Statistical Sound Filter) SSF focussed on textural stimuli, characterized by time-independent statistics, and evaluated its performance on the TIMIT speech dataset corrupted by a set of semi-natural and natural background noises (Figure 1). Evaluation included both automated and human assessments of speech quality as well as an evaluation of SSF's run-time as a function of its various parameters.
A large fraction of naturally occurring background sounds can be characterized as acoustic textures, i.e., they are a composite of basic sounds whose temporal occurrence is only constrained statistically, with the additional limitation that these statistics are stationary/time-invariant (Figure 1A). Examples of auditory textures include the sounds of wind, waves, rain, fire, insect swarms, flocks of birds, and essentially all sounds where many similar entities produce similar sounds. We developed a noise filter that specifically approaches the removal of these auditory textures from target/foreground sounds, termed Statistical Sounds Filter (SSF). SSF is first trained on a section of acoustic texture (see Figure 4 for training on mixed speech-texture sounds), by assembling a library of spectrotemporal sounds from the training data. This includes both individual and composite occurrences of the constituent sounds (Figure 1B, top and bottom). SSF is then applied to speech embedded on a different realization/sample of the texture (Figure 1C), which would occur after the training data in real life. SSF then matches the feature library against a preprocessed version of the speech-in-noise sample for all time points, subtracts out the best match, and then recreates the filtered sound using the original phases (Figure 1D). The resulting sounds exhibit substantially and significantly reduced background noises and thus separation of the target sound, e.g., speech in the present testing.
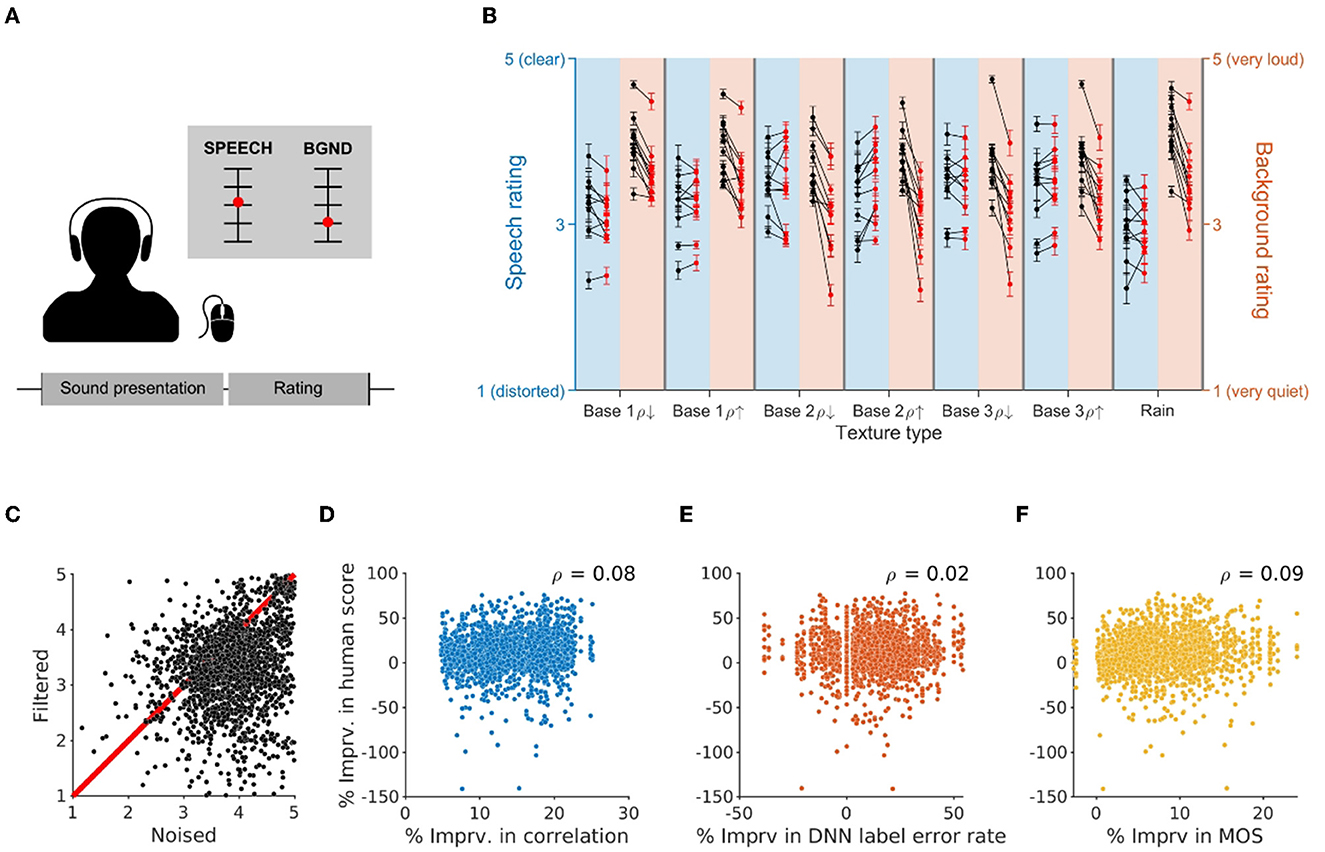
Figure 4. Human evaluation of filtering performance. (A) Experimental setup of the human experiment. At every trial, participants were asked to rate the speech and background components after the sound clip was delivered through headphones. The speech was rated on a scale from 1 (distorted) to 5 (clear), while the background was rated on a scale from 1 (very quiet) to 5 (very loud). (B) Evaluation of speech (blue) and background (orange) components of the presented sounds across different background noise conditions. Black dots represent mean ratings for noised sounds, while red dots stand for mean ratings for filtered sounds. Each line connecting the dots corresponds to an individual participant (n = 10). While speech ratings do not show any systematic change as a result of filtering, background ratings decrease, indicating consistent removal of background noise. (C) Background ratings provided for filtered and noised versions of the same sound clips, pooled across participants. Each dot represents two ratings provided in two separate, non-consecutive trials (n = 2,010 pairs). (D–F) Comparison of filtering-related change in human evaluation with the change in objective measures—correlation (D), DNN label error rate (E), and MOS (F)—reveals a very small correlation between objective and subjective evaluation metrics, suggesting that human evaluation used in this study reflects features that are not captured by these objective measures.
To evaluate the performance of SSF we generated an array of artificial textures based on real-world sound textures (Figure 1A). These textures provided the benefit of being based on real sounds while at the same time allowing us to manipulate the background sound statistics parametrically to evaluate the influence on SSF's performance. The generated textures varied in their marginal and across-frequency correlation statistics and covered a large range of values in the respective parameter spaces, both spectrally and temporally (see Methods for details). We also included a natural texture (sound of rain) to exclude that the SSF's performance is limited to the peculiarities of artificially synthesized textures.
Initial testing was carried out on a set of parameters that allowed relatively fast and effective filtering of the background noise (Figure 2A). For this example run, SNR = 0 dB was used for mixing speech and noise. The performance was then quantified using three measures, (i) the spectrogram correlation, (ii) the label error rate of a DNN, and (iii) the MOS-LQO score.
The correlation coefficient was computed by taking a pointwise correlation between the spectrogram of the original (clean) sound clip and that of filtered (or noised) versions of the same speech fragment (Figure 2B). Across all speech and noise combinations, SSF achieved an average of 13.9% (SD = 3.9%, p < 0.001, Wilcoxon rank sum test) improvement in correlation metric. Statistical comparisons were carried out across the different texture types (N = 7) between speech-in-noise and filtered averages. Within texture type, almost all showed highly significant improvements (Table 3), which is unsurprising given the large number of samples tested (N = 11,760 total samples).
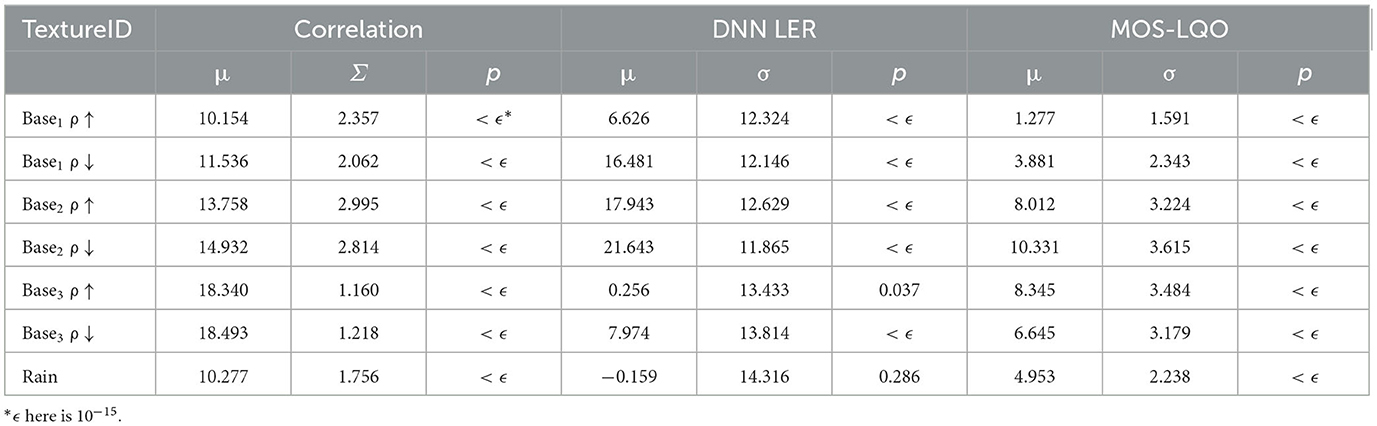
Table 3. Summary of improvement in objective evaluation metrics per texture for default parameters.
To evaluate the change in speech intelligibility automatically, we utilized a DNN-based phoneme recognition system trained on the TIMIT dataset (see Methods) and quantified the relative labeling error rate before and after filtering (Figure 2C, μ = 10.1%; SD = 15.2%, p = 0.011).
Lastly, we used a commonly used wideband PESQ algorithm to evaluate the speech quality and reported the results by transforming the raw PESQ score to mean opinion score—listening quality, as described in ITU-T P.862.1 (ITU-T, 2003) (Figure 2D, μ = 6.2%; SD = 4.1%, p = 0.007).
Next, we varied the main parameters of the algorithm to understand how each affects the performance, as measured by the above metrics. While for most parameters the performance changed in a comparable manner across different metrics (Figures 2F–K), varying the signal-to-noise ratio (SNR) affected our metrics in a clearly divergent manner (Figure 2E). At very low SNRs, our algorithm does not significantly improve the objective listening quality, but it is able to effectively improve the spectral representation of the speech as measured by pointwise correlations. Such divergent effects of SNR on the present performance metrics highlight the need for evaluation using multiple metrics that quantify separate aspects of the sound.
To determine if our method leverages a unique statistical aspect of the background noise, we compared its performance with an established method that uses the mean-square error short-time spectral amplitude (MMSE-STSA) estimator for enhancing noisy speech (Ephraim and Malah, 1985). The MMSE-STSA method uses a statistical model of the speech and noise spectra, and computes the gain function that minimizes the mean-square error between the estimated and true spectral amplitudes. Although the EM outperforms SSF when used alone at the SNR used in this filtering run (0 dB), combining it with our method (SSF → EM) significantly enhances performance across all metrics (Figures 3A–C). Since SSF has a fast processing time (as shown below), our results suggest that our method can effectively complement other standard methods to further reduce noise without adding excessive computational overhead.
To get a more explicit evaluation of human-perceivable improvement as a result of our filtering algorithm we ran an online experiment with human participants (n = 10). Given the time limitation that comes with human experiments, we selected a representative subset of speech fragments from the TIMIT corpus with balanced features such as speaker gender, identity, dialect, and sentence type (Garofolo et al., 1993), and mixed the selected speech fragments with the aforementioned texture types (see Methods). At each trial, the participant was asked to rate speech and background components of the sound using separate linear scales running from 1 to 5 (Figure 4A). For the speech component, participants rated the quality of sound clips on a continuous scale from distorted (1) to clear (5). For background evaluation, participants reported their judgments on a scale from very quiet (1) to very loud (5).
Comparing individual ratings divided across texture types, we observed no significant change in speech ratings as a result of our filtering procedure (μ = −6.02%, SD = 7.35%, p = 0.32, Wilcoxon rank sum test, n = 7 filtered/noised pairs; Figure 4B). The ratings were also not significantly different for most texture types when the ratings were analyzed separately for each texture (Table 4). However, participants perceived the background component as consistently less loud after filtering (μ = −15.8%, SD = 3.47%, p < 0.001, Wilcoxon rank sum test, n = 7 filtered/noised pairs; Figure 4B).
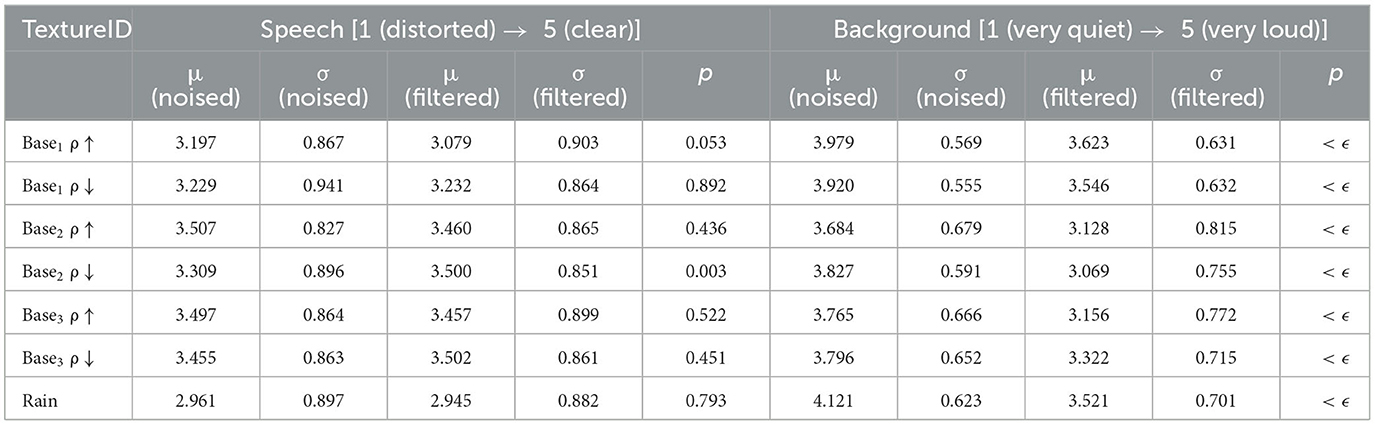
Table 4. Summary of human evaluation results for each texture type.
To better visualize the variability in background ratings, we compared the matched ratings of sound clips with the same speech and noise components (Figure 4C). An additional source of variability here likely arises from the fact that the order of trials (and hence sound clips) in our experiment was completely randomized, preventing the participants from directly comparing filtered and noised versions of the same sound clip. This was done to avoid peculiarities of a given speech sample from affecting the evaluation and to encourage independent judgment of each sound sample.
Next, we compared the human evaluation to objective metrics described in the earlier section. To do this, we tallied the percent improvement in the human judgment of the background level to those computed by pointwise correlation, DNN label error rate, and MOS-LQO (Figure 4D). Even though our algorithm on average improves all four metrics, correlation coefficients across these measures of performance were very low, confirming that they capture different features of the sound than those evaluated by the human listeners.
Above, we trained the algorithm on a single, defined section of textural sound to standardize the algorithms library across samples. However, in real-life situations, such training data is not necessarily available. To improve the range of use cases for our method, we utilized an alternative, unsupervised training method that relies on voice activity detection (VAD). Briefly, VAD detects sections of the sound where human-voiced sounds are present. Focussing on the complement, i.e., sections that likely do not contain human voice, we create a within the sample training set, which we use to train SSF (Figure 5A). Considering the fact that the effect of training duration on the performance of our algorithm plateaus very fast (Figure 2J), we hypothesized that existing VAD methods should be able to extract sufficient amounts of training data from the gaps between bouts of speech in our sound clips. Consistently, we found that even though the performance of the algorithm was slightly reduced in comparison to the supervised training, the overall pattern of the results remained similar. Correlation with the clean speech improved on average by 14.8% (SD = 4%, p < 0.001, Wilcoxon rank sum test; Figure 5B), DNN label error rate was reduced by 13.7% (SD = 13.6%, p < 0.01, Wilcoxon rank sum test; Figure 5C), while MOS-LQO had an average of 7.66% improvement (SD = 4.48%, p < 0.01, Wilcoxon rank sum test; Figure 5D). Because VAD-based training is agnostic to the source of noise, we expect it to be better utilized in settings where noise is not stationary and cannot be obtained separately, such as cases where live filtering is required. Another option in a real scenario would be that the user selects certain time periods for rapidly (re)training SSF, instead of using an automatic selection.
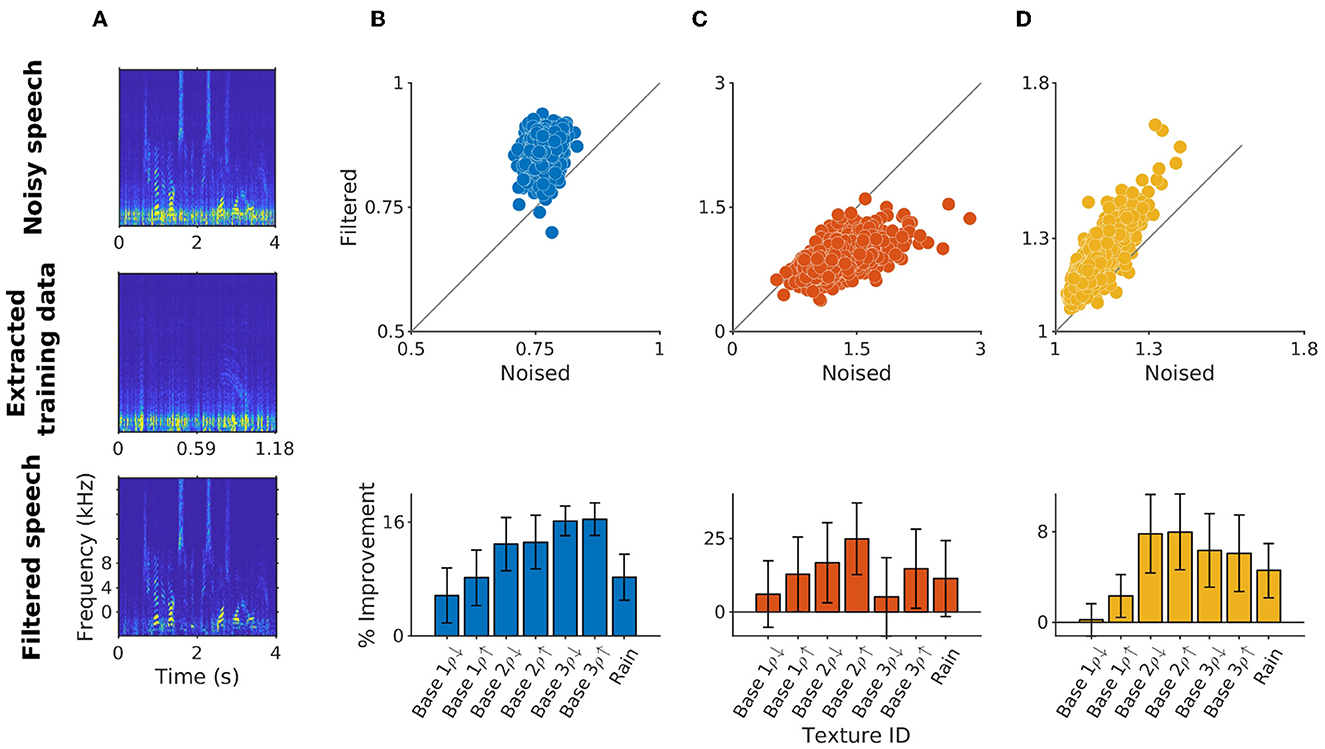
Figure 5. Training on automatically detected noise segments. (A) Sample spectrogram of original noisy speech and training data extracted using rVAD. The evaluation of the unsupervised version of the algorithm using correlation (B), DNN label error rate (C) and MOS-LQO scores (D) exhibits an improvement pattern similar to the supervised version shown in Figure 2.
The speed with which an algorithm can be run is another factor determining the range of its use cases. We quantified the speed of execution on a desktop computer (AMD Threadripper 2920X, 12-core). As with other performance metrics, we varied the core parameters of the algorithm to get a detailed overview of the runtime of our algorithm (Figure 6). Runtime was quantified as the time it takes to process one frame of the sound spectrogram divided by the actual duration of that frame, referred to as the real-time factor, with values < 1 indicating faster than real-time processing. With the default set of parameters, where each frame was 16 ms and the step size was 2 ms long, we obtained a real-time factor of μ = 0.0154 (STD = 0.0011), i.e., ~65× faster than real-time. The variables that had the strongest influence on processing speed were window and step sizes, as well as training duration. Given that the effect of these variables on performance metrics reported above plateaus very fast, the parameters can be tuned to run the algorithm extremely fast and effectively without compromising the filtering accuracy.
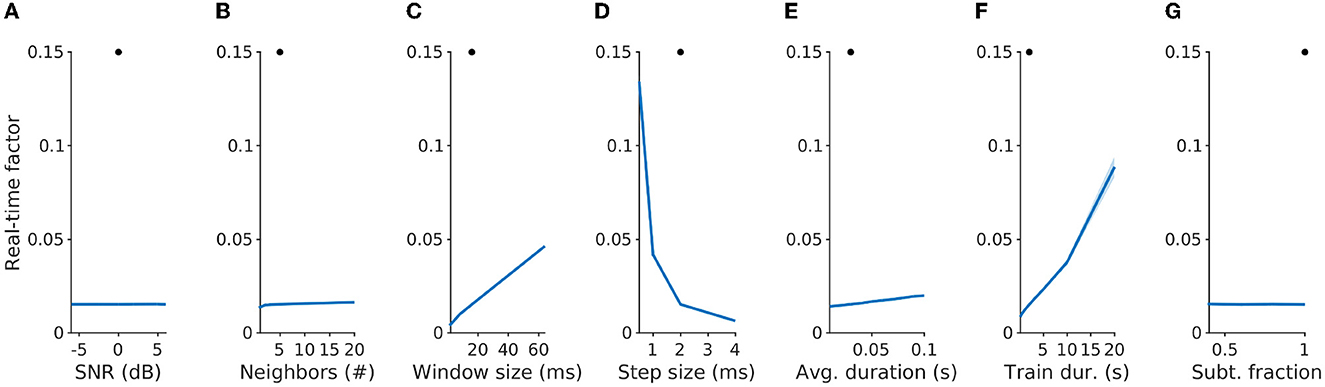
Figure 6. Statistical filtering can run in super-real-time on a current mobile phone. The default parameters for the present comparison were chosen on the basis of the filtering performance on speech in noise (see Figure 2). Filtering was run on a Threadripper 2920X processor, which is comparable in speed to a modern mobile processor (e.g., Apple M1, comparison based on Geekbench 5 performance). Performance is given in multiples of real-time (Real-time factor), i.e., smaller numbers indicating faster processing. Varying the parameters indicated that WindowSize (C), Step-Size (D), and training duration (F) have the largest influence on run-time. At the default parameters (black dots), the real-time factor is on average 0.0154 (S.D. = 0.0011). The current code is running non-compiled, hence, there remains room for optimization that would likely lead to substantial acceleration.
We developed a dedicated method for noise reduction in the context of acoustic textures, exploiting their statistically stable composition from a limited set of constituent sounds. The algorithm represents the set of spectrotemporal features of the background texture and subtracts a pseudo-optimal match from the speech-in-noise mixture. Testing the algorithm on a set of semi-natural and natural textures, we found that the algorithm can effectively remove textural noise in a fast, efficient manner that leads to a perceptual improvement in human listeners.
Given the statistically stable composition of textures, the most obvious choice for a filtering approach appears to be training a suitably designed statistical model of the texture, e.g., based on McDermott et al. (2013). We have experimented with both this model and Gaussian processes, however, we concluded that this approach was unsuitable for filtering for two main reasons: (1) Training and synthesis in these models are computationally intense and require a lot of data to constrain the models. These two aspects make them currently incompatible with the requirement of live processing, ideally on hearing aids. (2) If one wants to exploit the additive nature of the background noise and the target sound, a natural approach would be to synthesize future samples of the background noise, and subtract these from the composite sound. However, while these samples are individually statistically consistent with the background noise, they are not related to the current realization of it. Choosing a best match would thus require sampling a large variety of future samples and then subtracting the best match from the current sample, or projecting the latter onto the statistical model to separate noise and target sound. In our hands, neither of these approaches was fast enough to improve the quality of the target sound relative to the noise in a timely manner, however, see Liutkus et al. (2011) for a potential approach.
Conversely, the present approach is directly based on the expressed noise occurrences and utilizes them as a lexicon to compare against. While this approach is less general, it has the advantage of computational and data efficiency. In the future, we would like to combine a low-dimensional Gaussian process (GP) approach with SSF, since we think this might in combination remain computationally feasible and augment the performance of SSF by the inclusion of slower or marginal features that are potentially missed by SSF.
The interest in sound textures arises from the observation that they constitute a sizable fraction of naturally occurring sounds (Liu et al., 2022) and that humans can recognize and distinguish sounds based on their textural statistics alone (McDermott et al., 2013). This is reflected by the fact that sound textures can be represented and synthesized very effectively using a restricted number of summary statistics (McDermott and Simoncelli, 2011). The existence of such a compact representation raises an interesting possibility that the auditory system itself may utilize analogous compact representations and predictively suppress textural noise (Rabinowitz and King, 2011). The evidence from a perceptual discrimination task suggests that the human auditory system increasingly converges on time-averaged statistics of textures, instead of representing the temporal details of the individual acoustic events (McDermott et al., 2013).
As we mentioned in the previous section, even though time-averaged statistics carry sufficient information to resynthesize sound texture samples, an effective reduction of noise requires precisely matching the noise on a moment-by-moment basis. The statistical filtering that appears to be realized in the auditory cortex (Mesgarani et al., 2009; Khalighinejad et al., 2019) may achieve this by suitably transforming the sound, potentially using a cascade similar to the one proposed by McDermott et al. (2013). and then adapting on every level, as an extension to the principle used in Boubenec et al. (2017). The downside of this transformation is that it is not (easily) invertible and thus cannot be used to synthesize a sound from the filtered representation, which is essential in applications such as hearing aids. On the other hand, it might be sufficient for processing in speech recognition systems. The present method of matching samples of the sounds against a library of known spectrotemporal features of the texture is thus likely not reflective of neural processes but may be productively combined with them.
One of the core issues facing any noise reduction algorithm is the generalization to other sounds. To assess how well SSF generalizes across different types of textures, we parametrically controlled the statistical features of the background noises on which the performance of the algorithm was tested, in addition to the inclusion of a natural texture. Among the tested background sounds we observed variability in algorithm performance, but an improvement was observed for all textures with different marginal and correlation statistics. These results suggest that SSF can generalize across a wide range of sound textures, though further studies utilizing the full set of statistics in the synthesis of sound textures can improve the granularity of the sampling.
Beyond this, an additional challenge can be that the definition of noise can be context-dependent (Liu et al., 2022): what may act as noise in one condition may carry information in another context. For instance, speech sounds, which are typically enhanced and considered as signals, are notoriously difficult to reduce when mixed together in a cocktail party situation (Middlebrooks et al., 2017). To address this issue, noise (or features thereof) can be defined in a supervised, user-driven manner or deduced using cues such as head direction, lip movements, etc. (Michelsanti et al., 2021). Babble noise associated with cocktail party situations was not included in our dataset due to our approach to sampling the noise space by texture synthesis, which is not conducive to synthesizing highly modulated speech sounds. Future applications of SSF would therefore require further testing of the algorithm with babble noise which can become more texture-like with a growing number of talkers.
In addition, the variability arising from dynamic changes in the background noise condition of the given scene poses another major challenge for noise reduction algorithms. More specifically, methods meant to be used in real-time situations should be able to adaptively reduce noise from sources that enter or leave the acoustic scene. VAD-based noise extraction can in principle address this problem by allowing continuous training data extraction-training-filtering cycles. The performance of the algorithm was found to plateau quickly (~2–5 s, see Figure 2) as a function of adding longer training data sets, suggesting that the algorithm can plausibly be used in a real-time setting for continuous training. However, the time course of background noises varies greatly from continuous textures to impulse noise that happens very fast and poses a challenge to SSF which assumes some level of stationarity in the background conditions.
By design, SSF is agnostic to the type of target sounds embedded in the noise. While this property imparts SSF its domain-neutrality, and a broader range of applicability, it also limits the improvement to the speech intelligibility, when such a use-case is desired. This is a common problem with noise reduction algorithms that aim to model the features of noise and subtractively remove them from the sound mixture. Previous studies showed that while such algorithms can decrease the listening effort, they do not necessarily improve speech quality or intelligibility at the same time (Sarampalis et al., 2009; Fiedler et al., 2021). In this study, speech quality rather than intelligibility was quantified in human experiments, and the metric that most closely approximated speech intelligibility was the DNN label error rate. We observed that the quality of speech was not degraded and the DNN label error rate decreased as a result of filtering. However, further experiments are needed to quantify the effect that SSF may have on speech intelligibility for human listeners.
Recent years have seen a lot of development of speech-denoising techniques based on machine learning methods, primarily artificial neural networks, in particular deep neural networks (DNNs) (Michelsanti et al., 2021; Ochieng, 2022). These methods have been demonstrated to be highly effective in tackling speech-in-noise problems, partly because they can be trained to have a highly complex representation of speech which may enable them to selectively enhance speech. The present approach is more simplistic in nature, targeting the specific properties of sound textures. We think it has three concrete advantages over complex DNN systems:
(i) Rapid, targeted training: DNN systems require a substantial amount of time and resources to be trained. From the perspective of a hearing aid user, it might often be preferable to have an algorithm (such as SSF) available that can be quickly retrained to adapt to the current background sound, and thus specifically reduce disturbances from this source. Training using SSF requires only a few seconds of training data, and training completes closely after all training data has been processed (~60 ms for 2 s of training data). As we have shown, supervised (Figure 2) and unsupervised training methods (Figure 4) can achieve similar levels of performance.
(ii) Domain-neutral: DNN systems are typically trained on a large set of speech sounds in the context of a certain set of noise sounds. This enables these systems to make use of the inherent predictability of speech in addition to the structures in the noise. In SSF, the regularities inside the target sound are not utilized in the filtering. While this likely limits the quality of filtering on the training set, it may generalize better to other target sounds, e.g., music or other sounds that are not consistent with the textural statistics.
(iii) Fast execution: SSF runs much faster (probably 10–100×) than real-time on the type of processors found in current mobile devices (e.g., multicore performance of the present desktop processor is only a factor 2 greater than an Apple A16 processor; Geekbench, 2022). It, hence, does not require a powerful GPU to run efficiently. This enables usage cases, where either the hearing aid processor in the hearing aid or a connected mobile phone runs the filtering in near real-time. While SSF is thus computationally lighter than DNN approaches, running it directly on a hearing aid may require the design of a specialized processor to stay within typical power limits and runtimes (Dr. Harzcos, audifon, personal communication).
The low computational complexity of spectral subtraction methods comes at a price of distortions that may arise from inaccuracies in noise estimation. Such distortions affect the speech as well as the noise components, creating a phenomenon known as musical noise (Loizou, 2013a), which is characterized by small, isolated peaks in the spectrum occurring randomly in the frequency bands at each time frame. A number of methods have been proposed in order to directly address musical noise (Goh et al., 1998; Lu and Loizou, 2008; Miyazaki et al., 2012). Although spectrally flooring negative values generated by subtraction to minimum values in adjacent frames (as was done in Boll, 1979) led to a small improvement in the MOS-LQO score, it significantly reduced the performance in other performance metrics. While our approach does not directly address the problem of musical noise, it indirectly reduces the overall likelihood of its occurrence by modeling the noise source specifically.
While the chosen DNN architecture for assessing the improvement of speech intelligibility was well-motivated, alternative approaches could have some additional value. Since real-world applications in speech recognition would choose more recent architectures (see Li, 2022 for a review), using such a system might provide estimates that are more in line with the human perceived evaluations and also translate better to current applications in speech recognition.
Lastly, our human experiments show that the participants do not perceive a reduction in speech quality as a result of filtering, suggesting that the speech component is not substantially distorted as a result of subtraction. However, since our test did not directly ask the participants to indicate the perceived background quality (only the level was asked), we cannot rule out the possibility of residual musical noise. The development of automatic methods for quantifying the amount of musical noise can therefore improve the evaluation of spectral-subtractive methods in the future.
We presented an efficient and dedicated spectral subtraction-based method for noise reduction in sound textures. The way of representing and estimating background noises was inspired by the fundamental feature of sound textures which are made up of spectrally similar sound events that tend to persist in the acoustic scene. We show that spectral subtraction performed based on the KNN search can effectively reduce this kind of noise, without causing significant distortion to the speech. Additionally, the algorithm runs much faster than real-time on conventional computing machines, suggesting that it can be integrated into devices that have limited computational power such as hearing aids. The speed of the algorithm also allows it to be potentially used in conjunction with other methods that can enhance the speech component and reduce the residual musical noise. Given that sound textures constitute a substantial subset of what is considered noise in human hearing, we believe closer attention to this class of sounds in development and testing may aid other noise reduction algorithms in the future in terms of generalizability.
The datasets presented in this study can be found in online repositories. The names of the repository/repositories and accession number(s) can be found below: https://doi.org/10.34973/j6k7-j590.
The studies involving humans were approved by Ethics Committee of the Faculty of Social Sciences at Radboud University Nijmegen. The studies were conducted in accordance with the local legislation and institutional requirements. The participants provided their written informed consent to participate in this study.
AA, NS, and BE contributed to the conception and design of the study and wrote the first draft of the manuscript. NS and BE developed the first versions of the algorithm. AA performed the testing, fine-tuning, and statistical analysis. All authors contributed to the manuscript revision, read, and approved the submitted version.
BE acknowledges funding from an NWO VIDI Grant (016.VIDI.189.052) and an NWO Open Grant (ALWOP.346).
We would like to thank Dr. T. Harzcos (audifon Germany) for helpful discussions on the limitations of hearing aids.
The authors declare that the research was conducted in the absence of any commercial or financial relationships that could be construed as a potential conflict of interest.
All claims expressed in this article are solely those of the authors and do not necessarily represent those of their affiliated organizations, or those of the publisher, the editors and the reviewers. Any product that may be evaluated in this article, or claim that may be made by its manufacturer, is not guaranteed or endorsed by the publisher.
The Supplementary Material for this article can be found online at: https://www.frontiersin.org/articles/10.3389/fauot.2023.1226946/full#supplementary-material
Abadi, M., Agarwal, A., Barham, P., Brevdo, E., Chen, Z., Citro, C., et al. (2016). TensorFlow: large-scale machine learning on heterogeneous distributed systems. arXiv [Preprint].arXiv:1603.04467. doi: 10.48550/arXiv.1603.04467
Anjos, A., El-Shafey, L., Wallace, R., Günther, M., McCool, C., and Marcel, S. (2012). “Bob: a free signal processing and machine learning toolbox for researchers,” in Proceedings of the 20th ACM International Conference on Multimedia (New York, NY: Association for Computing Machinery), 1449–1452.
Boll, S. (1979). Suppression of acoustic noise in speech using spectral subtraction. IEEE Trans. Acoust. Speech Signal Process. 27, 113–120. doi: 10.1109/TASSP.1979.1163209
Boubenec, Y., Lawlor, J., Górska, U., Shamma, S., and Englitz, B. (2017). Detecting changes in dynamic and complex acoustic environments. eLife 6, e24910. doi: 10.7554/eLife.24910.024
Braun, S., Gamper, H., Reddy, C. K. A., and Tashev, I. (2021). “Towards Efficient Models for Real-Time Deep Noise Suppression,” in ICASSP 2021 - 2021 IEEE International Conference on Acoustics, Speech and Signal Processing (ICASSP) (Toronto, ON), 656–660.
Brookes, M. (2002). VOICEBOX: Speech Processing Toolbox for MATLAB. Available online at: http://www.ee.ic.ac.uk/hp/staff/dmb/voicebox/voicebox.html (accessed October 7, 2023).
Chetlur, S., Woolley, C., Vandermersch, P., Cohen, J., Tran, J., Catanzaro, B., et al. (2014). cuDNN: efficient primitives for deep learning. arXiv [Preprint].arXiv: 1410.0759. doi: 10.48550/arXiv.1410.0759
Culling, J. F., and Stone, M. A. (2017). “Energetic masking and masking release,” in The Auditory System at the Cocktail Party, Springer Handbook of Auditory Research, eds J. C. Middlebrooks, J. Z. Simon, A. N. Popper, and R. R. Fay (Cham: Springer International Publishing), 41–73.
Donley, J. (2022). Sound Zone Tools [MATLAB]. Github package. Available online at: https://github.com/jdonley/SoundZone_Tools (Original work published 2015).
Ephraim, Y., and Malah, D. (1985). Speech enhancement using a minimum mean-square error log-spectral amplitude estimator. IEEE Trans. Acoust. Speech Signal Process. 33, 443–445. doi: 10.1109/TASSP.1985.1164550
Fiedler, L., Seifi Ala, T., Graversen, C., Alickovic, E., Lunner, T., and Wendt, D. (2021). Hearing aid noise reduction lowers the sustained listening effort during continuous speech in noise-A combined pupillometry and EEG study. Ear Hear. 42, 1590–1601. doi: 10.1097/AUD.0000000000001050
Garofolo, J. S., Lamel, L. F., Fisher, W. M., Fiscus, J. G., and Pallett, D. S. (1993). DARPA TIMIT Acoustic-Phonetic Continuous Speech Corpus CD-ROM. NIST Speech Disc 1-1.1. NASA STI/Recon Technical Report No. 93. Speech Corpus.
Geekbench (2022). iPhone 14 Pro Max vs Generic - Geekbench Browser. Available online at: https://browser.geekbench.com/v5/cpu/compare/19645606?baseline=19423140 (accessed February 1, 2023).
Goh, Z., Tan, K.-C., and Tan, T. G. (1998). Postprocessing method for suppressing musical noise generated by spectral subtraction. IEEE Trans. Speech Audio Process. 6, 287–292. doi: 10.1109/89.668822
Graves, A., Fernández, S., Gomez, F., and Schmidhuber, J. (2006). “Connectionist temporal classification: labelling unsegmented sequence data with recurrent neural networks,” in Proceedings of the 23rd International Conference on Machine Learning (ICML '06) (New York, NY: Association for Computing Machinery), 369–376.
Handel, S. (2006). “The transition between noise (disorder) and structure (order),” in Perceptual Coherence: Hearing and Seeing, ed S. Handel (Oxford: Oxford University Press).
Harris, C. R., Millman, K. J., van der Walt, S. J., Gommers, R., Virtanen, P., Cournapeau, D., et al. (2020). Array programming with NumPy. Nature 585, 357–362. doi: 10.1038/s41586-020-2649-2
Henry, F., Glavin, M., and Jones, E. (2021). Noise reduction in cochlear implant signal processing: a review and recent developments. IEEE Rev. Biomed. Eng. 16, 319–331. doi: 10.1109/RBME.2021.3095428
Huang, Y. A., and Benesty, J. (2012). A multi-frame approach to the frequency-domain single-channel noise reduction problem. IEEE Trans. Audio Speech Lang. Process. 20, 1256–1269. doi: 10.1109/TASL.2011.2174226
Hunter, J. D. (2007). Matplotlib: a 2D graphics environment. Comput. Sci. Eng. 9, 90–95. doi: 10.1109/M.C.S.E.2007.55
ITU-T (2003). P. 862.1: Mapping Function for Transforming P. 862 Raw Result Scores to MOS-LQO. Geneva: International Telecommunication Union Recommendationss. Union Geneva, 24.
ITU-T (2007). Wideband Extension to Recommendation P.862 for the Assessment of Wideband Telephone Networks and Speech Codecs. International Telecommunication Union Recommendationss, 862.
Khalighinejad, B., Herrero, J. L., Mehta, A. D., and Mesgarani, N. (2019). Adaptation of the human auditory cortex to changing background noise. Nat. Commun. 10, 2509. doi: 10.1038/s41467-019-10611-4
Koole, A., Nagtegaal, A. P., Homans, N. C., Hofman, A., Baatenburg de Jong, R. J., and Goedegebure, A. (2016). Using the digits-in-noise test to estimate age-related hearing loss. Ear Hear. 37, 508–513. doi: 10.1097/AUD.0000000000000282
Lee, T., and Theunissen, F. (2015). A single microphone noise reduction algorithm based on the detection and reconstruction of spectro-temporal features. Proc. R. Soc. Math. Phys. Eng. Sci. 471, 20150309. doi: 10.1098/rspa.2015.0309
Li, J. (2022). Recent advances in end-to-end automatic speech recognition. APSIPA Trans. Signal Inf. Process. 11, 50. doi: 10.1561/116.00000050
Liu, F., Jiang, S., Kang, J., Wu, Y., Yang, D., Meng, Q., et al. (2022). On the definition of noise. Humanit. Soc. Sci. Commun. 9, 1–17. doi: 10.1057/s41599-022-01431-x
Liutkus, A., Badeau, R., and Richard, G. (2011). Gaussian processes for underdetermined source separation. IEEE Trans. Signal Process. 59, 3155–3167. doi: 10.1109/TSP.2011.2119315
Loizou, P. C. (2013a). Spectral-Subtractive Algorithms, in: Speech Enhancement: Theory and Practice.
Loizou, P. C. (2013b). Speech Enhancement: Theory and Practice, 2nd Edn. Boca Raton, FL: CRC Press. doi: 10.1201/b14529
Lu, Y., and Loizou, P. C. (2008). A geometric approach to spectral subtraction. Speech Commun. 50, 453–466. doi: 10.1016/j.specom.2008.01.003
McDermott, J. H. (2009). The cocktail party problem. Curr. Biol. 19, R1024–R1027. doi: 10.1016/j.cub.2009.09.005
McDermott, J. H., Schemitsch, M., and Simoncelli, E. P. (2013). Summary statistics in auditory perception. Nat. Neurosci. 16, 493–498. doi: 10.1038/nn.3347
McDermott, J. H., and Simoncelli, E. P. (2011). Sound texture perception via statistics of the auditory periphery: evidence from sound synthesis. Neuron 71, 926–940. doi: 10.1016/j.neuron.2011.06.032
Mesgarani, N., David, S. V., Fritz, J. B., and Shamma, S. A. (2009). Influence of context and behavior on stimulus reconstruction from neural activity in primary auditory cortex. J. Neurophysiol. 102, 3329–3339. doi: 10.1152/jn.91128.2008
Michelsanti, D., Tan, Z.-H., Zhang, S.-X., Xu, Y., Yu, M., Yu, D., et al. (2021). An overview of deep-learning-based audio-visual speech enhancement and separation. IEEEACM Trans. Audio Speech Lang. Process. 29, 1368–1396. doi: 10.1109/TASLP.2021.3066303
Middlebrooks, J. C., Simon, J.Z., Popper, A.N., and Fay, R.R. (eds.). (2017). The Auditory System at the Cocktail Party, Springer Handbook of Auditory Research. Cham: Springer International Publishing.
Minaee, S., Boykov, Y., Porikli, F., Plaza, A., Kehtarnavaz, N., and Terzopoulos, D. (2022). Image segmentation using deep learning: a survey. IEEE Trans. Pattern Anal. Mach. Intell. 44, 3523–3542. doi: 10.1109/TPAMI.2021.3059968
Miyazaki, R., Saruwatari, H., Inoue, T., Takahashi, Y., Shikano, K., and Kondo, K. (2012). Musical-noise-free speech enhancement based on optimized iterative spectral subtraction. IEEE Trans. Audio Speech Lang. Process. 20, 2080–2094. doi: 10.1109/TASL.2012.2196513
Ochieng, P. (2022). Deep neural network techniques for monaural speech enhancement: State of the art analysis. arXiv[Preprint].arXiv:2212.00369.
Pedregosa, F., Varoquaux, G., Gramfort, A., Michel, V., Thirion, B., Grisel, O., et al. (2011). Scikit-learn: machine learning in Python. J. Mach. Learn. Res. 12, 2825–2830.
Peirce, J., Gray, J. R., Simpson, S., MacAskill, M., Höchenberger, R., Sogo, H., et al. (2019). PsychoPy2: experiments in behavior made easy. Behav. Res. Methods 51, 195–203. doi: 10.3758/s13428-018-01193-y
Pruša, Z., Søndergaard, P. L., Holighaus, N., Wiesmeyr, C., and Balazs, P. (2014). “The large time-frequency analysis toolbox 2.0,” in Sound, Music, and Motion, Lecture Notes in Computer Science, eds M. Aramaki, O. Derrien, R. Kronland-Martinet, and S. Ystad (Cham: Springer International Publishing), 419–442.
Rabinowitz, N. C., and King, A. J. (2011). Auditory perception: hearing the texture of sounds. Curr. Biol. 21, R967–R968. doi: 10.1016/j.cub.2011.10.027
Rix, A. W., Beerends, J. G., Hollier, M. P., and Hekstra, A. P. (2001). “Perceptual evaluation of speech quality (PESQ)-a new method for speech quality assessment of telephone networks and codecs,” in 2001 IEEE International Conference on Acoustics, Speech, and Signal Processing. Proceedings (Cat. No.01CH37221). Presented at the 2001 IEEE International Conference on Acoustics, Speech, and Signal Processing. Proceedings (Cat. No.01CH37221) (Salt Lake City, UT), Vol. 2, 749–752.
Sarampalis, A., Kalluri, S., Edwards, B., and Hafter, E. (2009). Objective measures of listening effort: effects of background noise and noise reduction. J. Speech Lang. Hear. Res. 52, 1230–1240. doi: 10.1044/1092-4388(2009/08-0111)
Tan, Z.-H., Sarkar, A., and kr., Dehak, N. (2020). rVAD: An unsupervised segment-based robust voice activity detection method. Comput. Speech Lang. 59, 1–21. doi: 10.1016/j.csl.2019.06.005
Tanaka, H. (2019). Editdistance: Fast Implementation of the Edit Distance (Levenshtein Distance). Software Package.
The Relaxed Guy (2014). 3 Hours of Gentle Night Rain, Rain Sounds to Sleep, Study, Relax, Reduce Stress, Help Insomnia. Available online at: https://www.youtube.com/watch?v=q76bMs-NwRk (accessed September 12, 2023).
Tzirakis, P., Kumar, A., and Donley, J. (2021). Multi-channel speech enhancement using graph neural networks. arXiv[Preprint].arXiv:2102.06934. doi: 10.48550/arXiv.2102.06934
van Rossum, R. G., and Drake, F. (2009). Python 3 reference manual. Scotts Val. CA Creat. 10, 1593511.
Virtanen, P., Gommers, R., Oliphant, T. E., Haberland, M., Reddy, T., Cournapeau, D., et al. (2020). SciPy 1.0: fundamental algorithms for scientific computing in Python. Nat. Methods 17, 261–272. doi: 10.1038/s41592-019-0686-2
Woods, K. J. P., Siegel, M., Traer, J., and McDermott, J. H. (2017). Headphone screening to facilitate web-based auditory experiments. Atten. Percept. Psychophys. 79, 2064–2072. doi: 10.3758/s13414-017-1361-2
Xu, R., Wu, R., Ishiwaka, Y., Vondrick, C., and Zheng, C. (2020). “Listening to sounds of silence for speech denoising,” in Advances in Neural Information Processing Systems (Virtual), 33, 9633–9648. Available online at: https://proceedings.neurips.cc/paper/2020/hash/6d7d394c9d0c886e9247542e06ebb705-Abstract.html
Keywords: sound textures, noise reduction, speech enhancement, hearing aids, statistical learning
Citation: Alishbayli A, Schlegel NJ and Englitz B (2023) Using auditory texture statistics for domain-neutral removal of background sounds. Front. Audiol. Otol. 1:1226946. doi: 10.3389/fauot.2023.1226946
Received: 22 May 2023; Accepted: 22 August 2023;
Published: 19 September 2023.
Edited by:
Karina De Sousa, University of Pretoria, South AfricaReviewed by:
Sridhar Krishnamurti, Auburn University, United StatesCopyright © 2023 Alishbayli, Schlegel and Englitz. This is an open-access article distributed under the terms of the Creative Commons Attribution License (CC BY). The use, distribution or reproduction in other forums is permitted, provided the original author(s) and the copyright owner(s) are credited and that the original publication in this journal is cited, in accordance with accepted academic practice. No use, distribution or reproduction is permitted which does not comply with these terms.
*Correspondence: Bernhard Englitz, YmVybmhhcmQuZW5nbGl0ekBkb25kZXJzLnJ1Lm5s
†Present address: Noah J. Schlegel, Neurotechnology, Faculty IV Electrical Engineering and Computer Science, Technische Universität Berlin, Berlin, Germany
‡These authors have contributed equally to this work
Disclaimer: All claims expressed in this article are solely those of the authors and do not necessarily represent those of their affiliated organizations, or those of the publisher, the editors and the reviewers. Any product that may be evaluated in this article or claim that may be made by its manufacturer is not guaranteed or endorsed by the publisher.
Research integrity at Frontiers
Learn more about the work of our research integrity team to safeguard the quality of each article we publish.