
95% of researchers rate our articles as excellent or good
Learn more about the work of our research integrity team to safeguard the quality of each article we publish.
Find out more
ORIGINAL RESEARCH article
Front. Audiol. Otol. , 21 July 2023
Sec. Technology and Innovation in Auditory Implants and Hearing Aids
Volume 1 - 2023 | https://doi.org/10.3389/fauot.2023.1215965
This article is part of the Research Topic Trends in Digital Hearing Health and Computational Audiology View all 12 articles
 Hasitha Wimalarathna1,2*
 Sangamanatha Ankmnal-Veeranna2,3
 Minh Duong2,4
 Chris Allan2,4
 Sumit K. Agrawal1,2,5,6,7Prudence Allen2,4Jagath Samarabandu1,5
 Hanif M. Ladak1,2,5,6,7
Introduction: Approximately 0.2–5% of school-age children complain of listening difficulties in the absence of hearing loss. These children are often referred to an audiologist for an auditory processing disorder (APD) assessment. Adequate experience and training is necessary to arrive at an accurate diagnosis due to the heterogeneity of the disorder.
Objectives: The main goal of the study was to determine if machine learning (ML) can be used to analyze data from the APD clinical test battery to accurately categorize children with suspected APD into clinical sub-groups, similar to expert labels.
Methods: The study retrospectively collected data from 134 children referred for ADP assessment from 2015 to 2021. Labels were provided by expert audiologists for training ML models and derived features from clinical assessments. Two ensemble learning techniques, Random Forest (RF) and Xgboost, were employed, and Shapley Additive Explanations (SHAP) were used to understand the contribution of each derived feature on the model's prediction.
Results: The RF model was found to have higher accuracy (90%) than the Xgboost model for this dataset. The study found that features derived from behavioral tests performed better compared to physiological test features, as shown by the SHAP.
Conclusion: The study aimed to use machine learning (ML) algorithms to reduce subjectivity in audiological assessments used to diagnose APD in children and identify sub-groups in the clinical population for selective interventions.
Significance: The study suggests that this work may facilitate the future development of APD clinical diagnosis software.
Auditory processing refers to how the brain interprets the sounds that one has heard. Normal auditory processing is important for understanding complex sounds, such as music or speech in difficult listening situations like classrooms, recreation, social gatherings, or restaurants. If the auditory system has weak processing skills, it can lead to listening problems [Cline, 2001; American Speech-Language-Hearing Association (ASHA), 2005]. Approximately 0.2–5% of normal-hearing children have difficulty understanding complex sounds, especially in difficult listening situations (Chermak et al., 1997; Nagao et al., 2016). These children are suspected of having Auditory Processing Disorder (APD). APD is usually identified by parents or teachers and requires an assessment by an audiologist for a formal diagnosis. APD assessments are typically carried out in specialized clinical centers. The audiologists who conduct these tests require extensive training and experience for proper assessment and diagnosis. However, there is a lack of consensus regarding which specific tests should be included in the APD assessment battery (Emanuel et al., 2011; Iliadou et al., 2017). Professional bodies including the American Speech-Language Hearing Association (ASHA) recommend using both behavioral and physiological measures (in a test battery approach) to assess auditory processing in children suspected of APD [American Speech-Language-Hearing Association (ASHA), 2005]. The behavioral component measures the child's ability to process acoustic stimuli (speech and non-speech) and respond verbally. The physiological component measures the overall integrity of the auditory system (Starr and Achor, 1975; Allen and Allan, 2014). A diagnosis of APD is made if the child's test scores are greater than two standard deviations from normative thresholds on two or more tests, or three standard deviations on one test [American Speech-Language-Hearing Association (ASHA), 2005].
There are typically very few referrals made to clinics for APD per year (Moore et al., 2018), making it difficult for training audiologists to gain sufficient practice assessing APD. The diagnosis of APD is also challenging due to its heterogeneity and associated comorbidities (Bamiou et al., 2001; Chermak, 2002; Sharma et al., 2009; Iliadou et al., 2017, 2018, 2019). As a result, there are very few studies on the management of APD children (Emanuel et al., 2011). Allen and Allan (2014) previously classified children with APD into clinical sub-groups based on how they performed on behavioral and physiological tests. Children who performed poorly on behavioral tests were considered behaviorally abnormal1; children who had atypical physiological findings were considered physiologically abnormal; children who performed poorly on both were considered abnormal across; and the children whose performance on both behavioral and physiological measures were within normal limits were categorized into a separate group. By identifying sub-groups of APD, an audiologist can better apply specific interventions the child may require. For example, children who have difficulty processing auditory information behaviorally may benefit from auditory training (Weihing et al., 2015), whereas children who show atypical physiologic processing may benefit from using frequency modulated (FM) systems (Hornickel et al., 2012; Rance et al., 2014). An FM system is a wireless device which reduces the background noise and improves sound clarity (Johnston et al., 2009). Children who have difficulty processing auditory information both behaviorally and physiologically may benefit from both auditory training and the use of an FM system [American Speech-Language-Hearing Association (ASHA), 1970; Sharma et al., 2012; Keith and Purdy, 2014; Smart et al., 2018]. Children whose performance is within normal limits on both behavioral and physiological measures may indicate to address non-auditory concerns, and a referral to another professional is required. Categorizing children into different subclinical groups is however complex, time consuming, and highly subjective.
Machine learning (ML) is becoming increasingly popular in the field of medicine to help clinicians make timely and accurate clinical diagnoses. ML techniques can be applied in designing software for clinical use by learning from the data (Davenport and Kalakota, 2019). Additionally, ML helps to reduce subjectivity in clinical judgment. Previously, ML models were considered “black box” models; however, with improvements in interpretability, models are now able to be better understood and applied in clinical settings (Ahmad et al., 2018). There is only one study in the literature that has used unsupervised ML techniques (hierarchical clustering) to identify sub-groups in APD data (Sharma et al., 2019). The study used data collected from 90 children aged 7–12.8 years old. Four sub-groups were found based on 10 variables, as follows:
• Group 1: Children with global deficits
• Group 2: Children with poor auditory processing, but good word reading and phonological awareness skills
• Group 3: Children with poor auditory processing, poor attention, and poor memory, but good language skills
• Group 4: Children with poor auditory processing and poor attention, but good memory skills
The assessments included in the analysis were behavioral tests and Cortical Evoked Auditory Responses (CEARs). However, APD is heterogenous, and it is therefore important to evaluate a variety of skills in the clinical assessment. There is a current lack of research using ML techniques to categorize APD data into sub-groups using both behavioral and physiological assessments.
The goal of our study was to determine if ML models can be used to learn and predict the diagnosis of APD with similar accuracy to clinical audiologists. Furthermore, we used interpretability techniques to identify how important each individual assessment within the APD battery is in arriving at an accurate label. The application of ML may show the diagnostic accuracy of APD, assist in centers where experts offer limited availability, and enable another tool together with clinical expertise to target individualized intervention of APD. To our best knowledge, this is the first study to:
1. Use supervised ML methods for APD data analysis from a comprehensive test battery that includes both behavioral and objective hearing assessments.
2. Use interpretability techniques to identify which APD assessments contribute most to an accurate APD diagnosis based on expert labels.
Children with listening complaints (hearing in noise) and or poor academic performance were referred to the H.A. Leeper Speech & Hearing clinic at the University of Western Ontario, Canada for an assessment of APD. Data from 134 children between the ages of 5–17 years old (90 male; 44 female) were retrospectively collected from 2015 to 2021. The primary language of all the children was English. The Health Sciences Research Ethics Board of Western University, Canada, has approved the study (IRB 00000940).
The APD assessment is carried out in a test battery format following guidelines recommended by ASHA [American Speech-Language-Hearing Association (ASHA), 2005]. The test battery appraises the overall wellbeing of the auditory system, starting with how sound is processed and perceived by the auditory system. The Auditory Processing (AP) test battery consists of both behavioral and physiological measures. In behavioral tests, the processing and perception of auditory information are assessed. In physiological measures, the overall neuro-physiological wellbeing of the auditory system is assessed. Figure 1 shows a summary of the AP test battery.
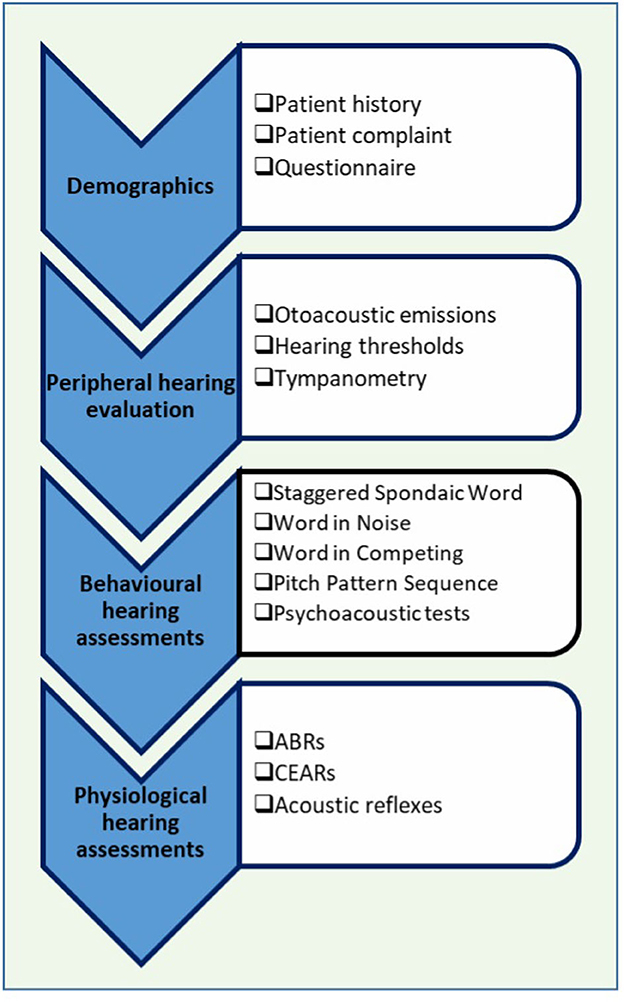
Figure 1. Auditory processing (AP) clinical test battery. ABR, auditory brainstem responses; CEARs, cortical evoked auditory responses.
First, patient demographics such as age, gender, birth history, middle ear history, family hearing issues, and additional health problems are completed, typically by a parent. Next is a detailed peripheral hearing assessment. In the peripheral hearing assessment, pure tone audiometry (the minimum intensity that a listener can detect for different test frequencies), tympanometry (an assessment of middle ear function), and otoacoustic emissions (a physiological measure that assesses the functioning of the outer hair cells) are completed to ensure that the child does not have any hearing loss. If a child fails any of the tests in the peripheral hearing assessment, auditory processing tests will not be administered [American Speech-Language-Hearing Association (ASHA), 2005]. Children with normal hearing as indicated by the peripheral hearing assessment will then undergo the auditory processing test battery. In this study, pure tone audiometry was conducted using the GSI-61 (Grason Stadler Inc, USA) Clinical Audiometer. The middle ear function was assessed using the GSI Audiostar (Grason Stadler Inc, USA) TympStar diagnostic middle ear analyzer. The otoacoustic emissions were measured through the Titan Suite.
The behavioral tests that are used are standardized and widely used in North America (Emanuel et al., 2011). Behavioral tests can be categorized into speech and non-speech tests. The Staggered Spondaic Word (SSW) test (Katz, 1998) is a dichotic listening test in which two spondees2 are presented in a staggered fashion and the listener must repeat all four words. The Word in Noise (WIN) test (Wilson, 2003) assesses the individual's ability to listen to speech in noise. In WIN tests, words are presented in multi-talker babble at seven signal-to-noise ratios (SNR) (+24–0 dB). In the Word in Ipsilateral competing noise (WIC) test (Ivey, 1969), words are presented at +5 dB SNR. The Pitch Pattern Sequence (PPS; Pinheiro, 1977) test assesses the auditory system's ability to perceive and or process auditory stimuli in their order of occurrence. In this study, adaptive auditory discrimination tests (psychoacoustic tests), such as the ability to detect brief gaps in noise, amplitude modulation (20 and 200 Hz), and ability to discriminate frequency (1,000 Hz), were also performed for a portion of children. In the current study, speech behavioral assessments were conducted using the GSI-61 Clinical Audiometer and the psychoacoustic tests were carried out using the Tucker Davis System.
Once the behavioral tests are completed, physiologic assessments are carried out. The auditory brainstem responses (ABRs) and cortical evoked auditory responses (CEARs) are recorded from children. These evoked responses are recorded from both ears by placing a surface electrode on the scalp and presenting brief acoustic stimuli. The ABR was recorded by presenting a 100 μs rarefaction click stimulus at 80 dB nHL at a rate of 13.3 clicks/s. The CEARs were recording using a 60 ms tone stimuli at 1,000 Hz with an intensity of 70 dB nHL. The stimuli were presented monoaurally through ER-3A, Etymotic Research Inc insert earphones. The ABR occurs between 0 and 8 ms after stimulus onset, whereas the CEARs occur between 80 and 300 ms after stimulus onset. The recording windows were 10 and 750 ms for ABRs and CEARs, respectively. The responses were averaged and amplified with an amplification of 100 k for ABRs and 30 k for CEARs. Bandpass filters of 100–1,500 Hz were applied to ABRs and filters of 1–30 Hz were applied to CEARs. The artifact rejection was set to 23.8 μV for ABRs and 79.2 μV for CEARs. In the present study, the recording of CEARs took place at a separate appointment, and only limited data was available. To record these physiological signals, we used a Bio-logic Navigator Pro AEP system (Natus Medica, Inc).
The last test performed in the test battery is the acoustic reflex (middle ear muscle reflex) test. The acoustic reflexes are recorded by presenting loud tones to the ear. When loud tones are presented, the admittance of the tympanic membrane and middle ear system decreases due to stapedius muscle contraction. Presence of an acoustic reflex is an indication that the middle ear and the peripheral auditory system is intact. The GSI TympStar diagnostic middle ear analyzer was used to obtain the acoustic reflexes in the current study.
A study conducted by Bellis and Ferre (1999) proposed the idea of determining different sub-groups of APD children. Previous studies conducted in the Child Hearing Research Laboratory at Western University (Allen and Allan, 2014) have also shown the importance of both physiological and behavioral assessments in the AP test battery thereby observing sub-groups in the APD data. A study by Sharma et al. (2019) used hierarchical cluster analysis to identify sub-groups in APD children. In the Sharma et al. (2019) study, data was collected from over 90 school-aged children (7–13 years old) who were suspected of having an APD. The collected data contained the outcomes of test results, which assessed the children's reading, language, cognition, and auditory processing. Initially, the dataset had 23 variables based on various auditory assessments, however, for the cluster analysis, only 10 variables were included, namely: phonological, irregular, TONI, Forward, Dichotic Digit Test, Language, Non-word, Attention, Backward DS, and Frequency Pattern Test. The cluster techniques used were hierarchical clustering, followed by k-means. Four clusters of children were identified: 35 children showed global deficits; 22 children showed poor auditory processing with good word reading and phonological awareness skills; 15 children had poor auditory processing with poor attention and memory, but good language skills; and 18 children had poor auditory processing and attention with good memory skills. However, the authors did not include any physiological data such as ABRs or otoacoustic emissions in the cluster analysis.
Cluster analysis techniques are unsupervised learning techniques, whereas in supervised learning, expert labels are used to train ML models. In supervised learning, after the model is trained with part of the labeled data (the “training” set), predictions are made on the other part of the data (the “test” set). The predicted results are compared to the labeled data to evaluate the accuracy of the model. The use of supervised or unsupervised techniques depends on whether human experts are available to provide the labels of the test set. Here, three expert audiologists with >10 years of experience assessing APD children labeled the dataset into four APD sub-groups (Allen and Allan, 2014) based on if children were behaviorally and physiologically normal or abnormal. The four labels were presented as follows:
• “BnPn” = Behaviorally Normal and Physiologically Normal
• “BnPa” = Behaviorally Normal and Physiologically Abnormal
• “BaPn” = Behaviorally Abnormal and Physiologically Normal
• “BaPa” = Behaviorally Abnormal and Physiologically Abnormal
In traditional ML algorithms, the data should be transformed to features that better represent the underlying problem to reach a satisfactory outcome. This process is called feature engineering. Deep Learning (DL), which is a sub-field in ML, does not require such manipulations; the model itself performs feature engineering. However, in medical applications, the use of DL techniques is limited due to the scarcity of data. Hence, traditional ML algorithms with effective feature engineering techniques may produce predictive models well-suited to the current problem. The feature engineering performed in our study was done with the advice of the domain experts. Since the AP assessments that are included in our study have standardized test scores, inserting the data as raw data into the ML pipeline seemed to interfere with the outcome of the tests. An additional problem was that some children did not finish all the assessments in the test battery for various reasons. Therefore, a better representation of data was needed to encode these clinical tests. Based on the expert agreement, the raw data encoding was carried out categorizing to “pass,” “fail,” “did not finish the assessment,” and “missing data.” One-hot encoding was conducted when feeding as features. The tests that were encoded in this manner were otoacoustic emissions, hearing thresholds, acoustic reflexes, and all the behavioral test results (both speech and non-speech tests).
The ABR and CEAR data are presented as clinical waveforms. To represent these data, we used the Continuous Wavelet Transform (CWT) as a feature extractor, as described in our previous work (Wimalarathna et al., 2021). The CWT is a time-frequency plot obtained by convolving a signal with a window function called a “mother wavelet.” The mathematical equation for the wavelet transform is as follows (Torrence and Compo, 1998),
In the equation, s(t) represents the signal and the ψ(t) represents the mother wavelet which is scaled by “a″ and translated by “b″. The CWT plot is obtained by convolving these scaled and translated versions of the mother wavelet. There are multiple mother wavelet types introduced in the literature, however since the ABRs and CEARs consist of peaks and valleys, intuitively the Gaussian mother wavelet was chosen throughout the study. If the ABR or the CEAR is windowed in the locations where peaks and valleys occur, it closely matches with the Gaussian wavelet. This was one major reason for selecting the Gaussian wavelet as it would best mimic how a clinician would select the peaks and valleys from a waveform.
In our previous study (Wimalarathna et al., 2021), the features extracted from the CWT were sent through a statistical feature selector and the models were trained to recognize abnormal versus normal ABR responses. In the previous study, 700 features were required to reach a 92% accuracy. For the present study, we wanted to further optimize the feature space and determine if a smaller number of features could represent the group differences between typically developing children and children suspected of having APD. The complex Gaussian mother-wavelet was used to compute the CWT plot for both ABRs and CEARs. The resulting CWT representation was a complex matrix. Therefore, to derive the features, we considered its magnitude and phase. From the magnitude plot of the CWT coefficient matrix, the coefficients were averaged across time and the coefficient of dispersion was calculated based on the following equation,
In the equation, Q1 and Q3 are the first and the third quartile of the average values, respectively. The angle of the CWT coefficients was first unwrapped across the time axis and the standard deviation was calculated as a feature. The ABRs and CEARs both contained four features in total, representing the magnitude and the phase. In a clinical setting, audiologists are interested in peaks, inter-peak intervals and their timing. However, there is additive subjectivity when an inexperienced audiologist analyzes the waveforms. Hence, by automatically calculating these features, subjectiveness in the analysis can be mitigated. The designed features represent similar characteristics of the waveform that clinicians derive manually. The ability of these features to explain the group differences were tested using ML models. Feature interaction was studied by adding and removing the features while observing the effects on accuracy.
APD is a rare disorder and clinics typically receive few APD referrals per year. It has also been reported that obtaining a referral for APD diagnosis is difficult (Moore et al., 2018; Agrawal et al., 2021). For these reasons, there was a limited amount of data available for this study and it took approximately six years to collect the data within the dataset. Data augmentation techniques may be used to overcome the difficulties associated with training ML models with small datasets. Several techniques have been identified in the literature, with resampling techniques being the most commonly used. Synthetic Minority Over-sampling TEchnique (SMOTE) is one such resampling technique where synthetic samples are generated for minority data instances (Chawla et al., 2002). The technique draws a new sample at a position (feature space) between samples. First, the algorithm selects a random instance from the minority class. Next, k nearest neighbors for that example are located. A synthetic example is then generated at a randomly chosen position in the feature space between the two instances and their randomly chosen neighbor (Brownlee, 2020a).
Recent advances in ML have led to the development of more sophisticated techniques for data augmentation, such as Generative Adversarial Networks (GANs). However, there are challenges in using this model for augmenting tabular data such as mixed data types, continuous features having multimodal non-gaussian distributions, and highly imbalanced categorical columns. The Conditional Tabular GAN (CTGAN) model designed by Xu et al. (2019) has been able overcome these challenges and has been proven to perform better than the existing architectures. The model uses mode-specific normalizations to overcome the issue of non-Gaussian and multimodal distributions. Additionally, the training-by-sampling technique is included to solve the problem of imbalanced columns. In the present study, we utilized CTGAN and the SMOTE resampling technique separately to compare which data augmentation technique was best suited to our application.
Ensemble learning techniques are generally considered suitable to train with small amounts of data. These models aggregate the outcome of a large number of models to produce a single classifier (Breiman, 1996). Bagging (Breiman, 1996) and Boosting (Schapire, 1990; Freund and Schapire, 1996) are two popular techniques used in building accurate ensemble models. In Bagging, the ensemble classifier combines the output of various learned classifiers into a single classifier. Boosting technique iteratively invoke a weakly learned classifier producing multiple classifiers. These are finally combined to a single strong composite classifier similar to Bagging. There is theoretical and empirical evidence proving that ensemble learning techniques can reduce both the bias and variance components of errors made by ML models (Rokach, 2019).
Several ML algorithms are available in the literature that use Bagging and Boosting techniques (Odegua, 2019). In our study, we selected Random Forest (RF) as an ensemble algorithm from the Bagging techniques and Xgboost (Xgb) from the Boosting techniques. The RF algorithm combines bagging with bootstrap sampling. Xgb uses a highly scalable tree ensemble boosting algorithm. Even though there are many algorithms available in the literature that can train a model with small datasets, it is best to consider minimizing bias and variance to not only fit the test data but also generalize well on test/validation data (Maheswari, 2019). Certain algorithms are prone to overfitting if not carefully chosen. The traditional learning algorithms such as ensemble algorithms, perform better compared to deep learning architectures which utilize neural networks (Alom et al., 2019). This was observed when we trained a Neural Network model.
Additional problems encountered with some ML algorithms include class imbalance (Brownlee, 2020a), non-representative data (Menon, 2020), and the curse of dimensionality (Karanam, 2021). However, ensemble methods such as RF and Xgb are less likely to be associated with such challenges when using small datasets. We applied hyperparameter tuning (tuned hyperparameters are included in Table A1), cross-validation, stratified sampling, and resampling techniques (SMOTE Chawla et al., 2002) to overcome the challenges of a small dataset.
Machine Learning models have long been considered black-box models until recently, when the research community discovered techniques to disentangle the internal mechanisms of the models. This has helped build trust in the use of ML models for sensitive applications, such as in the field of biomedicine (Rudin, 2019; Auslander et al., 2021; Papastefanopoulos et al., 2021). There are two scopes of interpretability in ML models, per sample interpretation (local) and overall interpretation (global). There are several software libraries available to interpret an ML model both locally and globally. Shaply Additive Values by Lundberg and Lee (2016) is an interpretability technique that uses coalition game theoretical approaches to explain a model's predictions. It has been implemented as a Python library named “SHAP,” which stands for SHaply Additive exPlanations (Mazzanti, 2020). In SHAP, the feature values of a data instance act as players in a coalition. The computed SHAP values represent how to fairly distribute the prediction among the features. The explained SHAP model can be represented by the following equation (Bagheri, 2022),
The g(x,) in the equation is the explanation model. Coalition vector is represented as x, ∈ {0, 1}K, where K is the maximum coalition size. The Shapley value is ϕj ∈ ℝ, which is the feature attribution for a feature j. The Shapley value reveals how to fairly distribute a prediction among the features assuming that each feature value of the instance is a “player” in a game where prediction is the payout. In this study, the SHAP Python library (Lundberg and Lee, 2017) was used to interpret the models.
In Experiment 1, only ABRs were considered as the number of CEARs was only available for 46 children. There were four ABR signals (two from both ears) considered from each of the 134 children, resulting in 536 data instances. For Experiments 2, each child had eight CEAR signals resulting in a total number of 368 instances for the dataset, including the ABRs. The train/test split was chosen to be 70:30 across all the experiments since a balance for both training and testing data was required due to the small dataset sizes. In all experiments, to find the confidence bounds of the model, iteratively 100 shuffled random splits of train/test (train/test split was not fixed) were considered from each ML algorithm. It results in 100 models trained on different train/test splits of the data. All the training iterations included both hyperparameter tuning using Random Search (Bergstra and Bengio, 2012) and stratified cross-validation (Brownlee, 2020b). This revealed how confident each model was in predicting the labels of the dataset.
The performance of the ML models was evaluated using the metrics listed in Table 2. A true positive (TP) or a true negative (TN) indicates cases where the model and the label provided by the clinician agree. When the model and the labels disagree, false negatives (FN) and false positives (FP) are encountered. Calculating TN, TP, FN, and FP from the confusion matrix in the case of a multi-class classification problem is different compared to a binary classification problem. Further details on these calculations can be found in Grandini et al. (2020) and Shmueli (2019). The informedness and markedness were calculated from the sensitivity, specificity, and precision. Informedness combines both sensitivity and specificity to measure the consistency of predictions from the ML model, whereas markedness measures the trustworthiness of predictions made by the ML model (Powers, 2020).
Statistical significance tests were utilized to arrive at conclusions based on the evaluated metrics. The Friedman test was conducted to evaluate the significance of the results. The Friedman test is a non-parametric test used to compare group differences (Scheff, 2016).
All algorithms used were written in the Python programming language. Several software libraries were employed. The Pandas library (McKinney et al., 2011) was first used to pre-process the data. CWT analysis was carried out using the PyWavelets library (Lee et al., 2019). The Scikit-learn package (Pedregosa et al., 2011) contained all the ML algorithms that were used in the study. Finally, the SHAP library (Lundberg and Lee, 2017) was used to interpret the models.
The results obtained for the experiments as mentioned in Table 1 are shown in Figure 2. These results were obtained from training 100 different train/test splits from the data. Each data point shows the accuracy for the test set after the model was trained with hyperparameter tunning and cross-validation. In Experiment 1, the RF model has a negatively skewed distribution (mean = 68.3%, median = 68.5%) with a standard deviation of 4%, while the Xgb model shows a positively skewed distribution (mean = 66.6%, median = 65.7%) with a standard deviation of 5%. The median accuracy of the RF model is greater than the Xgb model (2.8%). In Experiment 2, the RF shows a positively skewed distribution (mean = 81.6%, median = 81.1%), while Xgb shows a negatively skewed distribution (mean =79.1%, median = 79.3%). The RF model shows slightly better median accuracy than Xgb (1.8% difference).
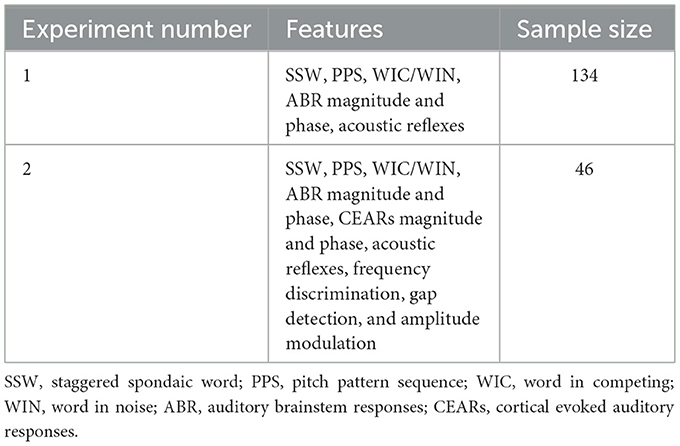
Table 1. Details of the experiments conducted.
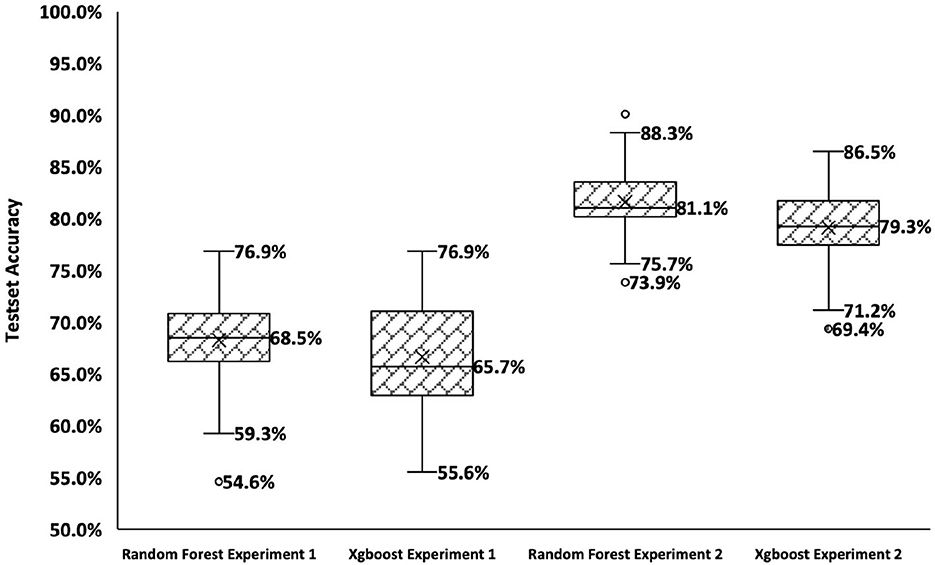
Figure 2. Summary of results for Experiments 1 and 2. The x-axis shows the four conditions, and the y-axis shows the accuracy over the test set.
A Friedman test revealed a significant difference in the results of experiments . The Bonferroni multiple comparison test was next used to compare pairwise performances for each experiment. The test revealed that each pair of experiments has significant differences in performance. Experiment 2 showed significantly better results (p < 0.01) for both RF and Xgb models compared to Experiment 1. Experiment 2 contained features derived from all the tests from both the behavioral and physiological test battery, whereas Experiment 1 contained only features from ABRs due to the lack of data for CEARs.
The model with the greatest accuracy out of the 100 models generated from each different train/test splits of data for Experiment 2 is RF with a 90.1% overall accuracy and Xgb with an 86.5% overall accuracy. Figures 3, 4 show the confusion matrices for the two models. The diagonals in the two matrices show the correctly classified instances and the other indices show the incorrectly classified instances. Based on the confusion matrices, the performance metrics listed in Table 2 were calculated for each class. Table 3 shows the calculated performance metrics. It can be observed that the performance metrics of the RF model outperformed the Xgb model in most performance metrics for each class. Hence the RF model was selected as the best model.
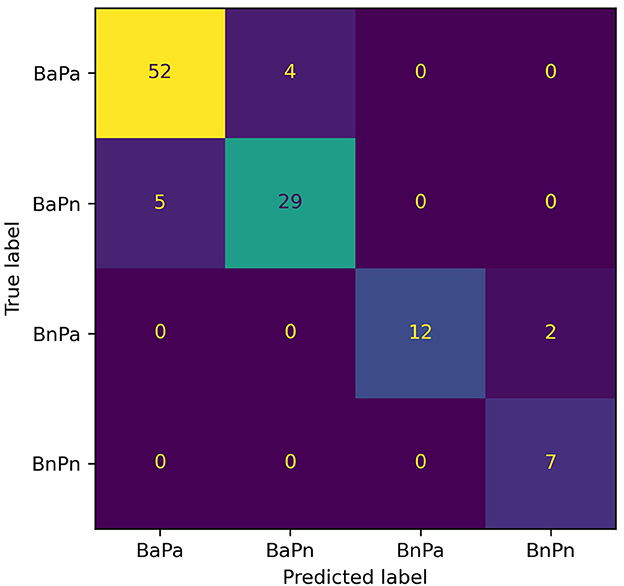
Figure 3. Confusion matrix for the RF model for Experiment 2. The diagonal shows the correctly classified data instances while the off-diagonal shows the incorrectly classified instances. BaPa, behaviorally abnormal and physiologically abnormal; BaPn- behaviorally abnormal and physiologically normal; BnPa, behaviorally normal and physiologically abnormal; BnPn, behaviorally normal and physiologically normal.
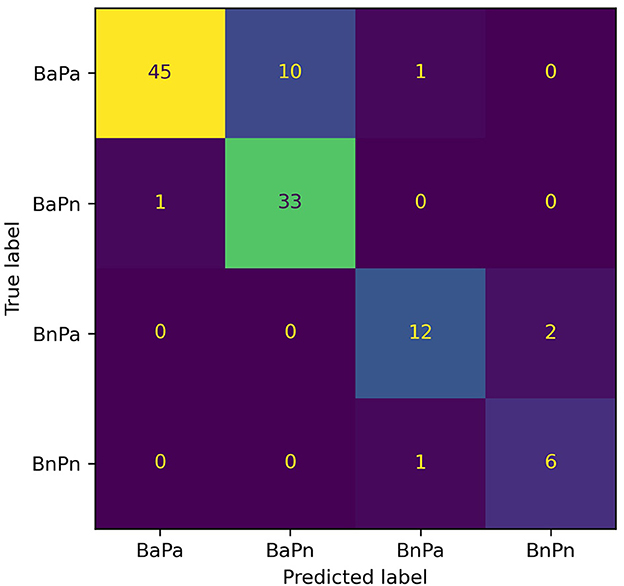
Figure 4. Confusion matrix for the Xgb model for Experiment 2. The diagonal shows the correctly classified data instances while the off-diagonal shows the incorrectly classified instances. BaPa, behaviorally abnormal and physiologically abnormal; BaPn, behaviorally abnormal and physiologically normal; BnPa, behaviorally normal and physiologically abnormal; BnPn, behaviorally normal and physiologically normal.
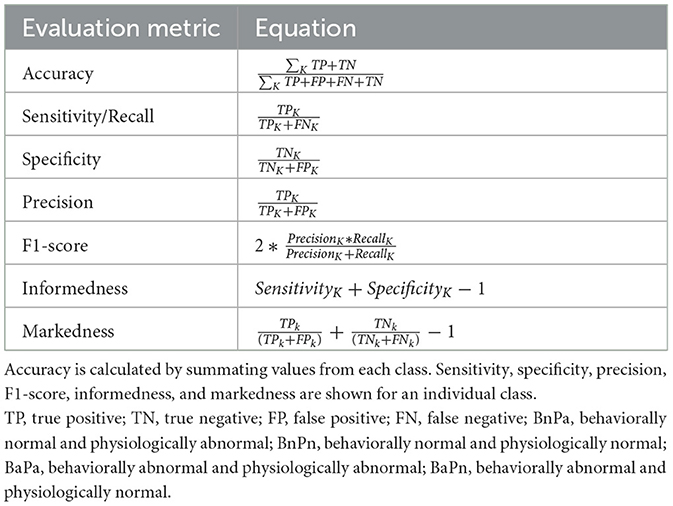
Table 2. Equations used to calculate the evaluation metrics. The k in the equations indicates a class (either BaPa, BaPn, BnPa, or BnPn).
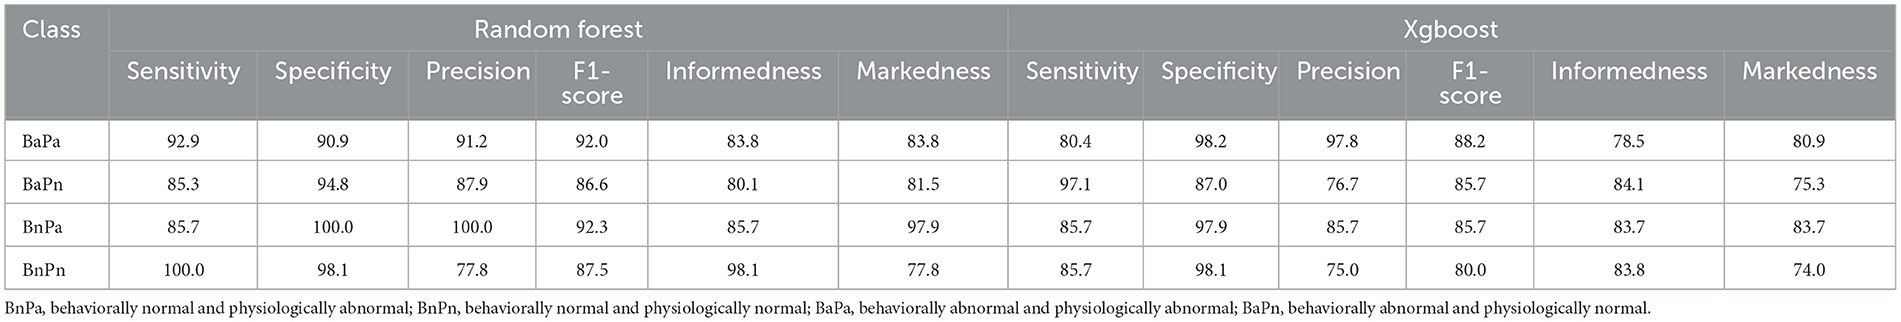
Table 3. Evaluation metrics of Random Forest and Xgboost models of Experiment 2. All the values in the table are in percentages.
The SHAP interpretations for the selected best-performing model, RF, are shown in Figure 5. The x-axis in the plot shows the mean SHAP values for each feature on the y-axis. The features on the y-axis are ordered from highest to lowest impact, from top to bottom. Each bar shows the contribution from each of the four APD sub-groups. A higher mean SHAP scores that the feature is largely contributing to the outcome of the model. The features contributing to the outcome the most were the SSW scores, and the features contributing the least were the right and left contralateral acoustic reflexes. From the physiological hearing test battery, the features derived from cortical responses were ranked higher compared to ABR features. From the acoustic reflexes, the ipsilateral recordings of both right and left ears were ranked higher compared to the contralateral recordings. The amplitude modulation at 20 Hz and gap detection from psychoacoustics showed higher mean SHAP values compared to frequency discrimination.
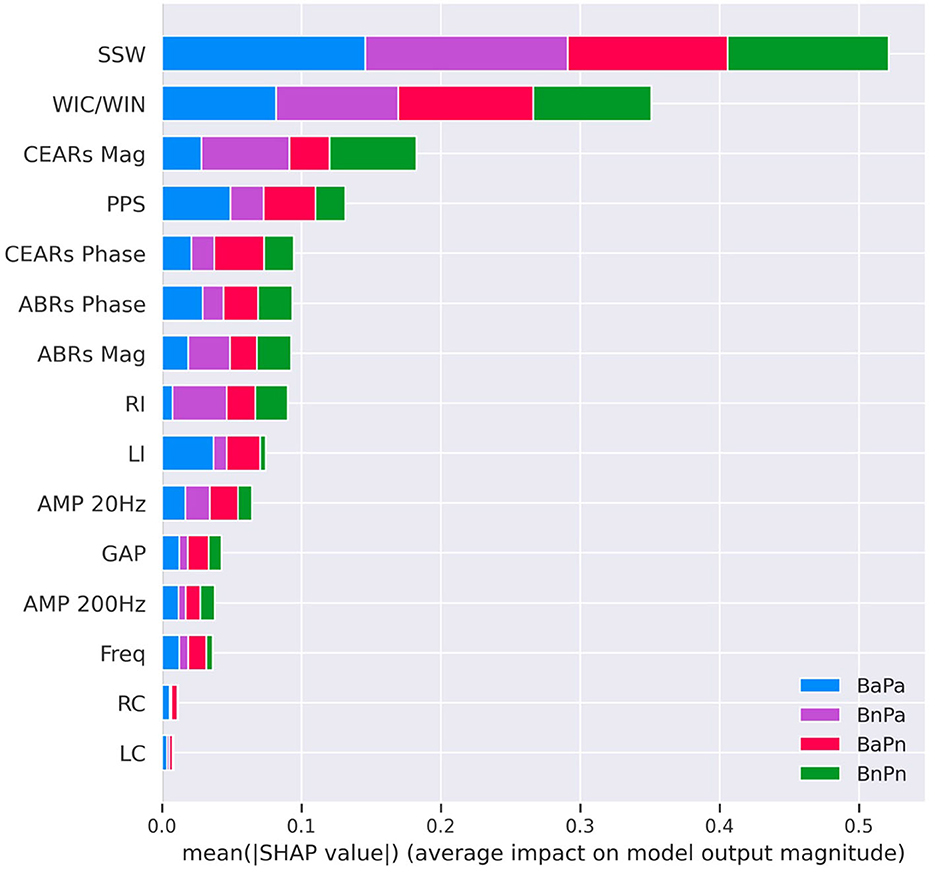
Figure 5. SHAP interpretations for the Random Forest model for Experiment 2. This was the best-performing model with an accuracy value of 90.1%. The X-axis of the diagram shows the mean SHAP values, and the y-axis shows the features contained in the model ordered from highest (top) to lowest (bottom) mean SHAP value. Each bar represents a combination of average values of the contribution from each subgroup. SSW, staggered spondaic word; WIC, word in competing; WIN, word in noise; CEARs, cortical evoked auditory responses; ABR, auditory brainstem responses; Mag, magnitude; PPS, pitch pattern sequence; BnPa, behaviorally normal and physiologically abnormal; BnPn, behaviorally normal and physiologically normal; BaPa, behaviorally abnormal and physiologically abnormal; BaPn, behaviorally abnormal and physiologically normal; LI, left Ipsi; RI, right Ipsi; LC, left contra; RC, right contra; GAP, GAP detection; AMP, AMPlitude modulation; Freq, frequency detection.
The present work explored the use of supervised ML techniques to analyze data collected from children suspected of APD from a period of approximately six years. We determined RF and Xgb models to be the best suited for this study as they are both ensemble learning models that can perform well with small datasets. Data augmentation techniques can be used to improve the performance of ML models trained with small datasets. Here, we used the CTGAN augmentation technique (Xu et al., 2019). We found no significant difference in using CTGAN in conjunction with either the RF or Xgb models. CTGAN did significantly improve the results when used with a Neural Network. The accuracy of the neural network model without CTGAN for Experiments 1 and 2 were 51(±0.02) and 0.50(±0.04)%, respectively. The accuracies were improved to 69(±0.02)% for Experiment 1 and 70(±0.02)% for Experiment 2 with CTGAN. However, the accuracy obtained for Neural Network models was lower overall compared to RF and Xgb models.
The assessment of hearing thresholds is conducted early in the AP testing battery, and if a child passes each threshold, they are tested on the remainder of the battery. In this study, all children showed hearing thresholds (at conventional frequencies 250–8,000 Hz) within normal limits, and there were no considerable differences in hearing thresholds across the population. The ML results indicated that hearing thresholds showed the least impact on the outcome of the models. The features that were shown to impact the outcome of the models the most based on SHAP interpretations were derived from the behavioral tests. The SSW ranked first in both experiments, indicating that it impacted the outcome of the models the most. This is consistent with the literature, in which the SSW test is identified as a standard test for the auditory processing assessment (Emanuel et al., 2011). This consistency further indicates that ML models can comply with expert knowledge.
The inclusion of cortical responses in the physiological hearing assessments provided additional information about the neurophysiology of the auditory system. However, certain test batteries do not include an assessment of cortical responses. Through our experiments, we noted that features derived from cortical responses largely contributed to the output of the models, as indicated by the SHAP interpretations. The features derived from CWT represent a summary of peak amplitudes and latencies. Even though the dataset with cortical features was smaller, the accuracy of both the RF and Xgb models was higher compared to the dataset without cortical features (Experiment 1). The extracted features suggested that cortical evoked responses provided significant information about auditory processing in these children. The emerging literature also suggests that cortical evoked responses are atypical in children referred for an auditory processing evaluation (Barker et al., 2017; Hussain et al., 2022). It is therefore recommended to evaluate cortical responses in the APD assessment and include these features in future studies that aim to use ML for automating APD diagnosis. Currently, it is not clear about the effect of maturation, morphology, and inter-subject variability in cortical evoked responses on these features. Hence, a thorough study of the features with a larger dataset is required in the future. It will help clinical understanding and the Machine Learning model reach higher accuracies.
The ipsilateral acoustic reflexes from the physiological hearing test battery also contributed largely to the model outcome compared to the contralateral reflexes based on the SHAP interpretations. In exploring the data, only a few children had elevated thresholds reflected through ipsilateral reflexes, and most children showed reflex thresholds within the normal limits overall.
Psychoacoustic tests use non-speech stimuli and can be used to validate the results of behavioral tests. The data from these tests were included in Experiment 2. However, the contribution from psychoacoustic tests was lesser compared to the behavioral assessments that used speech stimuli and the physiological tests. In the final model, amplitude modulation detection at 20 Hz and GAP detection were the tests that provided the most impact to the model outcome compared to the frequency detection and amplitude modulation detection at 200 Hz. After discussing with clinicians, it was found that sometimes children have difficulties with performing the frequency detection test compared to GAP in noise. In addition, detecting amplitude modulation at 20 Hz is easier compared to 200 Hz. Hence, this was further evidence that the model can be used to output accurate predictions in accordance with current clinical knowledge.
There are only a few studies in the literature that use ML techniques to analyze APD data in children (Strauss et al., 2004; Sharma et al., 2019; Cassandro et al., 2021). Sharma et al. (2019) used behavioral assessments data to cluster APD children into four sub-groups using hierarchical clustering techniques. The auditory processing assessments used by Sharma et al. (2019) were different than those used in the present study; we used both behavioral and physiological data, as recommended by [American Speech-Language-Hearing Association (ASHA), 2005]. The sub-groups identified by Sharma et al. (2019) have very few similarities to those identified in the present study. However, the group identified as “global deficit” is similar to the group we identify as “behaviorally abnormal and physiologically abnormal (BaPa),” where all assessments are outside of the normal thresholds. The study conducted by Strauss et al. (2004) used the β-waveform of the binaural interaction component in auditory brainstem responses along with a support vector machine model to detect APD in children. The study did not identify subgroups in the data, but rather aimed to identify children at risk for APD from those not at risk. Cassandro et al. (2021) have used cluster analysis to identify issues in students tested for dyslexia accompanied by poor auditory skills. Out of the four participants in the cluster who had poor audiometric profiles and were suspected of APD, only one subject was identified as APD.
The clinical workflow used here can be adopted in future work aiming to study APD data as we followed a comprehensive test battery based on ASHA guidelines. The use of ML techniques discussed in this paper may also be applied to future studies aiming to develop automated platforms to assess other clinical test batteries. Since this study focused on the technical aspects of ML, we did not discuss the clinical management of the identified sub-groups in detail. This would require further work by clinicians and researchers. However, we believe our study may aid such discussions as we have presented an objective tool to categorize children with APD into clinical sub-groups. We have further revealed the contribution of each assessment contained in the AP test battery on the model outcomes. It should be noted that the use of ML tools are meant to complement rather than replace clinical decision making.
There are relatively few referrals made for APD assessments in children and there is no definitive way to determine how much data is needed for an ML experiment before collecting the data. Our experiments were done based on the limited data we had available. Hence, the sample size of the clinical population is the main limitation of our study. A larger dataset will ensure improved generalization, model performance, stability, and validity in machine learning models. Future studies should be conducted with a larger data set in children referred for an auditory processing evaluation. A wide variety of complex algorithms, such as deep neural networks, could be explored with larger datasets which will help to derive a strong understanding of the clinical problem and reduce the number of tests used in the diagnosis. Hence, this study can be viewed as exploratory, where future studies may adopt our methods from both clinical and ML workflows. Future studies may explore solutions to the difficulties associated with collecting APD datasets such as forming larger, multi-center collaborations. One such solution may be the use of a federated ML system, in which researchers for different centers may contribute training data to the same model without exposing personal information (Yang et al., 2019).
The purpose of this study was to explore the use of ML techniques as a potential tool to aid in the analysis of the AP test battery. Data from children suspected of APD were classified into clinical sub-groups based on their performances on both behavioral and physiological hearing assessments. The RF model was shown to perform the best, with an average accuracy of 90%, an average sensitivity of 91%, and an average specificity of 96% for all sub-groups. The model was able to identify the critical subgroup BaPa, in which children performed poorly in both behavioral and physiological assessments, with a sensitivity and specificity of 93 and 91%, respectively. The group that performed within normal limits in the test set (BnPn) were correctly identified with a sensitivity and specificity of 100 and 98%, respectively. This study further highlighted the utility of each individual test contained within the AP test battery in making predictions that agree with clinical understanding.
The data analyzed in this study is subject to the following licenses/restrictions: the data used in this study are not publicly available due to ethical concerns regarding participant privacy and confidentiality. Requests to access these datasets should be directed to aHdpbWFsYXJAdXdvLmNh.
The studies involving human participants were reviewed and approved by Western University Research Ethics Board, University of Western, London, Ontario, Canada. Written informed consent to participate in this study was provided by the participants' legal guardian/next of kin.
HW: conceptualization, methodology, software, data curation, writing—original draft, validation, writing—review and editing, and visualization. SA-V: conceptualization, validation, formal analysis, investigation, data curation, and writing—review and editing. MD: conceptualization, data curation, formal analysis, investigation, and writing—review and editing. CA: conceptualization, validation, investigation, resources, data curation, writing—review and editing, supervision, and project administration. SA: conceptualization, writing—review and editing, supervision, and funding acquisition. PA: conceptualization, validation, formal analysis, resources, data curation, writing—review and editing, supervision, project administration, and funding acquisition. JS and HL: conceptualization, validation, resources, writing—review and editing, supervision, and funding acquisition. All authors contributed to the article and approved the submitted version.
Funding was provided by the Natural Sciences and Engineering Council of Canada (NSERC-RGPIN-2017-04755) and Ontario Research Fund (ORF-RE08-072).
The authors greatly appreciate the support provided by Lauren Siegel for manuscript editing and review.
The authors declare that the research was conducted in the absence of any commercial or financial relationships that could be construed as a potential conflict of interest.
All claims expressed in this article are solely those of the authors and do not necessarily represent those of their affiliated organizations, or those of the publisher, the editors and the reviewers. Any product that may be evaluated in this article, or claim that may be made by its manufacturer, is not guaranteed or endorsed by the publisher.
1. ^The word abnormal indicates the performance of the child in the auditory processing test battery fell at least two standard deviations below that of typically developing children. This is valid for any place the word “abnormal” is used in the paper.
2. ^Spondees are terms that accommodate two equally stressed syllables.
Agrawal, D., Dritsakis, G., Mahon, M., Mountjoy, A., and Bamiou, D. E. (2021). Experiences of patients with auditory processing disorder in getting support in health, education, and work settings: findings from an online survey. Front. Neurol. 12:607907. doi: 10.3389/fneur.2021.607907
Ahmad, M. A., Eckert, C., and Teredesai, A. (2018). “Interpretable machine learning in healthcare,” in Proceedings of the 2018 ACM International Conference on Bioinformatics, Computational Biology, and Health Informatics, 559–560. doi: 10.1145/3233547.3233667
Allen, P., and Allan, C. (2014). Auditory processing disorders: relationship to cognitive processes and underlying auditory neural integrity. Int. J. Pediatr. Otorhinolaryngol. 78, 198–208. doi: 10.1016/j.ijporl.2013.10.048
Alom, M. Z., Taha, T. M., Yakopcic, C., Westberg, S., Sidike, P., Nasrin, M. S., et al. (2019). A state-of-the-art survey on deep learning theory and architectures. Electronics 8:292. doi: 10.3390/electronics8030292
American Speech-Language-Hearing Association (ASHA) (2005). Central auditory processing disorders, Technical report. Available online at: www.asha.org/policy (accessed December 20, 2021).
American Speech-Language-Hearing Association (ASHA) (1970). Guidelines for Fitting and Monitoring FM Systems. Available online at: https://www.asha.org/policy/GL2002-00010/ (retrieved February 18, 2022).
Auslander, N., Gussow, A. B., and Koonin, E. V. (2021). Incorporating machine learning into established bioinformatics frameworks. Int. J. Mol. Sci. 22:2903. doi: 10.3390/ijms22062903
Bagheri, R. (2022). Introduction to Shap Values and Their Application in Machine Learning. Available online at: https://towardsdatascience.com/introduction-to-shap-values-and-their-application-in-machine-learning-8003718e6827 (retrieved April 05, 2022).
Bamiou, D.-E., Musiek, F., and Luxon, L. (2001). Aetiology and clinical presentations of auditory processing disorders?a review. Arch. Dis. Childh. 85, 361–365. doi: 10.1136/adc.85.5.361
Barker, M. D., Kuruvilla-Mathew, A., and Purdy, S. C. (2017). Cortical auditory-evoked potential and behavioral evidence for differences in auditory processing between good and poor readers. J. Am. Acad. Audiol. 28, 534–545. doi: 10.3766/jaaa.16054
Bellis, T. J., and Ferre, J. M. (1999). Multidimensional approach to the differential diagnosis of central auditory processing disorders in children. J. Am. Acad. Audiol. 10, 319–328. doi: 10.1055/s-0042-1748503
Bergstra, J., and Bengio, Y. (2012). Random search for hyper-parameter optimization. J. Mach. Learn. Res. 13, 281–305.
Brownlee, J. (2020a). 8 Tactics to Combat Imbalanced Classes in Your Machine Learning Dataset. Available online at: https://machinelearningmastery.com/tactics-to-combat-imbalanced-classes-in-your-machine-learning-dataset/ (retrieved June 9, 2022).
Brownlee, J. (2020b). How to Fix k-Fold Cross-Validation for Imbalanced Classification. Available online at: https://machinelearningmastery.com/cross-validation-for-imbalanced-classification/ (retrieved November 15, 2021).
Cassandro, C., Manassero, A., Landi, V., Aschero, G., Lovallo, S., Albera, A., et al. (2021). Auditory processing disorders: diagnostic and therapeutic challenge. Otorhinolaryngology 71, 120–124. doi: 10.23736/S2724-6302.21.02387-2
Chawla, N. V., Bowyer, K. W., Hall, L. O., and Kegelmeyer, W. P. (2002). Smote: synthetic minority over-sampling technique. J. Artif. Intell. Res. 16, 321–357. doi: 10.1613/jair.953
Chermak, G. D. (2002). Deciphering auditory processing disorders in children. Otolaryngol. Clin. N. Am. 35, 733–749. doi: 10.1016/S0030-6665(02)00056-7
Chermak, G. D., Musiek, F. E., and Craig, C. H. (1997). Central Auditory Processing Disorders: New Perspectives. Singular. 370–376.
Cline, L. (2001). CAPD Technical Assistance Paper. Technical report. Florida Department of Education. Available online at: https://www.aitinstitute.org/CAPD_technical_assistance_paper.pdf (retrived 4 January 2022).
Davenport, T., and Kalakota, R. (2019). The potential for artificial intelligence in healthcare. Fut. Healthc. J. 6, 94–98. doi: 10.7861/futurehosp.6-2-94
Emanuel, D. C., Ficca, K. N., and Korczak, P. (2011). Survey of the diagnosis and management of auditory processing disorder. Am. J. Audiol. 20, 48–60. doi: 10.1044/1059-0889(2011/10-0019)
Freund, Y., and Schapire, R. E. (1996). “Experiments with a new boosting algorithm,” in ICML, Vol. 96, 148–156.
Grandini, M., Bagli, E., and Visani, G. (2020). Metrics for multi-class classification: an overview. arXiv:2008.05756. doi: 10.48550/arXiv.2008.05756
Hornickel, J., Zecker, S. G., Bradlow, A. R., and Kraus, N. (2012). Assistive listening devices drive neuroplasticity in children with dyslexia. Proc. Natl. Acad. Sci. U.S.A. 109, 16731–16736. doi: 10.1073/pnas.1206628109
Hussain, R. O., Kumar, P., and Singh, N. K. (2022). Subcortical and cortical electrophysiological measures in children with speech-in-noise deficits associated with auditory processing disorders. J. Speech Lang. Hear. Res. 65, 4454–4468. doi: 10.1044/2022_JSLHR-22-00094
Iliadou, V. V., Chermak, G. D., Bamiou, D.-E., and Musiek, F. E. (2019). Gold standard, evidence-based approach to diagnosing APD. Hear. J. 72, 42–45. doi: 10.1097/01.HJ.0000553582.69724.78
Iliadou, V. V., Ptok, M., Grech, H., Pedersen, E. R., Brechmann, A., Deggouj, N., et al. (2017). A European perspective on auditory processing disorder-current knowledge and future research focus. Front. Neurol. 2017:622. doi: 10.3389/fneur.2017.00622
Iliadou, V. V., Ptok, M., Grech, H., Pedersen, E. R., Brechmann, A., Deggouj, N., et al. (2018). European 17 countries consensus endorses more approaches to APD than reported in Wilson 2018. Int. J. Audiol. 57, 395–396. doi: 10.1080/14992027.2018.1442937
Ivey, R. (1969). Words in ipsilateral competition (WIC) (Unpublished Master Thesis). Colorado State University, Fort Collins, CO, United States.
Johnston, K. N., John, A. B., Kreisman, N. V., Hall, J. W. III., Crandell, C. C., Johnston, K. N., et al. (2009). Multiple benefits of personal FM system use by children with auditory processing disorder (APD). Int. J. Audiol. 48, 371–383. doi: 10.1080/14992020802687516
Karanam (2021). Available online at: https://towardsdatascience.com/curse-of-dimensionality-a-curse-to-machine-learningc122ee33bfeb (accessed December 5, 2021).
Keith, W. J., and Purdy, S. C. (2014). “Assistive and therapeutic effects of amplification for auditory processing disorder,” in Seminars in Hearing, Vol. 35 (Thieme Medical Publishers), 27–38. doi: 10.1055/s-0033-1363522
Lee, G., Gommers, R., Waselewski, F., Wohlfahrt, K., and O'Leary, A. (2019). Pywavelets: A python package for wavelet analysis. J. Open Source Softw. 4:1237. doi: 10.21105/joss.01237
Lundberg, S. M., and Lee, S.-I. (2017). “A unified approach to interpreting model predictions,” in Advances in Neural Information Processing Systems, eds I. Guyon, U. Von Luxburg, S. Bengio, H. Wallach, R. Fergus, S. Vishwanathan, and R. Garnett (Curran Associates), 30.
Maheswari, J. P. (2019). Breaking the Curse of Small Datasets in Machine Learning: Part 1. Available online at: https://towardsdatascience.com/breaking-the-curse-of-small-datasets-in-machine-learning-part-1-36f28b0c044d (retrieved December 10, 2021).
Mazzanti, S. (2020). Shap values explained exactly how you wished someone explained to you. Towards Data Sci. 3:2020. Available online at: https://towardsdatascience.com/shap-explained-the-way-i-wish-someone-explained-it-to-meab81cc69ef30 (retrieved December 11, 2021).
Mckinney, W. (2011). Pandas: a Foundational Python Library for Data Analysis and Statistics. Available online at: https://www.dlr.de/sc/en/Portaldata/15/Resources/dokumente/pyhpc2011/submissions/pyhpc2011_submission_9.pdf
Menon, S. (2020). Stratified sampling in machine learning. Available online at: https://medium.com/analytics-vidhya/stratified-sampling-in-machine-learning-f5112b5b9cfe-
Moore, D. R., Sieswerda, S. L., Grainger, M. M., Bowling, A., Smith, N., Perdew, A., et al. (2018). Referral and diagnosis of developmental auditory processing disorder in a large, United States hospital-based audiology service. J. Am. Acad. Audiol. 29, 364–377. doi: 10.3766/jaaa.16130
Nagao, K., Riegner, T., Padilla, J., Greenwood, L. A., Loson, J., Zavala, S., and Morlet, T. (2016). Prevalence of auditory processing disorder in school-aged children in the mid-Atlantic region. J. Am. Acad. Audiol. 27, 691–700. doi: 10.3766/jaaa.15020
Odegua, R. (2019). “An empirical study of ensemble techniques (bagging, boosting and stacking),” in Proc. Conf. Deep Learn (IndabaXAt).
Papastefanopoulos, V., Kotsiantis, S., and Linardatos, P. (2021). Explainable AI: a review of machine learning interpretability methods. Entropy 23, 1–45. doi: 10.3390/e23010018
Pedregosa, F., Varoquaux, G., Gramfort, A., Michel, V., Thirion, B., Grisel, O., et al. (2011). Scikit-learn: machine learning in python. J. Mach. Learn. Res. 12, 2825–2830. doi: 10.5555/1953048.2078195
Pinheiro, M. L. (1977). Tests of central auditory function in children with learning disabilities. Central Audit. Dysfunct. 223–256.
Powers, D. M. (2020). Evaluation: from precision, recall and f-measure to roc, informedness, markedness and correlation. arXiv preprint arXiv:2010.16061. doi: 10.48550/arXiv.2010.16061
Rance, G., Saunders, K., Carew, P., Johansson, M., and Tan, J. (2014). The use of listening devices to ameliorate auditory deficit in children with autism. J. Pediatr. 164, 352–357. doi: 10.1016/j.jpeds.2013.09.041
Rokach, L. (2019). Ensemble Learning: Pattern Classification Using Ensemble Methods. World Scientific. doi: 10.1142/11325
Rudin, C. (2019). Stop explaining black box machine learning models for high stakes decisions and use interpretable models instead. Nat. Mach. Intell. 1, 206–215. doi: 10.1038/s42256-019-0048-x
Schapire, R. E. (1990). The strength of weak learnability. Mach. Learn. 5, 197–227. doi: 10.1007/BF00116037
Scheff, S. W. (2016). Fundamental Statistical Principles for the Neurobiologist: A Survival Guide. Academic Press.
Sharma, M., Purdy, S. C., and Humburg, P. (2019). Cluster analyses reveals subgroups of children with suspected auditory processing disorders. Front. Psychol. 10:2481. doi: 10.3389/fpsyg.2019.02481
Sharma, M., Purdy, S. C., and Kelly, A. S. (2009). Comorbidity of auditory processing, language, and reading disorders. J. Speech Lang. Hear. Res. 52, 706–722. doi: 10.1044/1092-4388(2008/07-0226)
Sharma, M., Purdy, S. C., and Kelly, A. S. (2012). A randomized control trial of interventions in school-aged children with auditory processing disorders. Int. J. Audiol. 51, 506–518. doi: 10.3109/14992027.2012.670272
Shmueli, B. (2019). Multi-Class Metrics Made Simple, Part 1: Precision and Recall. Available online at: https://towardsdatascience.com/multi-class-metrics-made-simple-part-i-precision-and-recall-9250280bddc2
Smart, J. L., Purdy, S. C., and Kelly, A. S. (2018). Impact of personal frequency modulation systems on behavioral and cortical auditory evoked potential measures of auditory processing and classroom listening in school-aged children with auditory processing disorder. J. Am. Acad. Audiol. 29, 568–586. doi: 10.3766/jaaa.16074
Starr, A., and Achor, L. J. (1975). Auditory brain stem responses in neurological disease. Arch. Neurol. 32, 761–768. doi: 10.1001/archneur.1975.00490530083009
Strauss, D., Delb, W., and Plinkert, P. (2004). Objective detection of the central auditory processing disorder: a new machine learning approach. IEEE Trans. Biomed. Eng. 51, 1147–1155. doi: 10.1109/TBME.2004.827948
Torrence, C., and Compo, G. P. (1998). A practical guide to wavelet analysis. Bull. Am. Meteorol. Soc. 79, 61–78. doi: 10.1175/1520-0477(1998)079<0061:APGTWA>2.0.CO;2
Weihing, J., Chermak, G. D., and Musiek, F. E. (2015). Auditory training for central auditory processing disorder. Semin. Hear. 36, 199–215. doi: 10.1055/s-0035-1564458
Wilson, R. H. (2003). Development of a speech-in-multitalker-babble paradigm to assess word-recognition performance. J. Am. Acad. Audiol. 14, 453–470. doi: 10.1055/s-0040-1715938
Wimalarathna, H., Ankmnal-Veeranna, S., Allan, C., Agrawal, S. K., Allen, P., Samarabandu, J., et al. (2021). Comparison of machine learning models to classify auditory brainstem responses recorded from children with auditory processing disorder. Comput. Methods Prog. Biomed. 200:105942. doi: 10.1016/j.cmpb.2021.105942
Xu, L., Skoularidou, M., Cuesta-Infante, A., and Veeramachaneni, K. (2019). “Modeling tabular data using conditional GAN,” in Advances in Neural Information Processing Systems, 32.
Yang, Q., Liu, Y., Chen, T., and Tong, Y. (2019). Federated machine learning: concept and applications. ACM Trans. Intell. Syst. Technol. 10, 1–19. doi: 10.1145/3298981
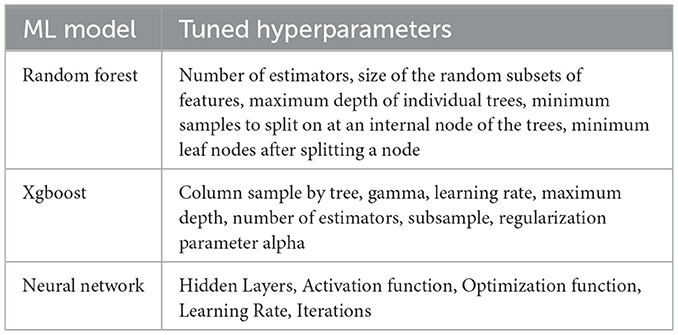
Table A1. Tuned hyperparameters of Machine Learning models used in the study.
Keywords: auditory processing disorder, clinical data mining, audiology, hearing disorders, machine learning
Citation: Wimalarathna H, Ankmnal-Veeranna S, Duong M, Allan C, Agrawal SK, Allen P, Samarabandu J and Ladak HM (2023) Using machine learning to assist auditory processing evaluation. Front. Audiol. Otol. 1:1215965. doi: 10.3389/fauot.2023.1215965
Received: 02 May 2023; Accepted: 05 July 2023;
Published: 21 July 2023.
Edited by:
Laura Coco, San Diego State University, United StatesReviewed by:
Marc Lammers, Antwerp University Hospital, BelgiumCopyright © 2023 Wimalarathna, Ankmnal-Veeranna, Duong, Allan, Agrawal, Allen, Samarabandu and Ladak. This is an open-access article distributed under the terms of the Creative Commons Attribution License (CC BY). The use, distribution or reproduction in other forums is permitted, provided the original author(s) and the copyright owner(s) are credited and that the original publication in this journal is cited, in accordance with accepted academic practice. No use, distribution or reproduction is permitted which does not comply with these terms.
*Correspondence: Hasitha Wimalarathna, aHdpbWFsYXJAdXdvLmNh
Disclaimer: All claims expressed in this article are solely those of the authors and do not necessarily represent those of their affiliated organizations, or those of the publisher, the editors and the reviewers. Any product that may be evaluated in this article or claim that may be made by its manufacturer is not guaranteed or endorsed by the publisher.
Research integrity at Frontiers
Learn more about the work of our research integrity team to safeguard the quality of each article we publish.