 Jacob A. Cram
 Alexandra J. McCarty
 Stacey M. Willey
 Stephanie T. Alexander
- Horn Point Laboratory, Center for Environmental Science, University of Maryland, College Park, MD, United States
Hatcheries nationwide suffer from unexplained acute production failures, termed crashes. The microbiota of oysters relates to larval health with previous studies showing that some bacterial species have positive and others negative effects on oyster health. To investigate microbial correlates of crashes, we collected samples from every batch of oyster larvae (Crassostrea virginica) produced by the Horn Point Laboratory Oyster Hatchery since 2021 and analyzed the microbiota of 15 of those batches over their duration in the hatchery, from age of 3 to 5 days until either harvest or complete die off of the batch. Across events, die-offs generally became evident at or after six days of age. We found that the microbiota of oyster larvae appears to respond to die-off events with crashed batches having fundamentally different microbiota than good batches at age 7 to 9 and 9 to 12 days. Crashed batches were often taken over by microeukaryotes and bacterial taxa from the Protobacteria and Bacteroidetes phyla. However, this presumably opportunistic community differed between batches. Observed Vibrio species level groups did not appear to be oyster pathogens and appeared to respond to, rather than precede, crashes. The microbiota of 3 to 5 day old larvae were statistically related to whether a die-off occurred later in the larval batches’ life, only when the taxa were first agglomerated to family level. The detection of two microbial species not previously known to associate with oysters, along with an increased presence of Dinophyceae, predominantly the toxin-producing Gyrodinium jinhaense, in 3 to 5 day old oyster larvae was statistically linked with subsequent batch crashes. This study suggests that the health of larval oysters shapes their microbiome. Conversely, it provides hints that the microbiome of larvae, and perhaps harmful algae, may drive hatchery crashes.
Introduction
Private and government run shellfish hatcheries support oyster aquaculture and restoration efforts by providing farmers and managers with broodstock oyster larvae and spat on shell (Wallace et al., 2008). Although hatchery production has improved immensely over the past several decades (Helm and Millican, 1977; Elston et al., 1981; Urban and Langdon, 1984; Lewis et al., 1988; Robert and Gérard, 1999), hatcheries regularly experience massive unexplained die-off of stock (termed “crashes”) without clear causative factors (Walker, 2017; Gray et al., 2022). Identifying underlying common characteristics of crashes is an important step towards identifying causes merging evidence suggests that one primary characteristic affecting oyster larval health is their microbiota.
Microbial communities are known to modulate the health of a range of animal hosts (Peixoto et al., 2021), including many aquaculture species (Infante-Villamil et al., 2021), and both adult and larval oysters (Yeh et al., 2020). Some bacteria are pathogenic, such as many species of the bacterial genus Vibrio, which have been shown to sicken oyster larvae (Elston and Leibovitz, 1980; Richards et al., 2015). Contrastingly, other bacteria can help their hosts. Additions of probiotic species, including Bacillus pumilus RI06-95 and Phaobacter inhibens S4, have been shown to protect their hosts from Vibrio coralliilyticus infection by shaping the host’s innate immune response (Stevick et al., 2019; Modak and Gomez-Chiarri, 2020). Beyond affecting larval health, bacteria can serve as indicators of changes in the host’s environment and health. For instance, oysters fed compromised microalgae, representing an unhealthy environment, showed both decreased health and a concurrent change in their microbiome (Vignier et al., 2021). Specifically, microbiomes with many species from the Rhodobacteraceae family positively associated with multiple measures of host fitness, while two species of Flavobacteriaceae associated with low fitness (Vignier et al., 2021). Given the importance of microbiota in modulating the health of oysters, it is essential to explore how certain microbiota may relate to observed hatchery crashes in more detail.
Microbial communities in animals and environmental systems, such as hatcheries, are in a state of constant change (Fauci and Dick, 1994; Fuhrman et al., 2015; Bashan et al., 2016; Arora-Williams et al., 2022). Studies have explored the microbial community composition in oyster hatcheries (Le Deuff et al., 1996; Ramachandran et al., 2018; Arfken et al., 2021; Gray et al., 2022) and the dynamics of those communities (Stevick et al., 2019), but these studies focused on single time-point observations or experimental setting rather than normal production conditions over an extended period. Time-series observations offer an advantage over those taken at a single point in time by identifying statistical associations in which one factor changes before the other factor, providing clues about causality (Fuhrman et al., 2015). Specifically, if changes in one variable lead changes in another variable, the lagging variable cannot predict the leading variable. In hatchery crashes, this is important because crashes and microbes both shape each other – microbial changes that happen before crash events are unlikely to be caused by the crash itself and are therefore more likely to shape crashes, or else are associated with another variable that leads to crashes. No previous study of oyster hatcheries has, to our knowledge, addressed the temporal dynamics of the microbial communities that could provide the information necessary to predict hatchery crashes.
The Horn Point Laboratory Oyster Hatchery (HPLOH) is the largest producer of oyster seed (Crassostrea virginica) on the Atlantic Coast of the United States, and experiences slowdowns and halts to its production every year (Gray et al., 2022). These yearly crashes at HPLOH have common characteristics, with most to all of the larvae in a feeding tank ceasing to feed and then dying at the age of 6 to 21 days. While preliminary observations associate low salinity in the oysters’ overwintering location with lower spat yield (Gray et al., 2022), a causal relationship is not established. Preliminary investigation of only two larval batches suggests that microbial communities differed between one crashed and one non-crashed larval batch at HPLOH (Cram et al., 2022; Gray et al., 2022). To more thoroughly assess how microbiota change over time and how these changes relate to crash and non-crash events within HPLOH, we systematically collected samples of larvae and their associated microbiota during every water change at the HPLOH since the beginning of the 2021 growing season. Amplicon sequencing was conducted on a subset of these samples to determine whether the microbiota of the three to five day old larvae were predictive of crashes, as crashes manifest in all larvae over six days of age. Additionally, this study aims to further identify any consistent microbial patterns associated with healthy versus underperforming batches. Our aim was to identify patterns in microbial community structure that are predictive of potential die-offs. Such predictive microorganisms have the potential to help hatcheries defend and prepare to avoid future die-off events.
Materials and methods
Sampling
The Horn Point Laboratory Oyster Hatchery spawns broodstock oysters and transfers fertilized eggs into Mass Larval Tanks (MLT), where they grow normally into pediveliger larvae over a span of 12 or more days. During this time, tank water is changed once every two to three days, which includes collecting the larvae briefly on a sieve. Finally, pediveliger larvae are allowed to settle on shells to form spat, or on shell fragments to produce seed, both of which can be sold or used for restoration.
During the growing season of 2021, we collected samples of ~100 mg of larvae from every MLT tank water change for every batch of oyster larvae, totaling 265 samples from 72 batches. Larvae were collected by filtering water from the MLTs and scraping the larvae collected on the filter mesh with a clean plastic coffee stirrer. The temperature, salinity and pH of hatchery intake water were measured prior to filtration using a YSI Pro 1030 handheld meter. The larval sample was then transferred to a screw-caped 2 ml cryogenic vial pre-loaded with 250 ml of Zymo DNA/RNA shield buffer (#R1100). If there were dead larvae in the hatchery tanks, those were co-isolated on the mesh and collected alongside the living larvae. Hatchery staff quantified the abundance of larvae in each tank during water changes and transfers between tanks. Survivorship curves for each batch in the 2021 season at each time point were generated by counting the number of living larvae plus larvae that had been saved for planting or sale. Batches in which there were fewer than one million larvae surviving to the pediveliger stage were considered “crashes,” while others were considered to be “good.” From the set of all 76 batches, we selected nine batches that crashed and six that were good for amplicon sequencing.
Amplicon sequencing
We sequenced the microbiome from three time points for each of the 15 batches, and additional time-points for one batch that was run for longer than the others, for a total of 51 samples. The three time points collected occurred between days 3 and 5, between days 7 and 8, and between 9 and 12 days of age. DNA was extracted with E.Z.N.A Tissue DNA kits (Omega Bio-Tek SKU: D3396-00S). Samples were then amplified using 515F-926R universal primers, with overhang sequences so that primers can be added with a second amplification step. Thus, for the first round of PCR our primers were Overhang+515FY: 5’: TCGTCGGCAGCGTCAGATGTGTATAAGAGACAGGTGYCAGCMGCCGCGGTAA;
Overhang + 926R: 5’ GTCTCGTGGGCTCGGAGATGTGTATAAGAGACAGCCGYCAATTYMTTTRAGTTT.
Samples were amplified in 25 ul of 1X Accustart master mix; with 0.3mM each of the forward and reverse primers, and 1ng of host DNA. Samples were denatured at 95°C for 120 seconds. Samples then underwent 25 cycles of denaturation (95°C, 45 seconds), annealing (50°C, 45 s), and elongation (68°C, 90 s). There was then a final elongation step at 68°C for 300 seconds. Sample quality was assessed on an agarose gel and cleaned using Ampure XP beads following manufacturer instructions. After cleaning, samples underwent a second round of PCR, with primers containing barcodes and Illumina adapters with the following sequences — Index primer 1: 5’CAAGCAGAAGACGGCATACGAGATXXXXXXXXGTCTCGTGGGCTCGG; Index Primer 2: ATGATACGGCGACCACCGAGATCTACACXXXXXXXXTCGTCGGCAGCGTC.
Xs stand for an eight-base barcode corresponding to Illumina XT i7 and i5 barcodes. All primers were purchased from IDT. These samples were amplified in a 25 ul reaction mixture containing the same concentration of AccuStart master mix and primers, with 7 μl of first round amplification product added. Samples underwent five additional rounds of amplification using the same temperatures as in the first round. Samples were again assessed and cleaned using 10 uL EBT (10mM TREIS ph8, 0.1% Tween20) for the final elution step. Samples were quantified, diluted to a common concentration, pooled alongside barcoded samples from several other projects, and sent to UC Davis DNA technologies core where they were run on an Illumina MiSeq.
Amplicon bioinformatics
Samples were demultiplexed by the sequencing facility and returned to us as plain text, quality scored “FASTQ” files. Amplicon sequence variants, which are genus to species level groups, were called using the DADA2 algorithm (Callahan et al., 2016), following a modified version of the Lee (2019) protocol. In brief, primers were removed from sequences with cutadapt (Martin, 2011). We used the DADA2 `filterandtrim()` algorithm to retain sequences with fewer than one error on the forward read and fewer than two errors on the reverse read, and truncated sequences to 270 sequences in the forward and 200 in the reverse direction. DADA2 was then used to learn error rates, depreplicate identical sequences, call amplicon sequence variants, and to merge forward and reverse reads. Chimeric sequences were then removed. Taxonomy was called using DADA2’s `assignTaxonomy()` function using the Silva database, version 132 (Quast et al., 2013; Yilmaz et al., 2014). This scheme allowed us to classify bacterial, archaeal, and eukaryotic sequences, including host sequences.
Data analysis
We used logistic regression to determine whether median temperature, salinity and pH over the course of a batch were related to whether or not a hatchery crash occurred using the glm function in the R stats package (Team, 2022). We determined the odds ratios of these effects using the `standardize_parameters` function of the `effectsize` R package (Ben-Shachar et al., 2020).
We divided microbial amplicon read counts by the counts of host 18S genes to determine microbe to host gene ratios. These data are more quantitative than relative abundance, and scale with the abundance of each organism relative to host biomass.
We performed canonical correspondence analysis (CCA) to explore whether microbial community structure over the entire dataset was related to the age of the larvae and whether the larvae crashed. For this CCA, gene ratio data was normalized through a square-root transformation. We used a permutation test for CCA, implemented in the vegan package in R (Oksanen et al., 2024), to identify whether the community structure was statistically significantly related to crash status and time.
We also examined whether the microbial community structure differed between crash and non-crash samples at each of the major time-points (3 to 5 day larvae, 7 to 8 day larvae and 10 to 12 day larvae). We tested for associations with crashes after lumping the community data to Phylum, Class, Order, Family, and Genus levels as well as using the original ASV data. To lump the data, we summed the microbe to host gene ratios in each group. Then, the data were square-root transformed and the CCA performed. Again, we used an ANOVA-like permutation test to determine whether the community structure was statistically significantly related to whether the host species crashed. Between the three different time points and seven taxonomic levels, we performed 21 separate CCA analyses. Therefore, we applied a false discovery rate correction (Benjamini and Hochberg, 1995) to adjust for multiple testing.
We then plotted the microbe to host gene ratios of key taxonomic groups over time, focusing at first on the coarsest taxonomic levels, and then looking within course taxonomic groups that seemed to relate to crashes to identify which finer level taxa appeared to drive those patterns. T-tests were used to identify taxa at each taxonomic level that were statistically associated with differences between crashed and healthy batches at each time point. False discovery rate corrections (Benjamini and Hochberg, 1995; Dabney and Storey, 2004) were applied to the T-test data.
Results
Hatchery output varied over the 2021 growing season and was punctuated by die-off events
Over the 2021 growing season, HPLOH produced 4.4 billion pediveliger larvae over 74 batches. Batches began with 0 to 1.7 billion fertilized eggs (0 day old larvae; median: 498 ± median adjusted deviation (MAD): 203) and resulted in 0 to 184 million pediveliger larvae per batch (median: 50.2 million ± MAD: 68.4 million). 15 batches resulted in crashes in which fewer than ten million pediveliger larvae were produced (Supplementary Figure S1). In 7 of these batches, no larvae survived to the pediveliger stage.
We sampled the microbiome of 15 distinct batches from the water changes that happened between days 3 and 5, days 7 and 8, and days 10 and 12. Of these batches, six showed normal production over the lifetime of each batch, producing from 33.1 million to 139 million larvae. The remaining nine batches represented crashes and had between 0 and 5.6 million surviving larvae (Figure 1).
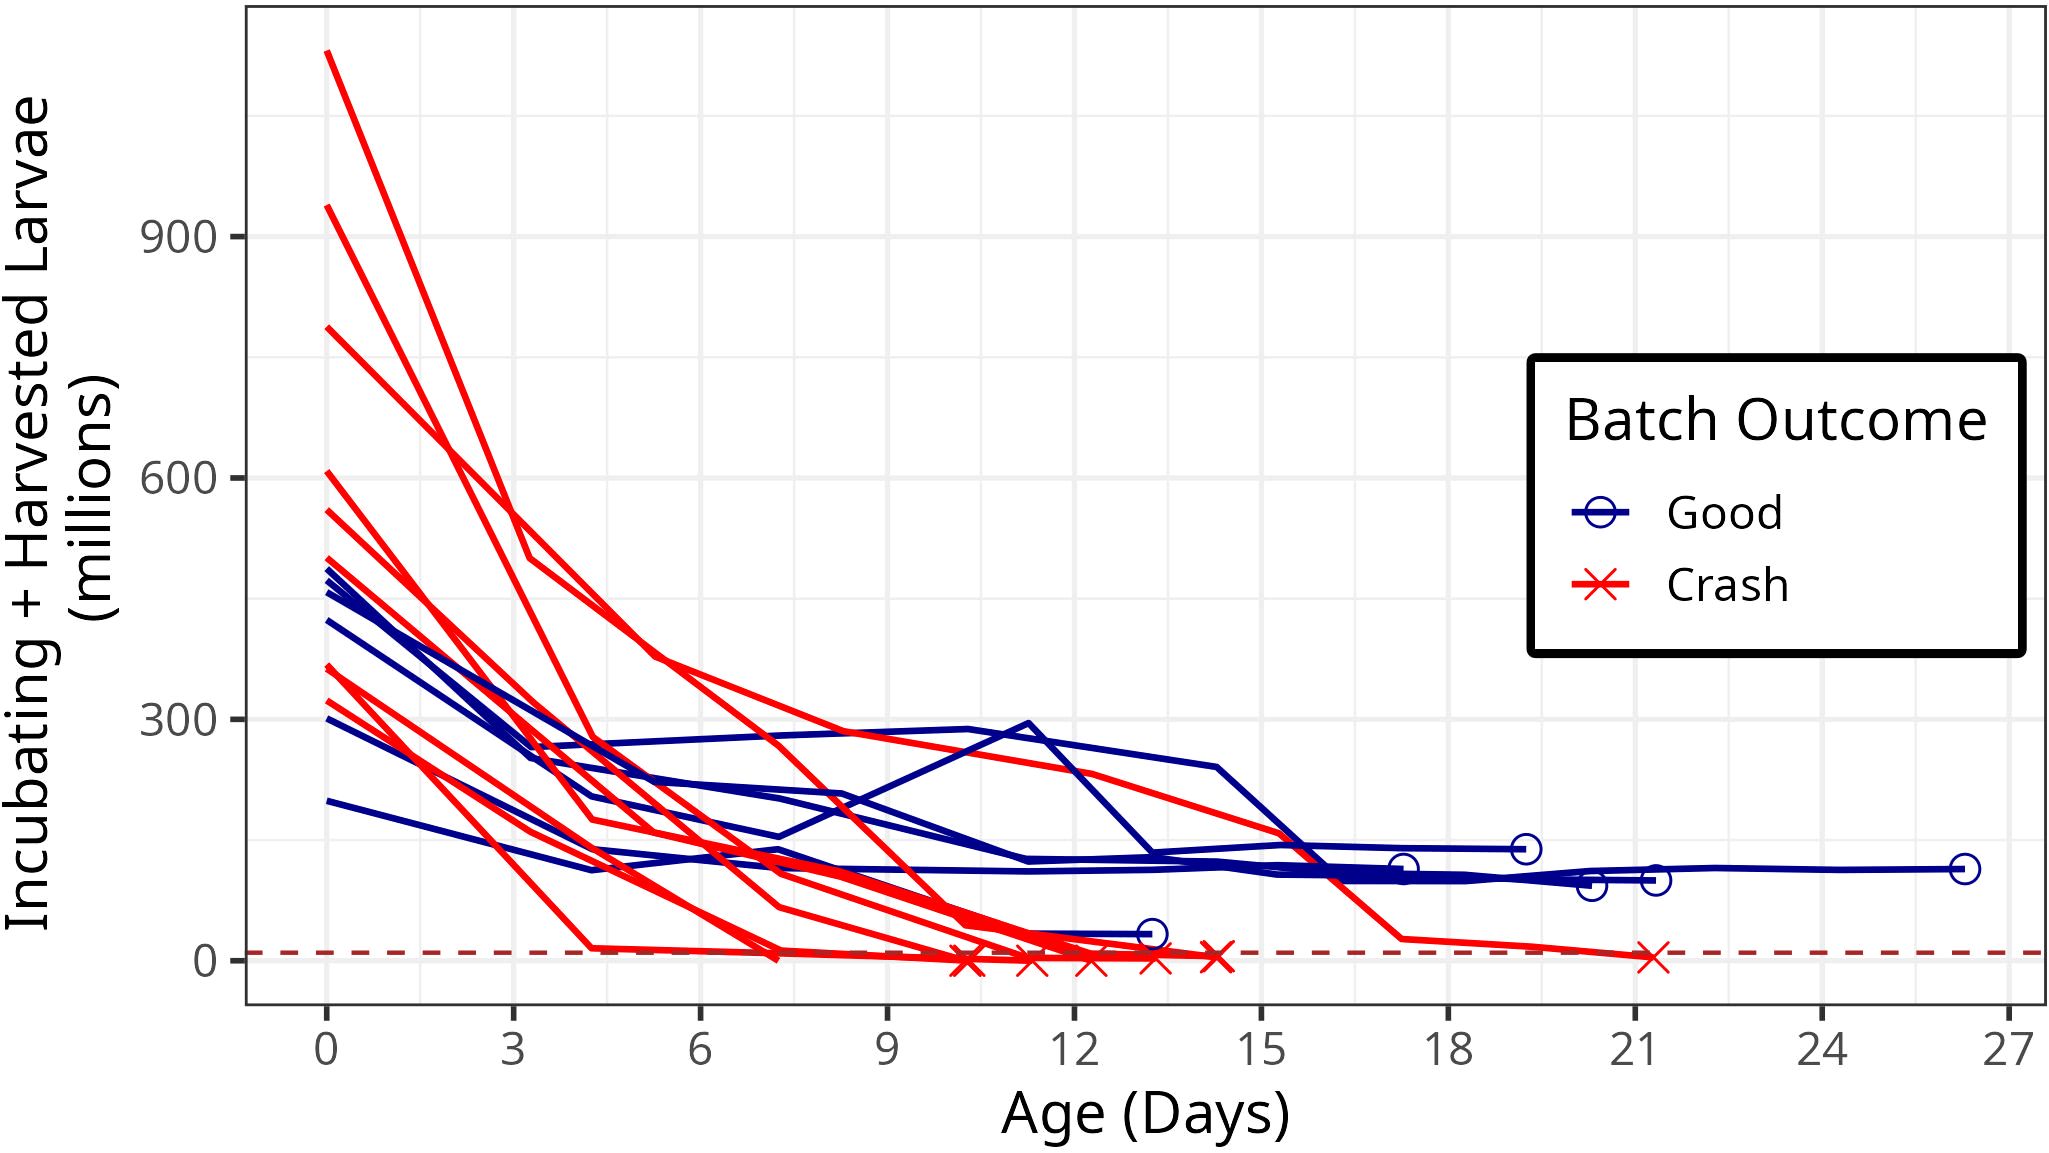
Figure 1. Survivorship curves for the batches of larvae sampled in this experiment. The x-axis shows the age of the larvae in days, and the y axis shows the number of larvae incubating in tanks, plus the number of pediveliger larvae harvested for planting or other purposes. Red curves indicate batches in which there were fewer than ten million larvae that survived to harvest. The dashed brown line indicates ten million larvae.
Crashes are more likely when water is warm and basic
Temperature, salinity and pH all varied across the year, with pH high in April and August, and low in June; salinity lowest in May, and temperature highest in August (Figure 2). A logistic regression model that considered the effects of salinity, temperature and pH together indicated that salinity was not related to the probability of crashes (p = 0.64), temperature was just outside of statistical significance (p = 0.067), while pH was statistically significant (salinity p = 0.064 temperature p = 0.067, pH p = 0.023). Therefore, we reran the linear model excluding salinity. This model showed that both temperature and pH were statistically significantly related to the odds of a crash (temperature p = 0.0009, pH p = 0.002). The odds ratios associated with a one standard deviation (temperature SD = 4.90°C, pH SD = 0.207) increase in both temperature and salinity were large (temp OR = 6.22 [95% CI 2.27 – 20.33], ph OR [2.08 – 19.81]).
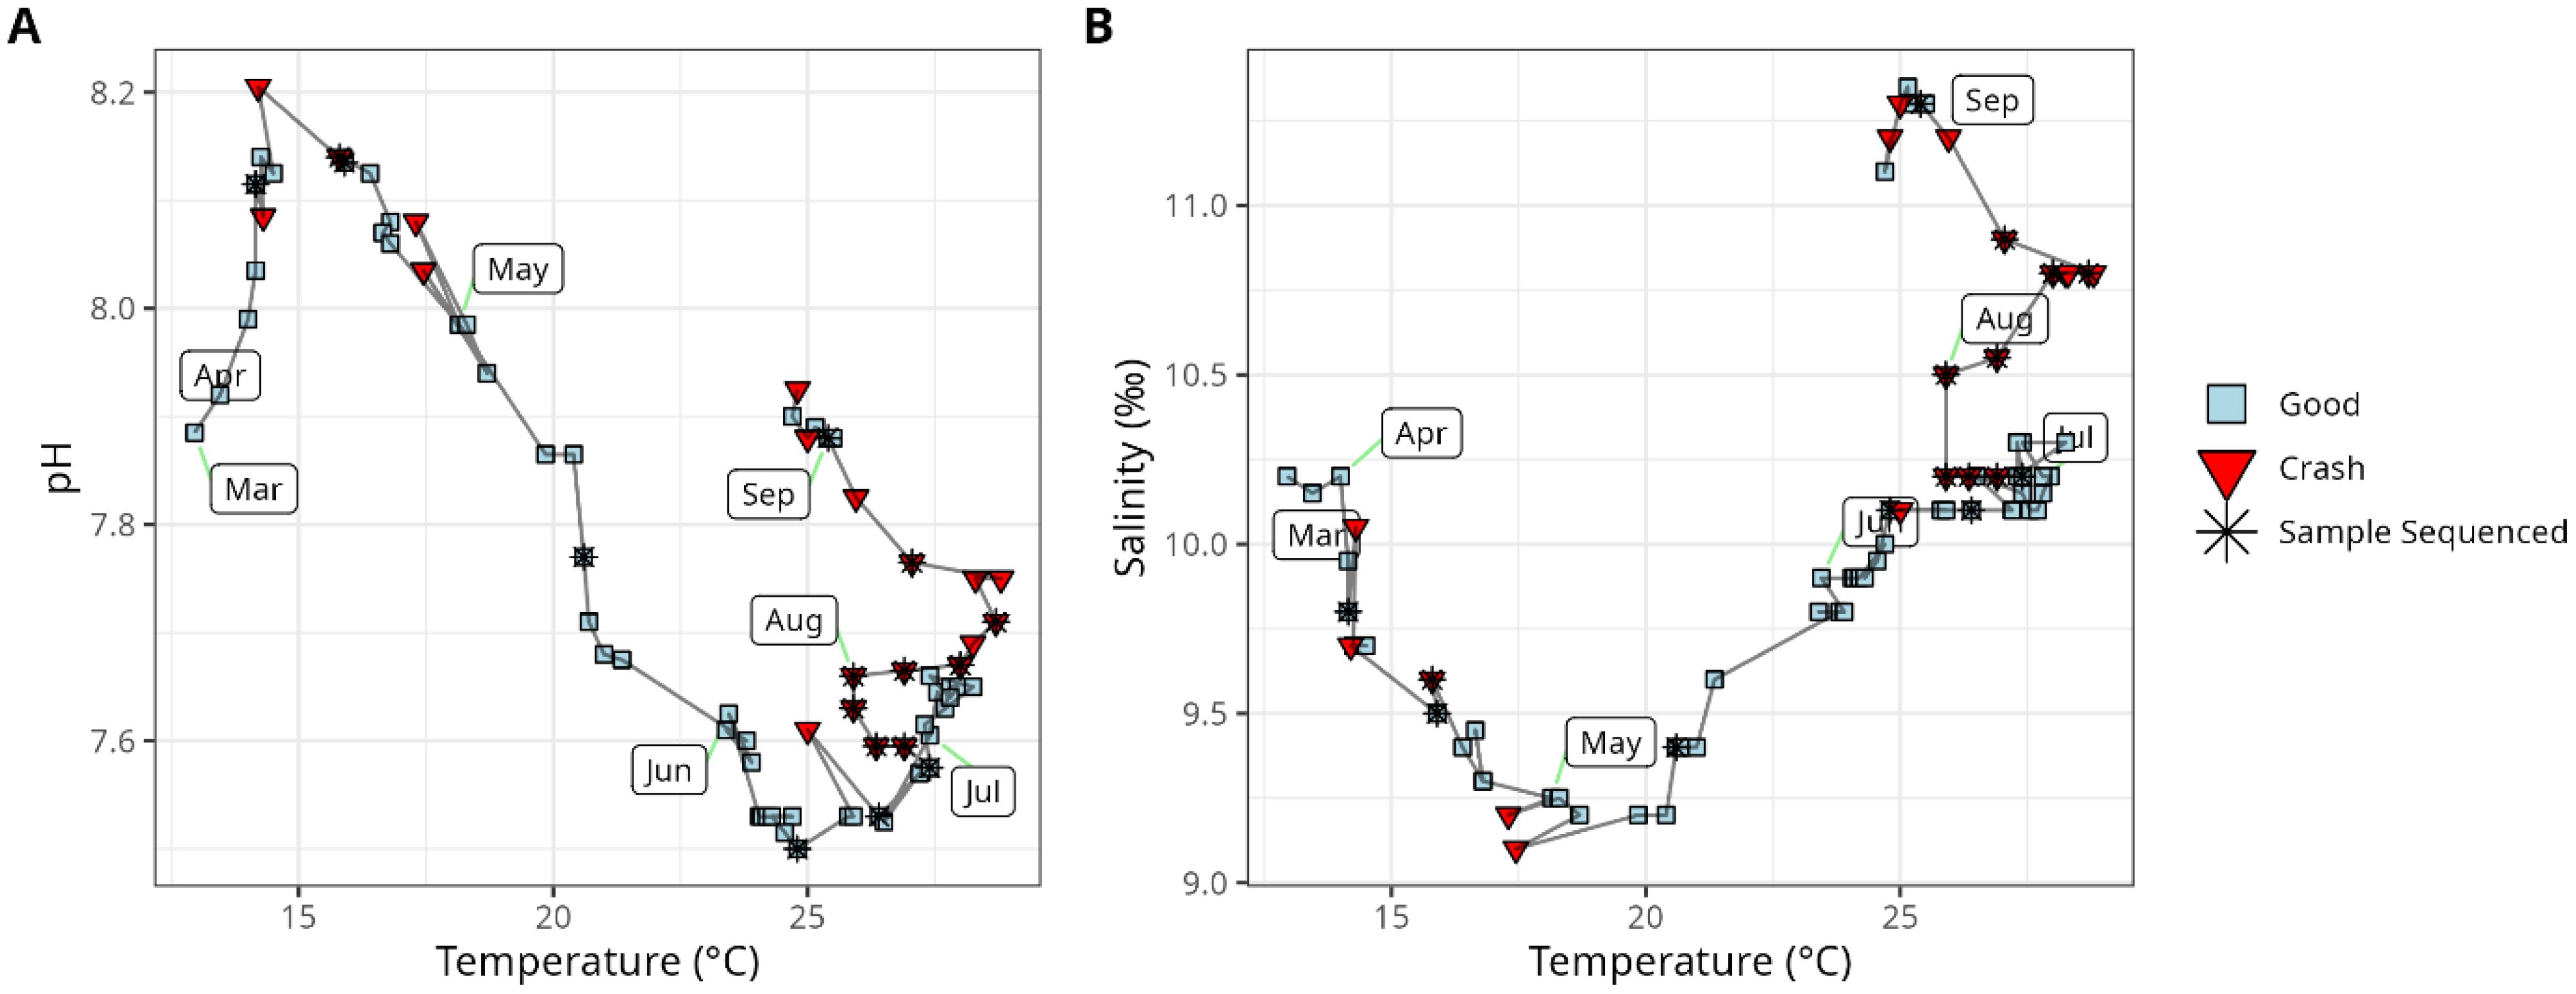
Figure 2. Properties of hatchery intake water and how they varied over time, including pH, Temperature (A) and Salinity (B). The first timepoint collected each month is labeled with a rounded rectangle. Sample shapes and colors indicate whether a crash occurred at each time-point. Stars indicate the samples that were sequenced in this study.
However, our crashed and non-crashed samples were intentionally collected near the same time of year as each other (Figure 2), and so the effects of salinity, temperature and pH among these samples were all not statistically significant (salinity p = 0.24, temperature p = 0.15, pH p = 0.16). Therefore, we felt comfortable carrying out our microbial community analysis with statistics that did not account for variability in these factors.
Larval microbiota change across time in ways that differ between crashed and non-crashed batches
Canonical correspondence analysis revealed that microbial community structure at the ASV (effectively species to genus) level was related to both the age of the larvae and whether that batch of larvae experienced a crash. At the ASV level, microbial community structure at the 10 to 12 day time-point appeared to relate, statistically significantly, to whether a crash was ongoing (p = 0.02; Table 1). In contrast, the microbial community from the 3 to 5 (p = 0.06) and 7 to 8 day (p = 0.06) time-points did not appear to relate statistically significantly to whether the host would go on to crash (in the case of the 3 to 5 day samples) or was crashing (in the case of 7 to 8 day samples; Table 1). Canonical correspondence analysis of data at all time-points showed that the microbial community was statistically significantly related to whether the sample was from a good or crashed batch (p = 0.0043) and over time (p = 0.0022; Supplementary Figure S2). A model including an interaction term between the two variables showed the interaction between batch outcome and time was not statistically significantly related to community structure (p = 0.215).
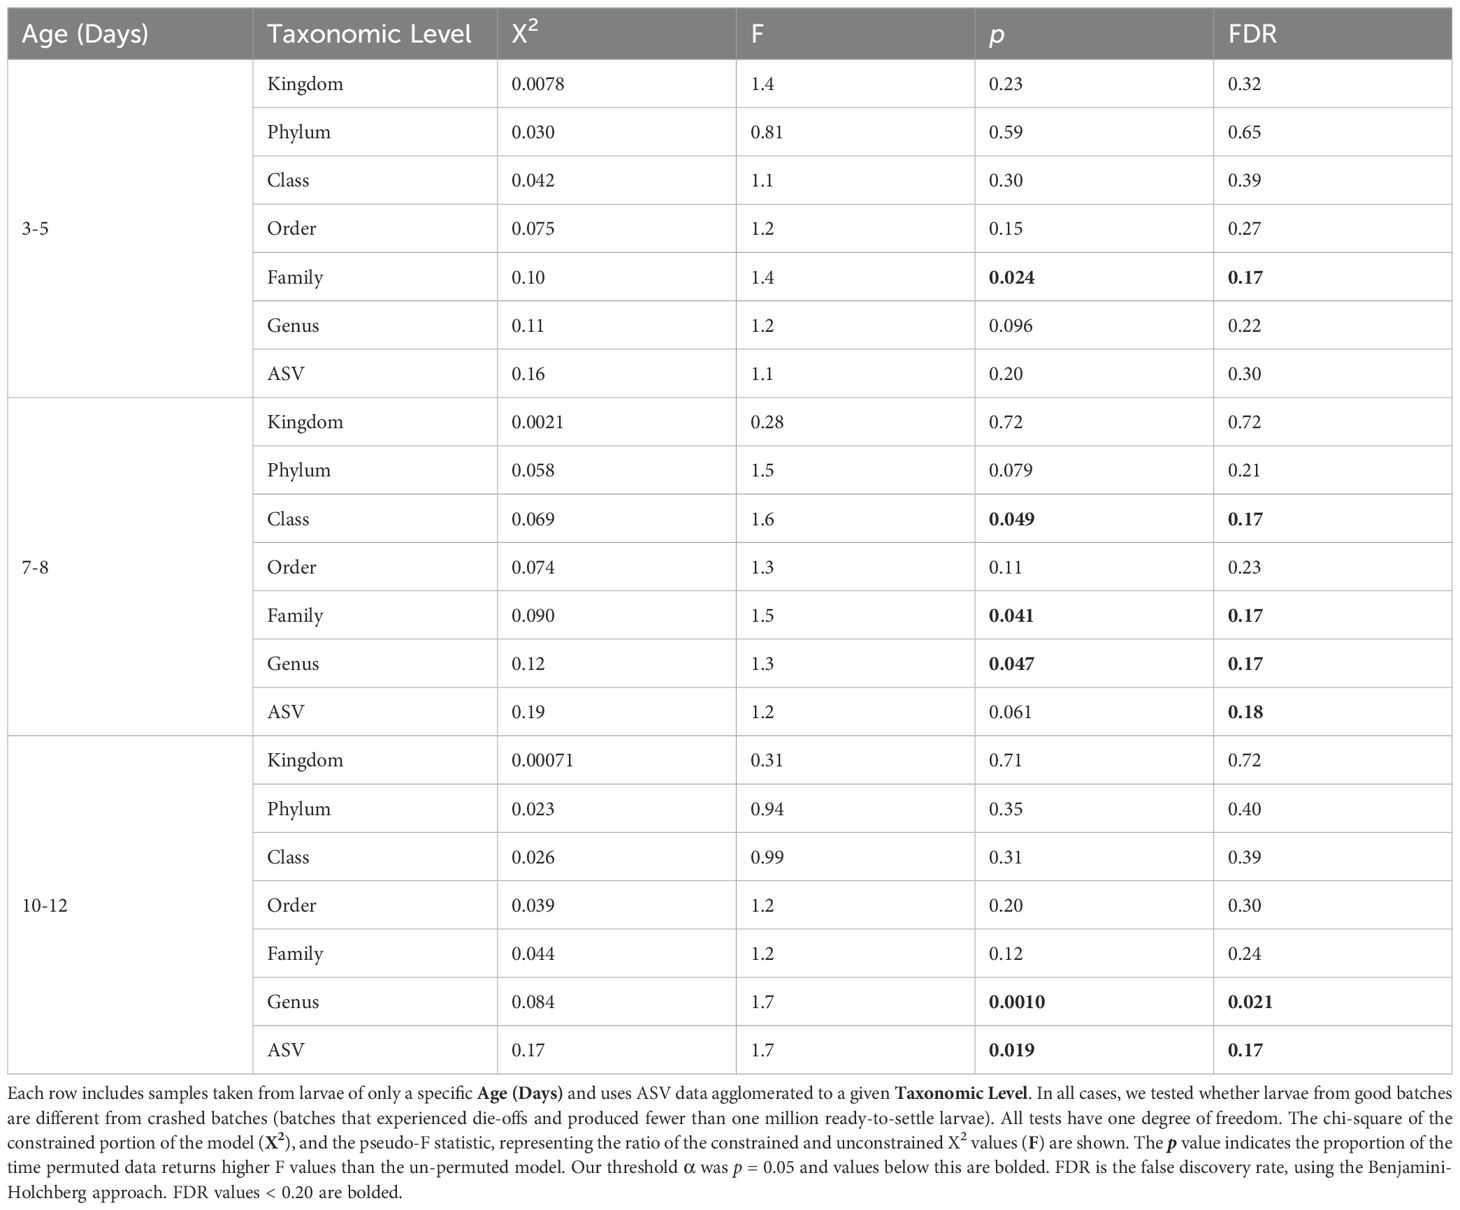
Table 1. Results of permutation tests of canonical correspondence.
Family level microbial community structure at days 3 to 5 associates with whether that batch goes on to crash after day 6
We found that at the 3 to 5 day time-point the microbial community, aggregated to Family level, but not other taxonomic levels, associated with whether the larval hosts went on to crash later in the study (Table 1). At the 7 to 8 day time-point, the microbial community aggregated to Genus, Family and Class levels were associated with whether the larval hosts experienced a crash. And at the 10 to 12 day time-point, community structure at the Genus and ASV levels associated with whether the larval hosts experienced a crash (Table 1; p < 0.05). False discovery rate analysis indicated that around 17% of these observations may have emerged due to random chance (FDR< 0.17 for all tests; Table 1). Microbial community aggregated to Order, Phylum and Domain levels never related to batch outcomes.
A CCA of all samples, from all time-points, spanning the 3 to 5, 7 to 8 and 10 to 12 age ranges, showed that the microbial community, agglomerated to family level, differed between good and crashed samples (p = 0.007), and changed over time (p = 0.0049) (Figure 3). Additionally, a separate CCA that explored the interaction between the outcome term (crashed vs good) and age suggested a statistically significant interaction between these two factors, the outcome term (crashed vs good) and age (days), on the family level microbial community structure (p = 0.047). Visual interpretation revealed that differences in the community structure between good and crashed batches increases over time (Figure 3).
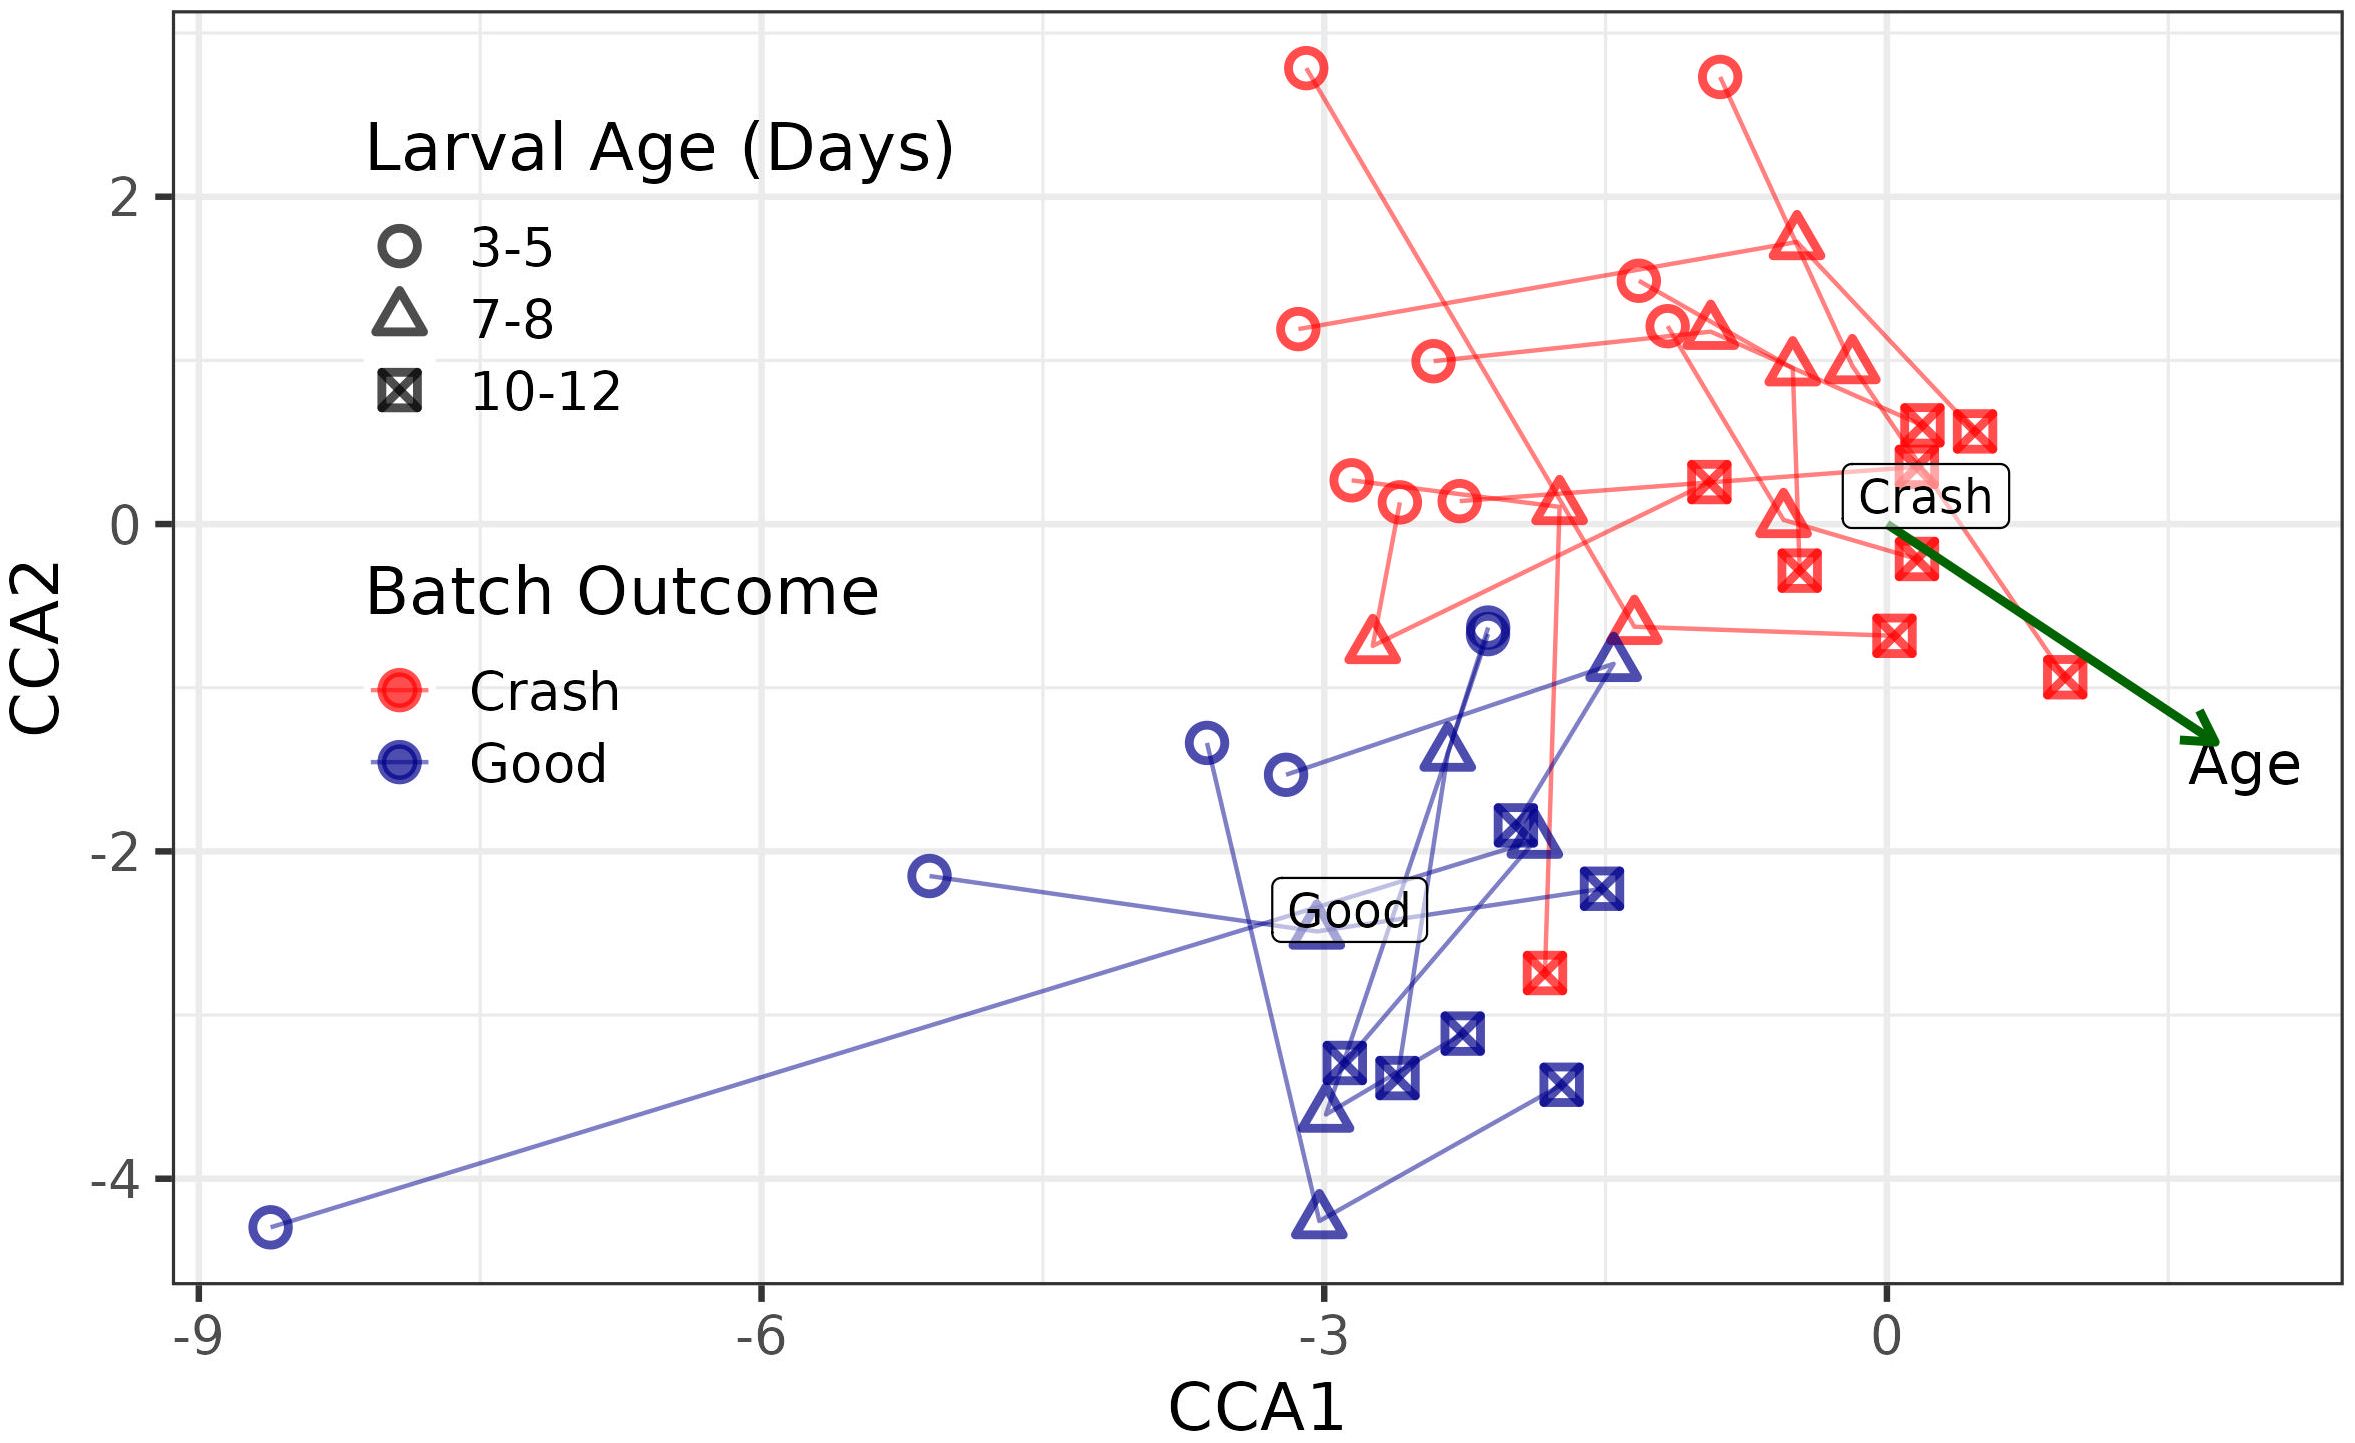
Figure 3. Canonical correspondence analysis showing the progression of the microbial community, aggregated to the family level, across 15 distinct larval hatchery batches. Points that are closer together indicate samples with more similar microbial communities. Shape indicates larval age while color indicates batch performance (crash vs good).
The development of the oyster larval microbiota over the lifetime of healthy and crashed batches
Analysis of the microbial community over the lifetime of the crash suggested that several eukaryotic and bacterial taxa increased in abundance over the course of the crash, but that the taxa differed between crash events. Many groups statistically differed in their abundance relative to hosts between crashed and non-crashed samples at the day 7 to 8 and day 10 to 12 time-points (Supplementary Table S1).
The ratio of Bacterial 16S genes to larval host 18S genes was on the order of 10-2 bacterial genes per host gene at the three day time-point, with variability between batches (Figure 4). In crashing batches, this ratio increased over the lifetime of the batch, often terminating at a ratio of 10-1 to 101 bacterial genes per host gene.
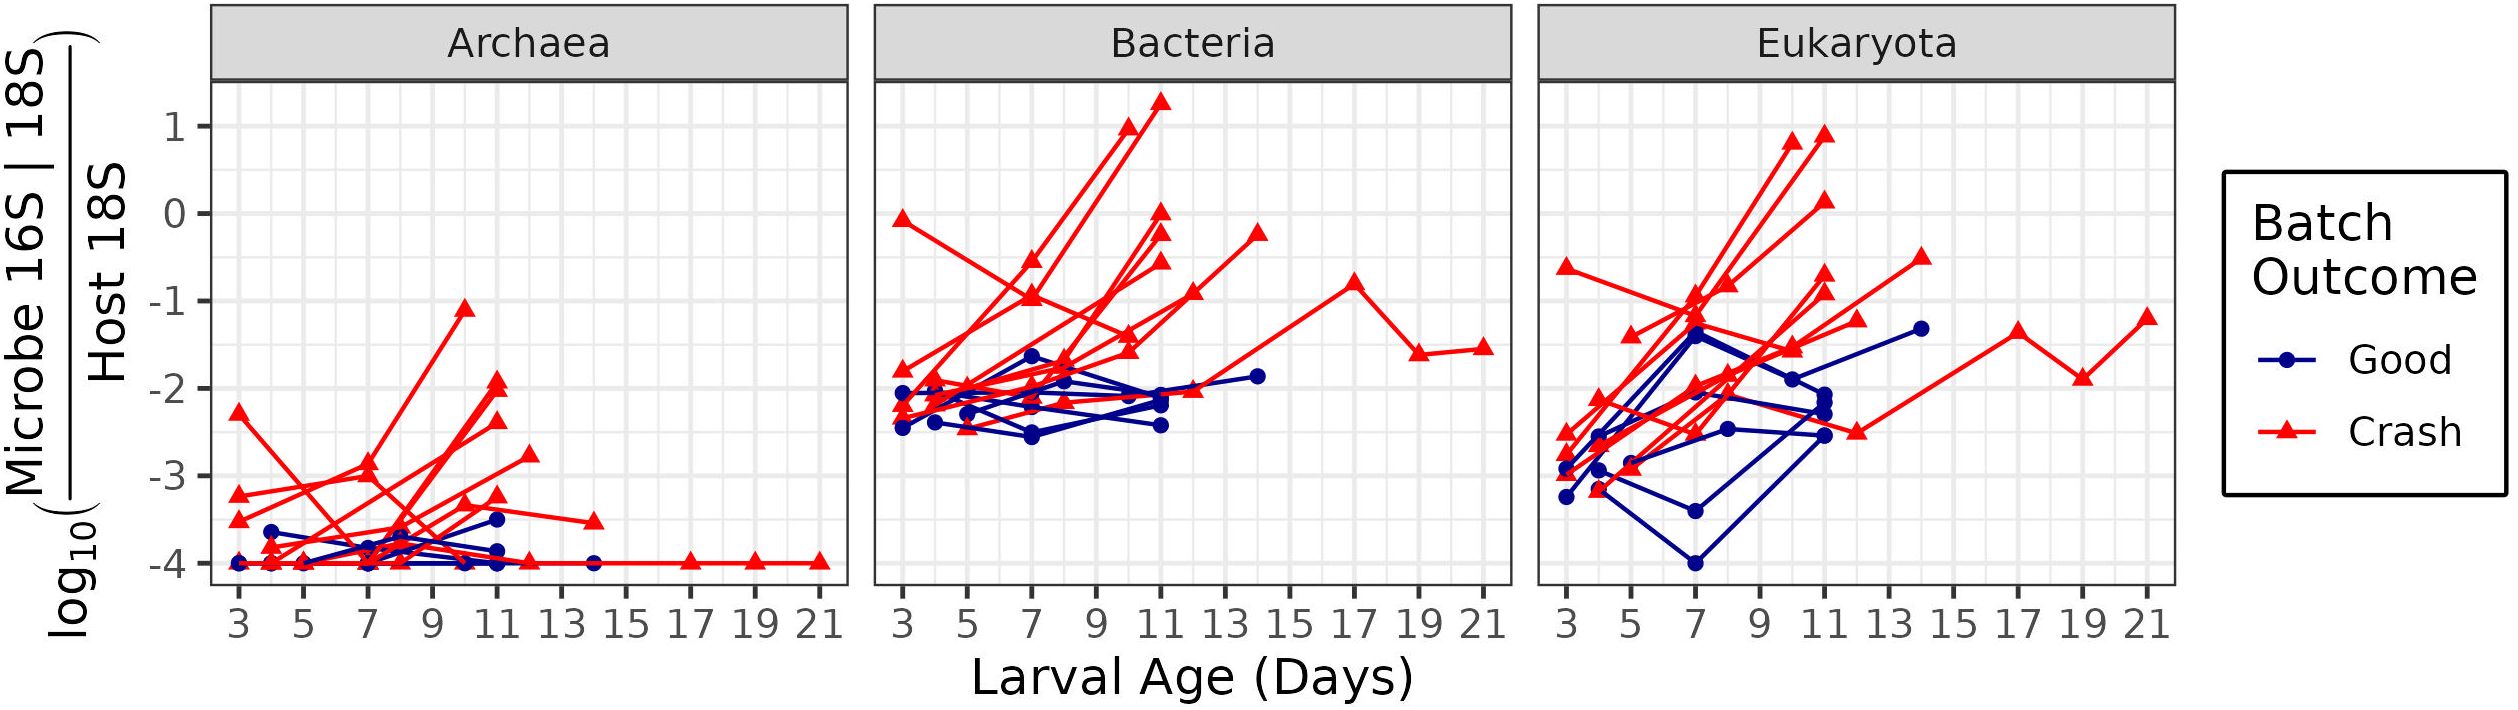
Figure 4. Microbe to host gene ratios of microbial domains. The x-axis indicates larval age, measured in days since fertilization. The y-axis indicates the log of the ratio of microbial 16S or 18S genes to host 18S genes. Higher values correspond to greater microbial loading on hosts. Color and point shape indicate whether the batch experienced a crash (with fewer than 1 million larvae surviving to harvest), or did not experience a crash.
Nine bacterial phyla appeared in at least 30% of all samples with at least five sequences (Figure 5A) and increased over the course of crashes. These were Acidobacteria, Actinobacteria, Bacteroidetes, Chloroflexi, Cyanobacteria, Firmicutes, Planctomycetes, Proteobacteria (from the Alpha (α-), Gamma (γ-) and Delta (δ-) sub-phyla) and Verrumicrobia. Bacteroidetes and Gammaproteobacteria had the highest abundances, often reaching levels of 10-2 to 101 over the life of crashes.
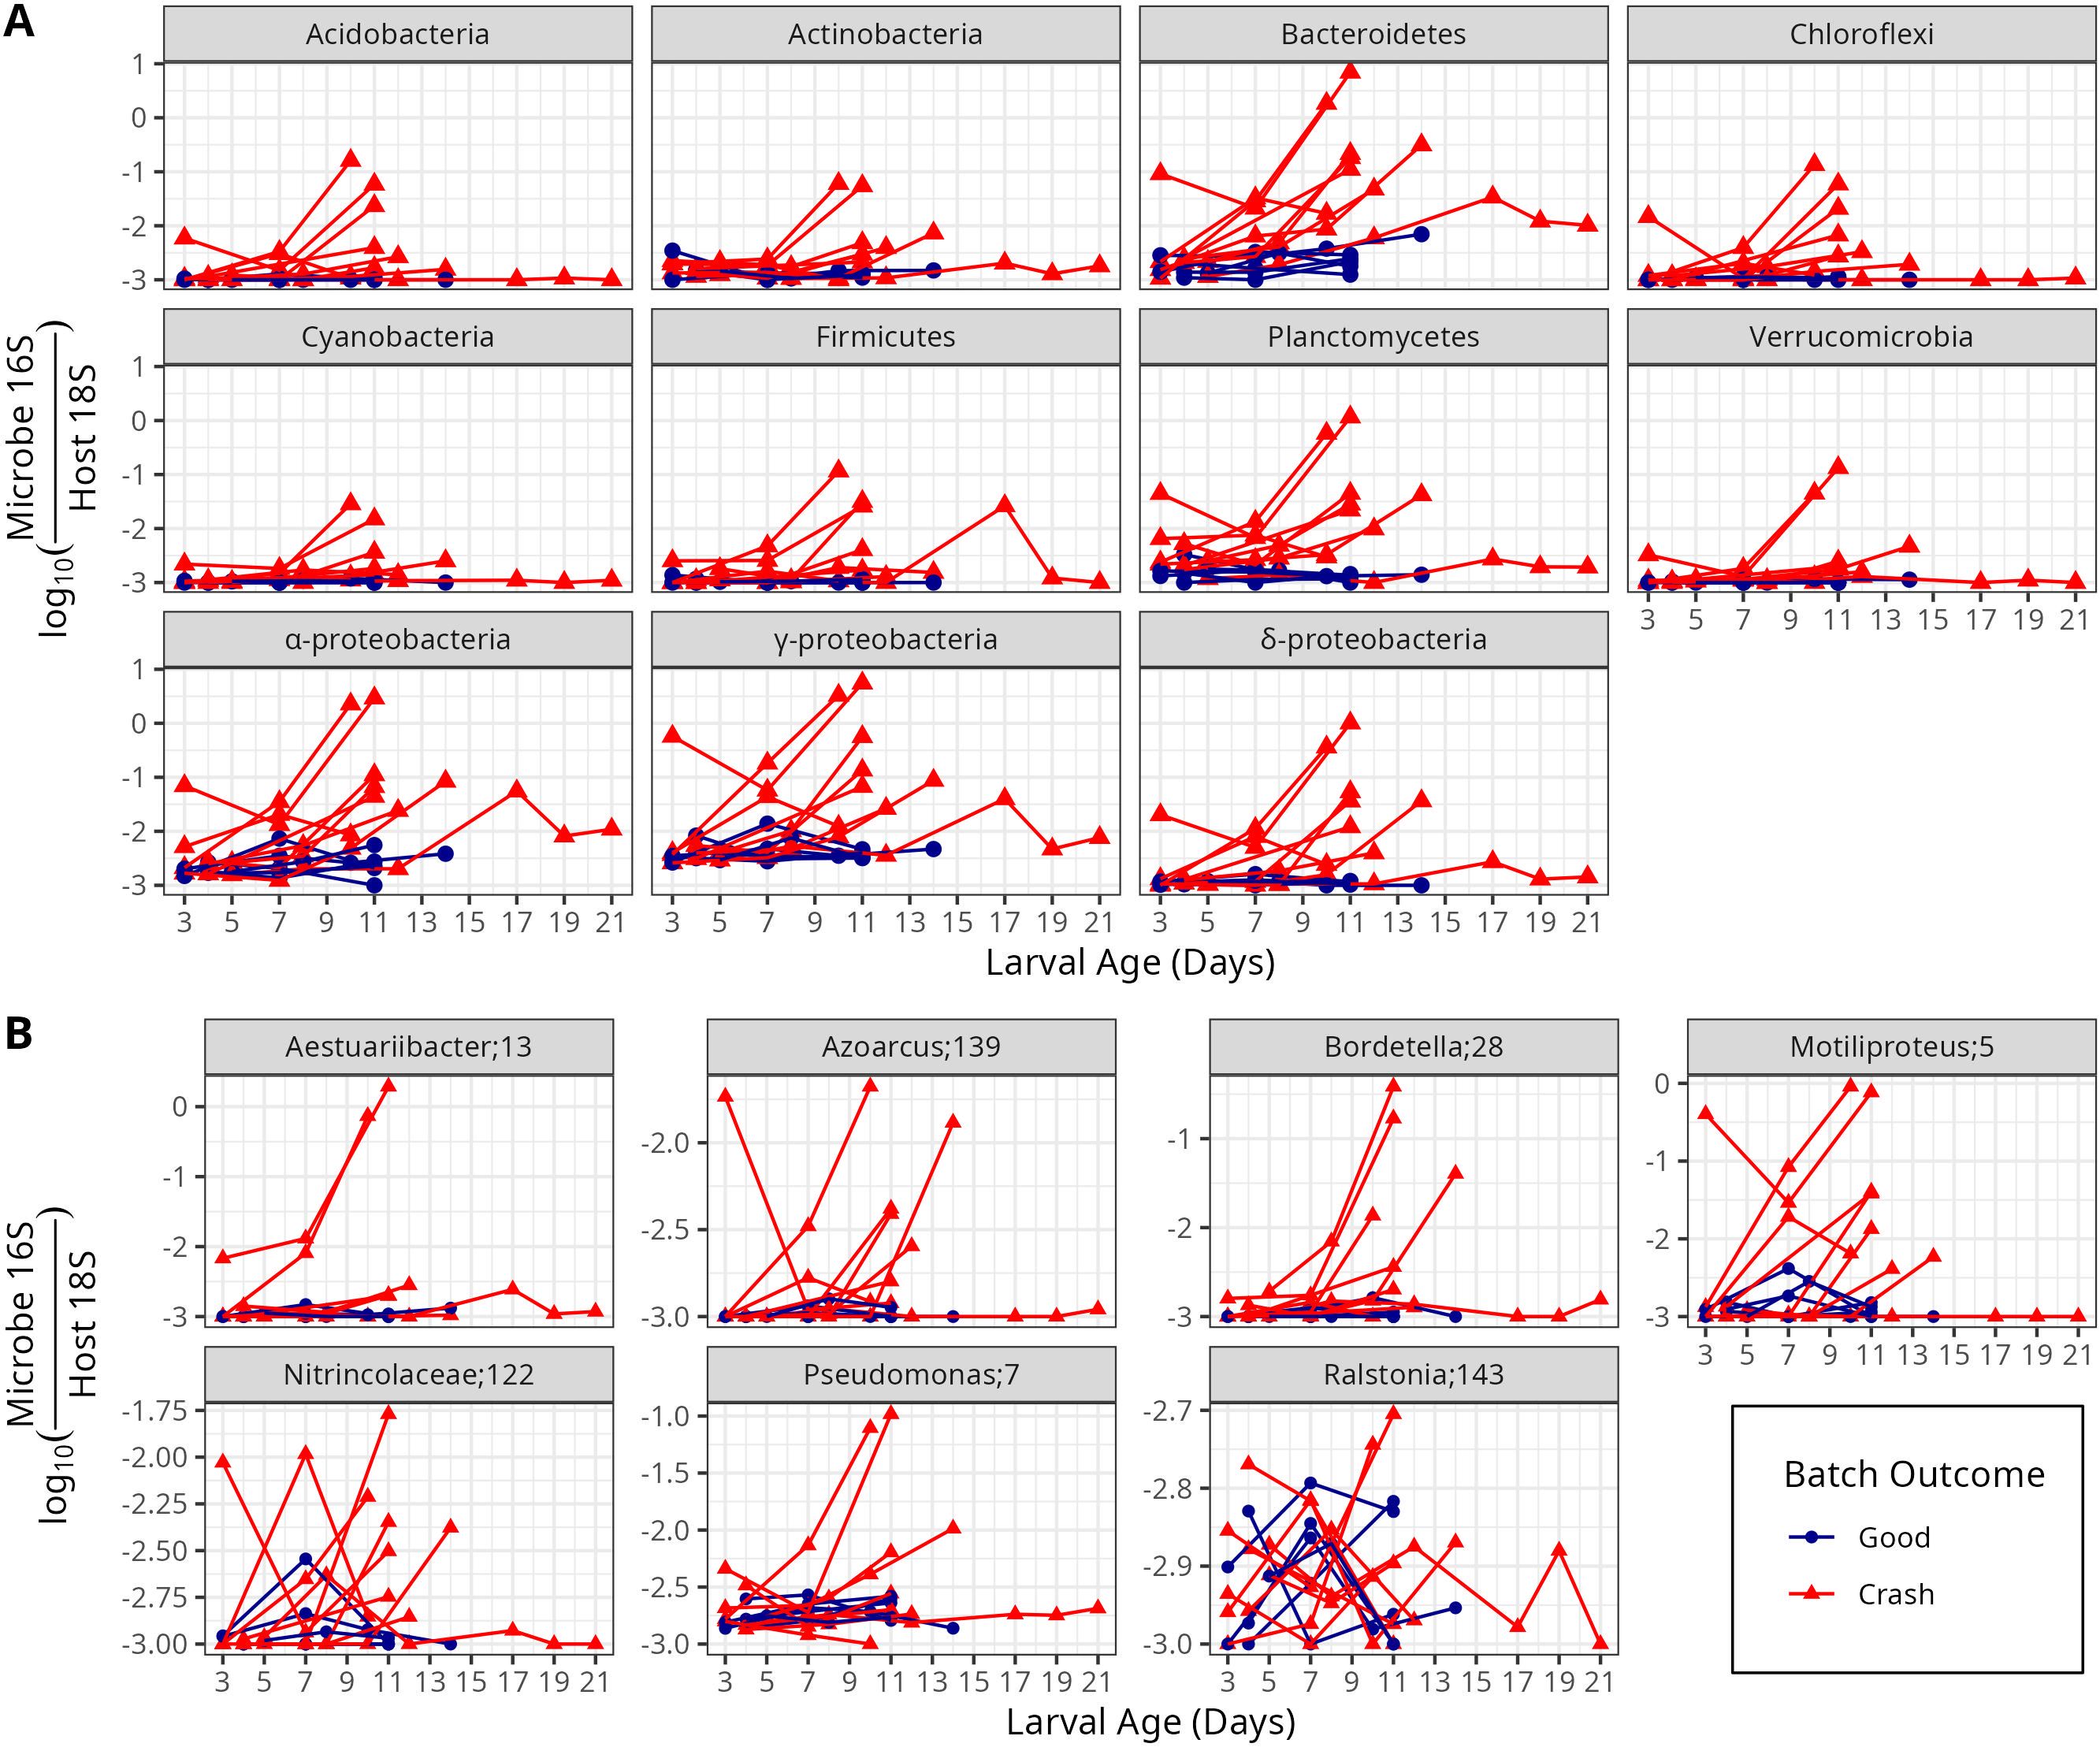
Figure 5. Microbe to host gene ratios of common (present in at least 30% of samples) bacterial phyla and proteobaterial sub-phyla (A) and common ASVs from within the gammaproteobacterial sub-phylum (B). ASV names indicate the lowest identified taxonomic level of each ASV, followed by that ASV’s ID for this study. Sequence information for each ASV can be found in Supplementary Table S2.
Within the Gammaproteobacteria sub-phylum (Figure 5B), there were six abundant ASVs (with at least 5 reads in at least 30% of all samples; Figure 5A). One, from the genus Ralstonia (ASV 143), was abundant both in healthy and crashed samples. The others increased in abundance during crashes, with different crashes characterized by different ASVs (Figure 5B). Within Bacteroidetes, there were six phyla, all of which increased in abundance over crashes, and which varied in their abundance between different crashed batches (Supplementary Figure S3).
Bacteria from the genus Vibrio were rare. While they did at times reach abundances of 10-2 per host gene (Supplementary Figure S4), Vibrio only appeared in some but not other crash samples and some species only showed up in one sample of one batch (ASVs numbered 1251 and higher). Vibrio tended to occur late during the development of crashes. However, ASV 1251 appeared only in a healthy batch. Vibrio, when blasted against NCBI, were often 100% similar to multiple genera because the V4 – V5 hypervariable region of the 16S rRNA gene does not unambiguously differentiate Vibrio species (Kwok et al., 2002). Vibrio were identified as belonging to a range of genera including human pathogens V. Vulnificus and V. Cholarae (Colwell et al., 1977). Only two ASVs had sequences identical to oyster pathogens: Both ASVs 826 and 1251 had 100% sequence identity to V. Coralliticus and V. alginoliticus (known oyster pathogens); these sequences were also 100% similar to V. parahemoliticus. Of these, ASV 826 appeared in three crash batches while ASV 1251 only appeared in the first-time point of one batch of “good” (non-crashed) larvae.
Eukaryotic 18S sequences, representing primarily multicellular organisms, showed similar patterns to those of total bacteria (Figure 4). They began with around 10-3 18S gene copies per host 18S gene and increased to between 10-1 to 100.5 over the course of the crash. Healthy cells in contrast increased much less, and sometimes showed decreases in eukaryotic abundance between days 7 and 9.
There were six abundant eukaryotic phyla that showed up in at least 30% of samples with at least five reads per phylum (Supplementary Figure S5A). The Annilida, Ciliophora, Platyhelmenthes and Rotifera phyla were the most abundant, and were all present both in good and crashed samples reaching ratios of 10-2 in good samples and 100 in crashed samples. Furthermore, there were ten Eukaryotic ASVs that met this same occurrence threshold (Supplementary Figure S5B). All phyla and ASVs showed the same pattern as the Gammaproteobacteria and Bacteroides: Higher abundance in crashed samples, increasing over time, with variability between groups.
Archaea were rare in healthy hosts (on the order of 10-4 to 10-3.5 copies per host gene) but became more abundant by the 11 day time-point in crashed batches. In all cases, Archaea were less common than Bacteria and Eukaryota (Figure 4).
Three taxonomic groups are statistically more abundant prior-to crashes
Three taxa are statistically more abundant in crashed than in non-crashed samples at the 3 to 5 day time-point (before the crash is otherwise detectable; Supplementary Table S1; Figure 6A, t-test p<0.05). The first of these is ASVs that fall into the family Dinophyceae (p = 0.046; Supplementary Table S2). The second is ASV 53, which is 88% similar to a mitochondrial sequence (Supplementary Table S2), suggesting that this is either a previously unsequenced mitochondrial group or unsequenced bacterial group. The third, ASV 205 was 97.4% percent similar to an organism called Planctomycetaceae bacterium D2 [Planctomycetaceae bacterium D2 gene for 16S ribosomal RNA, partial sequence LC075346.1 (Nakamura et al., 2016)]. Of these taxa, Dinophiceae and ASV 53 genes increased in abundance relative to host genes in many, but not all, crash batches, while ASV 205 remained at low abundance over the course of the crashes Within 3 to 5 day old larvae, these indicator taxa were often present late in the growing season, but were not detected at the crash that happened in the early spring (Supplementary Figure S6).
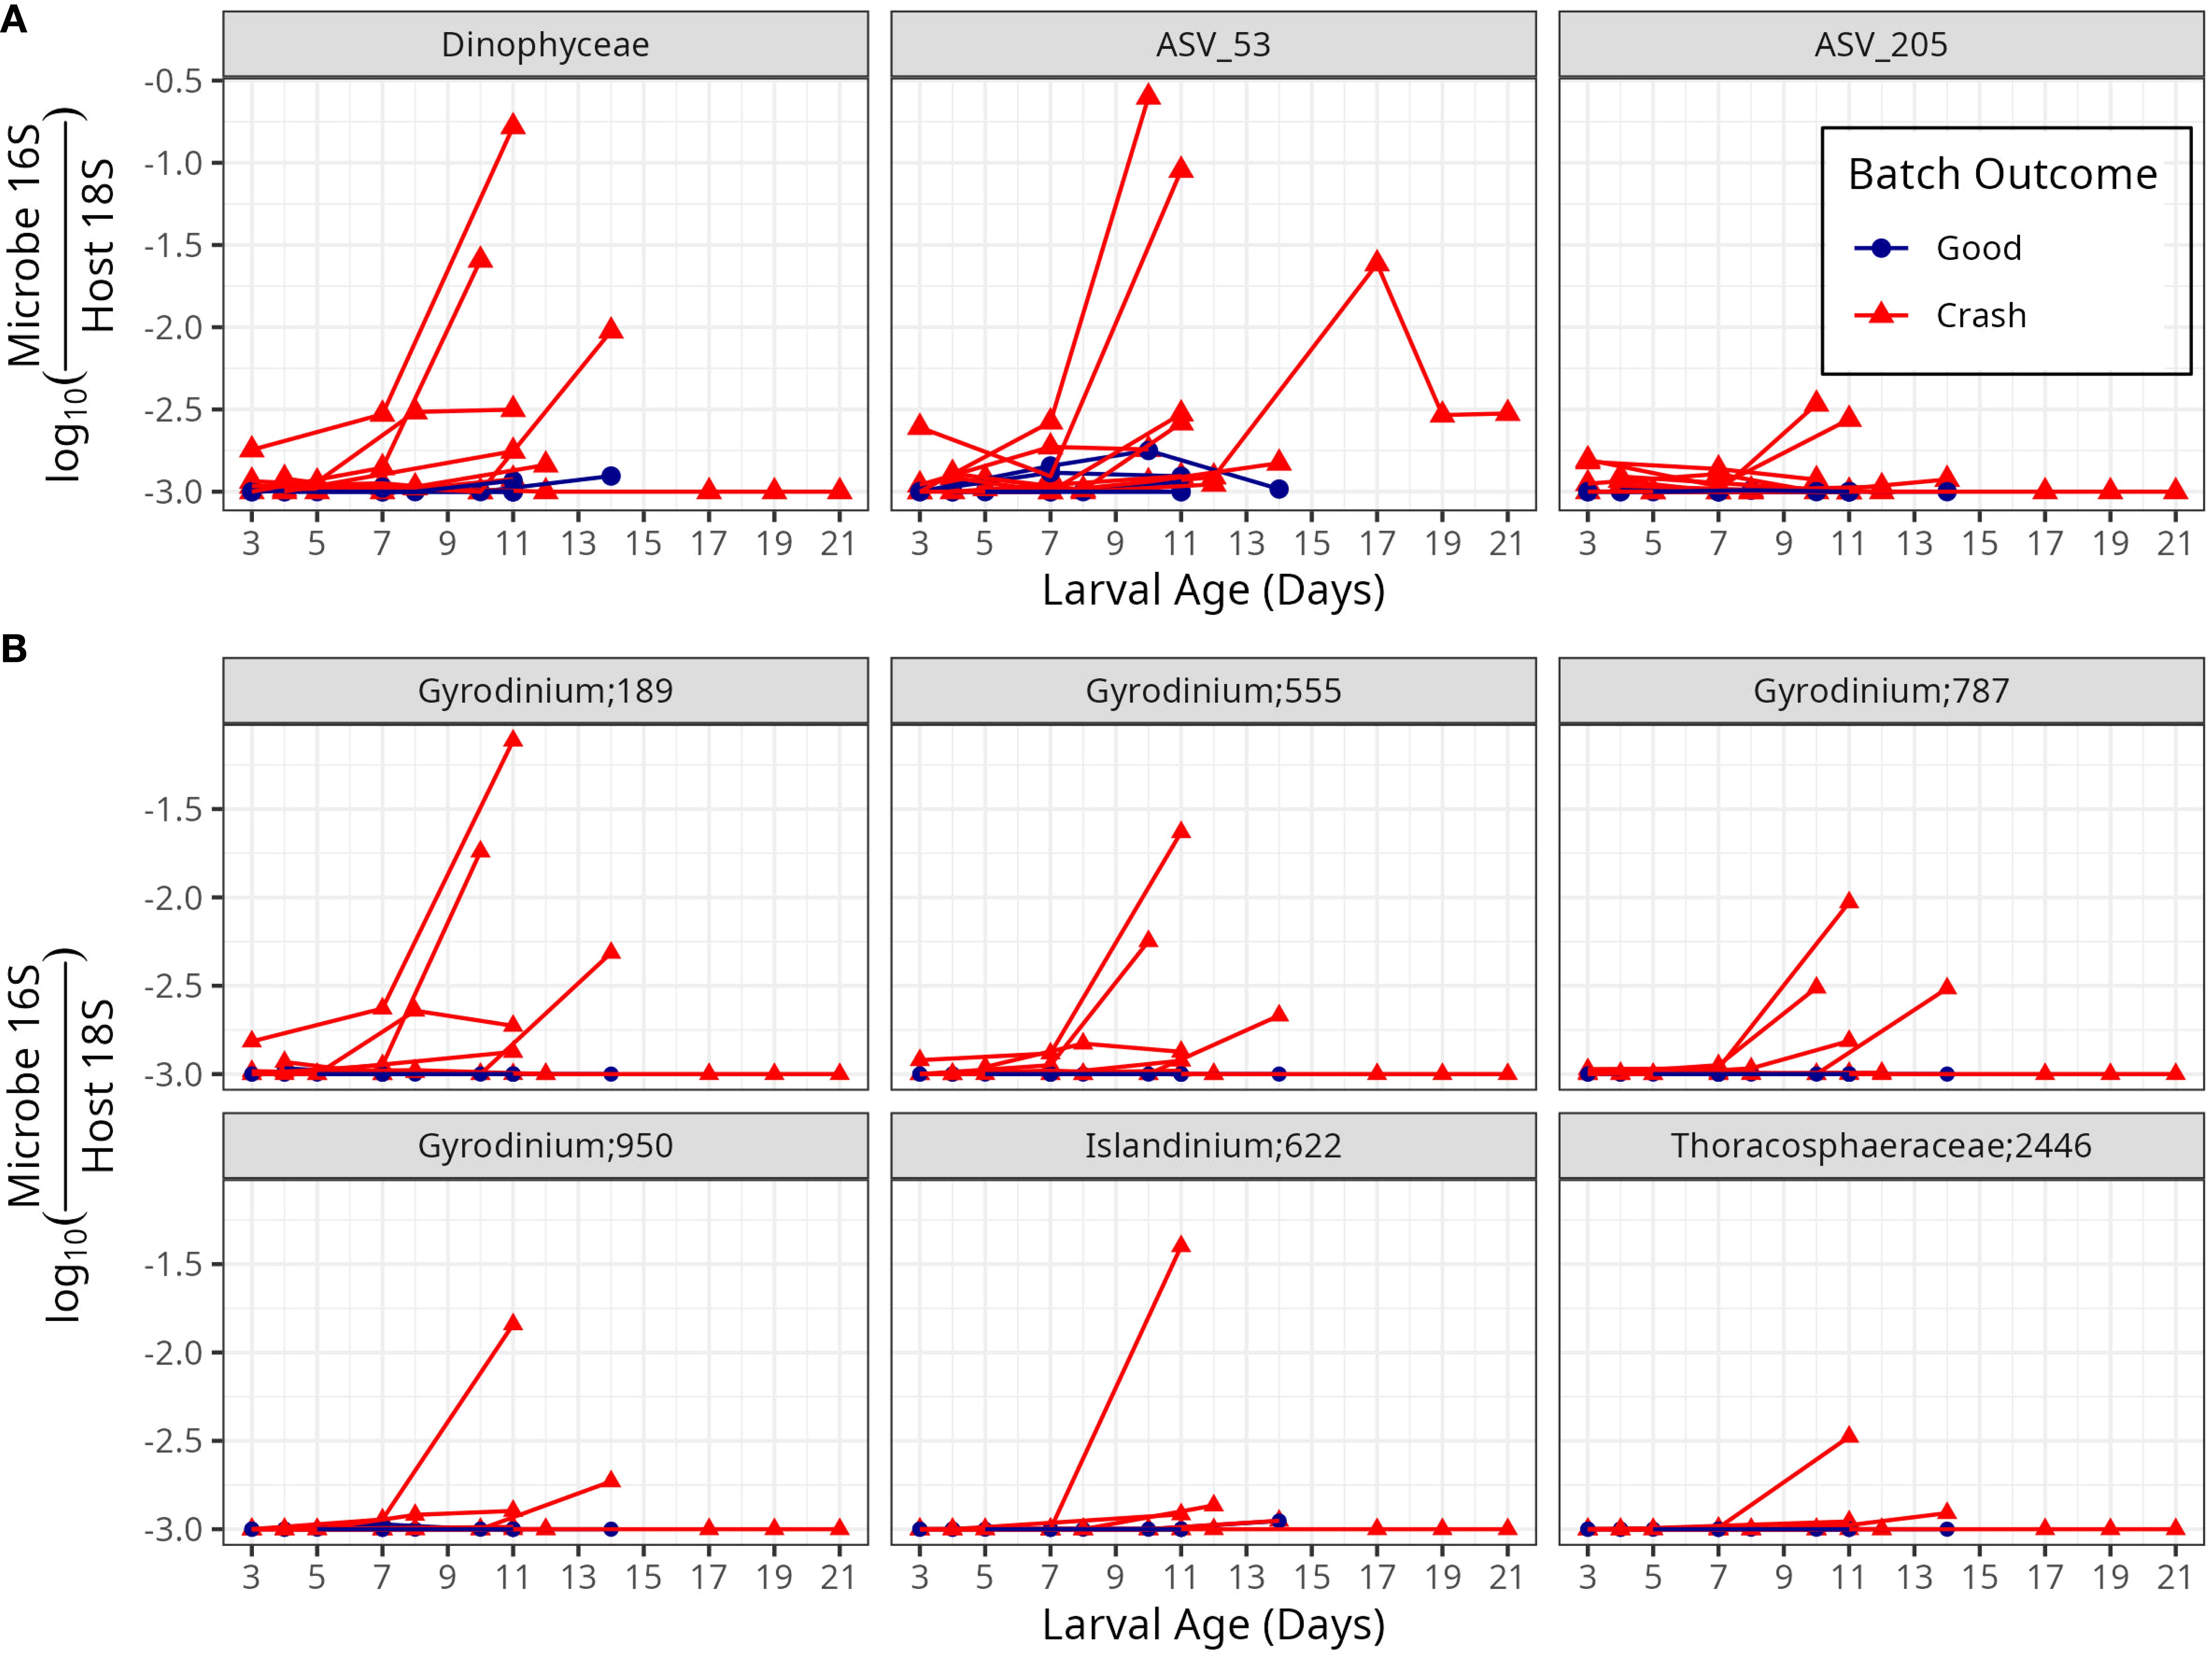
Figure 6. Microorganisms whose abundances precede crashes. (A) Abundance of three taxonomic groups, one at the Class level (Dinophyceae) and two at the ASV level, that were statistically significantly more abundant in crashed batches than in non-crashed batches at the 3 to 5 day time point. (B) Common (present in >= 5% of samples) ASVs within the class Dinophyceae.
False discovery rate correction, when applied to the p-values of all taxa at all time-points, suggested a Benjamini-Hochberg False Discovery Rate (FDR; Benjamini and Hochberg, 1995) of 0.19 and a q-value (Dabney and Storey, 2004) of 0.03. When this analysis was instead applied only to bacteria from the day 3 to 5 time point, the FDR was 0.55 and there were too few p-values to calculate q-values.
The class Dinophyceae was comprised of six ASVs which appeared in at least 5% of observed samples (Figure 6B) – the most abundant of these, Gyrodinium 189 and Gyrodinium 555, appeared to be primarily responsible for the overall patterns in this class. NCBI Blast indicated these sequences were species Gyrodinium jinhaense MH665396.1, while the other taxa within Dinophyceae were from other groups (Supplementary Table S2).
Discussion
Over the course of each of nine hatchery crashes in 2021, the gene content of numerous phylogenetic groups increased relative to host genes. These increasing microbial gene copy numbers, relative to host gene copy numbers, presumably reflect increases in cell abundance (see methodological advantages and considerations). In the case of eukaryotes, it reflects either greater numbers of organisms or larger organisms.
We show preliminary evidence that microbial community patterns detected at the day 3 to 5 time point, when aggregated to family level and some microbial taxa, are associated with whether the larval batch crashes after day 6. These taxa include the family Dinophyceae, which is dominated by Gyrodinium jinhaense, a known toxic algae. These family level community structure and taxon specific patterns suggest that, with a larger sample size, the microbial community could predict crashes.
Hatchery crashes favor the growth of many microbial taxa
Numerous species from diverse phylogenetic groups (Figures 4, Supplementary Figures S3-S5) across all domains of life appear to increase in abundance in oysters over the span of crashes. These organisms likely thrive in either or both of two niches that are opened over the course of the crash: The first niche is sick hosts. Dying oyster larvae may be unable to prevent bacteria and microeukaryotes from growing in or on them and so these microorganisms use the larvae as a habitat. Indeed, opportunistic bacteria and eukaryotes have been seen to take advantage of a range of diseased and stressed hosts (Burge et al., 2013; Derome et al., 2016; Lloyd and Pespeni, 2018). Such a phenomenon could accelerate crashes as more of the host’s nutrients and energy are transferred to the microorganisms. The second is that crashes produce larval carcasses which may also provide habitats and food for microorganisms (Kolmakova et al., 2019). Thus, we may be seeing an increase in carcass degraders. In principle, one could separate living larvae from dead ones to deconvolve whether the microorganisms are growing on live or dead larvae. This was not done in this study because our sampling method was designed to piggyback on ongoing hatchery operations, which collect living and dead larvae together. ASVs that increased in abundance during crashes included Bacteria, Archaea and Eukarya. Many of the eukaryotes seen in our amplicon analysis, including Rotifers and Annelids, were both seen by hatchery staff during microscopic monitoring of their tanks.
Most of the bacteria that appeared to grow during crashes are not known oyster larvae pathogens. A few organisms are pathogens of animals other than oysters: Bordetella (ASV 28; Figure 5) include known pathogens on mammals (Gerlach et al., 2001); S. Ralstonia, the gammaproteobacterial genus found on both healthy and diseased oysters (ASV 143; Figure 5), is primarily described in the literature as a plant pathogen (Carstensen et al., 2017; Rivera-Zuluaga et al., 2023); and Polydora websteri (ASV 11; Supplementary Figure S5) is a known shell burrowing pathogen on adult oysters (Barros et al., 2017; Martinelli et al., 2020). None of the species that grew on diseased oysters (Supplementary Tables S1, S2) are known pathogens of oyster larvae, to our knowledge.
Vibrio probably do not drive observed crashes
Known pathogens such as vibrio (Elston and Leibovitz, 1980) were not common in our dataset. Each observed Vibrio genus was only present in some batches and Vibrio were usually detected at low abundance, with Vibrio 16S to host 18S gene ratios on the order of 10-3 to 10-2 (Supplementary Figure S4). Most observed Vibrio ASVs had 100% sequence identity to multiple species, indicating that our ASVs provide only ambiguous taxonomy (Supplementary Figure S4). A few of the Vibrio appeared to have sequence identity of known oyster pathogens (Supplementary Figure S4), however, those Vibrios were always rare. More common were known pathogens of humans including V. vulnificus and V. cholarae. Thus, even though Vibrio have been implicated in oyster disease, including diseases in oyster hatcheries, in the past (Elston et al., 1981; Richards et al., 2015), they do not appear as likely causes of disease in this study. Rather, Vibrio are often opportunistic bacteria (Brown et al., 2012; Purgar et al., 2022), and so they may be growing on oyster carcasses.
The microbial community differs between crashed and good batches before the crash occurs
The microbial community differed before crashes become evident, after day 6 (Figure 1), between good batches and batches that crash at the 3 to 5 day time point., Two ASVs and one Class level group associated with batch outcome at the 3 to 5 day time-point (Supplementary Table S1). The class level group, Dinophiceae, was dominated by the species Gyrodinium jinhaense. Gyrodinium jinhaense is a heterotrophic dinoflagellate that was previously found and isolated from a fish kill incident. It has also been found to harbor fragments of genes for polyketide synthase (necessary for the production of many algal toxins) and Saxitoxin production (Sprecher et al., 2021). However, G. jinhaense has not been observed to produce Saxitoxin in situ, nor does it have the stxA4 domain that is likely necessary for Saxitoxin synthesis (Sprecher et al., 2021). This association could indicate that the Dinophyceae may contribute to crashes by poisoning larvae, possibly though a toxin other than Saxitoxin. Alternatively, larvae might consume Dinophyceae only when they are stressed. G. jinhaense has not been previously reported in the Chesapeake Bay, to our knowledge. However, unidentified species of the Gyrodinium genera have been reported to form blooms in the Chesapeake Bay (Anderson, 1998).Planctomycetaceae bacterium D2 (ASV 205), the second ASV associated with crashes at the 3 to 5 day time-point, has, to our knowledge, only been observed in the Bay of Tokyo as part of a study examining a novel approach to isolating bacteria (Nakamura et al., 2016) — nothing is known about its ecology. The planctomycetes phylum, including Planctomycetaceae, contains many particle associated bacteria and some of the species have been identified as human pathogens (Kaboré et al., 2020 and references therein). Bacteria in the Planctomycetes phylum are common across the Chesapeake Bay, but Planctomycetaceae bacterium D2 hasn’t been reported previously in the Chesapeake Bay, to our knowledge. The closest abundant reported relative is an ASV from the Gimesiaceae family, which shares the order Planctomycetales with Planctomycetaceae bacterium D2, and is often abundant in small (< 5 μm) particles across the bay (Cram et al., 2024). The third ASV, ASV 53, did not match any sequences in NCBI, but bears some genetic similarity to mitochondria. Thus, ASV 53 could be the mitochondria of some eukaryotic organism, or else is an unidentified bacterium.
Given the number of comparisons that we carried out and the post-hock nature of our analysis, it is possible that the association of any of these three taxa (Dinophyceae, ASV53, Planctomycetaceae bacterium D2) are statistical flukes (false discovery rate of 0.21). In all cases, it will be valuable to evaluate whether these groups are associated with crashes in other datasets, by repeating this study, or ideally expanding it with more observations from the already collected samples. If they do associate with crashes in other data, steps to identify them and learn about their ecology will be valuable in determining whether they might cause or otherwise be good predictors of crashes. As with the community level patterns, these taxa are not “predictive” of crashes, since we lacked the sample size to carry out robust validation approaches. Rather, they are associated with whether given batches in our dataset went on to crash, after the observations were made. Additionally, an important future direction will be to determine how these potential crash causing organisms enter the hatchery in the first place. Identifying their sources, such as whether they come in through hatchery intakes and somehow avoid removal by the hatchery’s filters, through contamination of food, or by other sources, would provide a step towards keeping these organisms out of hatcheries and perhaps preventing crashes.
Salinity and pH modulate crashes, but do not confound the observed microbe-crash relationships
The observation that temperature and pH but not salinity relate to crashes disagree with the observations of Gray et al., 2022 who found in the same hatchery, but over a different time interval (2011-2020), that low salinity but not temperature and pH appeared to relate to crashes. This suggests that the environmental conditions in 2021 were different enough from the interval Gray et al. (2022) considered and that different patterns emerged over the time interval that we considered. The observation that over the samples that we considered there was no relationship between temperature and pH and the probability of crashes suggest that these parameters, while predictive do not confound our data. Indeed, we selected crash and healthy samples during similar times of year to each other to minimize the effect of environmental variability and to focus on microbial effects on crashes.
Methodological advantages and considerations
The co-amplification (with universal primers) of microbial 16S and 18S genes with host 18S genes has the unique advantage of expressing microbial abundances as ratios relative to host genes, rather than proportions of total microbial community (relative abundance). These microbes to host gene ratios allow us to identify trends in microbial loading on hosts. It was clear in this study that microbial gene abundance, relative to host gene abundance, increased over time in crashed hatchery batches, but did not in healthy batches. While it is true that 16S and 18S gene abundances per cell vary between organisms (Větrovský and Baldrian, 2013), gene abundances per cell do not vary much over the life-time of organisms, beyond doubling during DNA replication and halving after cell division (Alberts, 2015). Thus, differences in microbe to host gene ratios between different samples must be directly proportional to differences in microbe to host cellular ratios. The observed increases in total microbe to host gene ratios presumably reflect increased total microbial loading over the course of the crashes. Furthermore, the increase in the microbe to host gene ratios of individual taxa presumably indicates the loading of individual taxa on hosts. This approach provides one solution to the problem of compositionality, in which relative abundance information can provide misleading information about microbial trends (Gloor et al., 2017).
Conversely, sequencing host 18S genes comes at a cost – most of our reads (often by factors of 100 to 1000; Figure 4) are copies of the same host 18S gene. Therefore, much of this study’s sequencing effort went towards re-sequencing oyster 18S genes. Thus, with this approach, greater sequencing efforts are needed to ensure sufficient microbial sequences are obtained. As a result, this approach likely detects fewer rare microbial species than do other approaches. Combining amplicon based sequencing with CRISPR-Cas based removal of host genes (Zhong et al., 2021) and the use of blocking primers (Clerissi et al., 2020) have shown promise in sequencing eukaryotes without having the signal swamped by oyster hosts. Such an approach, combined with qPCR of oyster and bacterial genes to provide microbial loading information, could be used to provide similar information about host to gene ratios while devoting more sequencing effort to microbial sequences.
Amplicon sequencing has known biases that can over-represent, under-represent, and miss some organisms (Krehenwinkel et al., 2017 and references therein), introducing additional caveats worth discussing. This primer set has been validated and is shown to sequence most bacterial, archaeal, and many eukaryotic taxa (McNichol et al., 2021). Furthermore, mock communities amplified in these same amplicon sequence runs, with the same primers, have shown good affinity to the known sequences (the data were run together with some of the sequences from Cram et al. (2024)). Using multiple primers concurrently (McNichol et al., 2021) might allow greater coverage of other species. Additionally, sequencing of different genes, such as hsp60, could allow better differentiation of vibrio species (Kwok et al., 2002; Jesser and Noble, 2018) or other microbial groups. Untargeted metagenomic sequencing (Ramachandran et al., 2018) could also provide greater insight into the diversity and functional gene content of the community, but would also face the challenge of most reads being from the host genome. While amplicon sequencing may over or underrepresent, lump or miss certain taxa, the observed variability between batches (N = 15, 6 with normal production and 9 that crashed) and changes over time (through day 12, capturing the lifecycle of a batch) are likely representative of real variability in the underlying microbial community.
Conclusion
This study provides a framework and proof of concept for detecting potential causes and predictive agents of oyster crashes. We advocate approaches that, like this one, meet the following criteria: (1) Studies should sequence from all three domains of life, because both bacteria and eukaryotes appear to relate to hatchery crashes. (2) Studies should examine larval tissue (rather than or in addition to tank water), because it informs about microorganisms that directly associate with oysters. Additionally, larval samples are easier for hatchery staff to collect as part of normal operations than other sample types. (3) Studies should quantify the ratio of microbial genes relative to host genes because these ratios mirror microbial loading on hosts.
Given our small sample size, conclusions about causative agents and predictions are not possible. However, we hypothesize that Gyrodinium jinhaense, a known toxic alga that was found in larvae both before and during crashes but not in non-crashed samples, may have been responsible or partially responsible for many of the crashes at the Horn Point Laboratory Oyster Hatchery during the 2021 growing season.
Data availability statement
Sequence data are available on NCBI’s Sequence read archive at accession number PRJNA1104222. Code for carrying out processing of amplicon sequence data and generating count tables, taxonomy tables and fasta files, as well as those output files are available on FigShare at https://doi.org/10.6084/m9.figshare.25686255.v1. Code for wrangling data, carrying out statistical analysis and generating figures and tables is also available on FigShare at https://doi.org/10.6084/m9.figshare.25686261.v2.
Ethics statement
Ethical approval was not required for the study involving animals in accordance with the local legislation and institutional requirements because the study did not involve vertebrate animals. The study uses tissue from oyster larvae, which do not require approval to sample.
Author contributions
JAC: Conceptualization, Data curation, Formal Analysis, Funding acquisition, Investigation, Methodology, Project administration, Resources, Software, Supervision, Validation, Visualization, Writing – original draft, Writing – review & editing. AJM: Investigation, Writing – review & editing. SMW: Data curation, Investigation, Writing – review & editing. STA: Conceptualization, Data curation, Investigation, Methodology, Supervision, Writing – review & editing.
Funding
The author(s) declare that no financial support was received for the research, authorship, and/or publication of this article.
Acknowledgments
We thank the current and previous staff and interns of Horn Point Laboratory Oyster Hatchery for their assistance in collecting samples and for sharing data. In particular, we thank Jeff Alexander, Megan Hensel, Alex Grower, Bob Carey, Julie Trommatter and Alicia Klages for managing samples and data connected to this project and for sharing their knowledge of hatchery management with JC. Matt Gray, Louis Plough and Katherine McFarland provided beneficial insight and assistance.
Conflict of interest
The authors declare that the research was conducted in the absence of any commercial or financial relationships that could be construed as a potential conflict of interest.
Publisher’s note
All claims expressed in this article are solely those of the authors and do not necessarily represent those of their affiliated organizations, or those of the publisher, the editors and the reviewers. Any product that may be evaluated in this article, or claim that may be made by its manufacturer, is not guaranteed or endorsed by the publisher.
Supplementary material
The Supplementary Material for this article can be found online at: https://www.frontiersin.org/articles/10.3389/faquc.2024.1427405/full#supplementary-material
References
Alberts B. (2015). Molecular Biology of The Cell. 6th ed (New York: Garland science, Taylor and Francis group).
Anderson J. T. (1998). The effect of seasonal variability on the germination and vertical transport of a cyst forming dinoflagellate, Gyrodinium sp., in the Chesapeake Bay. Ecol. Model. 112, 85–109. doi: 10.1016/S0304-3800(98)00074-X
Arfken A., Song B., Allen S. K., Carnegie R. B. (2021). Comparing larval microbiomes of the eastern oyster (Crassostrea virginica) raised in different hatcheries. Aquaculture 531, 735955. doi: 10.1016/j.aquaculture.2020.735955
Arora-Williams K., Holder C., Secor M., Ellis H., Xia M., Gnanadesikan A., et al. (2022). Abundant and persistent sulfur-oxidizing microbial populations are responsive to hypoxia in the Chesapeake Bay. Environ. Microbiol. 24, 2315–2332. doi: 10.1111/1462-2920.15976
Barros T. L., Gomes Santos C. S., De Assis J. E., Souza J. R. B. D. (2017). Morphology and larval development of Polydora cf. websteri (Polychaeta: Spionidae) in a tropical region of north-eastern Brazil. J. Nat. Hist. 51, 1169–1181. doi: 10.1080/00222933.2017.1316426
Bashan A., Gibson T. E., Friedman J., Carey V. J., Weiss S. T., Hohmann E. L., et al. (2016). Universality of human microbial dynamics. Nature 534, 259–262. doi: 10.1038/nature18301
Benjamini Y., Hochberg Y. (1995). Controlling the false discovery rate: A practical and powerful approach to multiple testing. J. R. Stat. Soc Ser. B Methodol. 57, 289–300. doi: 10.1111/j.2517-6161.1995.tb02031.x
Ben-Shachar M., Lüdecke D., Makowski D. (2020). effectsize: estimation of effect size indices and standardized parameters. J. Open Source Software 5, 2815. doi: 10.21105/joss.02815
Brown S. P., Cornforth D. M., Mideo N. (2012). Evolution of virulence in opportunistic pathogens: generalism, plasticity, and control. Trends Microbiol. 20, 336–342. doi: 10.1016/j.tim.2012.04.005
Burge C. A., Kim C. J. S., Lyles J. M., Harvell C. D. (2013). Special issue oceans and humans health: the ecology of marine opportunists. Microb. Ecol. 65, 869–879. doi: 10.1007/s00248-013-0190-7
Callahan B. J., McMurdie P. J., Rosen M. J., Han A. W., Johnson A. J. A., Holmes S. P. (2016). DADA2: High-resolution sample inference from Illumina amplicon data. Nat. Methods 13, 581–583. doi: 10.1038/nmeth.3869
Carstensen G. D., Venter S. N., Wingfield M. J., Coutinho T. A. (2017). Two Ralstonia species associated with bacterial wilt of Eucalyptus. Plant Pathol. 66, 393–403. doi: 10.1111/ppa.12577
Clerissi C., Guillou L., Escoubas J.-M., Toulza E. (2020). Unveiling protist diversity associated with the Pacific oyster Crassostrea gigas using blocking and excluding primers. BMC Microbiol. 20, 193. doi: 10.1186/s12866-020-01860-1
Colwell R. R., Kaper J., Joseph S. W. (1977). Vibrio cholerae, Vibrio parahaemolyticus, and Other Vibrios: Occurrence and Distribution in Chesapeake Bay. Science 198, 394–396. doi: 10.1126/science.198.4315.394
Cram J. A., Gray M. W., McFarland K., Hollins A. (2022). Microbiota of Crassostrea virginica larvae during a hatchery crash and under normal production: Amplicon sequence data. Data Brief 40, 107755. doi: 10.1016/j.dib.2021.107755
Cram J. A., Hollins A., McCarty A. J., Martinez G., Cui M., Gomes M. L., et al. (2024). Microbial diversity and abundance vary along salinity, oxygen, and particle size gradients in the Chesapeake Bay. Environ. Microbiol 26 (1), e16557. doi: 10.1111/1462-2920.16557
Dabney A., Storey J. D. (2004). Q-value estimation for false discovery rate control. Med. (Baltimore) 344, 539–548.
Derome N., Gauthier J., Boutin S., Llewellyn M. (2016). “Bacterial opportunistic pathogens of fish,” in The Rasputin Effect: When Commensals and Symbionts Become Parasitic. Ed. Hurst C. J. (Springer International Publishing, Cham), 81–108. doi: 10.1007/978-3-319-28170-4_4
Elston R., Leibovitz L. (1980). Pathogenesis of experimental vibriosis in larval American oysters, crassostrea virginica. Can. J. Fish. Aquat. Sci. 37, 964–978. doi: 10.1139/f80-126
Elston R., Leibovitz L., Relyea D., Zatila J. (1981). Diagnosis of vibriosis in a commercial oyster hatchery epizootic: Diagnostic tools and management features. Aquaculture 24, 53–62. doi: 10.1016/0044-8486(81)90043-0
Fauci M. F., Dick R. P. (1994). Soil microbial dynamics: short- and long-term effects of inorganic and organic nitrogen. Soil Sci. Soc Am. J. 58, 801–806. doi: 10.2136/sssaj1994.03615995005800030023x
Fuhrman J. A., Cram J. A., Needham D. M. (2015). Marine microbial community dynamics and their ecological interpretation. Nat. Rev. Microbiol. 13, 133–146. doi: 10.1038/nrmicro3417
Gerlach G., von Wintzingerode F., Middendorf B., Gross R. (2001). Evolutionary trends in the genus Bordetella. Microbes Infect. 3, 61–72. doi: 10.1016/S1286-4579(00)01353-8
Gloor G. B., Macklaim J. M., Pawlowsky-Glahn V., Egozcue J. J. (2017). Microbiome datasets are compositional: and this is not optional. Front. Microbiol. 8. doi: 10.3389/fmicb.2017.02224
Gray M. W., Alexander S. T., Beal B. F., Bliss T., Burge C. A., Cram J. A., et al. (2022). Hatchery crashes among shellfish research hatcheries along the Atlantic coast of the United States: A case study of production analysis at Horn Point Laboratory. Aquaculture 546, 737259. doi: 10.1016/j.aquaculture.2021.737259
Helm M. M., Millican P. F. (1977). Experiments in the hatchery rearing of Pacific oyster larvae (Crassostrea gigas Thunberg). Aquaculture 11, 1–12. doi: 10.1016/0044-8486(77)90149-1
Infante-Villamil S., Huerlimann R., Jerry D. R. (2021). Microbiome diversity and dysbiosis in aquaculture. Rev. Aquac. 13, 1077–1096. doi: 10.1111/raq.12513
Jesser K. J., Noble R. T. (2018). Vibrio ecology in the neuse river estuary, north Carolina, characterized by next-generation amplicon sequencing of the gene encoding heat shock protein 60 (hsp60). Appl. Env. Microbiol. 84, e00333–e00318. doi: 10.1128/AEM.00333-18
Kaboré O. D., Godreuil S., Drancourt M. (2020). Planctomycetes as host-associated bacteria: A perspective that holds promise for their future isolations, by mimicking their native environmental niches in clinical microbiology laboratories. Front. Cell. Infect. Microbiol. 10. Available at: https://www.frontiersin.org/articles/10.3389/fcimb.2020.519301.
Kolmakova O. V., Gladyshev M. I., Fonvielle J. A., Ganzert L., Hornick T., Grossart H.-P. (2019). Effects of zooplankton carcasses degradation on freshwater bacterial community composition and implications for carbon cycling. Environ. Microbiol. 21, 34–49. doi: 10.1111/1462-2920.14418
Krehenwinkel H., Wolf M., Lim J. Y., Rominger A. J., Simison W. B., Gillespie R. G. (2017). Estimating and mitigating amplification bias in qualitative and quantitative arthropod metabarcoding. Sci. Rep. 7, 17668. doi: 10.1038/s41598-017-17333-x
Kwok A. Y. C., Wilson J. T., Coulthart M., Ng L.-K., Mutharia L., Chow A. W. (2002). Phylogenetic study and identification of human pathogenic Vibrio species based on partial hsp60 gene sequences. Can. J. Microbiol. 48, 903–910. doi: 10.1139/w02-089
Le Deuff R., Renault T., Gérard A. (1996). Effects of temperature on herpes-like virus detection among hatchery-reared larval Pacific oyster Crassostrea gigas. Dis. Aquat. Organ. 24, 149–157. doi: 10.3354/dao024149
Lee M. (2019). Happy Belly Bioinformatics: an open-source resource dedicated to helping biologists utilize bioinformatics. J. Open Source Educ. 2, 53. doi: 10.21105/jose.00053
Lewis T. E., Garland C. D., O’Brien T. D., Fraser M. I., Tong P. A., Ward C., et al. (1988). The use of 0.2-μm membrane-filtered seawater for improved control of bacterial levels in microalgal cultures fed to larval Pacific oysters (Crassostrea gigas). Aquaculture 69, 241–251. doi: 10.1016/0044-8486(88)90332-8
Lloyd M. M., Pespeni M. H. (2018). Microbiome shifts with onset and progression of Sea Star Wasting Disease revealed through time course sampling. Sci. Rep. 8, 16476. doi: 10.1038/s41598-018-34697-w
Martin M. (2011). Cutadapt removes adapter sequences from high-throughput sequencing reads. EMBnet.journal 17, 10. doi: 10.14806/ej.17.1.200
Martinelli J. C., Lopes H. M., Hauser L., Jimenez-Hidalgo I., King T. L., Padilla-Gamiño J. L., et al. (2020). Confirmation of the shell-boring oyster parasite Polydora websteri (Polychaeta: Spionidae) in Washington State, USA. Sci. Rep. 10, 3961. doi: 10.1038/s41598-020-60805-w
McNichol J., Berube P. M., Biller S. J., Fuhrman J. A. (2021). Evaluating and improving small subunit rRNA PCR primer coverage for bacteria, archaea, and eukaryotes using metagenomes from global ocean surveys. mSystems 6, e0056521. doi: 10.1128/mSystems.00565-21
Modak T. H., Gomez-Chiarri M. (2020). Contrasting immunomodulatory effects of probiotic and pathogenic bacteria on eastern oyster, crassostrea virginica, larvae. Vaccines 8, 588. doi: 10.3390/vaccines8040588
Nakamura K., Iizuka R., Nishi S., Yoshida T., Hatada Y., Takaki Y., et al. (2016). Culture-independent method for identification of microbial enzyme-encoding genes by activity-based single-cell sequencing using a water-in-oil microdroplet platform. Sci. Rep. 6, 22259. doi: 10.1038/srep22259
Oksanen J., Simpson G. L., Blanchet F. G., Kindt R., Legendre P., Minchin P. R., et al. (2024). vegan: community ecology package. Available online at: https://CRAN.R-project.org/package=vegan. (Acessed August 13, 2024).
Peixoto R. S., Harkins D. M., Nelson K. E. (2021). Advances in microbiome research for animal health. Annu. Rev. Anim. Biosci. 9, 289–311. doi: 10.1146/annurev-animal-091020-075907
Purgar M., Kapetanović D., Geček S., Marn N., Haberle I., Hackenberger B. K., et al. (2022). Investigating the ability of growth models to predict in situ vibrio spp. Abundances. Microorganisms 10, 1765. doi: 10.3390/microorganisms10091765
Quast C., Pruesse E., Yilmaz P., Gerken J., Schweer T., Yarza P., et al. (2013). The SILVA ribosomal RNA gene database project: improved data processing and web-based tools. Nucleic Acids Res. 41, D590–D596. doi: 10.1093/nar/gks1219
Ramachandran P., Reed E., Commichaux S., Strain E., Depaola A., Rikard S., et al. (2018). Characterization of the microbiota of oyster larvae (Crassostrea virginica) and tank water from an aquaculture system with high and low larval survival rates. Genome Announc. 6, e00597–18. doi: 10.1128/genomeA.00597-18
Richards G. P., Watson M. A., Needleman D. S., Church K. M., Häse C. C. (2015). Mortalities of Eastern and Pacific Oyster Larvae Caused by the Pathogens Vibrio coralliilyticus and Vibrio tubiashii. Appl. Env. Microbiol. 81, 292–297. doi: 10.1128/AEM.02930-14
Rivera-Zuluaga K., Hiles R., Barua P., Caldwell D., Iyer-pascuzzi A. S. (2023). Getting to the root of Ralstonia invasion. Semin. Cell Dev. Biol. 148–149, 3–12. doi: 10.1016/j.semcdb.2022.12.002
Robert R., Gérard A. (1999). Bivalve hatchery technology: The current situation for the Pacific oyster Crassostrea gigas and the scallop Pecten maximus in France. Aquat. Living Resour. 12, 121–130. doi: 10.1016/S0990-7440(99)80021-7
Sprecher B. N., Zhang H., Park G., Lin S. (2021). Isolation from a fish kill and transcriptomic characterization of Gyrodinium jinhaense off Long Island Sound. Harmful Algae 110, 102136. doi: 10.1016/j.hal.2021.102136
Stevick R. J., Sohn S., Modak T. H., Nelson D. R., Rowley D. C., Tammi K., et al. (2019). Bacterial community dynamics in an oyster hatchery in response to probiotic treatment. Front. Microbiol. 10. doi: 10.3389/fmicb.2019.01060
Team R. D. C. (2022). R: A Language and Environment for Statistical Computing (Vienna, Austria: R Foundation for Statistical Computing). Available at: http://www.R-project.org/.
Urban E. R., Langdon C. J. (1984). Reduction in costs of diets for the American oyster, Crassostrea virginica (Gmelin), by the use of non-algal supplements. Aquaculture 38, 277–291. doi: 10.1016/0044-8486(84)90333-8
Větrovský T., Baldrian P. (2013). The variability of the 16S rRNA gene in bacterial genomes and its consequences for bacterial community analyses. PloS One 8, e57923. doi: 10.1371/journal.pone.0057923
Vignier J., Laroche O., Rolton A., Wadsworth P., Kumanan K., Trochel B., et al. (2021). Dietary exposure of pacific oyster (Crassostrea gigas) larvae to compromised microalgae results in impaired fitness and microbiome shift. Front. Microbiol. 12. doi: 10.3389/fmicb.2021.706214
Walker T. (2017). Seed supply a challenge for North American oyster producers. Hatch. Int. Available at: https://www.hatcheryinternational.com/news/seed-supply-a-challenge-for-north-american-oyster-producers-1241.
Wallace R. K., Waters P., Rikard F. S. (2008). Oyster hatchery techniques. (Southern Regional Aquaculture Center) 6.
Yeh H., Skubel S. A., Patel H., Cai Shi D., Bushek D., Chikindas M. L. (2020). From farm to fingers: an exploration of probiotics for oysters, from production to human consumption. Probiotics Antimicrob. Proteins 12, 351–364. doi: 10.1007/s12602-019-09629-3
Yilmaz P., Parfrey L. W., Yarza P., Gerken J., Pruesse E., Quast C., et al. (2014). The SILVA and “All-species living tree project (LTP)” taxonomic frameworks. Nucleic Acids Res. 42, D643–D648. doi: 10.1093/nar/gkt1209
Keywords: oyster, microbiome, unexplained die-offs, harmful algae, amplicon sequencing, hatchery
Citation: Cram JA, McCarty AJ, Willey SM and Alexander ST (2024) Microbial community structure variability over the development of healthy and underperforming oyster larval hatchery broods. Front. Aquac. 3:1427405. doi: 10.3389/faquc.2024.1427405
Received: 03 May 2024; Accepted: 26 August 2024;
Published: 20 September 2024.
Edited by:
Krishna Thakur, University of Prince Edward Island, CanadaReviewed by:
Muhammed Duman, Bursa Uludağ University, TürkiyeMargarita Smirnov, Ministry of Agriculture and Rural Development, Israel
Copyright © 2024 Cram, McCarty, Willey and Alexander. This is an open-access article distributed under the terms of the Creative Commons Attribution License (CC BY). The use, distribution or reproduction in other forums is permitted, provided the original author(s) and the copyright owner(s) are credited and that the original publication in this journal is cited, in accordance with accepted academic practice. No use, distribution or reproduction is permitted which does not comply with these terms.
*Correspondence: Jacob A. Cram, amNyYW1AdW1jZXMuZWR1