
94% of researchers rate our articles as excellent or good
Learn more about the work of our research integrity team to safeguard the quality of each article we publish.
Find out more
ORIGINAL RESEARCH article
Front. Aquac., 19 May 2023
Sec. Disease and Health Management
Volume 2 - 2023 | https://doi.org/10.3389/faquc.2023.1125595
This article is part of the Research TopicEditors' Showcase: Disease and Health ManagementView all 5 articles
 Ahmed Elsheshtawy1,2
 Benjamin Gregory James Clokie1
 Amaya Albalat1
 Are Nylund3
 Trond Einar Isaksen4Elisabeth Napsøy Indrebø3,5Linda Andersen3
 Lindsey Jane Moore3Simon MacKenzie1*
Introduction: Net biofouling has a significant impact for the global salmon industry in the seawater grow-out stage in terms of its management. Current mitigation strategies occur primarily through the regular removal of biofouling using in situ cleaning. While in situ net cleaning is effective there is uncertainty as to whether the equipment or dispersed material has an impact upon the fish in the cages. Through direct contact with the environment, the significant surface area of the gill including its microbiome is directly exposed to the acute environmental changes generated by net cleaning. This study aimed to provide a detailed understanding of the impact of in situ net cleaning on Atlantic salmon (Salmo salar) and rainbow trout (Oncorhynchus mykiss) gill health.
Methods: Three field trials were conducted on commercial fish farms in western Norway. Fouling organisms on net pens and flushed particles during in situ cleaning were identified and screened for major fish pathogens. Hydrographic profile measurements were performed to measure the impact on water quality. Gill samples were examined for histopathological changes, immune gene expression, and the prevalence of major pathogens. 16S rRNA amplicon sequencing was employed to explore the impact of net cleaning on gill microbiome.
Results and discussion: Data obtained from these trials identified a diversity of fouling species including hydroids, algae, skeleton shrimps, and filter feeders on net pens, a direct impact on measured water quality indicators, a moderate change in gill inflammatory and antigen presentation activity at the level of mRNA, and a large significant change in gill microbiome. Observed changes in gill microbial community involved a decrease in bacterial richness coupled to an increase in identified bacterial genera related to negative health consequences. Parallel analyses for pathogens load in biofouling organisms and flushed particles highlighted the presence of several fish bacteria and parasites. However, minor changes were detected in salmon gill pathogen diversity and loading. Our results suggest that biofouling organisms may act as transient reservoirs for some fish pathogens but not viruses and that gill microbial dysbiosis could be related to the host stress response during and post net cleaning.
Atlantic salmon (Salmo salar) and rainbow trout (Oncorhynchus mykiss) aquaculture have undergone rapid expansion over the last decades with the majority of production situated in Norway, Chile and Scotland (Naylor and Burke, 2005; FAO, 2018). Expansion has been supported through the adoption of technologies that increase production volume such as the adoption of larger net pen sizes which increase production efficiencies. Despite higher efficiencies, larger pens present additional challenges for seawater grow-out such as the necessity to control net biofouling where unwanted growth and accumulation of diverse organisms occurs on pen nets (Bloecher and Floerl, 2021). Biofouling organisms mainly include the hydroid Ectopleura larynx, caprellid amphipods, blue mussel Mytilus edulis, ascidian Ciona intestinalis, red algae Ectocarpus spp. and green algae Ulva spp. (Bloecher et al., 2013). Net occlusion reduces water quality by limiting water exchange, reducing oxygen saturation, inhibiting waste removal (Madin et al., 2010), and potentially decreasing cleaner fish efficiency through the provision of alternative food sources (Imsland et al., 2015). Several pathogens have been detected within biofouling communities, although there is no evidence that these communities act as a significant source of infection (Hellebø et al., 2017; Østevik et al., 2021). Besides biological impacts, biofouling has an impact on farm infrastructure, increasing pressure on mooring loads through increased net weights and reducing pen volume through deformation potentially leading to net damage (Gansel et al., 2015; Bannister et al., 2019). Thus, biofouling can negatively impact fish health and welfare and farm infrastructure.
Mitigation of net biofouling occurs primarily through either the use of antifouling net coatings or the regular removal of biofouling using in situ cleaning. Antifouling net coatings minimize biofouling growth on nets via the use of biocides with copper oxide the most frequently used in both Norway and Scotland (Bloecher and Floerl, 2020). Temporal reductions in the efficacy of copper-based coatings means that treated nets are not effective for the entire seawater production phase with several studies demonstrating that biofouling may occur within 8-12 weeks of immersion (Bloecher et al., 2015). Additional concerns have been raised over the potential hazardous impact of copper on the environment (Bloecher and Floerl, 2020). Such factors have resulted in the widespread adoption of in situ net cleaning to control net biofouling either as an alternative or as a complimentary approach to control biofouling on salmon farms. In situ cleaning is typically conducted using remotely operated cleaning rigs featuring several rotating discs that push water at a high pressure (50 to 300 bar) through nozzles against the net (Bannister et al., 2019). During this process, flushed particles are discharged directly into the surrounding environment within and around the cage. Particles contain a mixture of biofouling organisms and potentially residues of antifouling coatings (Floerl et al., 2016). The frequency of net cleaning varies according to biofouling accumulation rates, cultured species requirements, and net coating. Net cleaning rates have increased in Scotland and Norway due to concerns over cleaner fish performance and in some sites with high growth cleaning may be performed every two weeks or more (Bloecher and Floerl, 2021).
While in situ net cleaning is effective to mitigate issues related to biofouling, there is uncertainty as to whether the equipment or disposed material has a negative impact upon the fish. Recent published data show a temporal decrease in appetite and increased mortalities among salmon and cleaner fish after net cleaning events (Bloecher and Floerl, 2021). Previously, it has been suggested that the flushed particles during net cleaning can cause mechanical injuries to the gills and skin of farmed fish (Floerl et al., 2016). In addition, the release of E. larynx nematocyst toxins may cause irritation and damage to fish gills (Bloecher et al., 2018). Gill lesions such as thrombi, lamellar epithelial hyperplasia, and inflammation has also been observed post-cleaning (Bloecher et al., 2018; Østevik et al., 2021). Salmon producers highlighted several concerns over the development of disease outbreaks due to stress associated with the cleaning process in addition to the potential release of pathogens present in the biofouling organisms (Bloecher and Floerl, 2021).
The significant surface area and direct contact with the environment leaves the gill and its associated microbiome especially exposed to such concerns. The gill microbiome plays a pivotal role in the maintenance of healthy mucosal barriers and thus a stable immune system and overall health (Pérez et al., 2010). Dysbiosis, disturbance or imbalance of the microbiome, can dramatically impact overall health and physiology and may result from pathogenic infections and or treatment (Butt and Volkoff, 2019). For instance, dysbiosis of the salmon gut has been associated with both the bacterial infection Tenacibaculum dicentrarchi and the experimental treatment with formalin (Bozzi et al., 2021). Although some studies have assessed the effects of net cleaning on overall salmon gill health (Bloecher et al., 2018; Østevik et al., 2021), to the authors knowledge no studies have addressed the impact of net cleaning on the microbial communities present on the gill. Therefore, the aim of this study was to provide a detailed understanding of the impact of in situ net cleaning on Atlantic salmon and rainbow trout gill health through: (1) identification of the biofouling organisms on net pens and quantification of the pathogens loads in these organisms; (2) assessment of the perturbations in water quality from in situ cleaning of the nets and quantification of pathogen load in flushed particles; (3) investigation of the histopathological changes and the prevalence of gill pathogens following net cleaning; (4) evaluation of the impact of net cleaning on key markers of the salmon gill immune response; and (5) exploring the perturbations of the gill microbial community after in situ net cleaning.
This study was carried out in accordance with the UK Animal Scientific Procedures Act. The study protocol was approved by the Norwegian Animal Research Authority (NARA) in 2019 under the identification code 18259 and the University of Stirling Animal Welfare and Ethical Review Body (AWERB (19/20) 63).
The field trials were conducted on commercial fish farms producing Atlantic salmon (Site A and B) and rainbow trout (Site C). Location of the fish farms were moderate exposed from waves and currents and none of the farm sites were directly impacted by freshwater from river runoffs. A full schematic outlining the experimental design and methods used for the analysis is presented in Supplementary Figure S1, and production data are illustrated in Table 1. In situ net cleaning was performed using remote-controlled subsea vehicles (StealthCleaner [Site A and C] and Østerbø Yanmar net cleaner [Site B]) with a water pressure ranged from 60 to 175 bar. The net cleaning process took 2-5 hrs per net pen. Average net cleaning frequency was given as every second week from May to November 2019.
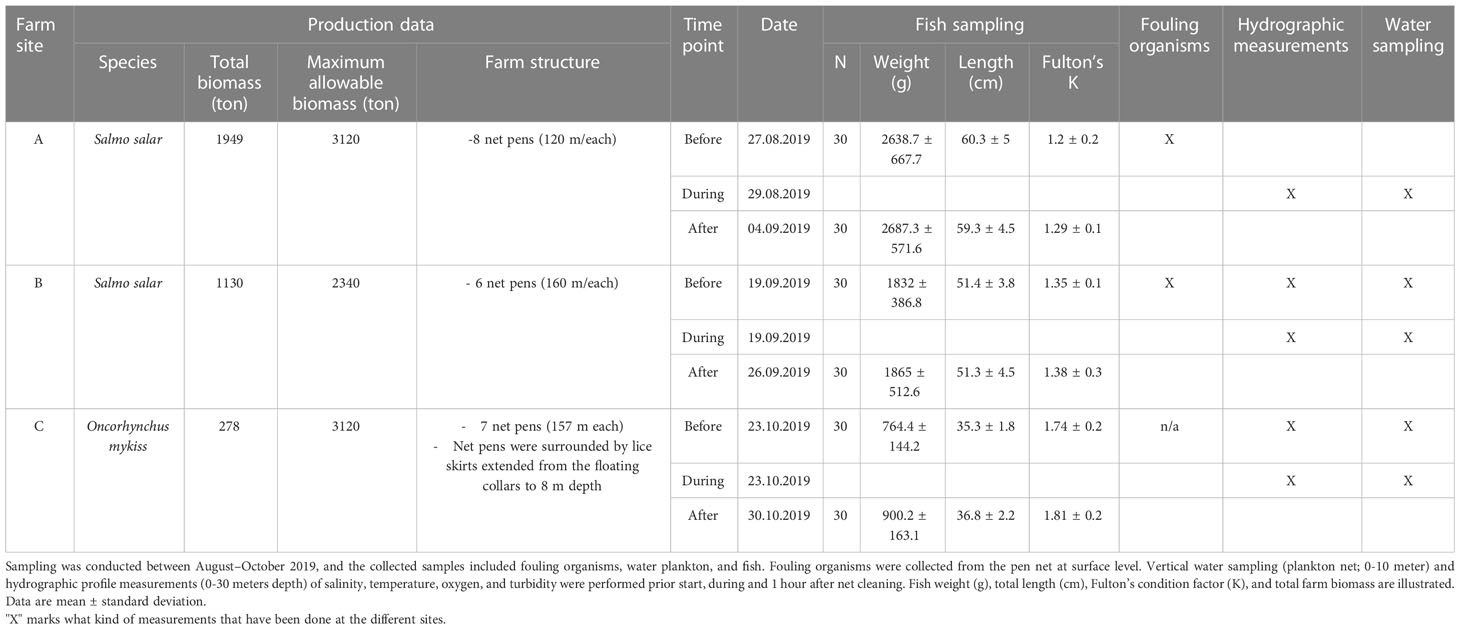
Table 1 Sampling events and production data of the commercial farm sites (A, B and C).
Sampling and measurements at the farm sites were conducted in the period from August to October 2019. Gill samples were collected pre- and 5-8 days post- net cleaning. Collection of fouling organisms from the pen wall at surface layer was conducted prior net cleaning, on the same day of fish sampling. In addition, several hydrographic profile measurements and water sampling were performed during net cleaning to measure impact of net flushing on water quality. Such measurements were conducted one hour before net cleaning as a reference, and one hour after to measure clearance of waterborne particles. Sampling events are summarized in Table 1.
Fouling communities on the upper part of net walls were examined with a handheld underwater camera (GoPro Hero4 attached to an extension pole) before net cleaning for describing dominant species and fouling coverage of the net area. Fouling organisms were collected from all locations except Farm C, where there were no fouling organisms on net walls at surface level due to the use of sea lice skirt. Fouling organisms were sampled by hand from the net wall and other submerged surfaces (floating collars) at surface level and stored in wide neck bottles (1000 mL) filled with seawater. The bottles were labelled and transported in a thermo box to the NORCE laboratory in Bergen. The samples were stored at 4°C overnight and examined at the laboratory the following morning.
In situ net cleaning was performed using hydro-flushing at high pressure. This method results in flushed particles at varying sizes and sedimentation rates depending on fouling density, fouling species and the water pressure used. Vertical water sampling using a plankton net (mesh size 180 µm, diameter 27 cm) from a depth of 10 meters to surface was applied to collect flushed particles. Samples were collected pre-, during- and 40-60 mins post- net cleaning. No samples were collected pre-net cleaning at Farm A as the cleaning process was started when the sampling team arrived to the farm. Particles from the water column were collected in a 50 mL glass bottle at the end of the plankton net. Particles and seawater from the collecting bottle were transferred to a wide neck bottle (1000 mL). Vertical water sampling with plankton net was repeated five times resulting in a total sampling size of 250 ml. All sampling events were carried out in downstream net pens. The bottles were labelled and transported in a thermo box to the NORCE laboratory in Bergen for identification and further analyses of the flushed particles.
Atlantic salmon and rainbow trout were sampled before and after net cleaning (Table 1). Fish were collected using a net inside the cages, euthanized using an overdose of Benzocaine (Benzoak vet®, ACD Pharma AS, Leknes, Norway) and the weight and length were recorded for each specimen before sampling. All external lesions and count of salmon lice were registered. The second gill arch on the right sides was collected for histopathology (stored in buffered formalin solution, 10%), and the second gill arch on the left side were frozen in separate tube on dry ice and stored at -70°C for qPCR detection of major pathogens. Gill swabs were collected from second left gill arch and stored in Longmire’s buffer (2 M Tris-HCl, 0.5 M EDTA, 5 M NaCl, and 20%(w/v) SDS, pH 8.0 in double-distilled water) for microbiome analysis (Longmire et al., 1997). Gill tissue samples from the third left gill arch were collected in RNA later for gene expression analysis. Microbiome and gene expression samples were collected from site A only.
Effective net cleaning time ranged from 2 to several hours per pen and as such long lasting cleaning processes might result in accumulation of waterborne particles in the pen environment. Profile measurements of turbidity were carried out in downstream net pens to examine variations in particle densities at different depths (0-30 m) before, during and after net cleaning. Turbidity was measured with a sensor (Backscatter; auto range) attached to CTD Profiler Model SD208 (SAIV AS). The profile measurements also included dissolved oxygen measured as percent saturation. Any changes in levels of dissolved oxygen during net cleaning compared to before and after net cleaning reflect changes in oxygen consumption in the pen water. Dissolved oxygen was measured with an optical sensor (RINKO III) attached to the same CTD profiler as the turbidity sensor. In addition, the CTD profiler was used to measure conductivity (C), temperature (T) and depth (D). Salinity profiles were calculated from C, T and D. All data processing were performed with the accompanying software SD200W (SAIV AS).
Current conditions at fish farm sites contribute to dispersal of waterborne particles and renewal of pen water. Hence, current conditions (speed and direction) play a significant role in clearance of flushed particles in the water that originates from net cleaning. Currents were measured on the farm sites during net cleaning using a current profiler (Aquadopp Profiler 400 KHz, Nortek). The instrument has a maximum profiling range given as 60-90 meters and was deployed at one meter depth close to the net pen being cleaned. The instrument was set up to measure currents continuously (10 seconds interval) every meter from surface level (2 meters depth) and down to 60 meters depth. Data were downloaded from the Aquadopp Profiler and validated using the software Surge (Nortek v.1.14.01) and SeaReport (Nortek v.1.1.1). The data processing was performed using accompanying software (SD6000 v.4.3.49).
Biofouling organisms collected from the pen walls and floating collars were sorted into groups (algae, hydroids, bryozoans, mussels, and crustaceans) and placed in seawater filled petri dishes (sea water origin from sampling site). Subsamples were taken for identification using a microscope (Leica M80). Images were captured by a digital color camera (Leica EC3) connected to the microscope for documentation and identification of the fouling organisms with the software Leica LAS EZ software (version 3.4.0). Subsamples of the fouling organisms were also taken for RNA extraction prior qPCR analyses for detection of fish pathogens. These samples were homogenized using disposal scalpels and aliquoted to replicate samples (N=5; 50-90 mg per sample) and stored at -25°C in ethanol filled 2 mL cryotubes (VWR®) prior further analyses for detection of fish pathogens. Morphological identification and classification of fouling organisms was performed according to Rueness (1998); Hayward and Ryland (2017).
Flushed particles collected with plankton net were added to a 250 mL graduated measuring cylinder (tall form, class A, VWR®). Volume of sedimented particles were measured to examine differences in the collected samples before-, during- and 40-60 mins after- net cleaning. The samples were then transferred to disposable petri dishes for identification with a microscope (Leica M80) followed by sample aliquoting and storage prior to further analyses for detection of fish pathogens. Identification and aliquoting of sample replicates followed the same procedure as described for fouling organisms.
RNA was extracted from gill tissue samples as described by Gunnarsson et al. (2017). In brief, a 100 mg of the gill tissue was added to 1000 μL of QIAzol (QIAGEN, Germany), and homogenized (3 minutes, 30 Hz) with TissueLyser II (QIAGEN, Germany). The samples were incubated for 5 min at room temperature then 200 μL of chloroform was added to the homogenate followed by a vigorous vortex for 15s and incubated for 5 min at room temperature. The samples were centrifuged at 12,000 x g for 15 min at 4°C for phase separation and the upper aqueous phase was transferred to a fresh tube. The RNA was precipitated by adding equal volume of 2-propanol followed by incubation at room temperature for 10 min. The samples were centrifuged at 12,000 xg for 15 min at 4°C, which resulted in a pellet of RNA at the bottom/side of the tube. The supernatant was removed, and pellet was washed in 1000 μL of 75% ethanol. After washing, the pellet was air-dried, and the RNA was eluted in 100 μL RNase free water (Sigma-Aldrich, USA). Samples of fouling organisms and flushed particles were pre-treated prior RNA extraction to remove ethanol and ensure high RNA yield. Cryotubes containing the ethanol preserved samples were centrifuged and ethanol removed using pipette. Each sample was then rehydrated by adding 200 µL water (Milli-Q®, Merk Millipore) and homogenized for 30 seconds using TissueRuptor II (QIAGEN, Germany) with disposal probes. A volume of 400 µL Milli-Q water was added to the homogenized sample. The diluted sample was transferred to a new 2 mL tube and centrifuged at 20,000 x g for 5 minutes at room temperature. The supernatant was removed, and the remaining pellet dissolved in 600 µL MBL solution with 2-mercaptoethanol. The solution was spiked with 2 µL Halobacterium salinarum as an exogenous control for real-time qPCR analyses to measure inhibition of the PCR reactions (Andersen et al., 2010). RNA was extracted using RNeasy PowerPlant® Kit (QIAGEN, Germany) according to the manufacturer’s protocol. All RNA samples were stored at -70°C until further analyses.
Real-time qPCR analyses of RNA targets for gill tissue, fouling organisms and flushed particles were set up using AgPath-ID™ One-Step RT-PCR Reagents (ThermoFisher Scientific). Assays targeting H. salinarum (exogenous control) and selected fish pathogens are listed in Supplementary Table S1. The qPCR master mixture consisted of 6.25 µL RT-PCR buffer, 1.78 µL RNase free water (Sigma-Aldrich), 1 µL Forward primer, 1 µL Reverse primer, 0.22 µL Probe and 0.25 µL 25X RT-PCR Enzyme.
The qPCR run was performed using QuantStudio™ 3 Real-Time PCR System (Applied Biosystems). The instrument was set up according to the manufacturer’s thermal protocol: Reverse transcription at 45°C for 10 minutes followed by RT, RT inactivation at 95°C for 10 minutes followed by 45 cycles at 95°C for 15 seconds (denaturation) and 60°C for 45 seconds (annealing/extension). Pathogen loads in gill tissues, fouling organisms, and flushed particles were quantified as number of thermal cycles for initial detections in the Real-time qPCR runs (Cq values) executed with a maximum of 40 cycles.
All statistical analyses were carried out using Prism (Version 8.4.2, GraphPad Software, LLC). Differences in prevalence of the selected pathogens were analyzed using a 2x2 contingency table and Fishers Exact test. The density data were tested for normality using Shapiro-Wilks test. When the data were normally distributed t-test was used test the difference before and after net cleaning, and Mann-Whitney U test for non-parametric data. Kruskal-Wallis test was used to compare mortality rates at the different farm sites. The results were considered significant with a P <0.05.
Gill arches from the sampled fish were fixed in 10% formalin and transported to Pharmaq Analytiq AS, where they were processed for histological examinations. The tissues were embedded in paraffin (Gamble, 2008; Dahle et al., 2020b). The stained sections were examined at the University of Bergen using a Leica DM500 and a Zeiss Axio scope with an attached Axiocam 105 Colour camera. The tissues were examined for presence of pathological changes.
Total RNA was extracted from a 100 mg of gill tissue samples using TRI Reagent (Sigma-Aldrich, USA) following to the manufacturer’s protocol. The extracted RNA was eluted in 100 µL DEPC-treated Water (ThermoFisher Scientific, UK). The quality and quantity of RNA samples were evaluated using a Nanodrop ND-1000 Spectrophotometer (ThermoFisher Scientific, UK). The integrity of the RNA was evaluated by 1.5% (v/v) agarose gel (Sigma-Aldrich, USA) containing 0.1 µg/mL ethidium bromide (Sigma-Aldrich, USA) in Tris-Acetate-EDTA (TAE) buffer (Sigma-Aldrich, USA), and confirmed with Bioanalyzer 2100 (Agilent Technologies, USA). Samples with RIN > 8.2 were used for the subsequent analysis.
cDNA was synthesized and genomic DNA contamination was removed from 1 µg of the purified RNA sample using QuantiTect® Reverse Transcription (Qiagen, Germany) according to the manufacture’s protocol. To confirm successful reverse transcription, the cDNA was tested using PCR for Salmo salar Beta actin gene.
A real time absolute qPCR was performed to quantify the target genes copy numbers in the samples. Primers were designed for the following Atlantic salmon genes MHCII, IL-1β, TNF-α, IL-10 and TGF-β by using NCBI Primer design tool (Supplementary Table S1). The designed primers were optimized, and the clean PCR products were ligated into a vector using pGEM®-T Easy Vector Systems (Promega, UK) and transformed into XL1-Blue Competent Cells (Agilent Technologies, USA) following the manufacturer’s protocol. The plasmid DNA was extracted using NucleoSpin Plasmid Quick pure (Macherey-Nagel, Germany). Successful cloning was confirmed using PCR and plasmid DNA Sanger sequencing using T7 promoter (GTAATACGACTCACTATAGGGC) (Eurofins Genomics, UK). The sequence was aligned with the specific primers for the insert using Clustal Omega Multiple Sequence Alignment software and the obtained product sequence was blasted in the gene bank to check the correct insertion. Then, copy numbers per µL of plasmid DNA were calculated and used for generating a standard curve for absolute quantification. qPCR was performed for all samples in triplicate using Luminaris Color HiGreen qPCR Master Mix (ThermoFisher Scientific, UK) in Stratagene MX3005p qPCR (Agilent Technologies, USA).
Data were analyzed using GraphPad prism version 8.4.2 (San Diego, CA, USA). The obtained data were tested for normality by assessing frequency of distribution in the histogram and using Anderson-Darling test, D’Agostino & Pearson test, Shapiro-Wilk test, and Kolmogorov-Smirnov test. All results are reported as means and standard deviation (SD). When data were normally distributed independent t-test was used to investigate statistical significance between the two time points. Wilcoxon test was used when the data were not normally distributed. Differences between groups were considered statistically significant at p <0.05.
DNA was extracted from site A gill samples using E.Z.N.A.® Tissue DNA Kit (Omega Bio-Tek Inc, USA) according to manufacturing protocol with some modifications. The modifications included a pre-lysis heating of the samples to 95°C for 10 min to increase the efficiency of DNA extraction from gram-positive bacteria and using Longmire’s buffer as a lysis buffer. DNA was eluted using 100 μL elution buffer, and the DNA purity and concentration were evaluated using a Nanodrop ND-1000 Spectrophotometer (ThermoFisher Scientific, UK). The DNA concentrations was also confirmed using a Qubit 2.0 Fluorometer (ThermoFisher Scientific, UK).
Bacterial 16S rRNA gene copy numbers in the samples were quantified in the samples using absolute qPCR assay as described by Clokie Benjamin Gregory et al. (2022). Primers and probe are listed in Supplementary Table S1. qPCR was performed for all samples in triplicate using SensiFAST Probe Lo-ROX Mix (Bioline, UK) with the following conditions: 95°C for 10 min, followed by 40 cycles of amplification (95°C for 30 s and 60°C for 1 min). All qPCR runs showed good linearity (R2 = 0.991–1, p < 0.05) and amplification efficiency of 95–102%.
To prepare comparable 16S rRNA microbiome libraries, template DNA used to build the amplicon libraries was normalized to an equal 16S rRNA concentration (1e6 16S rRNA copy numbers) according to the qPCR assay results. Bacterial 16S rRNA Illumina amplicon libraries were generated using a two-step PCR amplicon assay from all the samples, negative sequencing control (NSC), no template control (NTC) in addition to a positive control IoA microbiome standard according to Elsheshtawy et al. (2021). The V4 region of the bacterial 16S rRNA gene was PCR-amplified in the first PCR using primers over hanged with Illumina adaptors (Supplementary Table S1) and barcoded in a second PCR by the addition of unique index sequences to the 5′ and 3′ ends of each sample using Nextera XT Index Kit (Illumina, USA). An equimolar final pool was prepared from the samples and sequencing was performed by Genomic Pipelines Group Earlham Institute (Norwich, UK) at PE250 using an S4 flowcell on an Illumina Novaseq (Illumina, USA).
The raw sequence data provided by Earlham Institute contained 72 paired fastq files. All data processing was performed on a 32 processor HP workstation running Debian Linux (version 10). Sample sequence data (fastq files) were processed (Sequences cleaning, clustering in OTUs, and taxonomical classifications) by developing an automated python pipeline using Mothur’s SOP (Schloss et al., 2009) and the SILVA reference database (Quast et al., 2013). The total number of the retrieved raw reads were approximately 29.2 million and the number of sequences per sample ranged between 111664 and 1122903 with an average of 405197 reads. All statistical analysis was performed in R studio (Version 1.2.5042). All figures were produced using the R packages ggpubr and ggplot2 (Wickham, 2016; Kassambara, 2020a). Statistical analysis was conducted with the rstatix package (Kassambara, 2020b). Alpha diversity indices were calculated using the Phyloseq package (McMurdie and Holmes, 2013). Shapiro–Wilks test was used to verify homogeneity of variance of the alpha diversity estimates before testing the differences between groups. When the data were normally distributed, alpha diversity metrics were analyzed using t-test. Whereas if the data weren’t normally distributed, Wilcoxon test (rank sum test) was used and p values were adjusted using Benjamini and Hochberg (BH) correction (Benjamini and Hochberg, 1995). Beta diversity comparisons were calculated using Bray-Curtis pairwise distances in vegan (Oksanen et al., 2013) and phyloseq packages, and visualized using non-metric multidimensional scaling (NMDS). Differences between groups were calculated using non-parametric permutational multivariate analysis of variance (PERMANOVA) of 1002 permutations with vegan package. Differences between groups were considered statistically significant at adjusted P<0.05. In order to compare the relative of abundance of taxa between different groups, we generated differential heat trees using Metacoder R package (Foster et al., 2017). The trees illustrate the log2 fold change in taxa abundance. A Wilcoxon test followed by a Benjamini-Hochberg (FDR) correction was applied to test the differences between the same taxa in the two timepoints and p value was set to 0.05. In addition, the significant genera between the two time points were identified using Wilcoxon rank-sum test followed by a Benjamini-Hochberg (FDR) correction and p value was set to 0.05.
Measurements at 5- and 15-meters water depths during net cleaning revealed acceptable current conditions at all farms. Mean current speed on farm A and B ranged from 24 to 32 m/s, whereas farm C ranged from 18 to 24 m/s, with highest current speeds were measured at 15 meters depth at all sites. Hydrographic profile measurements demonstrated variability in both oxygen and turbidity during the net cleaning process across all three farms (Figure 1). The lowest oxygen saturation measured on Farm A at 5- and 15-meters depths was 83% and 80% respectively, demonstrating 10 to 14% drop compared to the measurements one hour after net cleaning. A similar pattern was also apparent on Farm B. Whereas, no differences were observed on Farm C, suggesting no stratification of the water layers. Temperature and salinity measurements indicated a pycnocline at 10 m depth on Farm A and B. However, no pycnocline was identified on Farm C (Figure 1). Turbidity measurements on Farm A revealed a peak in turbidity at 7 meters depth (above the observed pycnocline) during the initial period of the net cleaning (Figure 1). Turbidity levels remained elevated at all depth from 5-30 meters during the net cleaning period. No similar peaks were measured on Farm B or C. There was, however, an increased level in turbidity between 8 and 20 meters with a minor peak at 15 meters depth during net cleaning on Farm C. The volume of sedimented particles (particle concentration) collected with plankton nets illustrates how particle concentrations and turbidity change during the net cleaning with increases during cleaning operations (Figure 1). The highest particle concentration (sediment constituted 22% of the water volume) was measured in samples collected from Farm C during the final period of net cleaning. These particles were identified as fragmented fouling organisms and small fragments of feces and copper (Cu) particles was also abundant in the samples from Farm C. Likewise, Farm A and B showed 8% and 5.5% peaks in particle concentration, with similar compositions as Farm C. Examples of flushed particles collected from the different farms are shown in Figure 2.
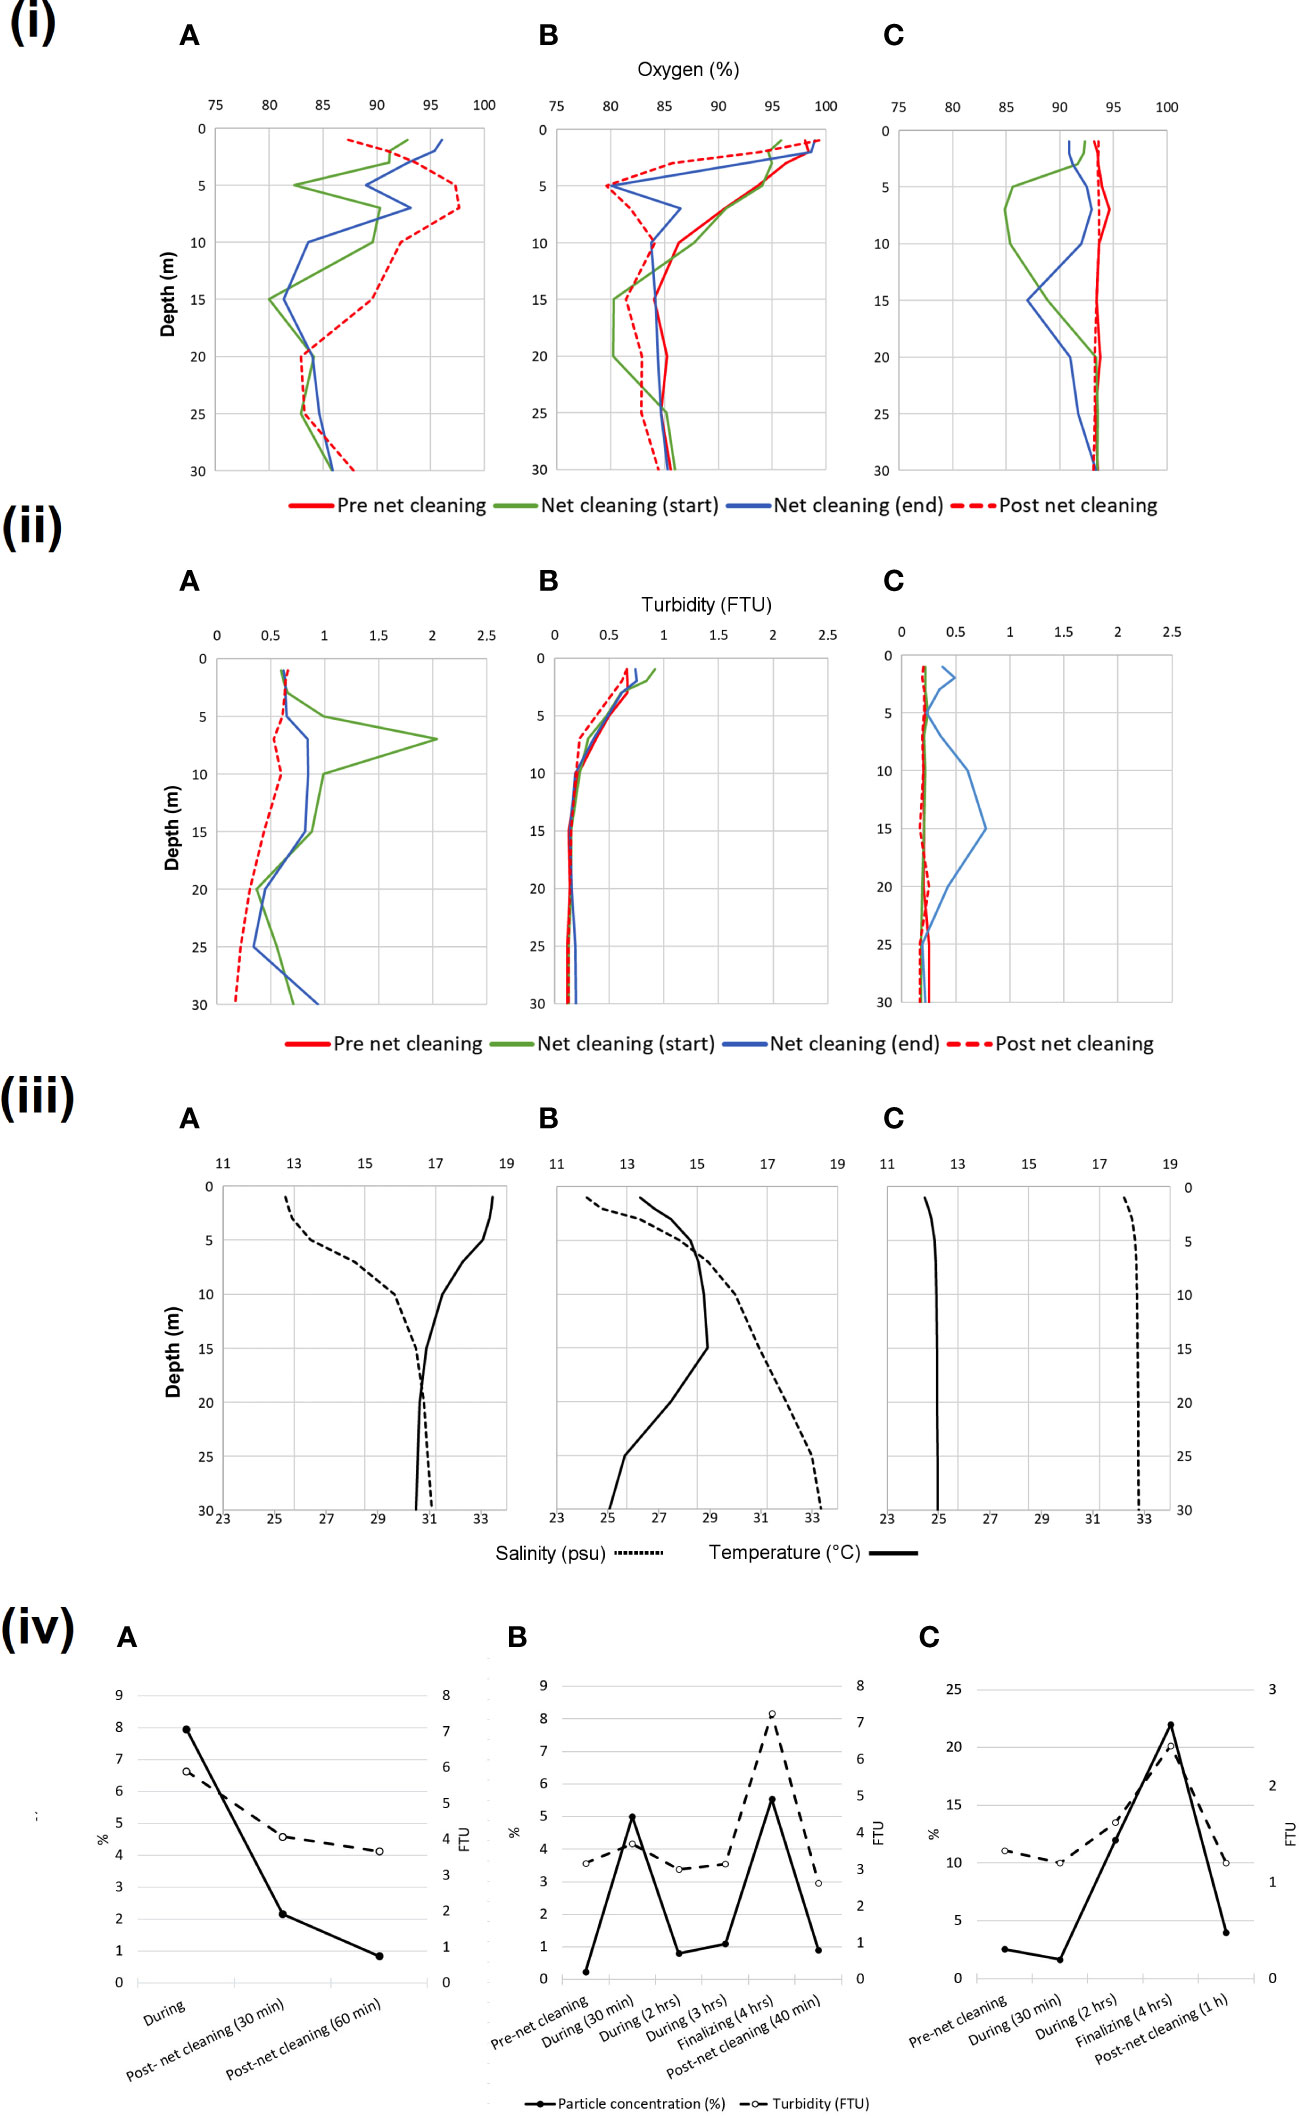
Figure 1 Impact of in situ net cleaning on farm water quality. Profile measurements of (i) dissolved oxygen, (ii) turbidity, (iii) temperature and salinity, and (iv) particle concentration and turbidity at farm sites (A–C). Particle concentration (%) were measured as volume of sedimented particles per volume water from vertical plankton net samples at depths from 10 meter to surface. Turbidity (FTU) is given as sum of measurements per meter at depths ranging from 1 to 10 meter (n=10).
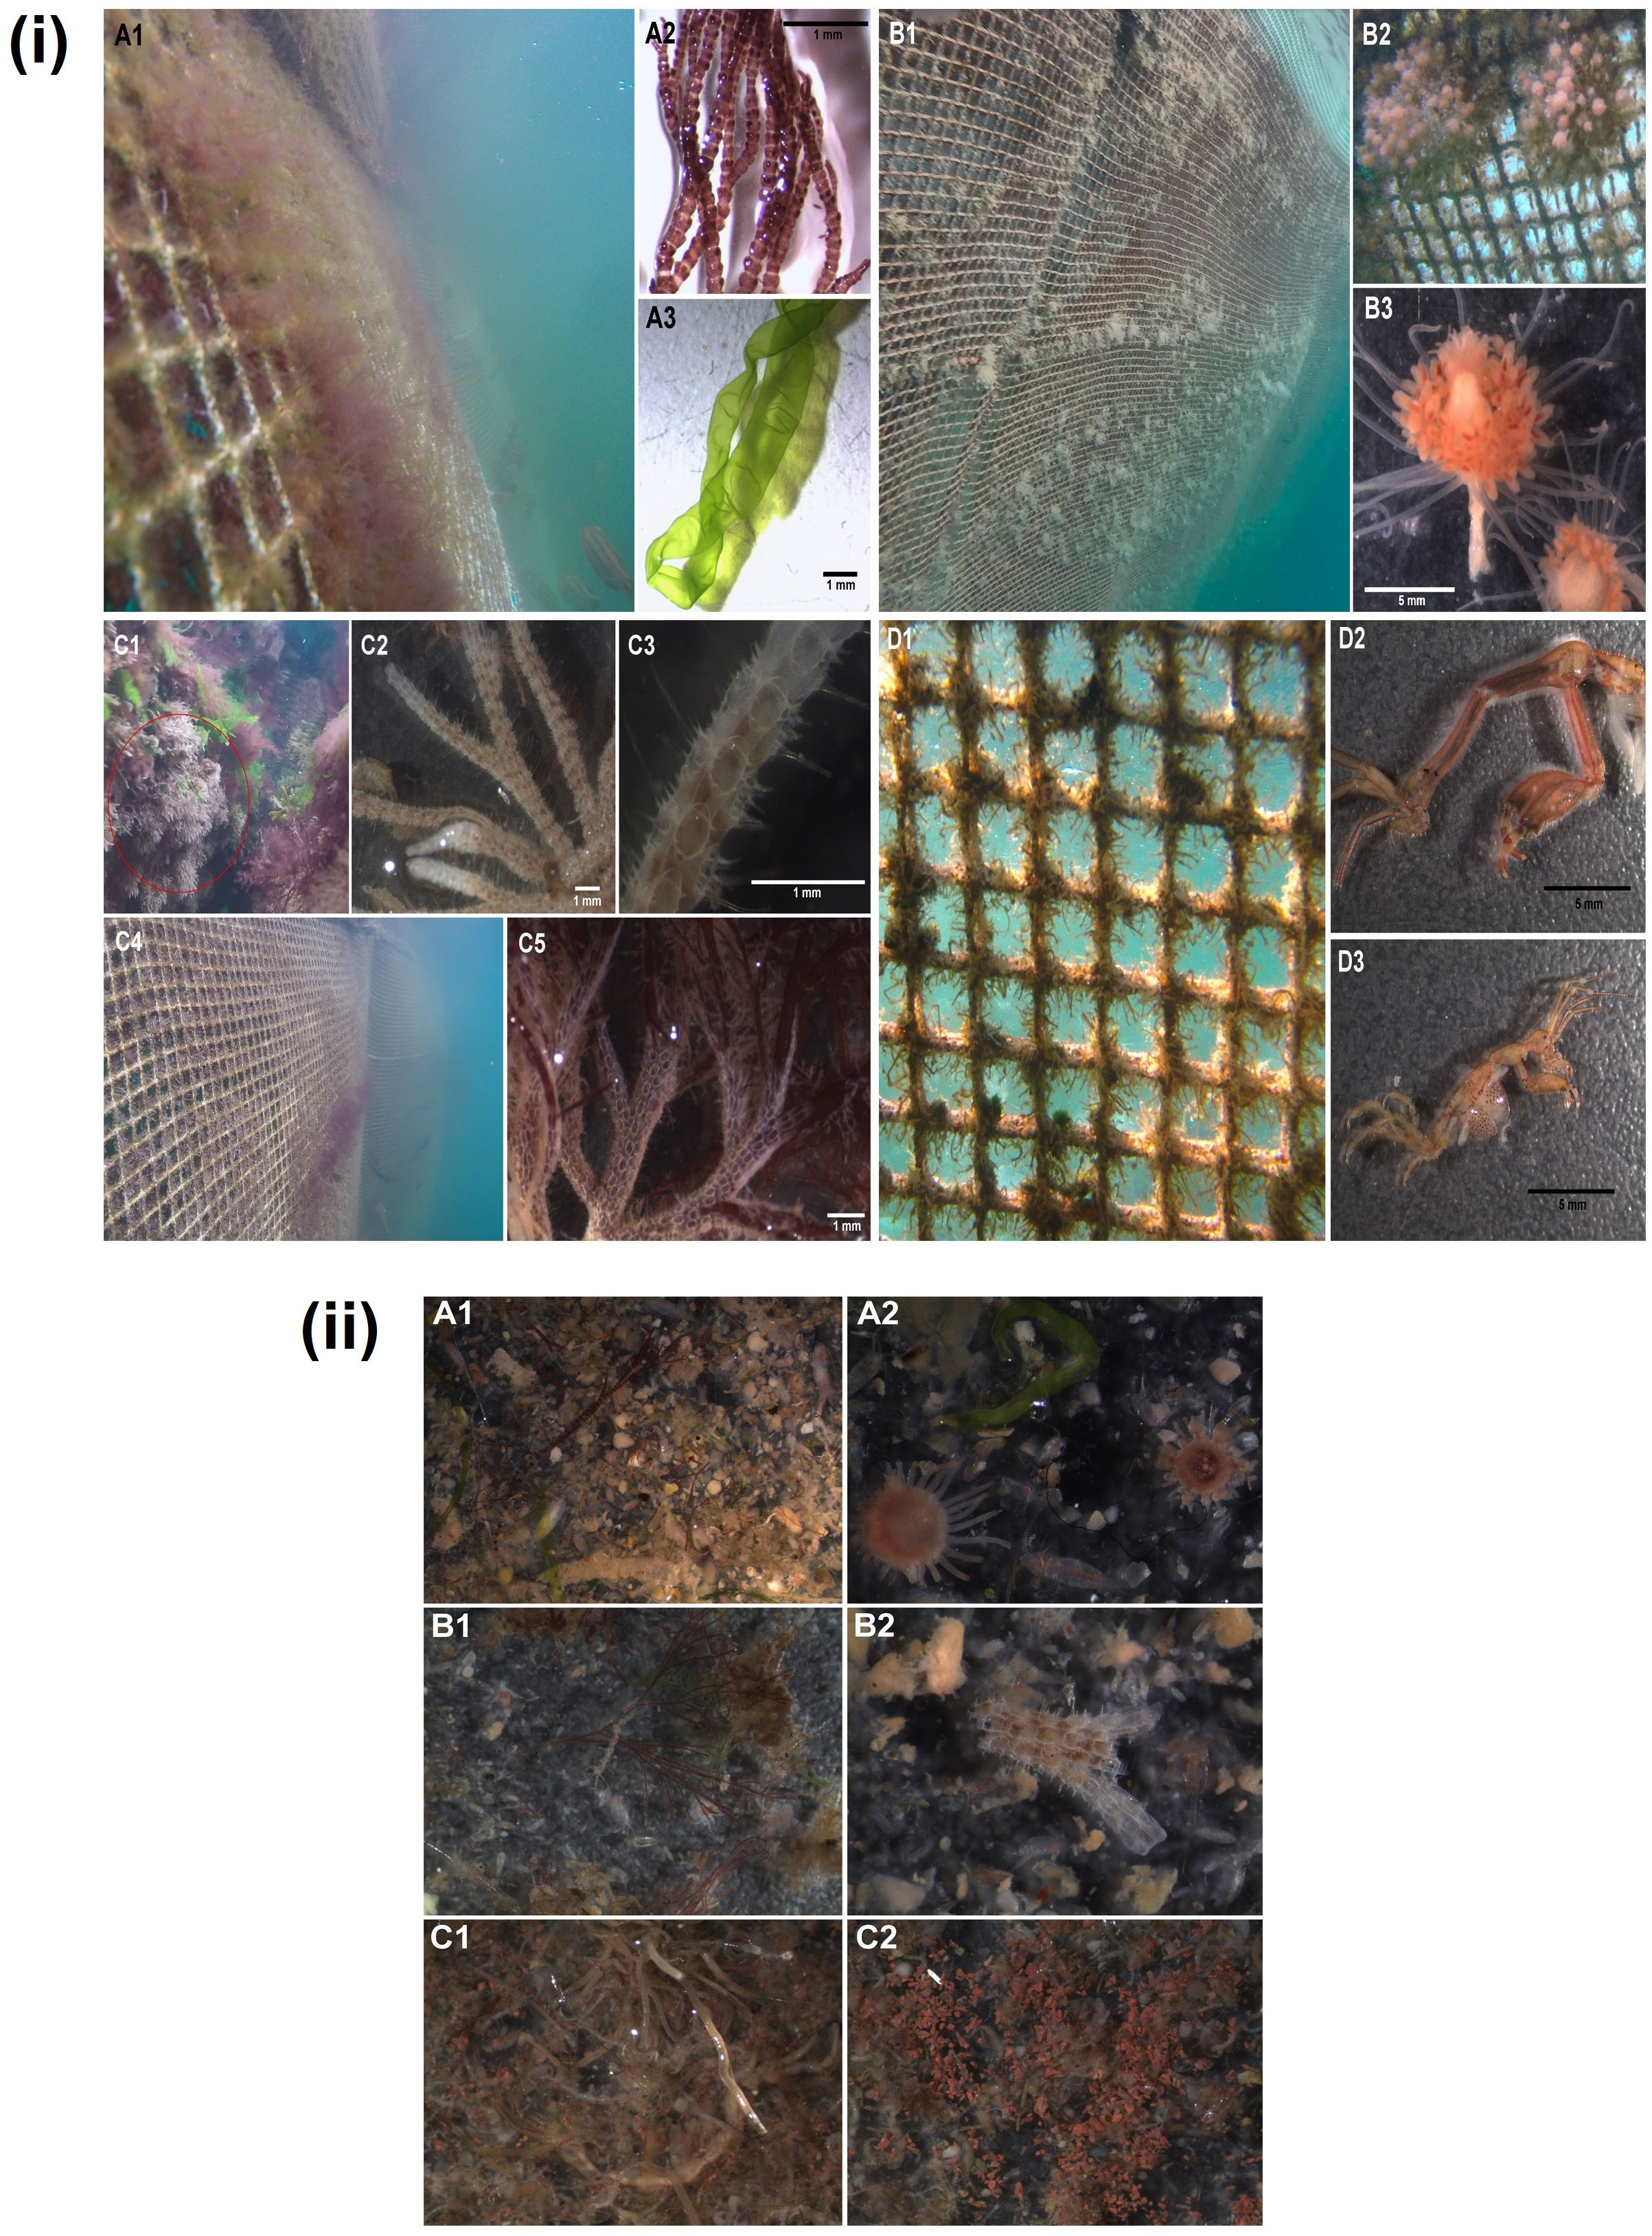
Figure 2 Fouling organisms observed on the upper meters of the net at all farms and flushed particles during in situ net cleaning. (i) Common fouling organisms included: macroalgae (A1-4), hydroids (B1-3), bryozoan (C1-5), and caprellidae (D1-3). (A1) Algae fouling dominated by red algae (A2; Ceramium spp.) and green algae (A3; Ulva spp.). (B1) Colonies with hydroids (Ectopleura larynx) covering the pen net. (B2) Two colonies with rose-red hydranths clearly visible. (B3) Hydranth with gonophores, oral- and aboral tentacles. Most dominant bryozoan species observed on collars and pen nets at examined fish farms identified as Electra pilosa. (C1) Large colonies appear in clusters on collars and their morphological features illustrated in C2 and C3. (C4) A more scatter fouling pattern of the same species appear on the net walls, often attached to algae as shown in C5. (D1) Skeleton shrimps using pen net as substrate. Common species observed on the fish farms identified as Caprella mutica; male (D2, anterior part) and female (D3). (ii) Flushed particles collected with plankton nets from different fish farms during net cleaning. (A1) Algae, hydroids (hydranth fragments) and organic matter (feces); (A2) Hydroid (hydranth with oral tentacles) and green algae; (B1) Algae, Caprellid amphipods and hydroids (hydranth); (B2) Bryozoan and organic matter; (C1) Hydroids (hydrocaulus), Caprellid amphipod and copper fragments (Cu); (C2) Copper fragments (Cu).
The dominant fouling organisms observed on the net wall of the cages at all fish farms were macroalgae, hydroids, bryozoans, and skeleton shrimps (Figure 2). Algae were the most abundant fouling at a surface level (approximately 0-5 meters depth) on pen walls at locations A and B. The most common algae were identified as Ceramium spp. (red algae) and Ulva spp. (green algae). Underwater observations identified hydroid colonies (Ectopleura larynx) as the most dominant fouling organisms > 25 meters from surface. Bryozoans (Electra pilosa) and skeleton shrimps (Caprella spp. most commonly Caprella mutica) were observed on the upper part of pen nets and blue mussels only occurred on floating collars or as a few, small-sized individuals on the nets.
Screening of the fouling organisms for pathogens revealed that Ca. Branchiomonas cysticola and Ca. Syngnamydia salmonis were detected in all fouling organisms with the highest abundance in hydroids. Tenacibaculum maritimum was detected in all fouling organisms except blue mussel, whereas other species of Tenacibaculum were detected in all organisms. Hydroides and blue mussel samples tested positive for Ichthyobodo spp., while algae tested positive for Paranucleospora therion. On the contrary, fouling organisms were negative for the viruses SAV and PMCV, and the gill amoeba Paramoeba perurans. Control samples from all fouling organisms were positive and showed similar results. Hence, there was no significant PCR inhibition in the fouling samples. Results from qPCR tests of fouling organisms are summarized in Table 2.

Table 2 Screening of fish pathogens in fouling organisms by qPCR.
The overall screening the flushed particles for salmonid common pathogens highlighted the presence of the bacteria Ca. Branchiomonas cysticola, Ca. Syngnamydia salmonis, Tenacibaculum spp. and T. maritimum, and the parasites P. theridion, Ichthyobodo spp. and P. perurans among the particles. However, no viruses were detected in the particle’s samples. All the control samples were positive, indicating that there was no significant PCR inhibition in the qPCR analyses. Pathogen loads in flushed particles sampled at different farms are shown in Table 3. Particles on Farm A exhibited high levels of the aforementioned bacteria and the parasites P. perurans and Ichthyobodo spp. during and post in situ cleaning, whereas low levels of P. theridion were only detected post cleaning. Farm B displayed high levels of T. maritimum and Tenacibaculum spp., but there was no increase in abundance of these bacteria during net cleaning. Ca. Branchiomonas cisticola abundance increased during net cleaning and the parasites P. theridion, Ichthyobodo spp. and P. perurans were only detected during and 40-60 minutes post cleaning. The gill amoeba P. perurans was the most abundant parasite detected but only at depth suggesting that organisms at lower depths with higher salinity (e.g., hydroids and bryozoans) might be a reservoir for P. perurans. In parallel, Farm C revealed high levels of Tenacibaculum spp. through the timescale. Ichthyobodo spp. showed a slight increase during net cleaning and post-net cleaning, whereas P. theridion and P. perurans were not detected although results from the gill samples showed a high prevalence of infection at this site.
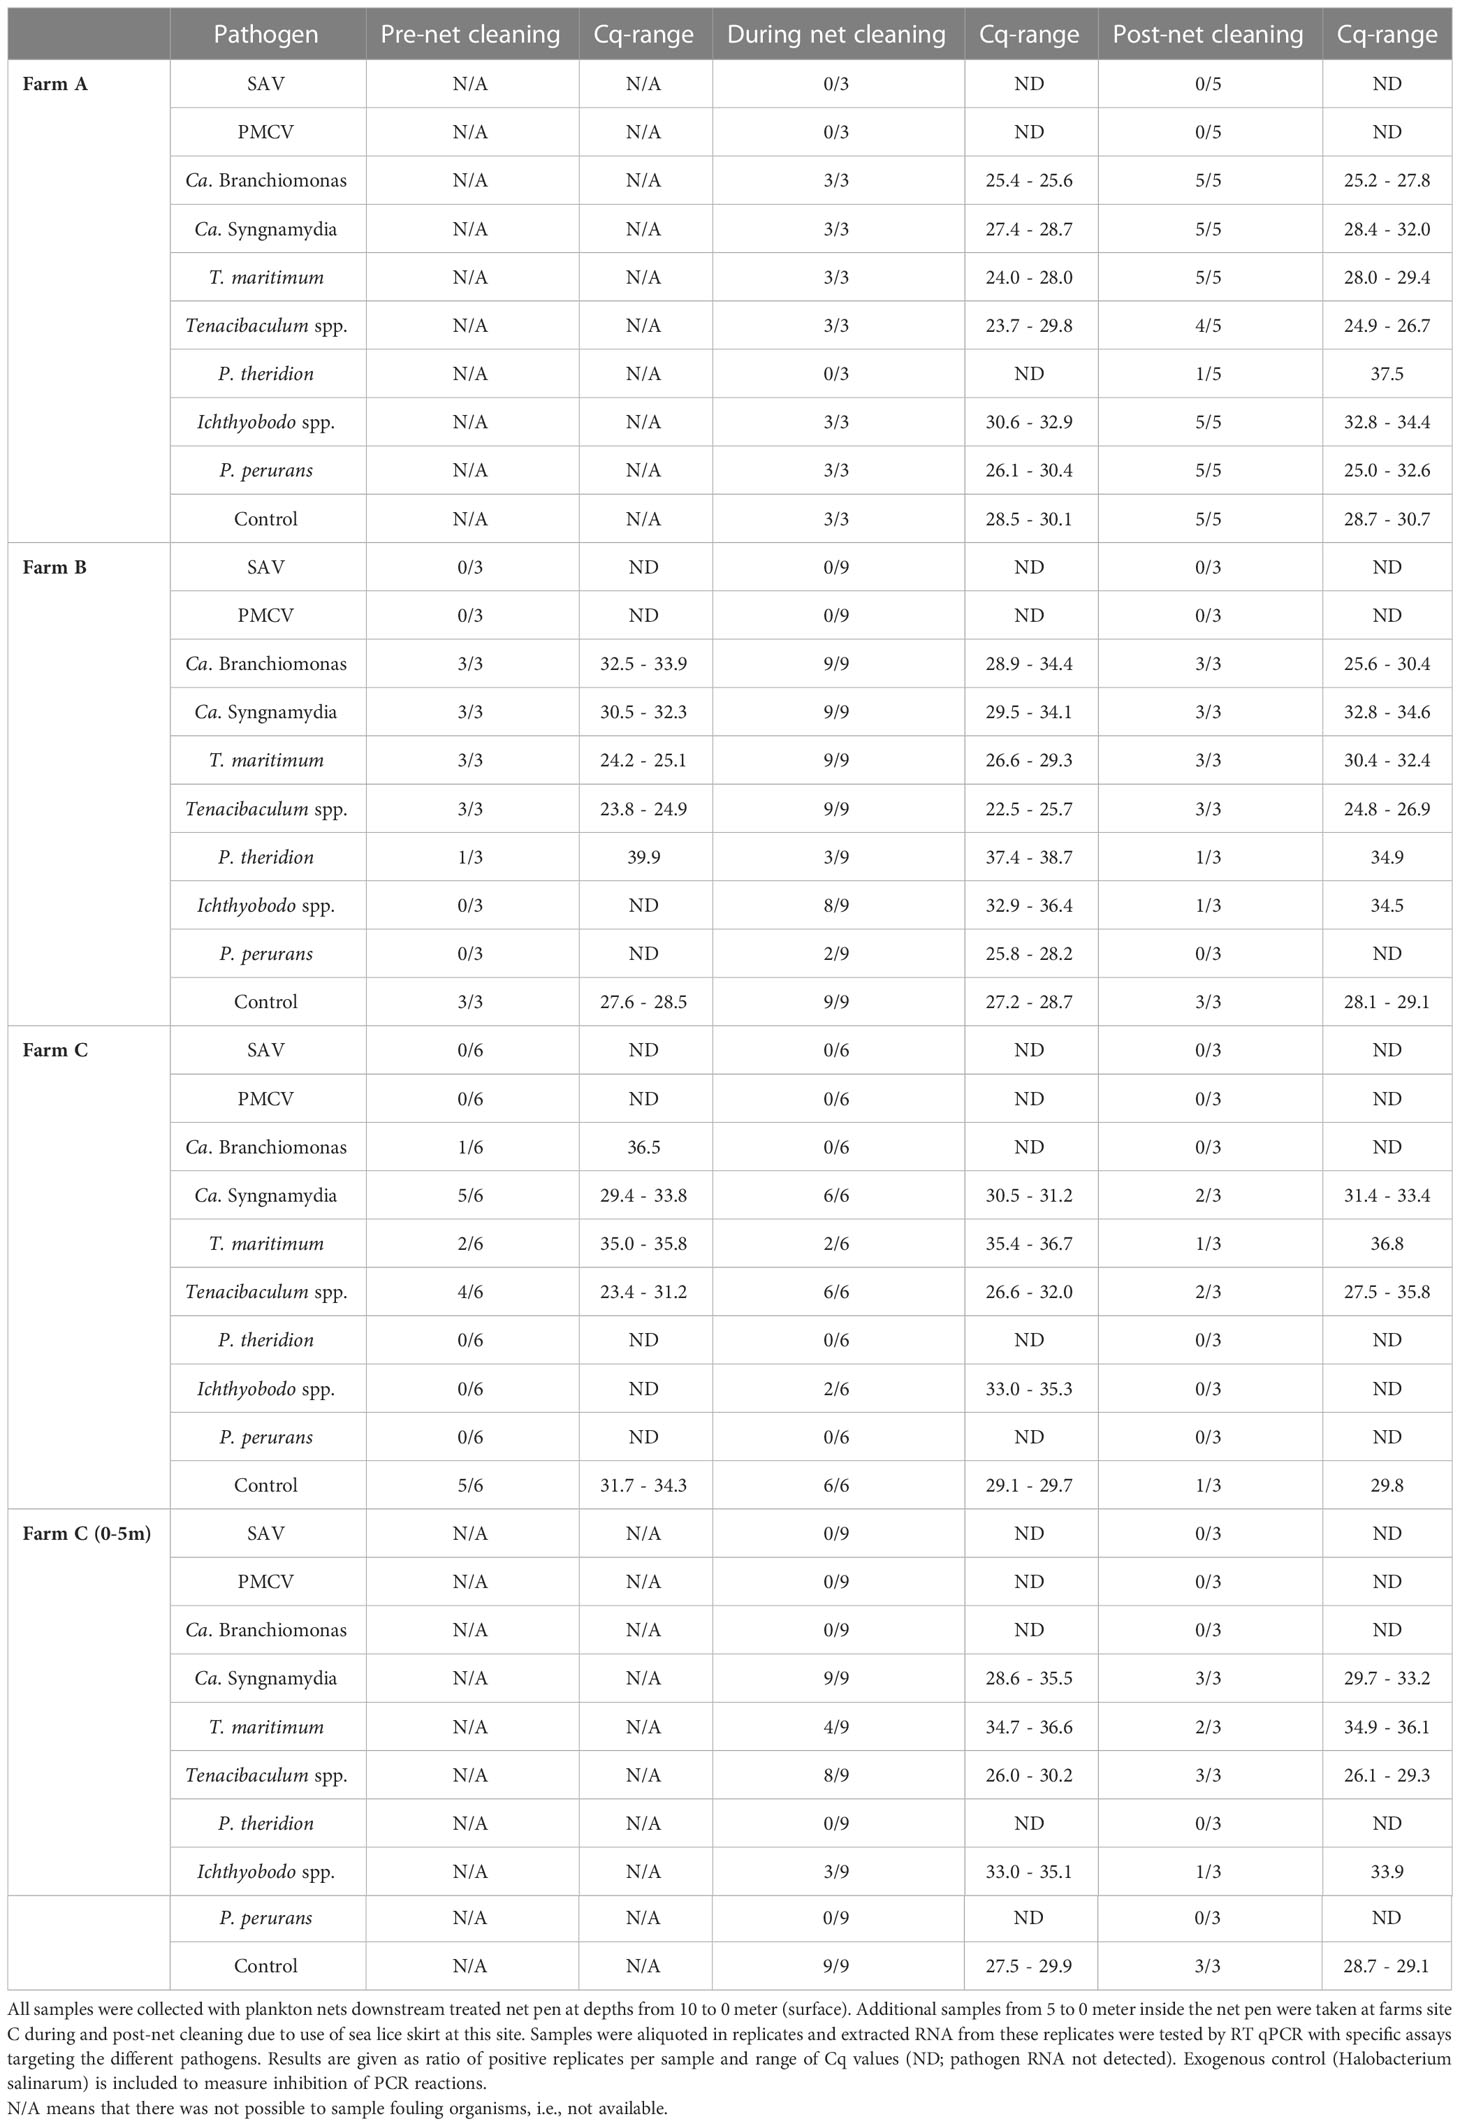
Table 3 Detection of fish pathogens in flushed particles by qPCR.
Registration of mortalities are routinely measured as daily count of dead fish in the net pens at the fish farm, and these data were used to examine for any acute or subacute effect of net cleaning at the different farms. There were significant differences in mortality rates between the fish farms when a period of 14 days (seven days before and seven days after net cleaning, n=15 including the treatment day) was compared (Kruskal-Wallis; p<0.001). Mean mortality rate at farm B was 4.8 fish per day, which was significantly (p<0.001) lower compared to the mortality rates at both Farm A (mean 170.4 per day) and Farm C (mean 48.0 per day). Mortality rate at Farm A significantly increased and reached a peak of 1363 dead fish within a day after net cleaning. A similar tendency was noted at Farm C.
Only minor changes in the prevalence and density of viruses, bacteria and parasites were observed at the three locations before and after net cleaning (Table 4). A significant drop in the prevalence (FET; p< 0,0008) and density (t-test; p= 0,0015) of Cand. S. Syngnamydia was observed at location A. This coincided with a similar drop in prevalence (FET; p= 0,0019) and density (t-test; p<0,0005) of P. perurans. The prevalence of T. finnmarkense increased from 0 to 43.0% (FET; p<0.0001) and the density of Cand. B. cysticola increased significantly (t-test; p= 0,0025) after net cleaning at location B. At location C, a significant increase in the prevalence (FET; p<0.05)and density (Mann-Whitney U; p= 0,0381) of Cand. B. cysticola were observed after net cleaning. Prevalence of major gill pathogens is summarized in Table 4.
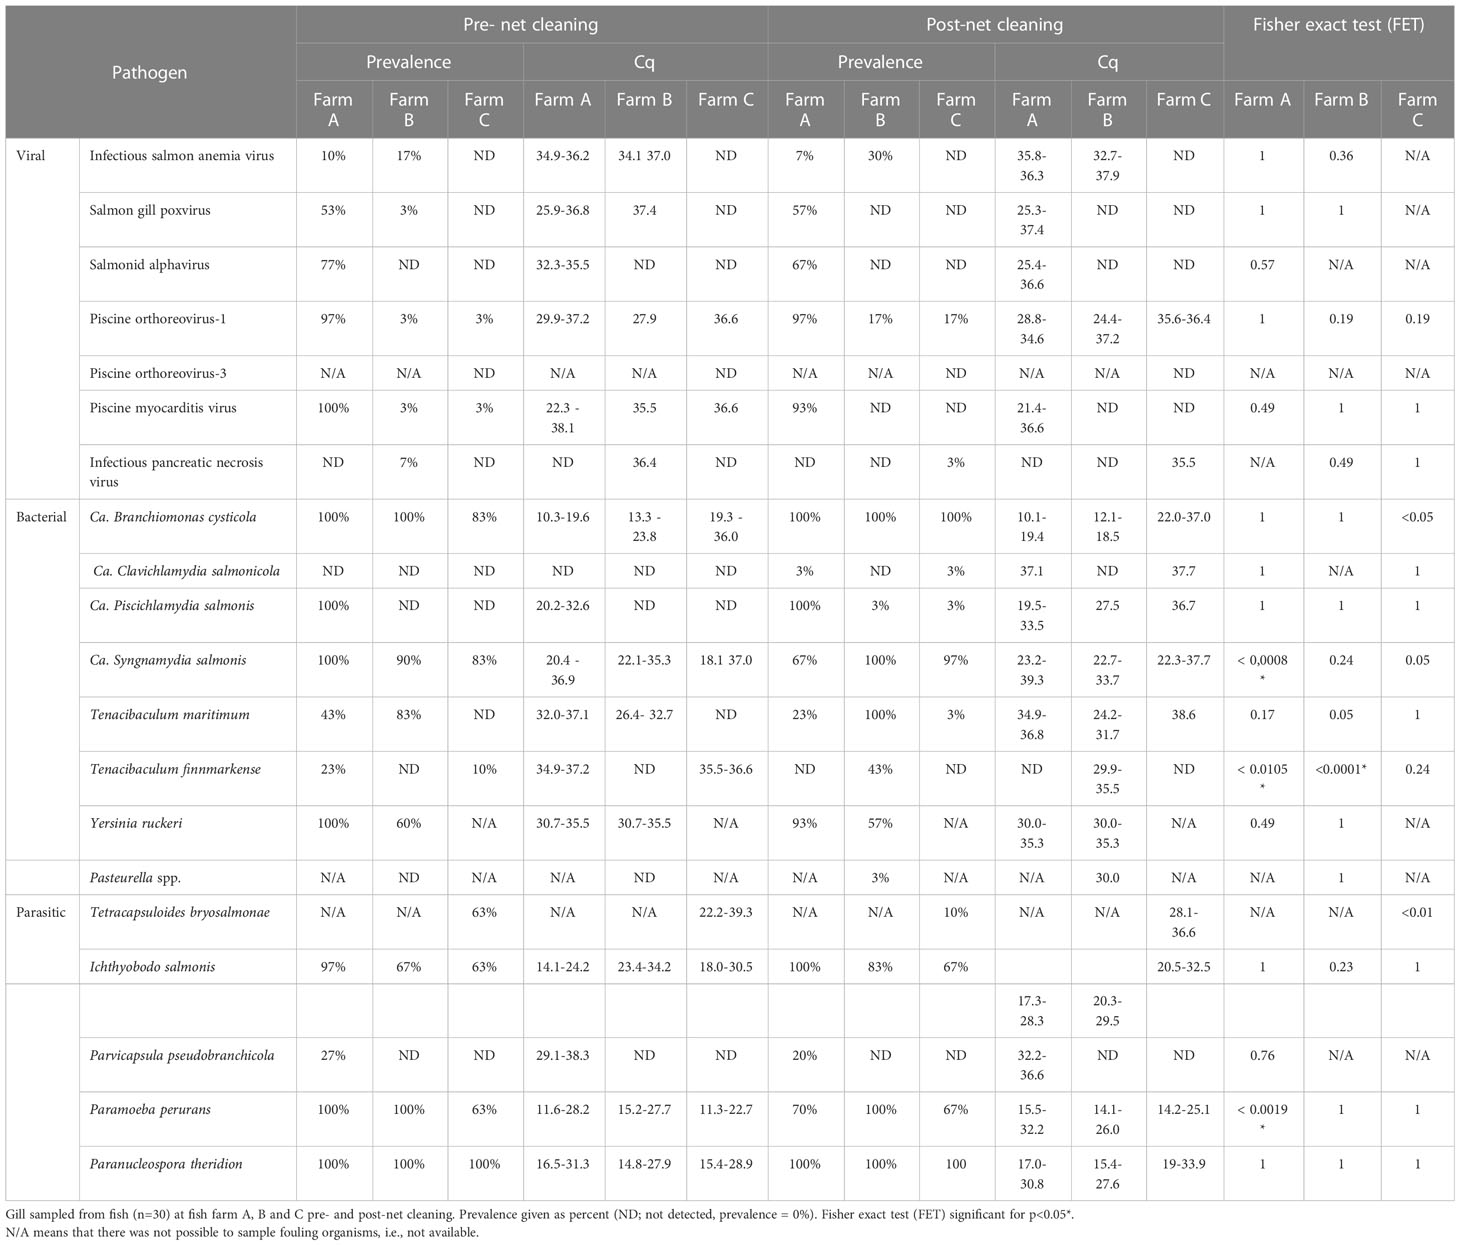
Table 4 Prevalence of major pathogens identified in gill samples before and after net cleaning.
The fish included in this study showed few external and internal signs of disease except for a few fish at site A with minor skin bleedings and signs of Amoebic gill disease (AGD). The gills from the salmon at this site showed signs of hyperplasia and aneurysm both before and after net cleaning (Figure 3). The salmon at site B also had gill pathology with hyperplasia and aneurysm, in addition to presence of epithelial cysts. A few of the rainbow trout at site C had lifting of the epithelial layer on the gills. No significant changes in the gill pathology were observed after net cleaning on the three farms. To evaluate the impact of net cleaning on key markers of the Atlantic salmon gill immune response, we performed absolute qPCR gene expression analysis for a cellular marker of immune cells, most notably antigen presenting cells (MHC II), proinflammatory cytokines (IL-1β and TNF-α) and inhibitory cytokines (TGF-β and IL-10). The mRNA abundance of all the tested markers was significantly increased in the gill after net cleaning (t-test, p <0.05; Figure 3), suggesting a slight increase of immunological activity.
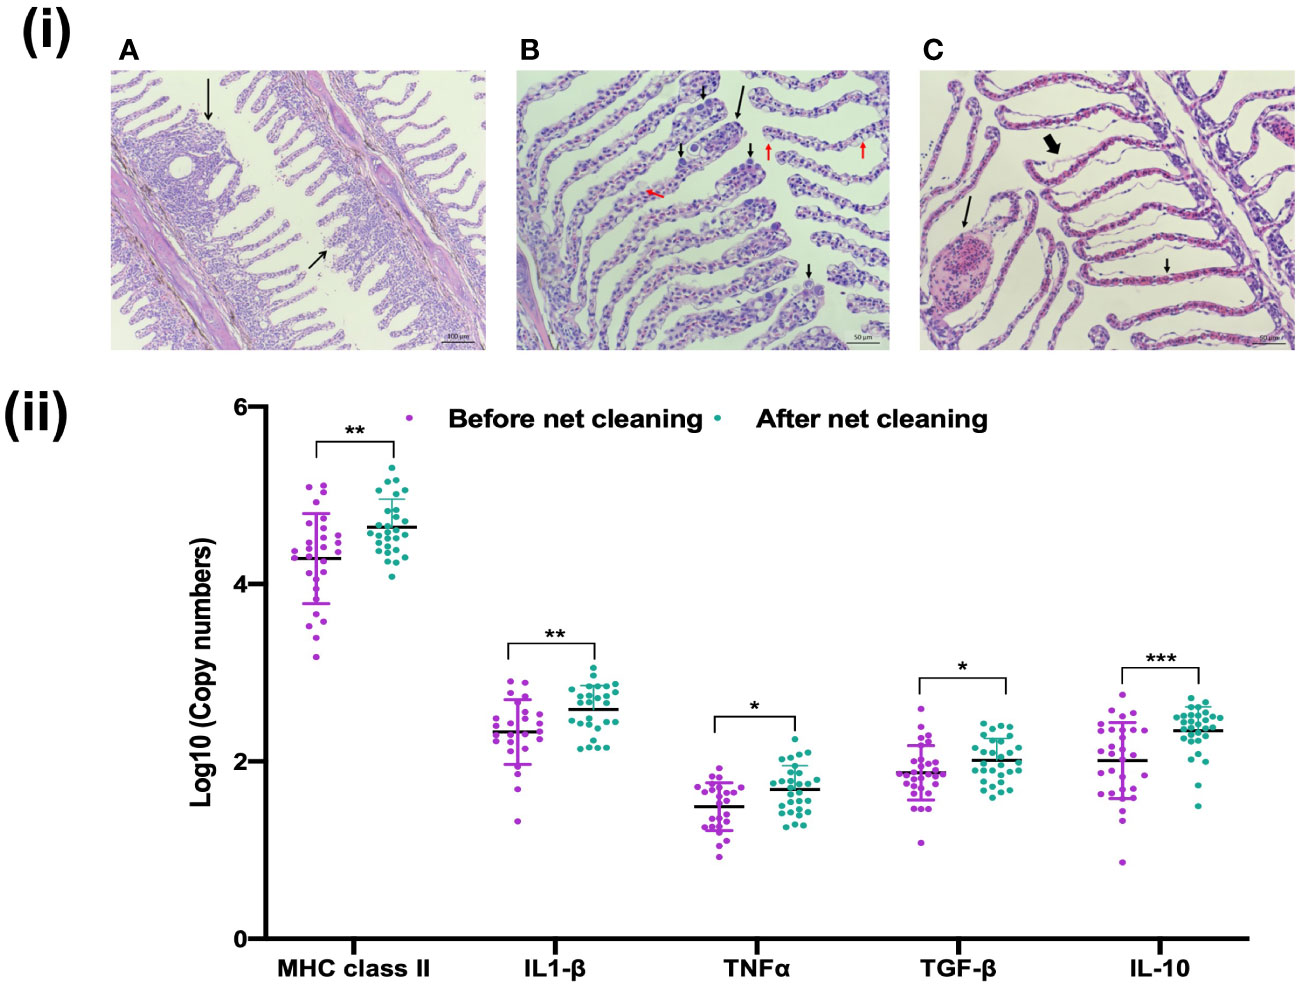
Figure 3 Histopathological and immunological status of the gills upon net cleaning. (i) Histopathological changes of the gills included (A) Epithelial cell hyperplasia with lamellar fusion (long, black arrow) and mucous cell hyperplasia (short, black arrow). (B) Clubbing (long, black arrow), mucus cells hyperplasia (red arrows) and epitheliocystis (short, black arrow). (C) Several gill lamellae with intralamellar bleeding (short, black arrow), aneurysm (long, black arrow), and lifting (thick, black arrow). (ii) Immune response of Atlantic salmon gills to net cleaning (Farm A). Data are mean ± SD of log 10 copy numbers of MHC II, IL-1β, TNFα, TGF-β and IL-10 at two points (n=30). Dots represent each individual sample and *p < 0.05, **p < 0.001 and ***p < 0.0001.
To investigate the impact of in-situ cleaning of net pens on the Atlantic salmon gill microbiome, we analyzed alpha and beta diversity and microbial taxa composition before and after the net cleaning on farm A. Chao1 and ACE diversity indices were significantly decreased after net cleaning (t-test, p <0.05; Figure 4), indicating that gill microbial richness was reduced. There were no significant differences in Shannon-Weaver and Inverse Simpson evenness indices (Wilcoxon and t-test p >0.05; Figure 4). Beta diversity analysis based on Bray-Curtis distance illustrated significant changes in the gill microbiome community structure before and after net cleaning (PERMANOVA, p <0.001, R2 = 0.15708; Figure 4). NMDS analysis showed that pre- and post-samples clustered together however were separated from each other. The differential heat tree matrix shown in Figure depicts the significant changes in bacterial phyla abundance (Wilcoxon, p <0.05), where taxa compared have a relative abundance of > 0.1%. The comparison of genera pre- and post-net cleaning highlighted 152 genera that were significantly changed (Wilcoxon, p <0.05; Supplementary Table S2). Of these, 41 were highly significant different in response to in-situ net cleaning (Wilcoxon, p <0.0001; Figure 4).
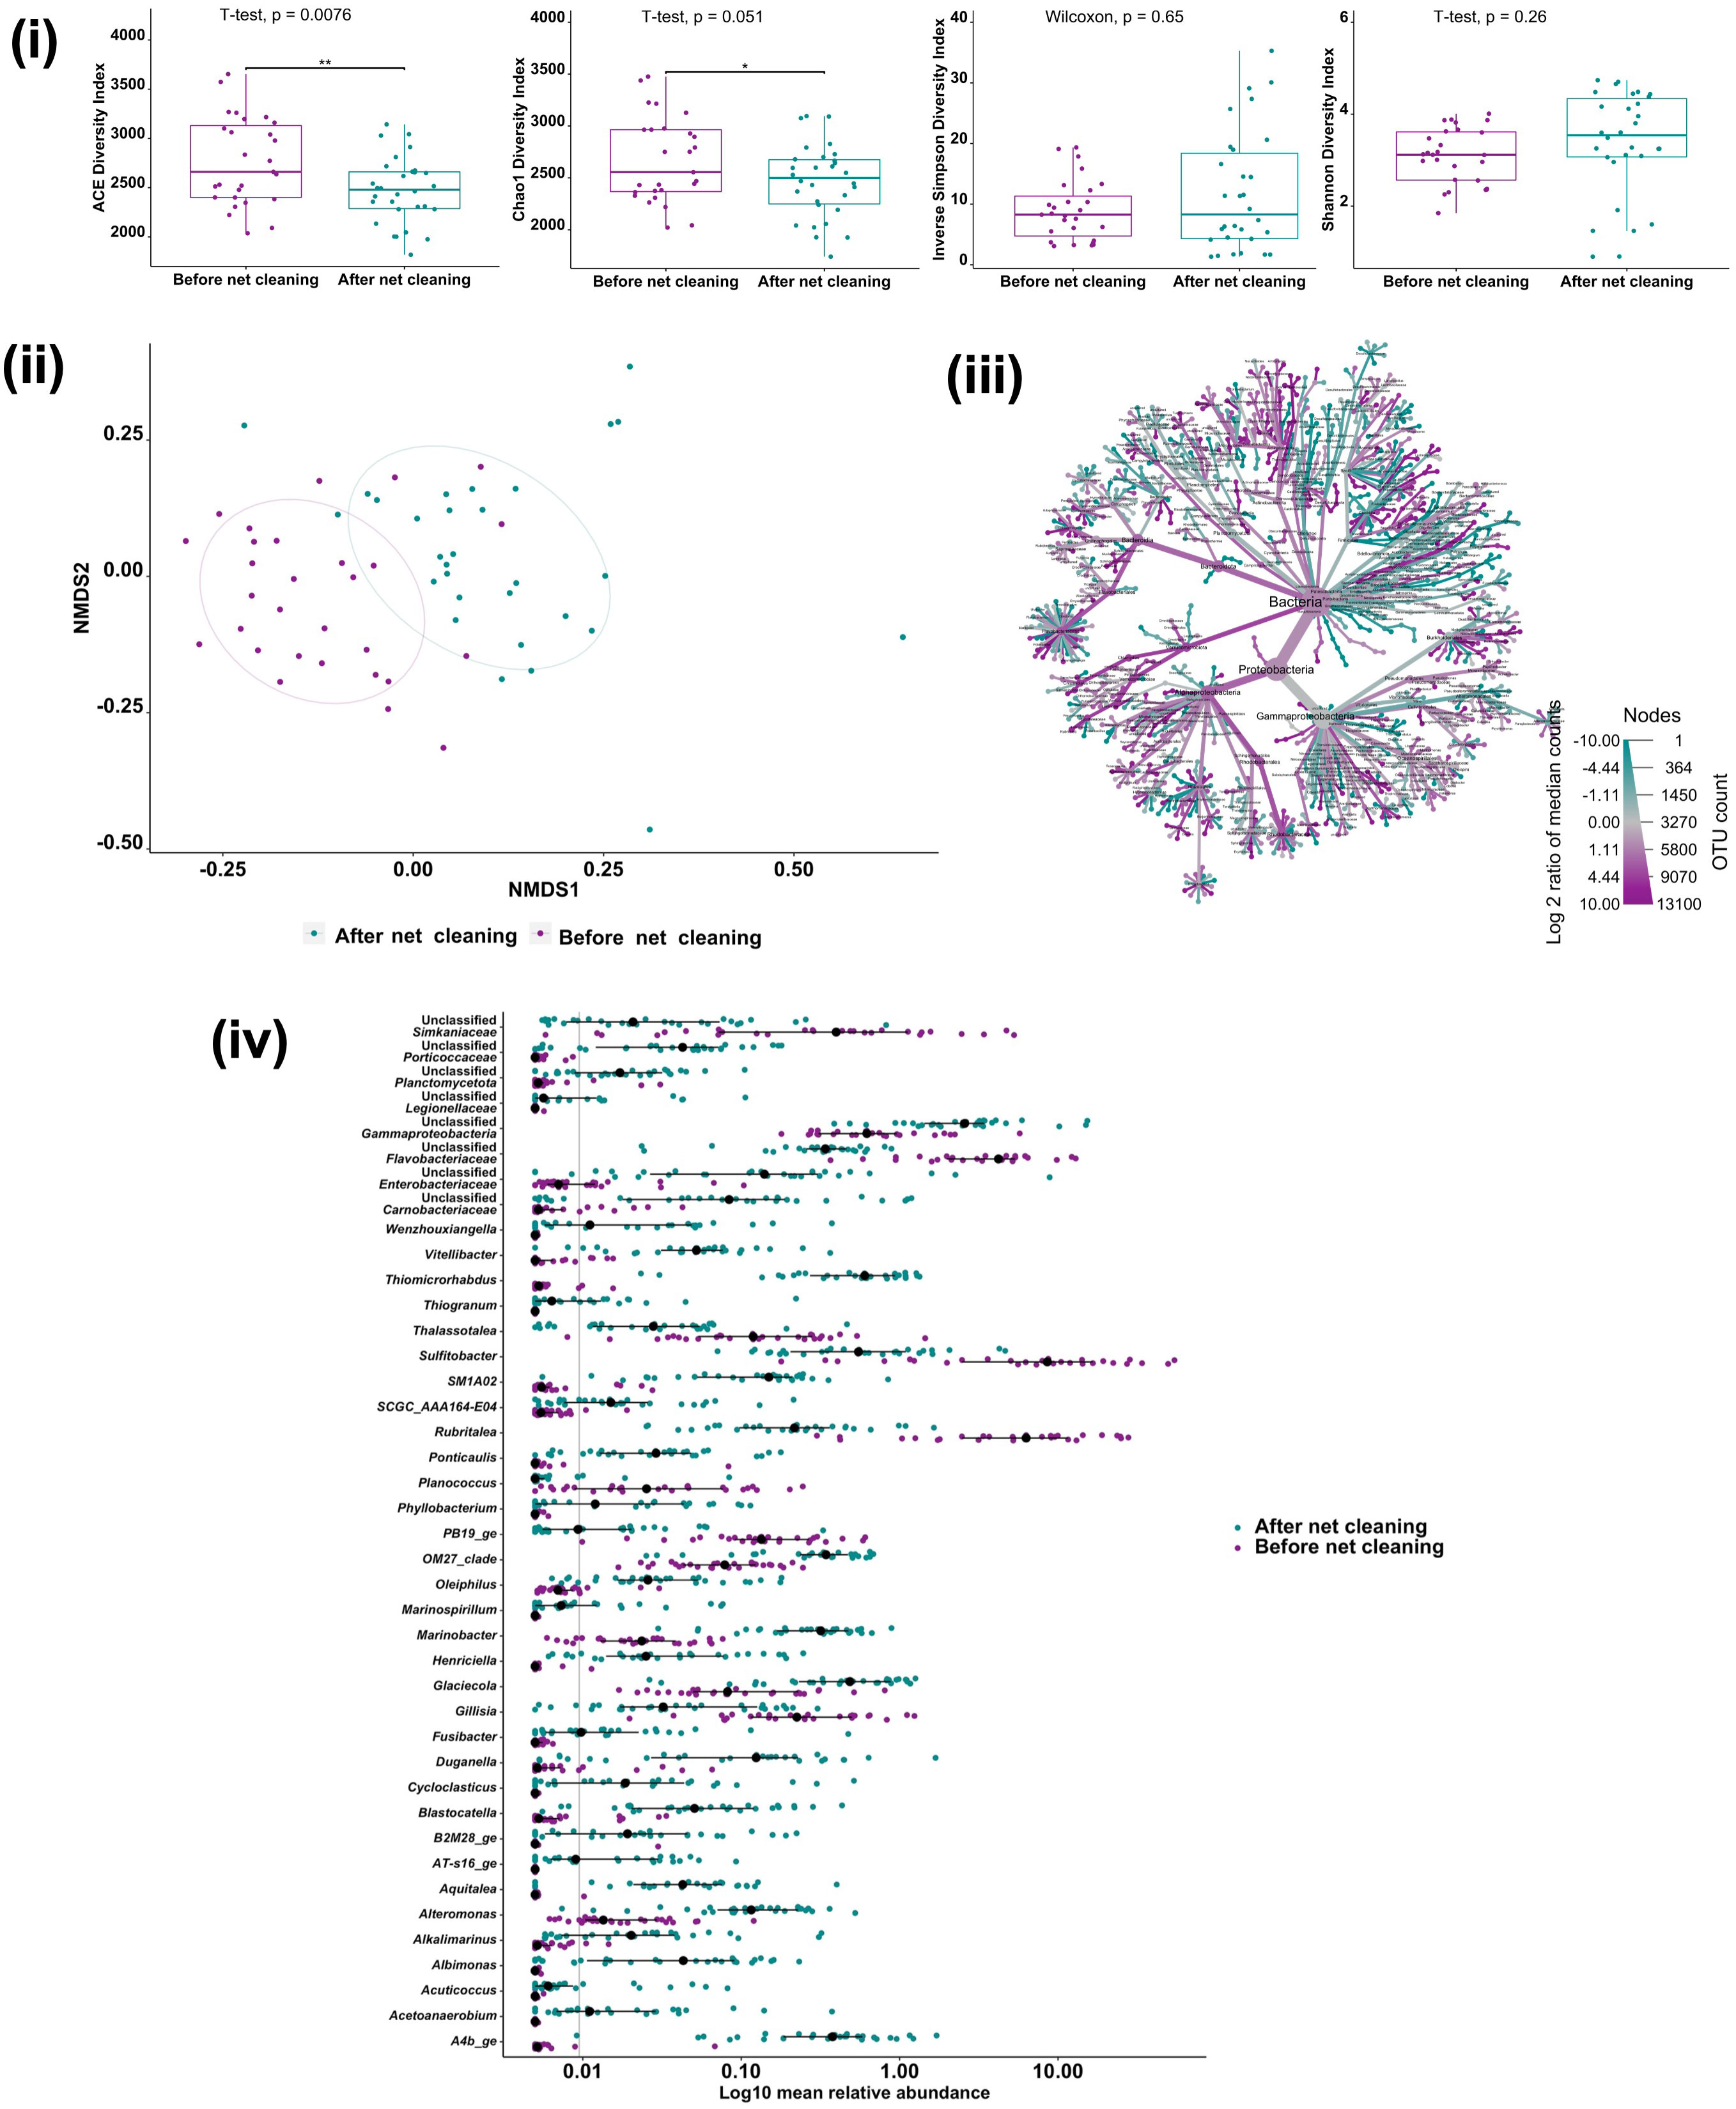
Figure 4 Impact of net cleaning on Atlantic salmon gill microbiome site A (n=30). (i) Alpha diversity metrics of salmon gill microbial communities before and after net cleaning. Dots represent each individual sample and *p < 0.05 and **p < 0.001. (ii) Non-metric multidimensional scaling (NMDS) plots based on Bray–Curtis similarity matrix of gill microbial communities before and after net cleaning (PERMANOVA, p = 0.001). The colors of the ellipses represent the two groups. (iii) Metacoder heat-tree showing the difference in gill microbiome phylotypes before and after net cleaning. Nodes in the heat-tree correspond to phylotypes, as indicated by node labels, while edges link phylotypes in accordance with the taxonomic hierarchy. Node sizes correspond to the number of observed OTUs. Colors represent the log fold difference of a given phylotype’s median relative abundance pre-cleaning compared to post-cleaning. Only significant differences, Wilcox rank-sum test followed by a Benjamini-Hochberg (FDR) correction are colored. Taxa colored dark cyan represent enrichment after net cleaning and dark magenta before net cleaning. (iv) Highly significant different genera in Atlantic salmon gill microbiome (n=30) upon net cleaning. Only significantly different genera between before and after net cleaning at p < 0.0001 are presented, Wilcox rank-sum test followed by a Benjamini-Hochberg (FDR) correction. Colored dots represent log10 mean relative abundance for each individual sample and black circles indicate the median and the black lines indicate the 50% confidence intervals.
The present study revealed a diversity of fouling species including hydroids, algae, skeleton shrimps, and filter feeders (bryozoan, blue mussel), representing the common fouling organisms on marine fish farms in Norway (Braithwaite and McEvoy, 2005; Olafsen, 2006; De Nys and Guenther, 2009; Guenther et al., 2010; Blöcher, 2013). The diversity and abundance of fouling organisms on nets are influenced by several factors such as water depth, salinity, temperature that vary with seasonal and geographical conditions (Fitridge et al., 2012) and fish farm wastes where macroalgae, filter feeders and small crustaceans (including Caprellids) get their nourishment from nutritional salts, feces, feed waste and other organic matter as part of their diet (Ruokolahti, 1988; Cook et al., 2007; Dürr and Watson, 2009; Blöcher, 2013). Macroalgae was only abundant at Farm A and Farm B, and the algal fouling was restricted to upper part of the cage nets. Algal fouling is a common habitat for filter feeders such as blue mussels and bryozoans. However, in this study low abundance of blue mussels was observed on Farm A and Farm B, and no mussels were detected on Farm C. This could be attributed to the high frequency of net cleaning on Farm A and B, and the recent treatment with copper-based antifouling on Farm C that has proven to be effective against macroalgae and mussels (Edwards et al., 2015). The most abundant bryozoan was identified as Electra Pilosa, a common and widespread bryozoan epiphyte in Norwegian waters (Njåstad, 2018). Different species of caprellids were identified at all farm sites, with Caprella mutica identified as the most dominant species. The hydroid Ectopleura larynx was the most dominant species with colonies observed at depths ranging from the surface to >25 meters and has been described as the most common and dominant fouling species on marine fish farm nets in Southern Norway that may constitute 90% of the fouling biomass on the net (Guenther et al., 2010; Kassah, 2012). Caprellids and hydroids (E. larynx) are among the most common fouling species on net cages at marine salmonid farms in Norway and they are tolerant to copper-based antifouling (Guenther et al., 2010). It has been described that remaining hydroid fragments on the flushed net can re-grow and re-establish new colonies (Carl et al., 2011) often at a higher density as high-pressure washers contribute to the release and spread of actinulae (embryos of the hydroid).
Importantly, we found little evidence that biofouling organisms act as permanent reservoirs for fish pathogens. We did not detect viruses in any of the fouling samples although gill samples from fish at farm site A showed high prevalence of SAV, PRV-1 and PMCV. Our results agree with the findings of Hellebø et al. (2014), suggesting that fouling organisms are not reservoirs for viruses such as SAV or PMCV. Hellebø et al. (2017) reported Paramoeba perurans in different fouling organisms collected by hand from net pen, floating collars, and ropes at Atlantic salmon farms during an AGD outbreak although re-sampling at the same site six months later yielded negative results. In this study, following a similar sampling protocol, none of the fouling organisms collected from the surface level tested positive for P. perurans, although gill samples from the fish showed 100% prevalence. Supporting previous suggestions, our study supports the notion that fouling organisms are not reservoirs of P. perurans.
The flagellate belonging to the genus Ichthyobodo was most abundant in biofouling detected in hydroids and blue mussels and in bryozoans at Farm B. The assay used for detection (“Costia”; see Isaksen et al. (2011)) does not distinguish between different Ichthyobodo species and therefore we cannot conclude that the biofouling organisms are a reservoir for Ichthyobodo species (Ichthyobodo salmonis; see Isaksen et al. (2011)). Most of the fish, prevalence 60-100%, at both farm sites were infected with Ichthyobodo salmonis. The bacteria Ca. Branchiomonas cysticola and Ca. Syngnamydia salmonis appear to be ubiquitous, and infections with Ca. Branchiomonas cysticola are associated with complex gill diseases (Mitchell et al., 2013; Nylund et al., 2015; Steinum et al., 2015; Herrero et al., 2018). Experimental trials have shown that Ca. Branchiomonas cysticola infections can transmit horizontally from fish to fish (Wiik-Nielsen et al., 2017), while other studies suggest that these bacteria need a vector for effective transmission and spread of disease (Steinum et al., 2015). We detected Ca. Branchiomonas cysticola and Ca. Syngnamydia salmonis in all groups of fouling organisms and all gill samples from Farms A and B. It cannot be excluded that the biofouling samples from these sites were contaminated with bacteria from the environment (water). In contrast, all gill samples of fish tested positive for the parasite Paranucleospora theridion, and negative in most biofouling and environmental samples, therefore shedding-specific contamination and accumulation in biofouling organisms can be excluded. Bacteria within genus Tenacibaculum was also abundant and Tenacibaculum maritimum was detected in fouling samples from both farm sites (A and B), but only in algae, hydroids and caprellids. Furthermore, Tenacibaculum spp. (species other than T. maritimum) were detected in different fouling organisms at Farm B, but only in samples of blue mussels from Farm A. None of the gill samples of fish from Farm B, and few fish from Farm A (23%) tested positive for Tenacibaculum spp.
Overall, fish pathogens detected in flushed particles during net cleaning correspond to the findings in biofouling organisms. A higher diversity of fish pathogens was detected in flushed particles and those with highest abundance were Tenacibaculum spp. at all farm sites and Ca. Branchiomonas cysticola at Farm A and Farm B. Interestingly, Paramoeba perurans was only detected in flushed particles, indicating a higher density of this parasite at deeper parts of the net pens. As low salinity is a stressor for P. perurans and a salinity > 20-25%, is required for growth and survival (Collins et al., 2019) the measured salinity, for both Farm A and Farm B, at surface level (0-2 meters water depth) was < 25 ‰ representing a limitation. The most optimal environment for P. perurans therefore would be at the pycnocline or deeper according to Collins et al. (2019), hence the detection in flushed particles only. No pycnocline was detected at depth range 0 – 30 meters at Farm C with an optimal salinity for P. perurans at all depths (measured salinity around 32%). Gill samples of fish from this site revealed 60-70% prevalence of P. perurans infection although P. perurans was not detected during net cleaning.
The oxygen profile changed during the net cleaning, probably due to increased swimming activity and crowding of fish in the treated net cage. The oxygen level was normalized within one hour after the net cleaning at farms A and farm C, while a reduced oxygen level was still registered at farm B within the same recovery period however the net cleaning procedure on farm B took twice as long. Our observations indicate a stress response in the fish population that agrees with Stene et al. (2018) who reported increased plasma cortisol during net cleaning and elevated concentrations of faecal corticoid metabolites a day after net cleaning. The stress response is likely triggered by noise or avoidance of the net cleaner vehicle, decreased dissolved oxygen and increased turbidity through particle density. Identified particles in the water include fragments of bryozoan (with thorn-like structures) and hydrozoans which may cause gill or skin irritation to fish upon contact (Hodson et al., 1997; Baxter et al., 2011). Experimental trials have shown that nematocysts of the hydroid Ectopleura larynx remained active following high-pressure cleaning, and that such nematocysts caused gill lesions among exposed fish (Baxter et al., 2012; Bloecher et al., 2018). Across the three monitored sites net cleaning did not result in any significant changes in the gills of salmon and rainbow trout with few external signs of damage. The gill pathologies observed were mainly associated with the presence of P. perurans that has been a consistent problem in this area since 2012 (Nylund et al., 2008; Steinum et al., 2008; Dahle et al., 2020a).
Fish mortalities at all three sites before net cleaning were low but increased post net-cleaning. The higher mortality in farm A could be related to presence of Piscine myocarditis virus (PMCV) causing cardiac myopathy syndrome and mortality related to increased stress during net cleaning (Haugland et al., 2011; Garseth et al., 2018). Pathogens present in the three farms are common findings for salmonids in western Norway (Steinum et al., 2010; Nylund et al., 2011) and there was little or no change in pathogen density suggesting that the stress associated with net cleaning and the increased density of flushed particles had no effect upon pathogenesis. On the other hand, all measured mRNA transcripts relevant to antigen presentation and inflammatory processes, MHC II, IL-1β, TNF-α, TGF-β and IL-10, were significantly upregulated. Comas Morte (2018) reported a similar upregulation of inflammation-related mRNAs in the gill tissue of Gilthead Sea Bream (Sparus aurata) after net cleaning, suggesting a possible immune stimulation. The observed response, of a low magnitude, may be due to the increased recruitment of immune cells into the gill tissue or increased numbers of circulating leukocytes due to the general stress response.
In situ net cleaning significantly impacted the Atlantic salmon gill microbiome with decreased gill microbial community richness and significant changes in the gill microbial community composition. The observed change in salmon gill bacterial genera were pronounced indicating a major impact on this community with the abundance of both beneficial, opportunistic, and potential pathogenic bacteria significantly altered after net cleaning. Sulfitobacter, a beneficial marine bacterium that produces antibacterial compounds inhibit high-virulence serotypes of Vibrio anguillarum (Emilia Noor and Eguchi, 2012) and have an essential role in sulfite oxidation in aquaculture systems (Duarte et al., 2019; Palladino et al., 2021) was significantly decreased. Rubritalea, consistently reported in healthy Atlantic salmon gill microbiomes (Slinger et al., 2021) was also significantly decreased. Rubritalea was identified as a biomarker for a healthy European Seabass skin microbiome (Cámara-Ruiz et al., 2021). Members of this genus produce squalene which has antioxidant properties and act as a precursor for the synthesis of metabolites such as hormones, sterols, and vitamins (Yoon et al., 2007; Yoon et al., 2008; Cámara-Ruiz et al., 2021). In addition, Rubritalea produce carotenoids that have antioxidant properties and act as a precursors of vitamin A (Cámara-Ruiz et al., 2021). On the contrary, the abundance of the genera Duganella, Glaciecola and Oleiphilus were significantly increased. Duganella has been suggested as a stress biomarker, where its abundance increased in the Tambaqui (Colossoma macropomum) gut microbiome after acute short-term acid stress (Sylvain et al., 2016). A higher abundance of the genera Glaciecola and Oleiphilus in the skin microbiome of the yellowtail kingfish (Seriola lalandi) was reported after antibiotic treatment (Legrand et al., 2020). Furthermore, Glaciecola was reported as a member of a set of unique OTUs in the gut microbiome of the largemouth bronze gudgeon (Coreius guichenoti) suffering from furunculosis (Li et al., 2016). In agreement with previous reports of dysbiosis in farmed fish gill, skin, and gut microbiome (Rosado et al., 2019; Bozzi et al., 2021), opportunistic bacteria such as Aliivibrio, Pseudomonas and Clostridium significantly increased after net cleaning in the gill.
The gill microbial dysbiosis observed after net cleaning could be attributed to physicochemical changes of the water quality, increased suspended particles and/or other biological changes related to net cleaning. Several studies have reported an association between environmental stressors, changes in water quality, heavy metals and bacterial dysbiosis in aquatic species (recently reviewed by Infante-Villamil et al. (2021). Previously discussed significant changes in measured water quality parameters including dissolved oxygen and increased turbidity through flushed particles across all farms may be related to changes in the gill microbiome through direct, mechanical or chemical, or indirect, effects through host dysbiosis. We did not uncover any significant changes in pathogen load in any of the measured sources nor any gross morphological changes at the gill surface at any of the study sites. Despite a lack of gross morphological changes, previous studies have reported that changes in water quality, dissolved oxygen and the presence of particles from both sediment and displaced net biofouling can be attributed to microbial dysbiosis of the gill and increased susceptibility to infection (Hess et al., 2015). The release of fouling organisms such as the hydroid E. larynx and its nematocysts have also been reported to cause irritation and mechanical damage of the gills, increasing the likelihood of infection (Bloecher et al., 2018). Recent reports have suggested that copper net coatings may potentially be released during net cleaning, inducing injury to nerve and gill tissue (Bloecher and Floerl, 2020). Regardless of such reports, in this study we did not observe evidence of mechanical damage at the gross histological level across any of the 3 study sites.
In conclusion, in this study we have identified a direct impact of net cleaning on measured water quality indicators, as expected, a moderate change in gill inflammatory and antigen presentation activity at the level of mRNA and a large significant change in the gill microbiome community. Observed changes in the gill microbiome involve decreased bacterial richness and decreased diversity coupled to an increase in identified bacterial genera that are related to negative health consequences. Parallel analyses for pathogen load in biofouling and environment (water) samples did not highlight significant changes in addition to no change in salmon pathogen diversity and load. Current evidence, including this study, suggest that biofouling organisms may act as transient reservoirs for some fish pathogens but not viruses. Our data suggests that changes in gill microbiome could be related to the host stress response to the process of net cleaning and could be indicative of increased mortalities post-cleaning. As observed in one of our study sites salmon with underlying health complications i.e., CMS increased mortalities resulted post net-cleaning. The use of non-lethal gill microbiome assessments in parallel to standard pathogen monitoring throughout the marine cycle may have potential as a refined health management tool.
The datasets presented in this study can be found in online repositories. The names of the repository/repositories and accession number(s) can be found below: https://www.ncbi.nlm.nih.gov/, PRJNA930680.
The study protocol was approved by the Norwegian Animal Research Authority (NARA) in 2019 under the identification code 18259 and the University of Stirling Animal Welfare and Ethical Review Body (AWERB (19/20) 63).
Conceptualization: AE, BC, AA, AN, TI, EI, and SM. Methodology: AE, BC, AA, AN, TI, EI, LA, LM, and SM. Validation: AE, BC, AA, AN, TI, EI, LA, LM, and SM. Formal analysis: AE, BC, TI, EI and AN. Software: TI. Investigation: AE, BC, AA, AN, TI, EI, LA, LM, and SM. Writing -Original Draft: AE, TI, and EI. Writing- Review and Editing: SM, AN, BC, and AA. Supervision: AN, AA, TI, and SM. Funding acquisition: AN and SM. All authors contributed to the article and approved the submitted version.
This work was supported the Norwegian Seafood Research Fund (FHF) under grant 901514. In addition, AE was funded by a full Ph.D. scholarship (Newton-Mosharafa Fund) from the Ministry of Higher Education of the Arab Republic of Egypt and the British Council.
Author EI was employed by Akvavet Gulen AS during the project.
The remaining authors declare that the research was conducted in the absence of any commercial or financial relationships that could be construed as a potential conflict of interest.
All claims expressed in this article are solely those of the authors and do not necessarily represent those of their affiliated organizations, or those of the publisher, the editors and the reviewers. Any product that may be evaluated in this article, or claim that may be made by its manufacturer, is not guaranteed or endorsed by the publisher.
The Supplementary Material for this article can be found online at: https://www.frontiersin.org/articles/10.3389/faquc.2023.1125595/full#supplementary-material
Supplementary Figure S1 | A full schematic outlining the experimental design and methods used for the analysis. (A) Experimental design of the field trials showing the collected samples and a map illustrating the location of fish farm sites (A–C) in Western Norway (Norwegian Mapping Authority). (B) Schematic diagram illustrating the methods used for analysis of different samples.
Østevik L., Stormoen M., Nødtvedt A., Alarcón M., Lie K.-I., Skagøy A., et al. (2021). Assessment of acute effects of in situ net cleaning on gill health of farmed Atlantic salmon (Salmo salar l). Aquaculture 545, 737203. doi: 10.1016/j.aquaculture.2021.737203
Andersen L., Hodneland K., Nylund A. (2010). No influence of oxygen levels on pathogenesis and virus shedding in salmonid alphavirus (SAV)-challenged Atlantic salmon (Salmo salar l.). Virol. J. 7, 198. doi: 10.1186/1743-422X-7-198
Bannister J., Sievers M., Bush F., Bloecher N. (2019). Biofouling in marine aquaculture: a review of recent research and developments. Biofouling 35, 631–648. doi: 10.1080/08927014.2019.1640214
Baxter E. J., Rodger H. D., Mcallen R., Doyle T. K. (2011). Gill disorders in marine-farmed salmon: investigating the role of hydrozoan jellyfish. Aquac. Environ. Interact. 1, 245–257. doi: 10.3354/aei00024
Baxter E. J., Sturt M. M., Ruane N. M., Doyle T. K., Mcallen R., Rodger H. D. (2012). Biofouling of the hydroid ectopleura larynx on aquaculture nets in Ireland: implications for finfish health. Fish Vet. J. 13, 18–30. doi: 2018-01-12T05:40:02Z
Benjamini Y., Hochberg Y. (1995). Controlling the false discovery rate: A practical and powerful approach to multiple testing. J. R. Stat. Society. Ser. B (Methodological) 57, 289–300. doi: 10.1111/j.2517-6161.1995.tb02031.x
Blöcher N. (2013). Biofouling in the Norwegian Salmon Farming Industry (Norway: Department of Biology, Norwegian University of Science and Technology).
Bloecher N., Floerl O. (2020). Efficacy testing of novel antifouling coatings for pen nets in aquaculture: How good are alternatives to traditional copper coatings? Aquaculture 519, 734936. doi: 10.1016/j.aquaculture.2020.734936
Bloecher N., Floerl O. (2021). Towards cost-effective biofouling management in salmon aquaculture: a strategic outlook. Rev. Aquac. 13, 783–795. doi: 10.1111/raq.12498
Bloecher N., Floerl O., Sunde L. M. (2015). Amplified recruitment pressure of biofouling organisms in commercial salmon farms: potential causes and implications for farm management. Biofouling 31, 163–172. doi: 10.1080/08927014.2015.1012713
Bloecher N., Olsen Y., Guenther J. (2013). Variability of biofouling communities on fish cage nets: A 1-year field study at a Norwegian salmon farm. Aquaculture 416-417, 302–309. doi: 10.1016/j.aquaculture.2013.09.025
Bloecher N., Powell M., Hytterød S., Gjessing M., Wiik-Nielsen J., Mohammad S. N., et al. (2018). Effects of cnidarian biofouling on salmon gill health and development of amoebic gill disease. PloS One 13, e0199842. doi: 10.1371/journal.pone.0199842
Bozzi D., Rasmussen J. A., Carøe C., Sveier H., Nordøy K., Gilbert M. T. P., et al. (2021). Salmon gut microbiota correlates with disease infection status: potential for monitoring health in farmed animals. Anim. Microbiome 3, 30. doi: 10.1186/s42523-021-00096-2
Braithwaite R. A., McEvoy L. A. (2005). Marine biofouling on fish farms and its remediation. Adv. Mar. Biol. 47, 215–252. doi: 10.1016/S0065-2881(04)47003-5
Butt R. L., Volkoff H. (2019). Gut microbiota and energy homeostasis in fish. Front. Endocrinol. 10. doi: 10.3389/fendo.2019.00009
Cámara-Ruiz M., Cerezo I. M., Guardiola F. A., García-Beltrán J. M., Balebona M. C., Moriñigo M.Á., et al. (2021). Alteration of the immune response and the microbiota of the skin during a natural infection by vibrio harveyi in European seabass (Dicentrarchus labrax). Microorganisms 9. doi: 10.3390/microorganisms9050964
Carl C., Guenther J., Sunde L. M. (2011). Larval release and attachment modes of the hydroid ectopleura larynx on aquaculture nets in Norway. Aquac. Res. 42, 1056–1060. doi: 10.1111/j.1365-2109.2010.02659.x
Clokie Benjamin Gregory J., Elsheshtawy A., Albalat A., Nylund A., Beveridge A., Payne Chris J., et al. (2022). Optimization of low-biomass sample collection and quantitative PCR-based titration impact 16S rRNA microbiome resolution. Microbiol. Spectr. 0, e02255–e02222.
Collins C., Hall M., Fordyce M. J., White P. (2019). Survival and growth in vitro of paramoeba perurans populations cultured under different salinities and temperatures. Protist 170, 153–167. doi: 10.1016/j.protis.2018.11.003
Comas Morte J. (2018). Fouling management in cage aquaculture: New strategies on nets, fish health and economic impact (PhD PhD Thesis, Universitat Autonoma de Barcelona).
Cook E. J., Jahnke M., Kerckhof F., Minchin D., Faasse M., Boos K., et al. (2007). European Expansion of the introduced amphipod caprella mutica schurin 1935. Aquat. Invasions 2, 411–421. doi: 10.3391/ai.2007.2.4.11
Dahle O. M. V., Blindheim S. H., Nylund A., Karlsbakk E., Breck O., Glosvik H., et al. (2020a). Atlantic Salmon salmo salar and ballan wrasse labrus bergylta display different susceptibility to clonal strains of paramoeba perurans. Dis. Aquat Organ 140, 55–72. doi: 10.3354/dao03483
Dahle S. W., Bakke I., Birkeland M., Nordøy K., Dalum A. S., Attramadal K. J. K. (2020b). Production of lumpfish (Cyclopterus lumpus l.) in RAS with distinct water treatments: Effects on fish survival, growth, gill health and microbial communities in rearing water and biofilm. Aquaculture 522, 735097. doi: 10.1016/j.aquaculture.2020.735097
De Nys R., Guenther J. (2009). “8 - the impact and control of biofouling in marine finfish aquaculture,” in Advances in marine antifouling coatings and technologies. Eds. Hellio C., Yebra D. (Woodhead Publishing Series in Metals and Surface Engineering: Woodhead Publishing), 177–221.
Dürr S., Watson D. I. (2010). Biofouling and antifouling in aquaculture. In Biofouling. (Blackwell Publishing Ltd, UK: Wiley-Blackwell), 267–287.
Duarte L. N., Coelho F. J. R. C., Oliveira V., Cleary D. F. R., Martins P., Gomes N. C. M. (2019). Characterization of bacterioplankton communities from a hatchery recirculating aquaculture system (RAS) for juvenile sole (Solea senegalensis) production. PloS One 14, e0211209. doi: 10.1371/journal.pone.0211209
Edwards C. D., Pawluk K. A., Cross S. F. (2015). The effectiveness of several commercial antifouling treatments at reducing biofouling on finfish aquaculture cages in British Columbia. Aquac. Res. 46, 2225–2235. doi: 10.1111/are.12380
Elsheshtawy A., Clokie B. G. J., Albalat A., Beveridge A., Hamza A., Ibrahim A., et al. (2021). Characterization of external mucosal microbiomes of Nile tilapia and grey mullet Co-cultured in semi-intensive pond systems. Front. Microbiol. 12, 773860. doi: 10.3389/fmicb.2021.773860
Emilia Noor S., Eguchi M. (2012). Mixed Cultures of the Phytoplankton Nannochloropsis oculate and the Marine Bacterium Sulfitobacter sp. RO3 Inhibit the Growth of Virulent Strains of the Major Fish Pathogen Vibrio anguillarum. Aquac. Sci. 60, 39–45. doi: 10.11233/aquaculturesci.60.39
FAO. (2018). Salmo salar. Available at: http://www.fao.org/fishery/culturedspecies/Salmo_salar/en (Accessed February 4 2019).
Fitridge I., Dempster T., Guenther J., De Nys R. (2012). The impact and control of biofouling in marine aquaculture: a review. Biofouling 28, 649–669. doi: 10.1080/08927014.2012.700478
Floerl O., Sunde L. M., Bloecher N. (2016). Potential environmental risks associated with biofouling management in salmon aquaculture. Aquac. Environ. Interact. 8, 407–417. doi: 10.3354/aei00187
Foster Z. S., Sharpton T. J., Grünwald N. J. (2017). Metacoder: An r package for visualization and manipulation of community taxonomic diversity data. PloS Comput. Biol. 13, e1005404. doi: 10.1371/journal.pcbi.1005404
Gamble M. (2008). “9 - The Hematoxylins and Eosin,” in Theory and Practice of Histological Techniques (Sixth Edition), eds. Bancroft J. D., Gamble M. (Edinburgh: Churchill Livingstone), 121–134.
Gansel L. C., Plew D. R., Endresen P. C., Olsen A. I., Misimi E., Guenther J., et al. (2015). Drag of clean and fouled net panels – measurements and parameterization of fouling. PloS One 10, e0131051. doi: 10.1371/journal.pone.0131051
Garseth Å.H., Fritsvold C., Svendsen J. C., Bang Jensen B., Mikalsen A. B. (2018). Cardiomyopathy syndrome in Atlantic salmon salmo salar l.: A review of the current state of knowledge. J. Fish Dis. 41, 11–26. doi: 10.1111/jfd.12735
Guenther J., Misimi E., Sunde L. M. (2010). The development of biofouling, particularly the hydroid ectopleura larynx, on commercial salmon cage nets in mid-Norway. Aquaculture 300, 120–127. doi: 10.1016/j.aquaculture.2010.01.005
Gunnarsson G. S., Blindheim S., Karlsbakk E., Plarre H., Imsland A. K., Handeland S., et al. (2017). Desmozoon lepeophtherii (microsporidian) infections and pancreas disease (PD) outbreaks in farmed Atlantic salmon (Salmo salar l.). Aquaculture 468, 141–148. doi: 10.1016/j.aquaculture.2016.09.035
Haugland O., Mikalsen A. B., Nilsen P., Lindmo K., Thu B. J., Eliassen T. M., et al. (2011). Cardiomyopathy syndrome of atlantic salmon (Salmo salar l.) is caused by a double-stranded RNA virus of the totiviridae family. J. Virol. 85, 5275–5286. doi: 10.1128/JVI.02154-10
Hayward P. J., Ryland J. S. (2017). Handbook of the marine fauna of north-West Europe (Oxford University, UK: Oxford University Press).
Hellebø A., Stene A., Aspehaug V. (2014). Potensielle reservoarer for SAV og PMCV pAa marine akvakulturanlegg. (Ålesund, Norway: Møreforskning MARIN), 23 pp.
Hellebø A., Stene A., Aspehaug V. (2017). PCR survey for paramoeba perurans in fauna, environmental samples and fish associated with marine farming sites for Atlantic salmon (Salmo salar l.). J. Fish Dis. 40, 661–670. doi: 10.1111/jfd.12546
Herrero A., Thompson K. D., Ashby A., Rodger H. D., Dagleish M. P. (2018). Complex gill disease: an emerging syndrome in farmed Atlantic salmon (Salmo salar l.). J. Comp. Pathol. 163, 23–28. doi: 10.1016/j.jcpa.2018.07.004
Hess S., Wenger A. S., Ainsworth T. D., Rummer J. L. (2015). Exposure of clownfish larvae to suspended sediment levels found on the great barrier reef: Impacts on gill structure and microbiome. Sci. Rep. 5, 10561. doi: 10.1038/srep10561
Hodson S. L., Lewis T. E., Burkea C. M. (1997). Biofouling of fish-cage netting: efficacy and problems of in situ cleaning. Aquaculture 152, 77–90. doi: 10.1016/S0044-8486(97)00007-0
Imsland A. K., Reynolds P., Eliassen G., Hangstad T. A., Nytrø A. V., Foss A., et al. (2015). Feeding preferences of lumpfish (Cyclopterus lumpus l.) maintained in open net-pens with Atlantic salmon (Salmo salar l.). Aquaculture 436, 47–51. doi: 10.1016/j.aquaculture.2014.10.048
Infante-Villamil S., Huerlimann R., Jerry D. R. (2021). Microbiome diversity and dysbiosis in aquaculture. Rev. Aquac. 13, 1077–1096. doi: 10.1111/raq.12513
Isaksen T. E., Karlsbakk E., Watanabe K., Nylund A. (2011). Ichthyobodo salmonis sp. n. (Ichthyobodonidae, kinetoplastida), an euryhaline ectoparasite infecting Atlantic salmon (Salmo salar l.). Parasitology 138, 1164–1175. doi: 10.1017/S0031182011000916
Kassah J. E. (2012). Development of biofouling on salmon cage nets and the effects of anti-fouling treatments on the survival of the hydroid (Ectopleura larynx) (Ellis & solander 1786).
Kassambara A. (2020b) RSTATIX. pipe-friendly framework for basic statistical test. Available at: https://rpkgs.datanovia.com/rstatix/.
Legrand T. P. R. A., Catalano S. R., Wos-Oxley M. L., Wynne J. W., Weyrich L. S., Oxley A. P. A. (2020). Antibiotic-induced alterations and repopulation dynamics of yellowtail kingfish microbiota. Anim. Microbiome 2, 26. doi: 10.1186/s42523-020-00046-4
Li T., Long M., Ji C., Shen Z., Gatesoupe F.-J., Zhang X., et al. (2016). Alterations of the gut microbiome of largemouth bronze gudgeon (Coreius guichenoti) suffering from furunculosis. Sci. Rep. 6, 30606. doi: 10.1038/srep30606
Longmire J. L., Maltbie M., Baker R. J. (1997). Use of" lysis buffer" in DNA isolation and its implication for museum collections (Museum of Texas Tech University).
Madin J., Chong V. C., Hartstein N. D. (2010). Effects of water flow velocity and fish culture on net biofouling in fish cages. Aquac. Res. 41, e602–e617. doi: 10.1111/j.1365-2109.2010.02567.x
McMurdie P. J., Holmes S. (2013). Phyloseq: An r package for reproducible interactive analysis and graphics of microbiome census data. PloS One 8, e61217. doi: 10.1371/journal.pone.0061217
Mitchell S. O., Steinum T. M., Toenshoff E. R., Kvellestad A., Falk K., Horn M., et al. (2013). ‘Candidatus branchiomonas cysticola’ is a common agent of epitheliocysts in seawater-farmed Atlantic salmon salmo salar in Norway and Ireland. Dis. Aquat. Organ. 103, 35–43. doi: 10.3354/dao02563
Naylor R., Burke M. (2005). AQUACULTURE AND OCEAN RESOURCES: Raising tigers of the Sea. Annu. Rev. Environ. Resour. 30, 185–218. doi: 10.1146/annurev.energy.30.081804.121034
Njåstad E. B. (2018). Influence of food availability and nutritional state of macroalgae on development of fouling bryozoans on cultivated saccharina latissima Master thesis. (Trondheim, Norway: Department of Biology, Norwegian University of Science and Technology), 76.
Nylund A., Watanabe K., Nylund S., Karlsen M., Sæther P. A., Arnesen C. E., et al. (2008). Morphogenesis of salmonid gill poxvirus associated with proliferative gill disease in farmed Atlantic salmon (Salmo salar) in Norway. Arch. Virol. 153, 1299–1309. doi: 10.1007/s00705-008-0117-7
Nylund S., Andersen L., Saevareid I., Plarre H., Watanabe K., Arnesen C. E., et al. (2011). Diseases of farmed Atlantic salmon salmo salar associated with infections by the microsporidian paranucleospora theridion. Dis. Aquat Organ 94, 41–57. doi: 10.3354/dao02313
Nylund S., Steigen A., Karlsbakk E., Plarre H., Andersen L., Karlsen M., et al. (2015). Characterization of 'Candidatus syngnamydia salmonis' (Chlamydiales, simkaniaceae), a bacterium associated with epitheliocystis in Atlantic salmon (Salmo salar l.). Arch. Microbiol. 197, 17–25. doi: 10.1007/s00203-014-1038-3
Oksanen J., Blanchet F. G., Kindt R., Legendre P., Minchin P. R., O’hara R., et al. (2013). Package ‘vegan’. community ecology package, version 2. 1–295.
Olafsen T. (2006). Cost analysis of different antifouling strategies. (Trondheim, Norway: SINTEF Fisheries and Aquaculture). Doc. nr. SFH80 A 66041.
Palladino G., Rampelli S., Scicchitano D., Musella M., Quero G. M., Prada F., et al. (2021). Impact of marine aquaculture on the microbiome associated with nearby holobionts: The case of patella caerulea living in proximity of Sea bream aquaculture cages. Microorganisms 9. doi: 10.3390/microorganisms9020455
Pérez T., Balcázar J. L., Ruiz-Zarzuela I., Halaihel N., Vendrell D., De Blas I., et al. (2010). Host–microbiota interactions within the fish intestinal ecosystem. Mucosal Immunol. 3, 355–360. doi: 10.1038/mi.2010.12
Quast C., Pruesse E., Yilmaz P., Gerken J., Schweer T., Yarza P., et al. (2013). The SILVA ribosomal RNA gene database project: improved data processing and web-based tools. Nucleic Acids Res. 41, D590–D596.
Rosado D., Xavier R., Severino R., Tavares F., Cable J., Pérez-Losada M. (2019). Effects of disease, antibiotic treatment and recovery trajectory on the microbiome of farmed seabass (Dicentrarchus labrax). Sci. Rep. 9, 18946–18946. doi: 10.1038/s41598-019-55314-4
Rueness J. (1998). Alger I farger: en felthåndbok om kystens makroalger. (Oslo, Norway: Almater forlag AS).
Ruokolahti C. (1988). Effects of fish farming on growth and chlorophyll a content of cladophora. Mar. pollut. Bull. 19, 166–169. doi: 10.1016/0025-326X(88)90672-8
Schloss P. D., Westcott S. L., Ryabin T., Hall J. R., Hartmann M., Hollister E. B., et al. (2009). Introducing mothur: Open-source, platform-independent, community-supported software for describing and comparing microbial communities. Appl. Environ. Microbiol. 75, 7537. doi: 10.1128/AEM.01541-09
Slinger J., Adams M. B., Stratford C. N., Rigby M., Wynne J. W. (2021). The effect of antimicrobial treatment upon the gill bacteriome of Atlantic salmon (Salmo salar l.) and progression of amoebic gill disease (AGD) In vivo. Microorganisms 9, 987.
Steinum T. M., Brun E., Colquhoun D., Gjessing M., Lie K., Olsen A. B., et al. (2015). Proliferativ gjellebetennelse hos oppdrettslaks i sjøvann-patologi, utvalgte agens og risikofaktorer. Veterinærinstituttets rapportserie, 8–2015. doi: 10.1111/j.1365-2761.2007.00893.x
Steinum T., Kvellestad A., Colquhoun D. J., Heum M., Mohammad S., Grøntvedt R. N., et al. (2010). Microbial and pathological findings in farmed Atlantic salmon salmo salar with proliferative gill inflammation. Dis. Aquat Organ 91, 201–211. doi: 10.3354/dao02266
Steinum T., Kvellestad A., Rønneberg L. B., Nilsen H., Asheim A., Fjell K., et al. (2008). First cases of amoebic gill disease (AGD) in Norwegian seawater farmed Atlantic salmon, Salmo salar l., and phylogeny of the causative amoeba using 18S cDNA sequences. J. Fish Dis. 31, 205–214. doi: 10.1111/j.1365-2761.2007.00893.x
Stene A., Gansel L. C., Jansen M. D. (2018). Strategier for å begrense spredning av virus mellom sjølokaliteter med laksefisk - Fokus på Salmonid Alphavirus (SAV) og Pancreas Disease (PD). (Norway: Norwegian University of Science and Technology), 93.
Sylvain F.-É., Cheaib B., Llewellyn M., Gabriel Correia T., Barros Fagundes D., Luis Val A., et al. (2016). pH drop impacts differentially skin and gut microbiota of the Amazonian fish tambaqui (Colossoma macropomum). Sci. Rep. 6, 32032. doi: 10.1038/srep32032
Wickham H. (2016). “"Programming with ggplot2," in ggplot2,” in Elegant graphics for data analysis. Ed. Wickham H. (Cham: Springer International Publishing), 241–253.
Wiik-Nielsen J., Gjessing M., Solheim H. T., Litlabø A., Gjevre A. G., Kristoffersen A. B., et al. (2017). Ca. branchiomonas cysticola, ca. piscichlamydia salmonis and salmon gill pox virus transmit horizontally in Atlantic salmon held in fresh water. J. Fish Dis. 40, 1387–1394. doi: 10.1111/jfd.12613
Yoon J., Matsuo Y., Matsuda S., Adachi K., Kasai H., Yokota A. (2007). Rubritalea spongiae sp. nov. and rubritalea tangerina sp. nov., two carotenoid- and squalene-producing marine bacteria of the family verrucomicrobiaceae within the phylum 'Verrucomicrobia', isolated from marine animals. Int. J. Syst. Evol. Microbiol. 57, 2337–2343. doi: 10.1099/ijs.0.65243-0
Keywords: Biofouling, Gill microbiome, Immune response, Histopathology, Pathogens, Salmo salar, Oncorhynchus mykiss, Aquaculture
Citation: Elsheshtawy A, Clokie BGJ, Albalat A, Nylund A, Isaksen TE, Napsøy Indrebø E, Andersen L, Moore LJ and MacKenzie S (2023) Net cleaning impacts Atlantic salmon gill health through microbiome dysbiosis. Front. Aquac. 2:1125595. doi: 10.3389/faquc.2023.1125595
Received: 16 December 2022; Accepted: 10 February 2023;
Published: 19 May 2023.
Edited by:
Mehdi Soltani, Murdoch University, AustraliaReviewed by:
Carmen Amaro, University of Valencia, SpainCopyright © 2023 Elsheshtawy, Clokie, Albalat, Nylund, Isaksen, Napsøy Indrebø, Andersen, Moore and MacKenzie. This is an open-access article distributed under the terms of the Creative Commons Attribution License (CC BY). The use, distribution or reproduction in other forums is permitted, provided the original author(s) and the copyright owner(s) are credited and that the original publication in this journal is cited, in accordance with accepted academic practice. No use, distribution or reproduction is permitted which does not comply with these terms.
*Correspondence: Simon MacKenzie, c2ltb24ubWFja2VuemllQHN0aXIuYWMudWs=
Disclaimer: All claims expressed in this article are solely those of the authors and do not necessarily represent those of their affiliated organizations, or those of the publisher, the editors and the reviewers. Any product that may be evaluated in this article or claim that may be made by its manufacturer is not guaranteed or endorsed by the publisher.
Research integrity at Frontiers
Learn more about the work of our research integrity team to safeguard the quality of each article we publish.