 Afef Marzougui1
 Craig S. McConnel2
 Amber Adams-Progar3
 Tyler D. Biggs4
 Stephen P. Ficklin4
 Sindhuja Sankaran1*
- 1Department of Biological Systems Engineering, College of Agriculture, Human, and Natural Resource Sciences, Washington State University, Pullman, WA, United States
- 2Department of Veterinary Clinical Sciences, College of Veterinary Medicine, Washington State University, Pullman, WA, United States
- 3Department of Animal Sciences, College of Agriculture, Human, and Natural Resource Sciences, Washington State University, Pullman, WA, United States
- 4Department of Horticulture, College of Agriculture, Human, and Natural Resource Sciences, Washington State University, Pullman, WA, United States
Dairy cattle’s susceptibility to diseases significantly impacts their health, welfare, and longevity. Disability weights reflect the relative severity or impact of important diseases and provide an extension of epidemiological frequency measures. They are central for comparing disease burden across diverse causes when summarizing health status and disease severity. Yet, they often reflect group-level health status and rely on expert judgment, which is subjective. In absence of an objective approach, this study aimed to create disability weight metrics using pathophysiological data with machine learning approach. Four binary classifiers using a generalized linear model with Lasso regularization were developed to identify distinguishing features for healthy and diseased cows affected by hypocalcemia, ketosis, metritis and mastitis. Model performance, assessed via the Area Under the Curve (AUC), reached values of 0.72, 0.66, 0.82, and 0.92 for distinguishing hypocalcemia, ketosis, metritis and mastitis in cows from healthy groups. The selected features were combined into a summary disability weight – cumulative health measure – for each disease computed through weighted sums of feature importance from classification models. Notably, the average cumulative health measure differed significantly between healthy and diseased groups (p < 0.05). The relative ranking of diseases based on the average cumulative health measure was comparable to the expert survey-based approach. Such features will offer insights into disease impact and will provide a standardized metric for comparing disease severity.
1 Introduction
The health and well-being of dairy cattle have profound effects on herd profitability and public perceptions of dairy farming. Different factors increase the risk of health deterioration, which affects animal welfare. Such factors can be associated with the farm and herd size, management practices related to production systems, disease diagnosis and treatment, the genetics of cows, and the skills of personnel (Barkema et al., 2015). Concurrently, the rise of public awareness and the need to adhere to animal welfare regulations have promoted transparency in the dairy industry (Barkema et al., 2015; Temple and Manteca, 2020). However, the concept of welfare and well-being remains abstract, challenging to define, and difficult to measure (Temple and Manteca, 2020).
Because of disease occurrence, injuries, and related health outcomes, the experience of pain and suffering has a detrimental impact on animal welfare (McLennan, 2018; Temple and Manteca, 2020). A prolonged period of pain and suffering may adversely affect the biological functioning (McLennan, 2018) and longevity, which in turn can influence cattle productivity and the associated economics in a herd. Assessing the impacts of this health loss can be conducted by developing summary disability weight measure that describe disease burden (refers to relative impacts of different diseases and their sequelae) between groups along with the estimated time lost (refers to the length of productive life) due to the health event (McConnel et al., 2017, 2018). Different indicators contribute to the estimation of disease burden (Huntington et al., 2021). For example, the production loss can be measured in terms of economic and monetary components (Raboisson et al., 2020). Disability weights are key to a comparable estimation of disease burden across diverse reasons. The health loss can be determined based on disease severity scores or disability weights (McConnel et al., 2017). The cumulative effect of health loss can be estimated by extending the severity scores (subjective score from 1 to 10 with 1 representing least impact and 10 representing euthanasia or death) to account for disease duration (McConnel et al., 2018). Although the disability weight approach provides single measures of disease burden, the historical method is subjective and relies on the evaluator’s expertise. Therefore, in this study, we focused on establishing a technique to measure disease severity in dairy cattle with objective pathophysiological data.
The improvement of dairy production systems and the adoption of precision dairy farming technologies have generated substantial data that can be used to monitor herd performance and aid in decision-making (Shine and Murphy, 2021). These advancements enable the use of machine learning techniques to derive actionable insights from complex data. Many studies have investigated machine learning applications in the dairy industry to optimize farm management and production. For instance, milk yield, milk protein, milk fat, and concentrate feed intake were predicted using artificial neural networks (Fuentes et al., 2020). These predictions relied on features such as environmental factors, dairy cattle characteristics, and milking parameters, resulting in a correlation coefficent of ~0.86 (Fuentes et al., 2020). In another study, a time series classification algorithm was developed to identify cows with subclinical ketosis based on behavioral features and health data, including body condition score, back fat thickness, non-esterified fatty acids, milk yield parameters, and parity (Sturm et al., 2020). This study reported a sensitivity to identify diseased cows ranging between 63% and 67%. Furthermore, research explored statistical models, such as multivariable logistic regression, and machine learning algorithms like a recommender system to predict the likelihood of metritis cure in dairy cattle, using environmental factors and cow-level features (de Oliveira et al., 2021). Results indicated that the machine learning approach needs further optimization as the accuracy obtained was 72% compared to 75% for the multivariable model.
In a another study, eight machine learning classifiers were employed to identify mastitic cows based on milk quality traits recorded one day before disease diagnosis (Bobbo et al., 2021). These classifiers took into account factors such as parity, stage of lactation, year, and season of sampling. The results of this analysis indicated that with random forest, neural networks, and linear classifiers, the classification accuracy reached 79%. Additionally, a recent study applied a key-feature-based clustering approach that combined knowledge-driven feature selection with unsupervised machine learning to design new metrics for evaluating cow health outcomes (Matzhold et al., 2024). Furthermore, some studies have applied machine learning to classify data collected with accelerometer sensors into categories of behavior expressed by dairy cows (Riaboff et al., 2020; Gertz et al., 2020), and to identify anomalies of behavioral features as an indicator of a health disorder (Wagner et al., 2020). Although there is an increasing body of literature investigating the applications of machine learning in the dairy industry, very few studies have investigated animal welfare and to the authors’ knowledge none have attempted to quantify the physiological implications of the disease within the biological system on an individual basis. Therefore, the main objective of this study was to evaluate machine learning approach on the pathophysiological data for measuring disease severity. We present a proof-of-concept applied to a limited set of diseases. We hypothesized that machine learning could identify disease-associated features objectively, and combining these features into a weighted measure – cumulative health measure – could help categorize the severity (impact) of different disease types. This approach would provide a disease-specific summary disability weight for cattle. We used pathophysiological data collected for four different diseases: hypocalcemia, ketosis, metritis and mastitis in this study. We also explored relationships and integration of pathophysiological data with behavioral and gene expression data, based on their availability.
2 Materials and methods
2.1 Disease classes and observations
In this study, we developed a health summary measure technique based on the pathophysiological data collected from three different herds, encompassing four diseases to which dairy cattle are susceptible. The disease categories were hypocalcemia, ketosis, mastitis, and metritis. Hypocalcemia and ketosis are both metabolic diseases. Hypocalcemia (also called milk fever) occurs when a cow fails to maintain a balanced calcium level, which leads to a decline in calcium concentration in the blood (Goff, 2008). The cow can experience subclinical (asymptomatic) or clinical hypocalcemia (Venjakob et al., 2016). Subclinical and clinical ketosis are characterized by an elevated concentration of ketones (β-hydroxybutyrate/BHB) in the blood (Duffield, 2000). Metritis and mastitis are both inflammatory diseases. Metritis is a uterine infection caused by bacterial contamination and is characterized by fetid and discolored vaginal discharge (Sheldon et al., 2006). Mastitis is an inflammation of the mammary gland, leading to a decrease in milk production, composition, and quality (Gomes and Henriques, 2015). The cows with hypocalcemia, ketosis and metritis were within the early lactation period (less than 21 days in milk/DIM), with only mastitic cows being outside of this period. The treatment was at the discretion of dairy farm management with hypocalcemic cows treated within a week.
The data were collected from three different herds (denoted as dataset 1, dataset 2, and dataset 3). Dataset 1 included cows diagnosed with metabolic diseases (hypocalcemia and ketosis) and a healthy cohort, with a total of 92 observations. All the cows were within 21 DIM. The identification of hypocalcemia and ketosis (sometimes referred to as hyperketonemia) diseases was based on the Washington State University’s Veterinary Teaching Hospital Clinical Pathology service guidelines regarding calcium concentrations for hypocalcemia (subclinical <1.0–0.6; clinical <0.6 mM/L) and BHB concentrations for ketosis (subclinical ≥ 1.2; clinical ≥ 3.0 mmol/L), respectively. The samples were selected from a conventional dairy farm in Eastern Washington State. Some cattle had follow-up measurements about one or two weeks after the initial sampling period. The sampling period ranged between November 2017 and January 2019. Regular visits (about 3 times/week) were conducted by a veterinarian for diagnosis, and if selected, blood and serum sampling were performed on the same day. Some observations were excluded from our analysis to avoid the effect of confounding factors on feature selection and these conditions included multiple diseases occurring at the same time (8 samples), cattle with prior diseases (14 samples), or a change in disease diagnosis during the follow-up measurements (4 samples). The dataset from cows with the initial sampling period was used for further analysis. Thus, the dataset was reduced to 50 samples, which was composed of 26 healthy, 9 hypocalcemic (clinical = 7 and subclinical = 2), and 15 ketotic (all subclinical) cows.
Dataset 2 included cows (within 4 to 14 DIM) diagnosed with metritis during early lactation and a healthy group with a total of 60 observations. The observations on cattle were selected from a conventional dairy farm in Central Washington State, and a detailed description of sampling and methods can be found in (McConnel et al., 2020a). Briefly, metritis was initially suspected based on fetid vaginal discharge and confirmed through rectal palpation to expel and observe bloody, red-brown, milky, thin or watery discharge from an enlarged uterus. The diagnosed metritic cows had anorexic, fetid vaginal discharge (given a score of five) and pyrexia and were within 10 DIM. The candidates for sampling were selected by the dairy personnel followed by veterinarian evaluation. The sampling period was conducted in June 2018, with approximately three visits per week were made over three weeks for diagnosis and sampling. Three repeated samplings were performed: an initial sampling (referred to as time point 1, TP1) followed by two follow-up measurements (TP2 and TP3). At each time point, samples were collected from 9 healthy and 11 metritic cows (n=20 per time point, totaling 60 observations across all three time points).
Dataset 3 included cows (in 72–269 DIM) diagnosed with mastitis and a healthy group with a total of 60 observations. The observations on cattle were also selected from a different conventional dairy farm in Central Washington State, and a detailed description of sampling and methods can be found in (McConnel et al., 2020b). The mastitic cows (72–269 DIM) were identified as having abnormal milk (garget), redness, swelling, and heat in mammary quarters, and systemic signs (severity score of 2 or higher, clinical). The candidates for sampling were also selected by the dairy personnel followed by veterinarian evaluation. The sampling period was conducted between February and April 2019 (about 1 visit per week for a few weeks) for diagnosis and sampling, with three repeated samplings (1 initial sampling date/TP1 + 2 follow-up measurements/TP2 and TP3). In each sampling period, 8 healthy and 12 mastitic cows were sampled (n=20 for each time point; 20 x 3 = 60 observations in total).
2.2 Data collection
2.2.1 Pathophysiological data
The pathophysiological data (Table 1) included whole blood and serum measurements for complete blood count, clinical chemistry profiles, BHB, and haptoglobin concentrations. A total of 49 features were collected for datasets 1 and 3, and 13 features for dataset 2 (Table 1). In addition to the blood count data, rectal temperature was monitored in datasets 2 and 3 using a digital thermometer during blood and serum sampling.
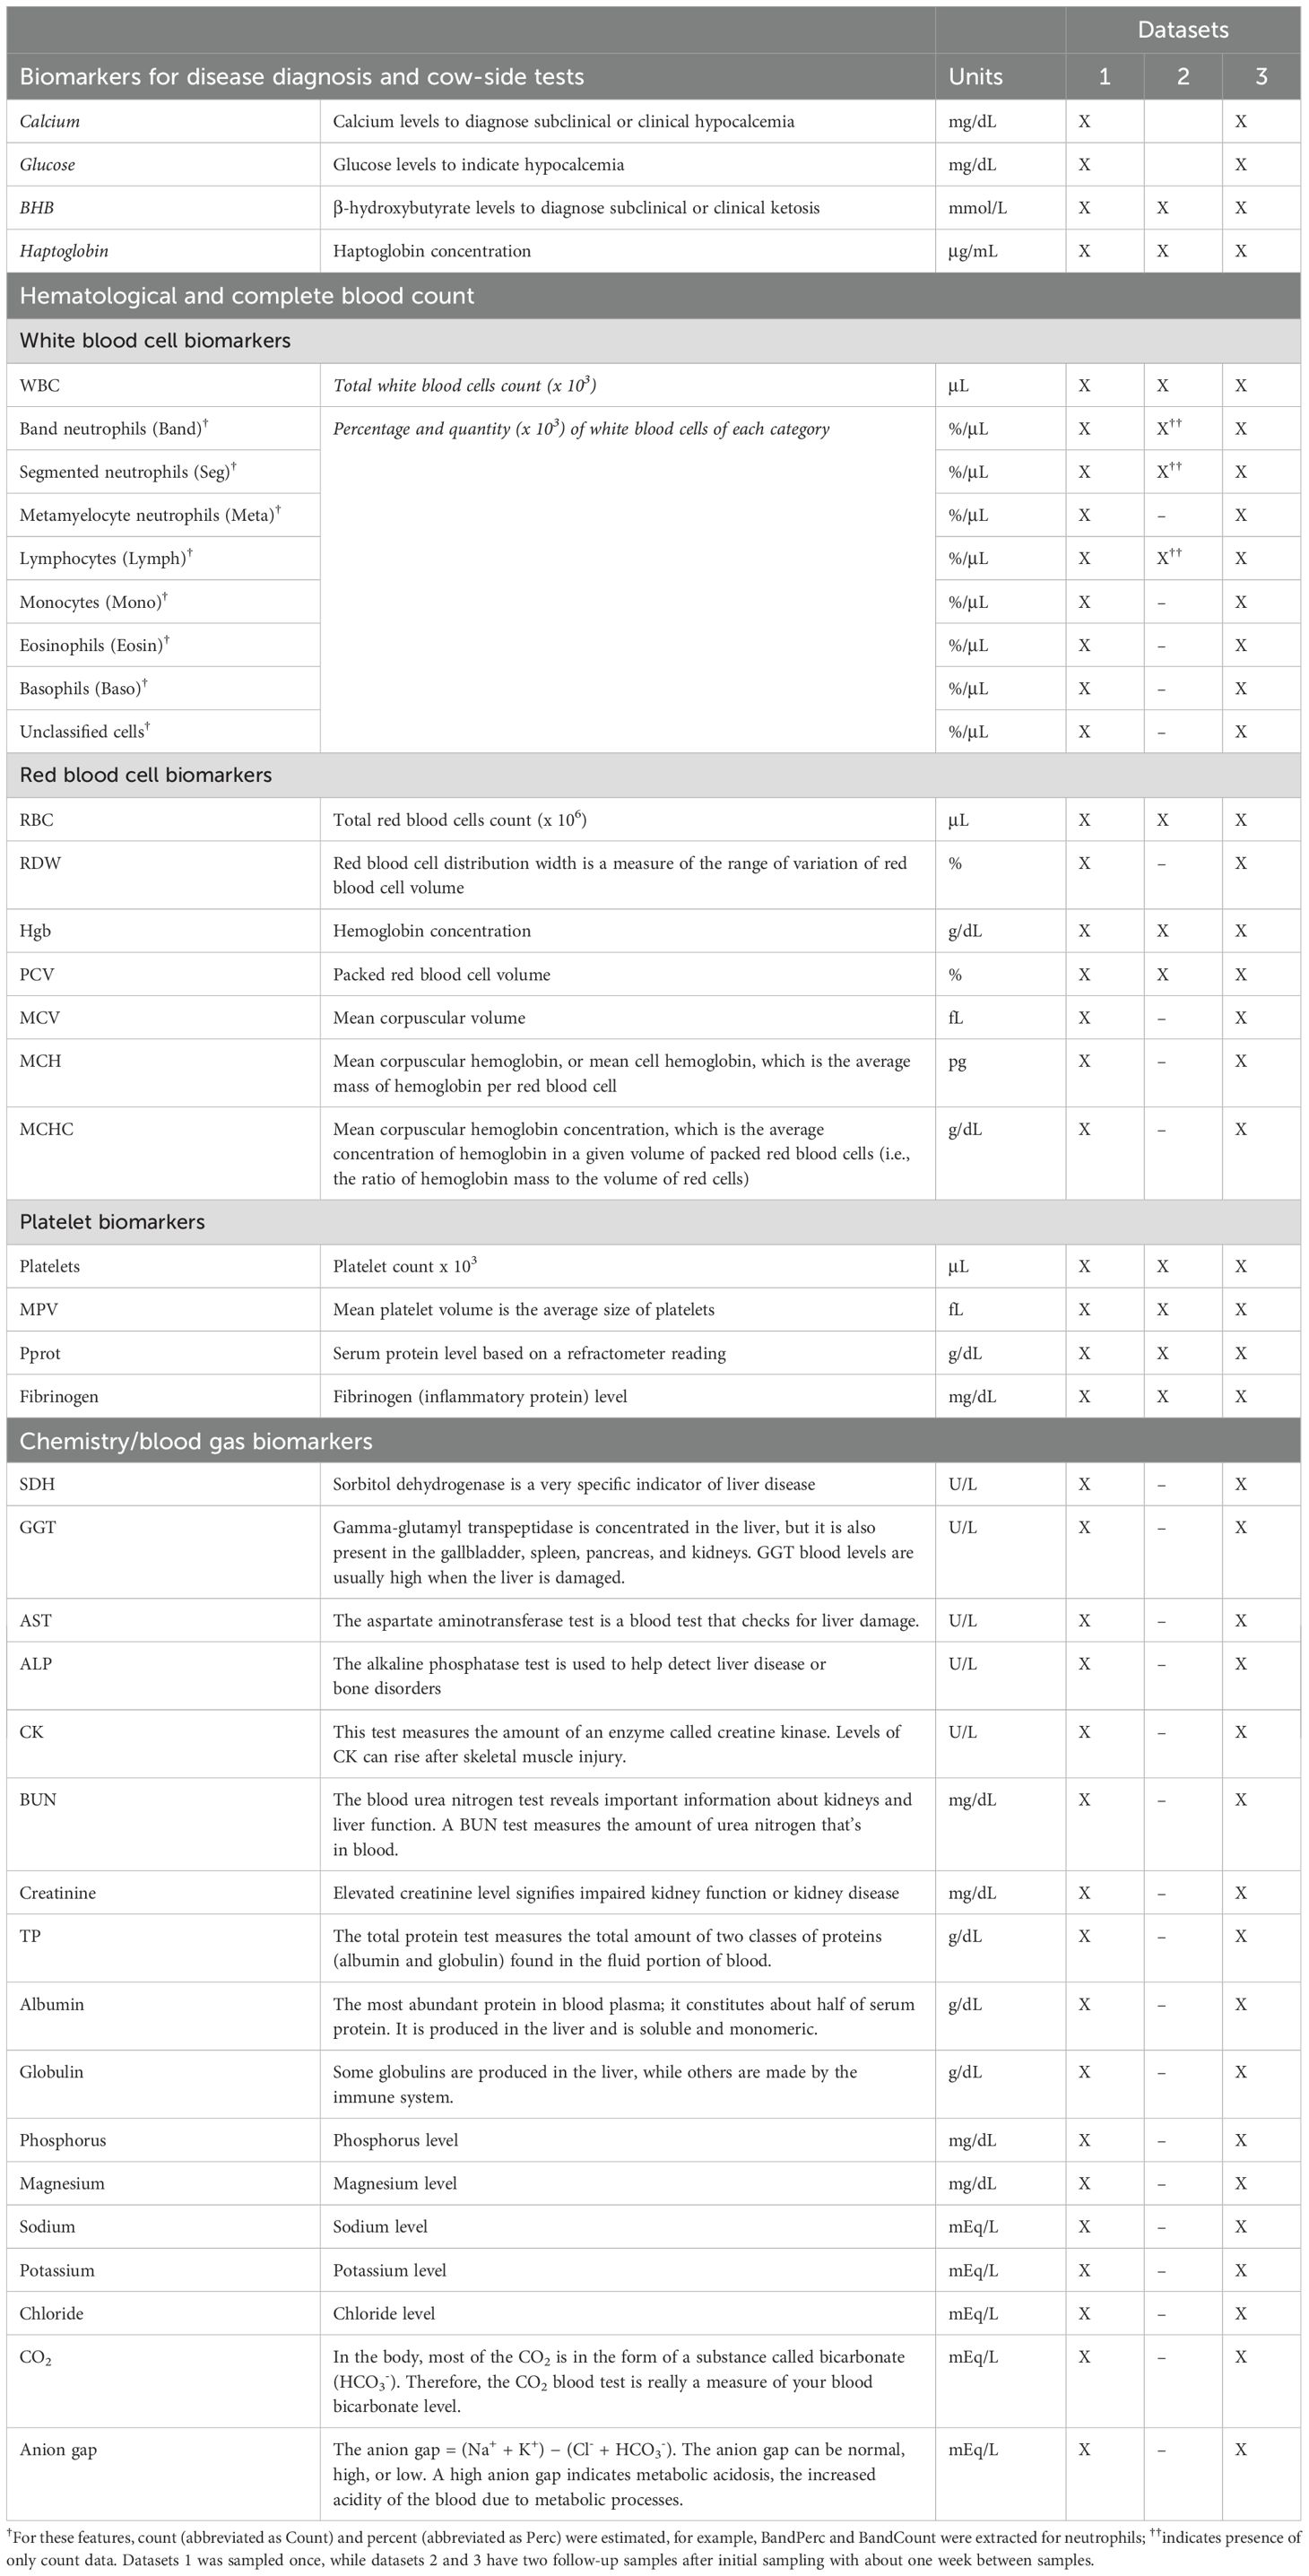
Table 1. The measured pathophysiological data in each dataset.
2.2.2 Gene expression data
Gene expression data were collected for both datasets 2 and 3. Details about data collection protocols and pre-processing can be found in (McConnel et al., 2020a, b). The analysis was conducted on the same trials as those reported in these studies. It identified 14 genes associated with metritis and 19 genes associated with mastitis. The feature selection was based on a random forest approach combined with the Boruta algorithm. In this study, we integrate these pre-identified genes with pathophysiological data to evaluate whether this combination can improve the distinction between healthy and diseased cows. The selected genes are listed in Table 2.
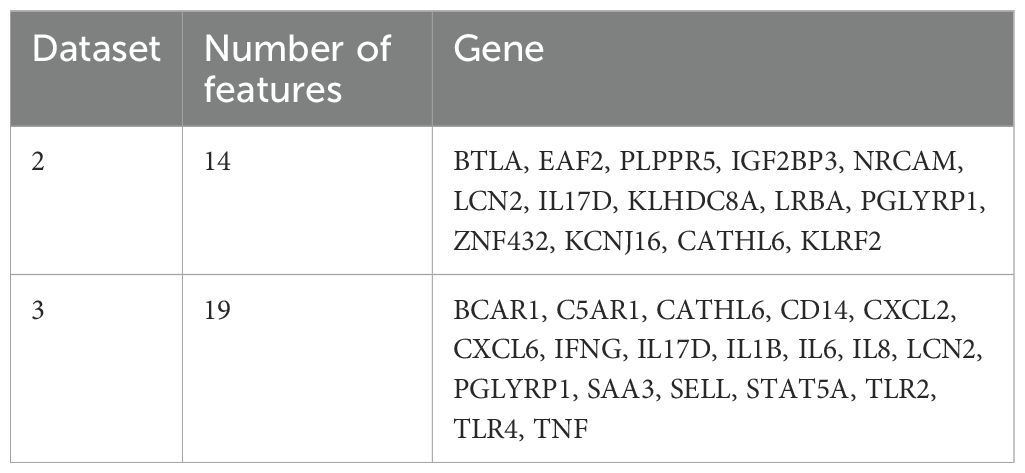
Table 2. Selected genes used for further analysis in this study (more details found in McConnel et al., 2020a, 2020b).
2.2.3 Behavioral data
Behavioral data were included in this study for dataset 3. The behavioral data were collected using an ear-tag accelerometer (CowManager Sensor™, Agis, Harmelen, the Netherlands). The sensor tracks and classifies ear and head movement into five behavioral patterns: eating (chewing, swallowing feed), rumination (chewing, standing, or lying), active (walking drinking water, etc.), high active (behavior related to estrus signs), and not active (no movement for 60 s – while lying or standing) (Zambelis et al., 2019; www.cowmanager.com). These activities are measured as the amount of time spent performing each category. As the sensor continuously monitored these activities, the proportion of each hour spent in each activity was calculated. Additionally, the sensor continuously measured ear temperature. Example plots of the time series data are illustrated in Figure 1.
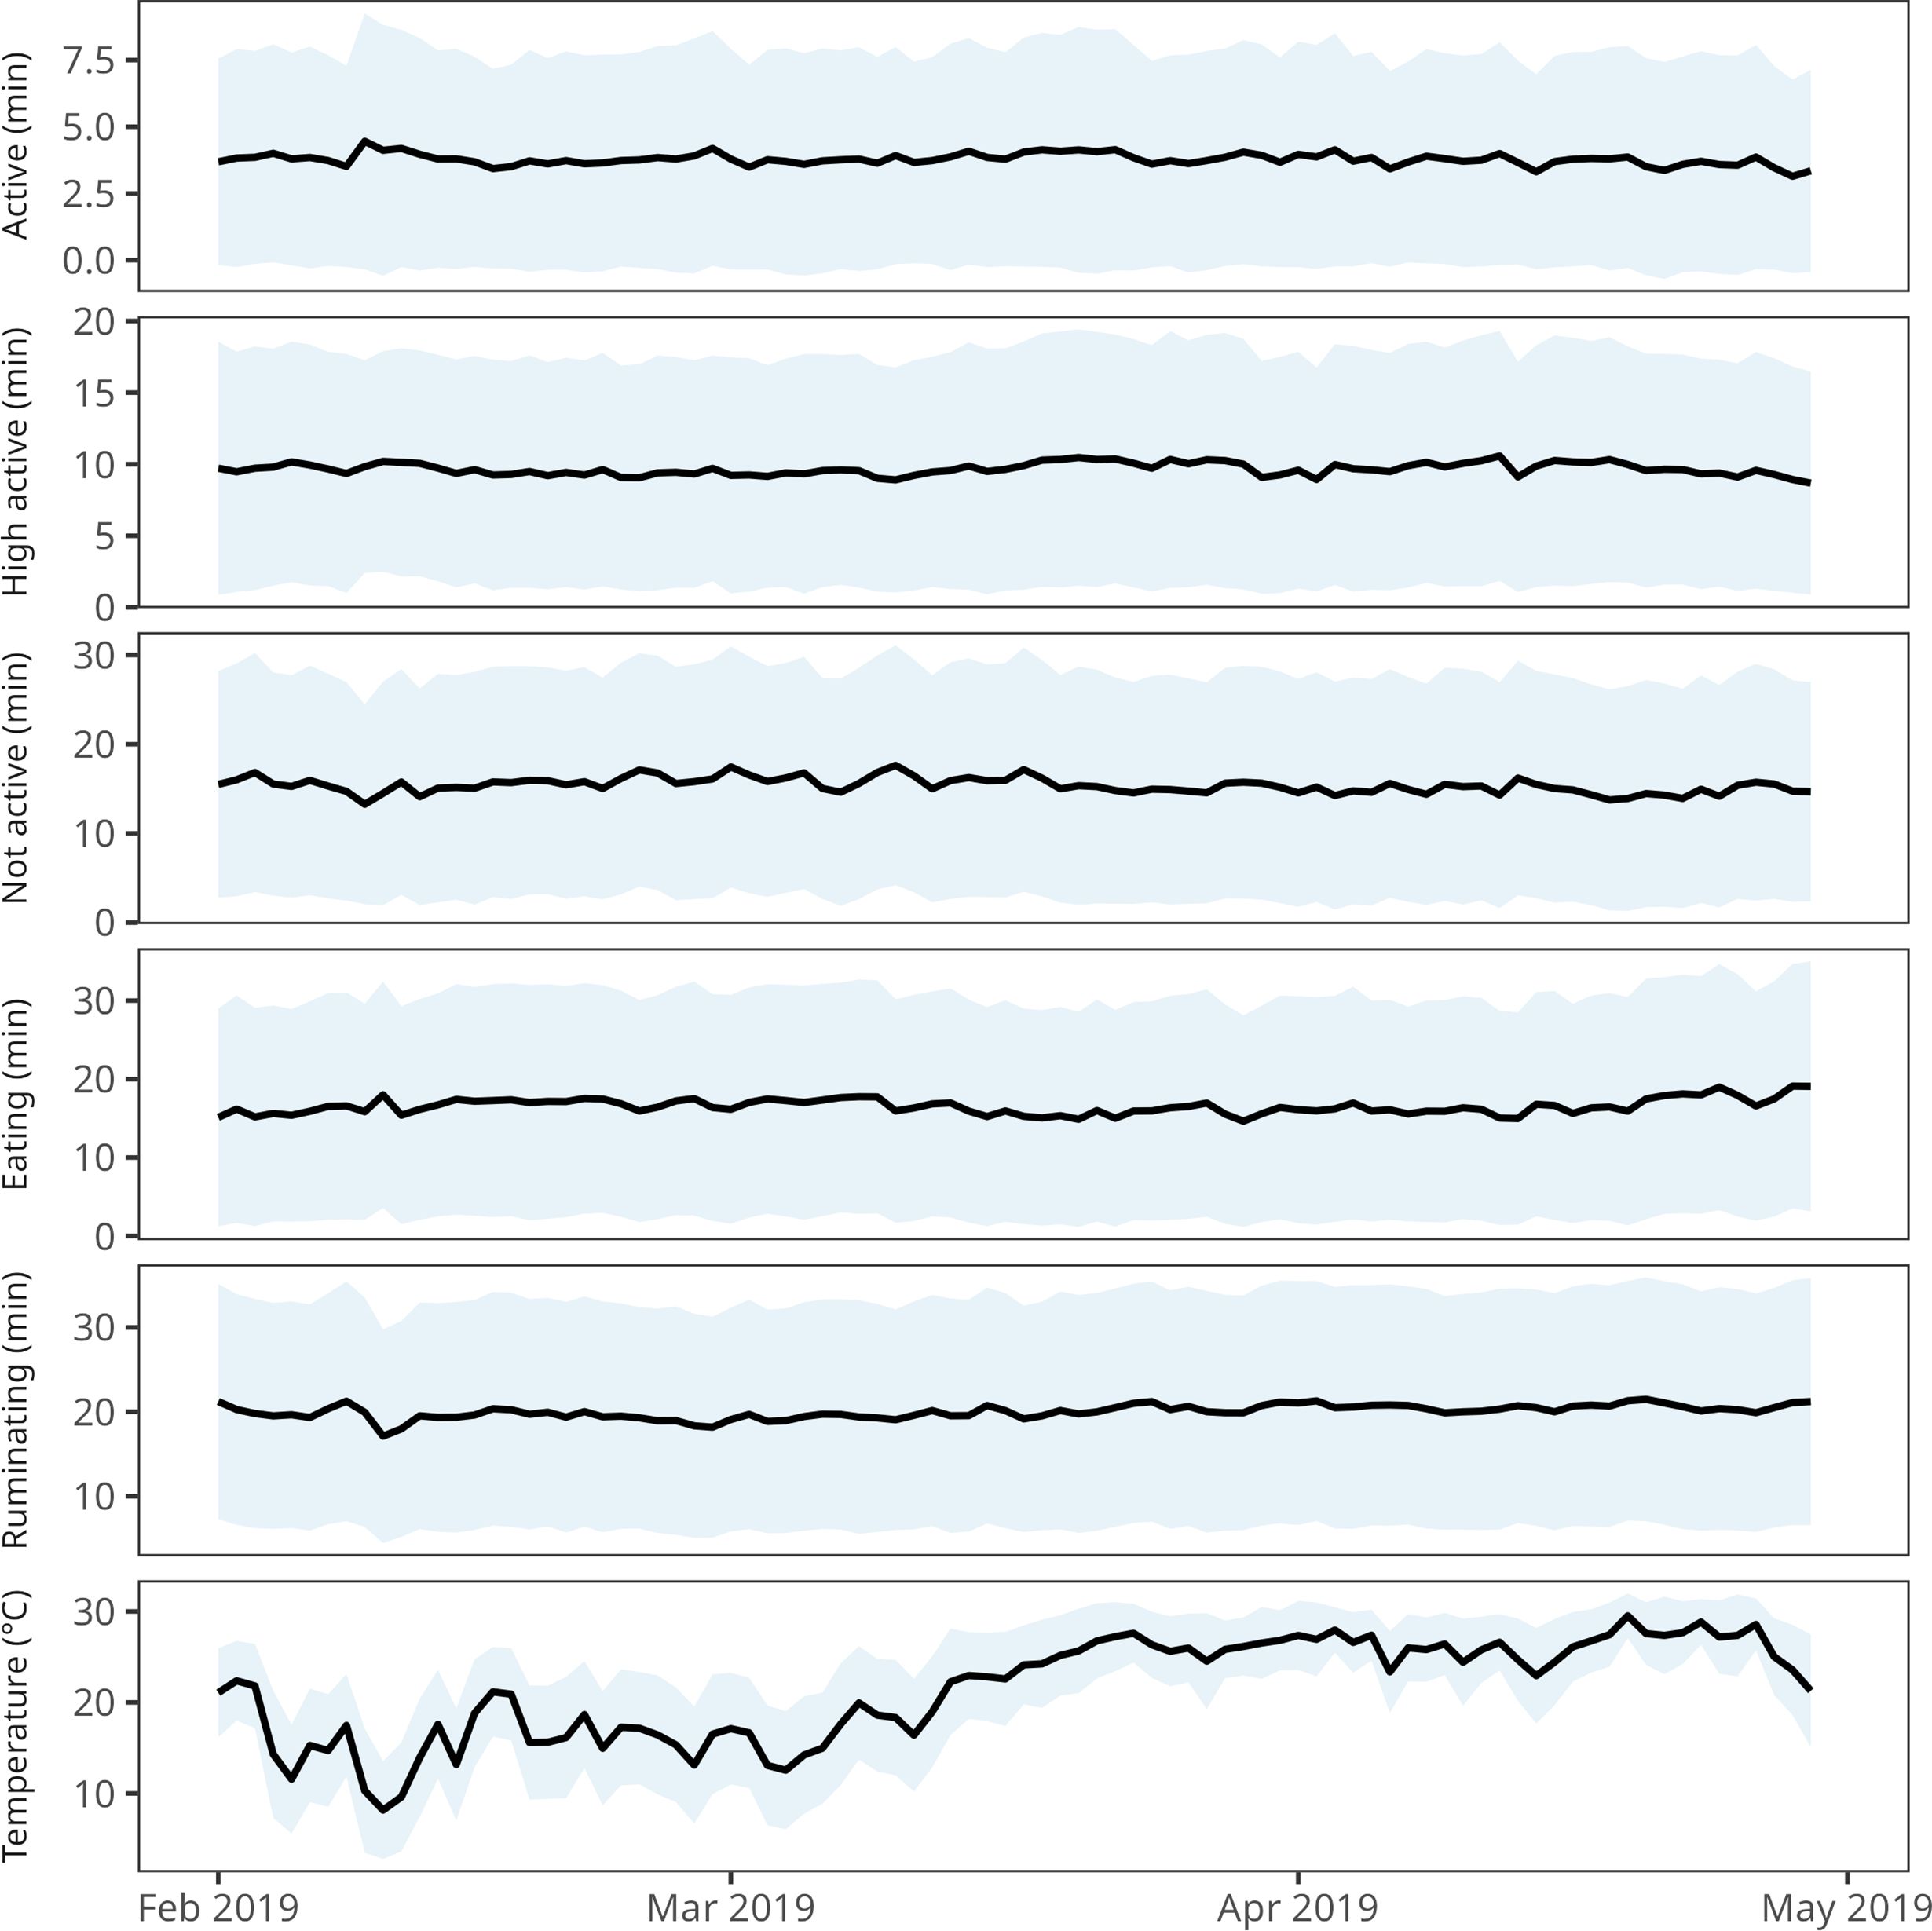
Figure 1. Variation of behavioral data and ear temperature averaged over the herd from dataset 3 (average data per day ± standard deviation).
2.3 Disability weight computation
The summary disability weight measure, termed as cumulative health measure, was computed in two steps: (1) identifying important features from pathophysiological data collected at the initial diagnosis (initial sampling period or TP1) to distinguish between healthy and diseased groups, using machine learning for feature selection, and (2) integrating these features into a weighted cumulative health measure based on their importance scores. The following sections outline the steps to establish this cumulative health measure. We also explored the integration of gene expression data (limited to datasets 2 and 3) and behavior (limited to dataset 3), based on the data availability, to assess their impact on classifying severity. All analyses were conducted in R (http://www.r-project.org/; release 4.0.3).
2.3.1 Exploratory analysis and feature pre-processing
We began by exploring the data from each dataset to identify missing values, detect outliers, and investigate the relationship between features and health status prior to feature selection. In the pathophysiological data, 11 features in dataset 1 and 12 features in dataset 3 had missing values from the complete blood count and were excluded from further analysis. Additionally, haptoglobin concentration and ALP in dataset 1 had missing values and were also removed. The remaining features were checked for zero or near-zero variance. We analyzed the distribution of each feature and flagged any observations with extreme values (< or > 1.5 times interquartile range). The final features used in the models are described in Supplementary Table S1.
In the behavior data, we noticed that ear temperature occasionally included negative values. To understand this anomaly, we plotted the daily and monthly data. The error seemed to be random and only affected temperature data. A previous study found that ear temperature can be influenced by ambient temperature (Venjakob et al., 2016). Since observations in dataset 3 were collected between February and April, when ambient temperatures can drop below 0°C, we removed all records with negative temperature values. Future studies could investigate anomaly detection and imputation to address such issues. We selected the observations taken during the disease diagnosis dates TP1, assuming that cows enduring stress, discomfort, or diseases would show behavioral changes. For example, reduced feed intake and changes in resting behavior were observed 3–5 days before mastitis diagnosis (Sepúlveda-Varas et al., 2016). In this study, we evaluated the behavior data for 1, 2, and 3 days prior to initial sampling period (TP1). Hourly data were averaged by date, and aggregated observations were normalized using a daily cohort mean for each behavioral feature (trimmed mean of 20%) of 3425, 3405, and 3403 cows on days −1, −2, −3, respectively. The normalization was performed as described in Equation 1:
where d is the initial sampling date TP1 – (1, 2, or 3 days) and i is the ith observation.
Spearman correlation analysis was conducted between pathophysiological data at TP1 (datasets 1, 2, and 3). We used the corrr package (Kuhn et al., 2020) to create a correlation network to visualize relationships between features. This network analysis helps identify clusters of related variables, supporting the interpretation of feature selection. Univariate analysis was performed using the nonparametric Mann-Whitney U test to compare differences between the healthy and diseased groups.
2.3.2 Feature selection
This section outlines the process of identifying relevant features for distinguishing between healthy and diseased groups, using the data collected at the initial sampling period or TP1. The focus on TP1 data aims to capture early indicators of disease and reduce potential bias from disease progression or treatment effects. In dataset 1, glucose, calcium, and BHB were excluded as they were used for disease diagnosis. To further reduce the feature space, we verified the correlation between features and retained globulin and albumin, removing total protein content as it encompassed both parameters in datasets 1 and 3. When complete blood count data included both counts and percentages, percentages were prioritized.
Feature selection was conducted using an embedded method with L1 (Lasso: least absolute shrinkage and selection operator) regularization. A binary classifier was built using the generalized linear model from the glmnet package (Friedman et al., 2010) to distinguish between healthy and diseased groups. Four models were developed to classify healthy – hypocalcemia, healthy – ketosis, healthy – metritis, and healthy – mastitis (Table 3), using the data from the initial sampling period for all analyses.
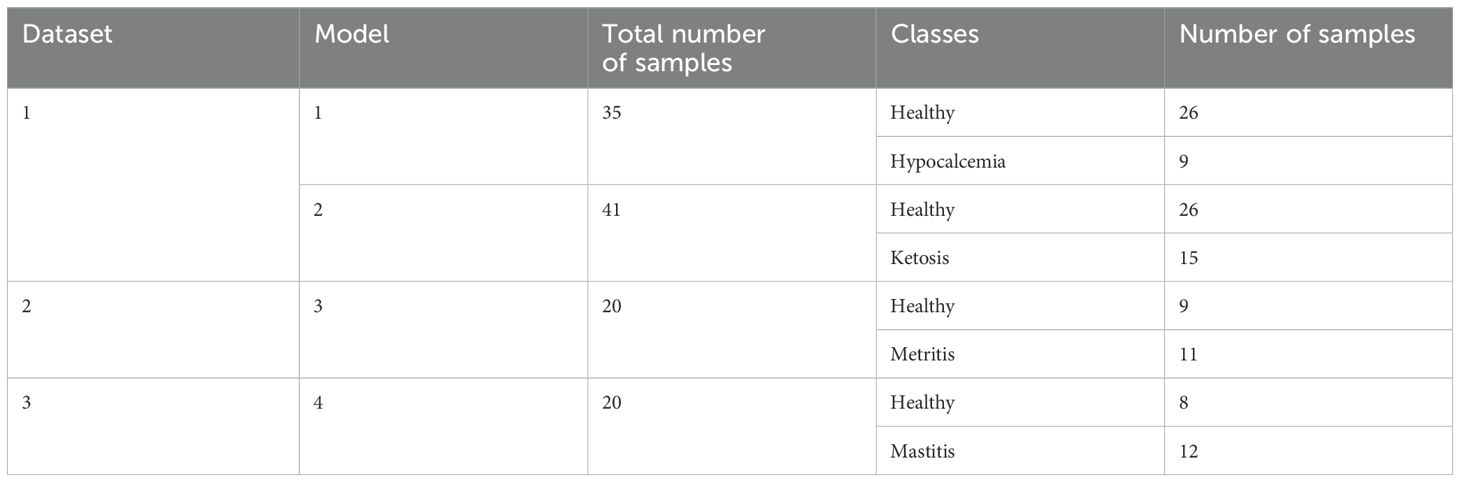
Table 3. Summary of sample size, classes, and number of pathophysiological data for each model.
Models were trained and tested with a leave-one-out cross-validation (LOOCV) approach. The sample size (n) was 35, 41, 20, and 20 for healthy – hypocalcemia, healthy – ketosis, healthy – metritis, and healthy – mastitis, respectively. The caret package (Kuhn, 2008) was used for training. Because features had different magnitudes and the penalty of the regularized linear models depends on the scale of coefficients, features were centered and scaled during training. Class weights were applied to balance the data due to the presence of imbalanced classes (Table 3). The penalty coefficient λ was tuned using a bootstrap-based resampling approach (25 bootstrap, default value), with the Area Under the Curve (AUC) used as the primary metric for assessment. The λ corresponding to the highest AUC was selected to train the final model.
The final set of features was selected based on the penalized coefficients from Lasso regularization, with only features having non-zero coefficients retained for further analysis. The varImp function from the caret package was used to extract the normalized importance score for each feature. To evaluate feature stability, we computed the percentage of occurrence, defined as the proportion of LOOCV iterations where a feature had a non-zero coefficient. Feature importance was reported as the mean ± 1 standard deviation and the percentage of the occurrence across LOOCV iterations. Finally, model performance was assessed using overall accuracy, AUC, specificity, sensitivity, and F1 score.
2.3.3 Cumulative health measure
The goal of this study is to develop a method for estimating objective summary disability weight measures to quantify how much a particular disease affects dairy cattle. This measure can be used to compare different health states and their consequences. It summarizes complex data into a single number that represents the overall health status or disease burden of an individual cow, rather than the entire cohort.
As the previous section described, the output of the feature selection step is a set of relevant features with corresponding mean importance scores and percentage of occurrence. To create a single summary measure, these features were combined into a cumulative health measure, where each feature's contribution was scaled using its mean importance score relative to the total importance. To standardize the data, features were centered and scaled to have a range between 0 and 1 before calculating the cumulative health measure.
The cumulative health measure for each disease category was calculated as Equation 2:
where the adjusted weight is a global scaling factor ensuring that the total feature importance sums to 100%, and feature datai,j refers to the value of feature j for the ith cow.
To assess disease severity relative to the healthy group, the cumulative health measure was normalized by the average of the healthy cohort for each dataset. This approach is similar to the severity scores representing the cumulative effect of health loss, as reported in McConnel et al. (2018). This normalization helps estimate the disease burden in comparison to the healthy cohort. It was performed following Equation 3:
where i represents the observation for each diseased cow.
To further analyze how behavior and pathophysiological profiles contribute to differentiating disease severities, the final (non-normalized) cumulative health measure was combined with behavior features – such as eating, rumination, and activity levels – and analyzed using a principal component analysis (PCA) with the FactoMineR package (Lê et al., 2008).
3 Results
3.1 Comparison of cattle characteristics and pathophysiological data
We compared cattle characteristics (DIM and lactation number) and pathophysiological data between healthy and diseased groups within the cohort. Detailed results are provided in the Supplementary Materials (Supplementary Tables S2–S5).
In dataset 1, the median DIM was ≤ 10 days, with a median lactation number of 2 and 3 for the healthy – ketosis and healthy – hypocalcemia groups, respectively. At the initial sampling period, dataset 2 had a median DIM of ≤ 10 days and a median lactation number of 2, while dataset 3 had a median DIM of ≥ 10 days and a median lactation number of 3. No significant differences in DIM were observed between healthy and diseased groups, except in the healthy – hypocalcemia groups, where hypocalcemic cows had lower DIM than healthy cows (Mann-Whitney U test, P < 0.05). Overall, we identified 13 pathophysiological features that differed between healthy and hypocalcemic cows (Supplementary Table S2). The levels of RBC, hemoglobin concentration, PCV, CK, BUN, creatinine, sodium, and chloride were elevated in the hypocalcemic group compared to the healthy group (Mann-Whitney U test, P < 0.05). In contrast, serum concentrations of calcium, Pprot, total protein, albumin, and globulin were lower in the hypocalcemic group (Mann-Whitney U test, P < 0.05). In the healthy-ketosis comparison, five features differed significantly (Supplementary Table S3). Serum concentrations of BHB, AST, and anion gap were elevated in ketotic cows (Mann-Whitney U test, P < 0.0001 for BHB, P = 0.037 for AST, and P = 0.003 for anion gap), while the concentrations of glucose and BUN were lower (Mann-Whitney U test, P < 0.0001 for calcium and P = 0.037 for Glucose).
In the healthy – metritis comparison, four features showed significant differences (Supplementary Table S4). Serum concentrations of haptoglobin, band count, and fibrinogen were higher in metritic cows (Mann-Whitney U test, P < 0.01), whereas the Pprot level was lower (Mann-Whitney U test, P = 0.002). In the healthy – mastitis comparison, nine features differed significantly between the two groups (Supplementary Table S5). Serum concentrations of haptoglobin, fibrinogen, and glucose were elevated in mastitic cows (Mann-Whitney U test, P < 0.01), while the levels of SegPerc, SDH, CK, albumin, calcium, and anion gap were lower (Mann-Whitney U test, P < 0.05).
3.2 Correlation analysis of pathophysiological data
The relationships between the pathophysiological data were explored with a correlation network (Figure 2). The absolute correlation coefficients ranged from 0.002 to 0.97 for healthy-hypocalcemia, 0.0003 to 0.97 for healthy – ketosis, 0.005 to 0.91 for healthy – metritis, and 0.0008 to 0.92 for healthy – mastitis groups. In the healthy – hypocalcemia groups, calcium level and serum concentrations of BHB, RBC, hemoglobin concentration, PCV, platelets, globulin, Pprot, total protein, and albumin were correlated (Spearman coefficient: 0.37 ≤ |ρ| ≤ 0.70; P < 0.05). In the healthy-ketosis groups, serum BHB was correlated with AST, potassium, anion gap, and glucose (Spearman coefficient: 0.43 ≤ |ρ| ≤ 0.79, P < 0.05). The features from the complete blood count profile did not show differences between the healthy and ketosis groups. However, SegCount and SegPerc were correlated and clustered with BUN, and AST was correlated with MonoPerc (Figure 2B).
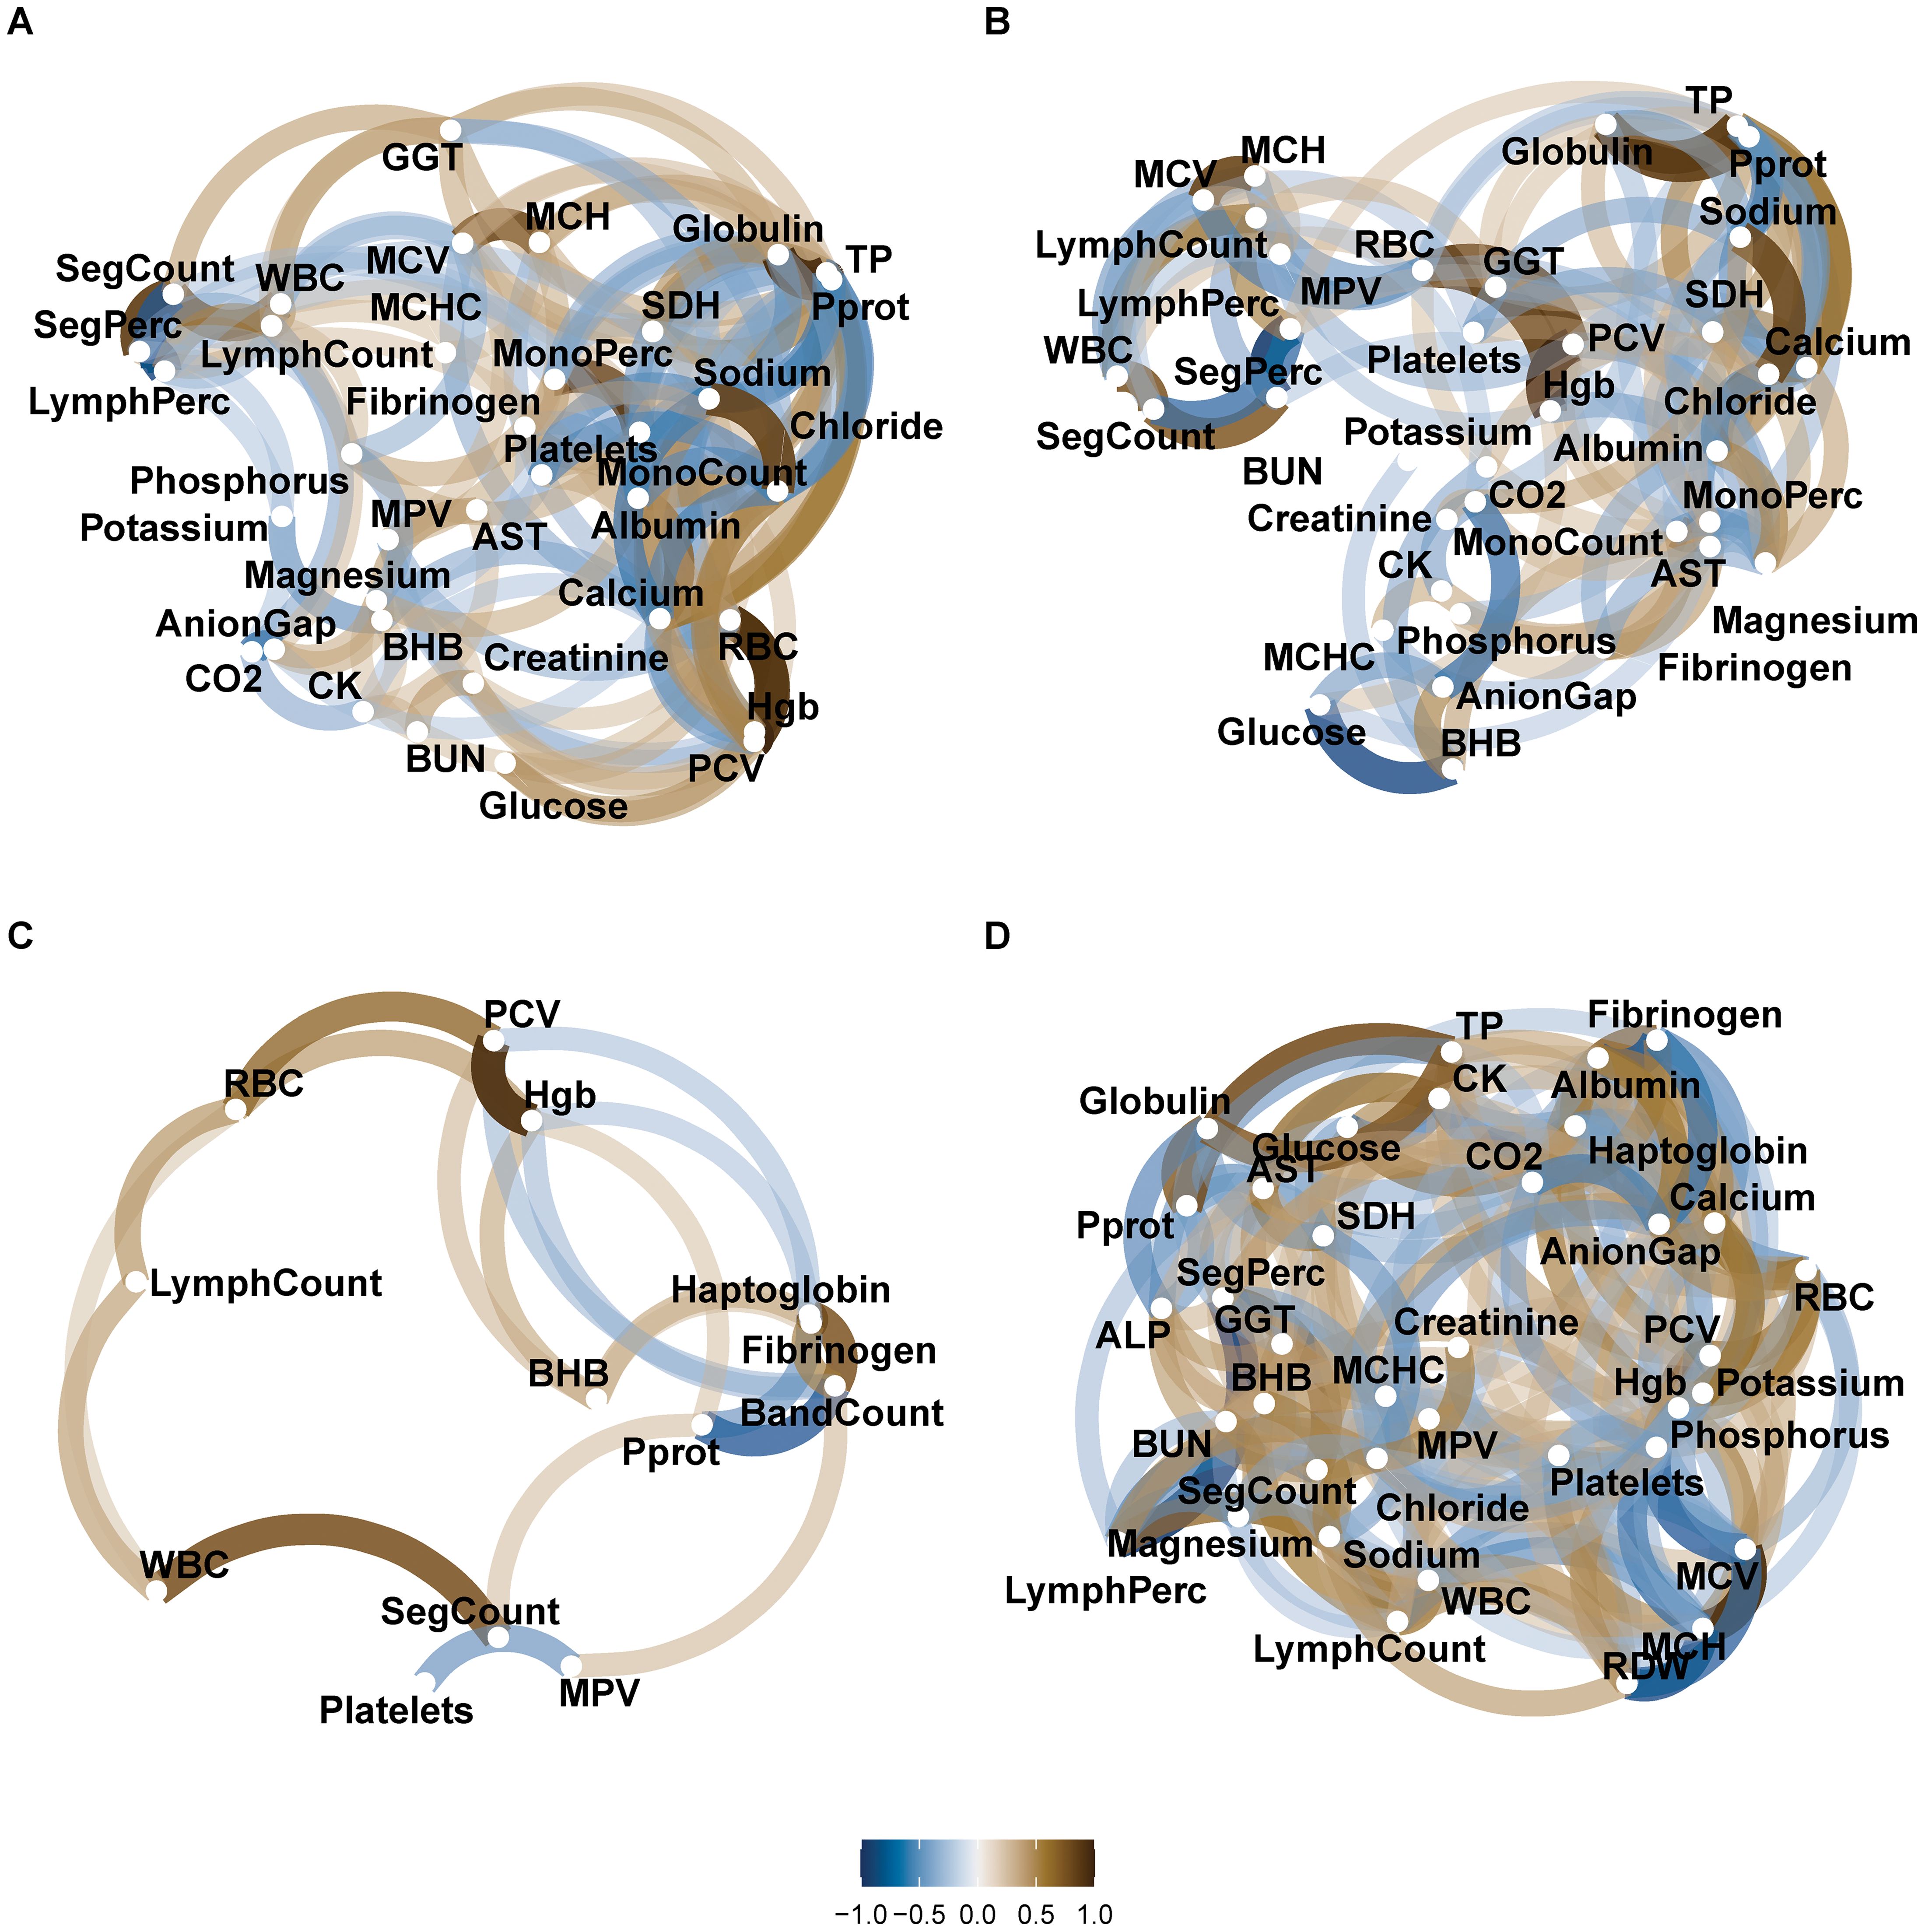
Figure 2. Networks of pairwise correlation between pathophysiological data for each healthy – disease category. (A) Correlation between features in dataset 1 (healthy = 26 samples and hypocalcemia = 9 samples); (B) Correlation between features in dataset 1 (healthy = 26 samples and ketosis = 15 samples); (C) Correlation between features in dataset 2 (healthy = 9 samples and metritis = 11 samples); and (D) Correlation between features in dataset 3 (healthy = 8 samples and mastitis = 12 samples). Legend key represents ρ spearman coefficient. Each node represents a feature, the distance between nodes reflects the magnitude of correlation, and the transparency and width of the paths represent the strength of correlation.
In the healthy – metritis groups, haptoglobin, band count, Pprot, and fibrinogen were clustered together and correlated (Figure 2C). In the healthy – mastitis groups, serum concentrations of fibrinogen and albumin were clustered and correlated with haptoglobin and calcium, while glucose was clustered and correlated with SDH and CK (Figure 2D).
3.3 Disease-specific features selection
Feature selection was performed using data collected at the initial sampling period (TP1) to develop cumulative health measure, which was then evaluated in the follow-up measurements (TP2 and TP3). The features used as input for the binary classifiers are summarized in Supplementary Table S1. As displayed in Table 4, the binary classifiers achieved moderate to good performance, with AUC values ranging between 0.66 to 0.92. The lowest discriminatory ability was recorded in the classification of healthy and ketotic cows (0.77 sensitivity and 0.53 specificity). Over one-third of healthy cows were misclassified as ketotic, which increased the false positive cases (Figure 3C). A similar pattern of misclassification was noted in the healthy – hypocalcemia groups (Figure 3A). The highest classification accuracy was achieved in the healthy – mastitis (0.80 sensitivity and 1.00 specificity) and healthy – metritis (0.70 sensitivity and 1.00 specificity) datasets. All misclassified cases in these comparisons were false negatives, where diseased cows were incorrectly classified as healthy (Figures 3E, G).
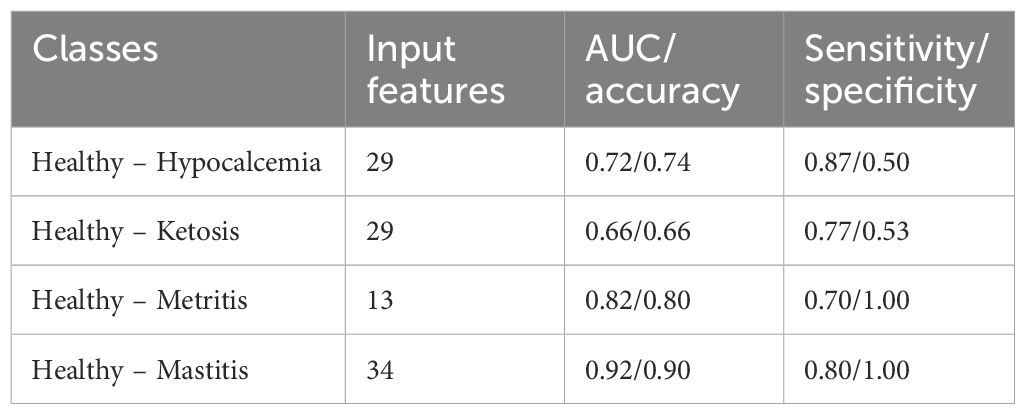
Table 4. Model performance during classification of different disease groups.
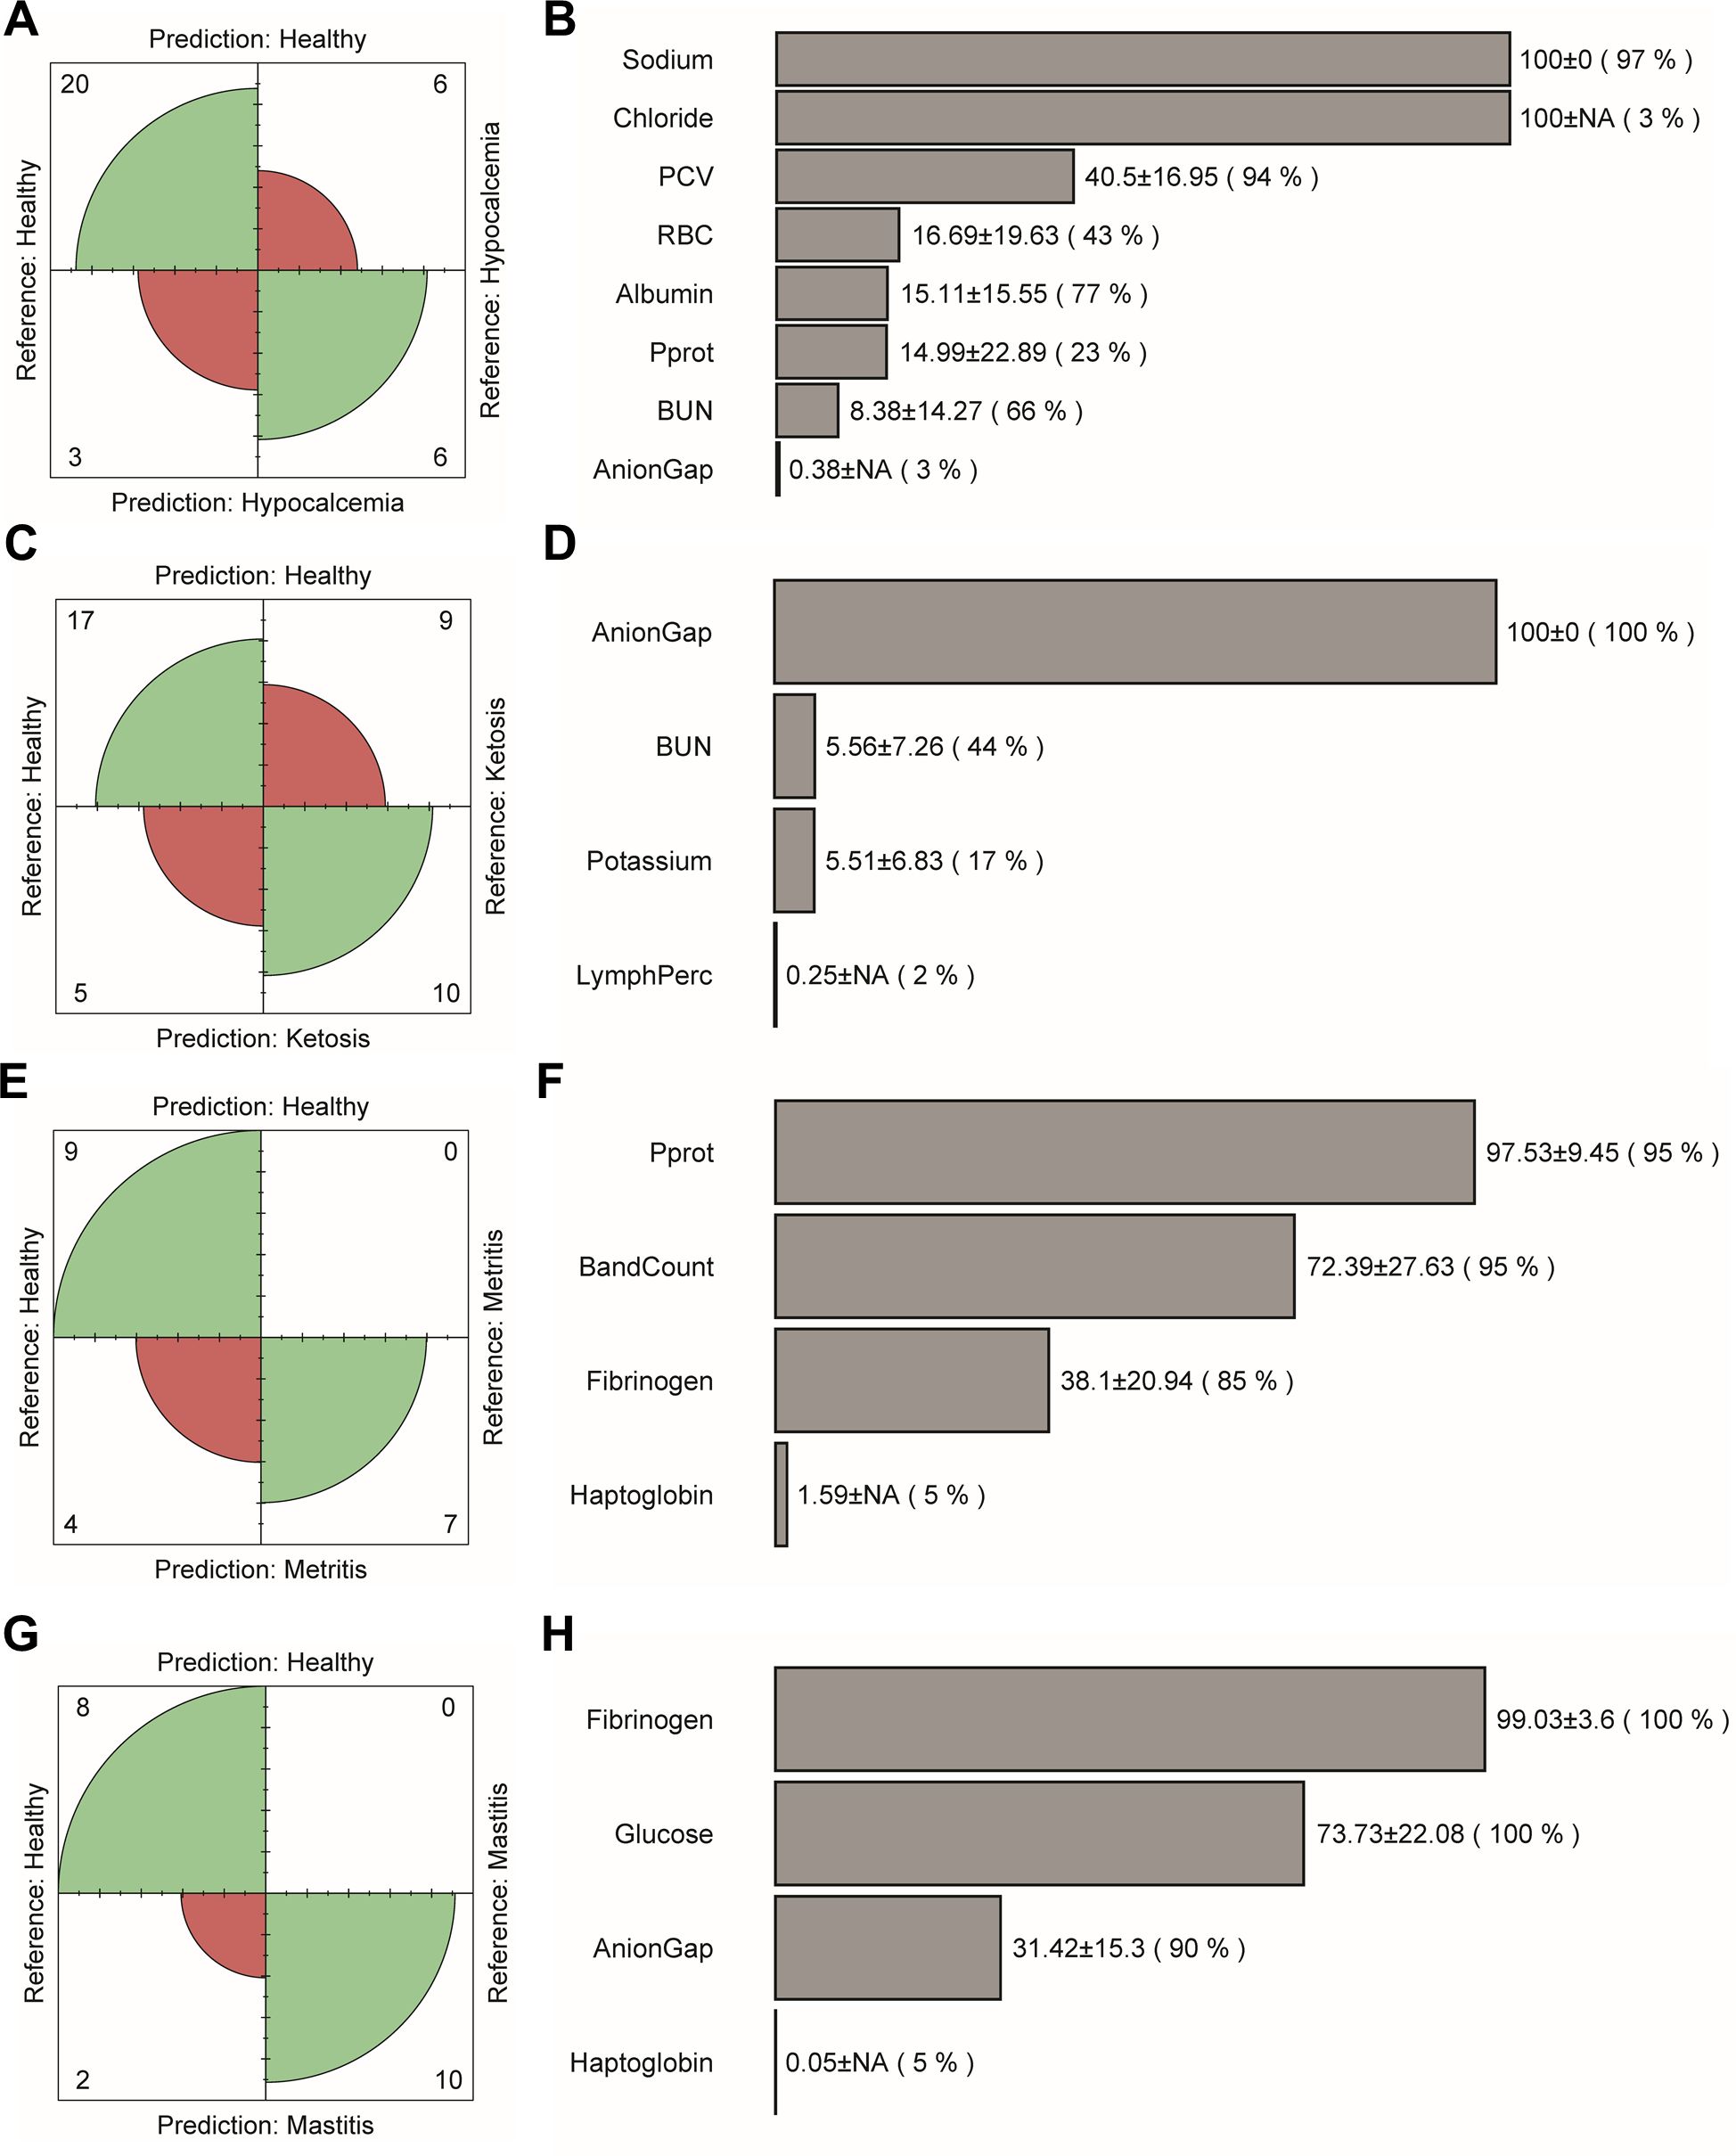
Figure 3. Confusion matrix and the disease-specific selected features. (A, B) Healthy – hypocalcemia, (C, D) healthy – ketosis, (E, F) healthy – metritis, and (G, H) healthy – mastitis groups. The extent of the grayscale representing selected features highlights the relative differences in the mean importance score with mean importance and its standard deviation presented by its side and frequency of selection presented in the parentheses.
The selected features for distinguishing between healthy and hypocalcemic cows included biochemical and blood electrolyte parameters (sodium, chloride, anion gap, BUN), protein level (albumin, Pprot), and red blood cell parameters (RBC, PCV). However, the importance scores and frequency of selection varied greatly across cross-validation runs (LOOCV = 35) (Figure 3B). In the healthy – ketosis comparison, the final selected features differed despite using the same set of features and the same healthy group (Figure 3D). Anion gap was the most important feature, consistently selected across all cross-validation runs (LOOCV = 41). Potassium and BUN levels were the next important features. Both had similar average importance scores (normalized score ~5.5). However, BUN was selected more frequently than potassium level. LymphPerc was selected only once across the 41 runs. For the healthy – metritis groups, three out of four selected features were associated with complete blood count parameters (white blood cell and platelet) (Figure 3F). Although haptoglobin concentrations were expressed differently between the two groups, this feature was selected only once in 20 LOOCV runs. For the healthy-mastitis groups, fibrinogen was the most important feature, followed by glucose, anion gap and haptoglobin (Figure 3H).
3.4 Cumulative health measure
We computed cumulative health measures, which potentially represent summary disability weight measures. The value and pattern of these measures varied across groups, depending on the selected features. The healthy group showed lower cumulative health measure values compared to the hypocalcemia and ketosis groups (Figure 4A, Boxplots of raw data in Supplementary Figures S1, S2). This trend persisted in comparisons between healthy and mastitis groups, even during the follow-up measurements (TP 2 and TP 3) (Figure 4C, Boxplots of raw data in Supplementary Figure S3). However, in dataset 2, cumulative health measure values were not consistent across time points and showed greater variability between healthy and metritis groups (Figure 4B, Boxplots of raw data in Supplementary Figure S3). One possible explanation for this finding is the high variability of the original features used to compute the cumulative health measure. Haptoglobin concentrations, in particular, varied greatly within groups and across time points (Supplementary Figure S4).
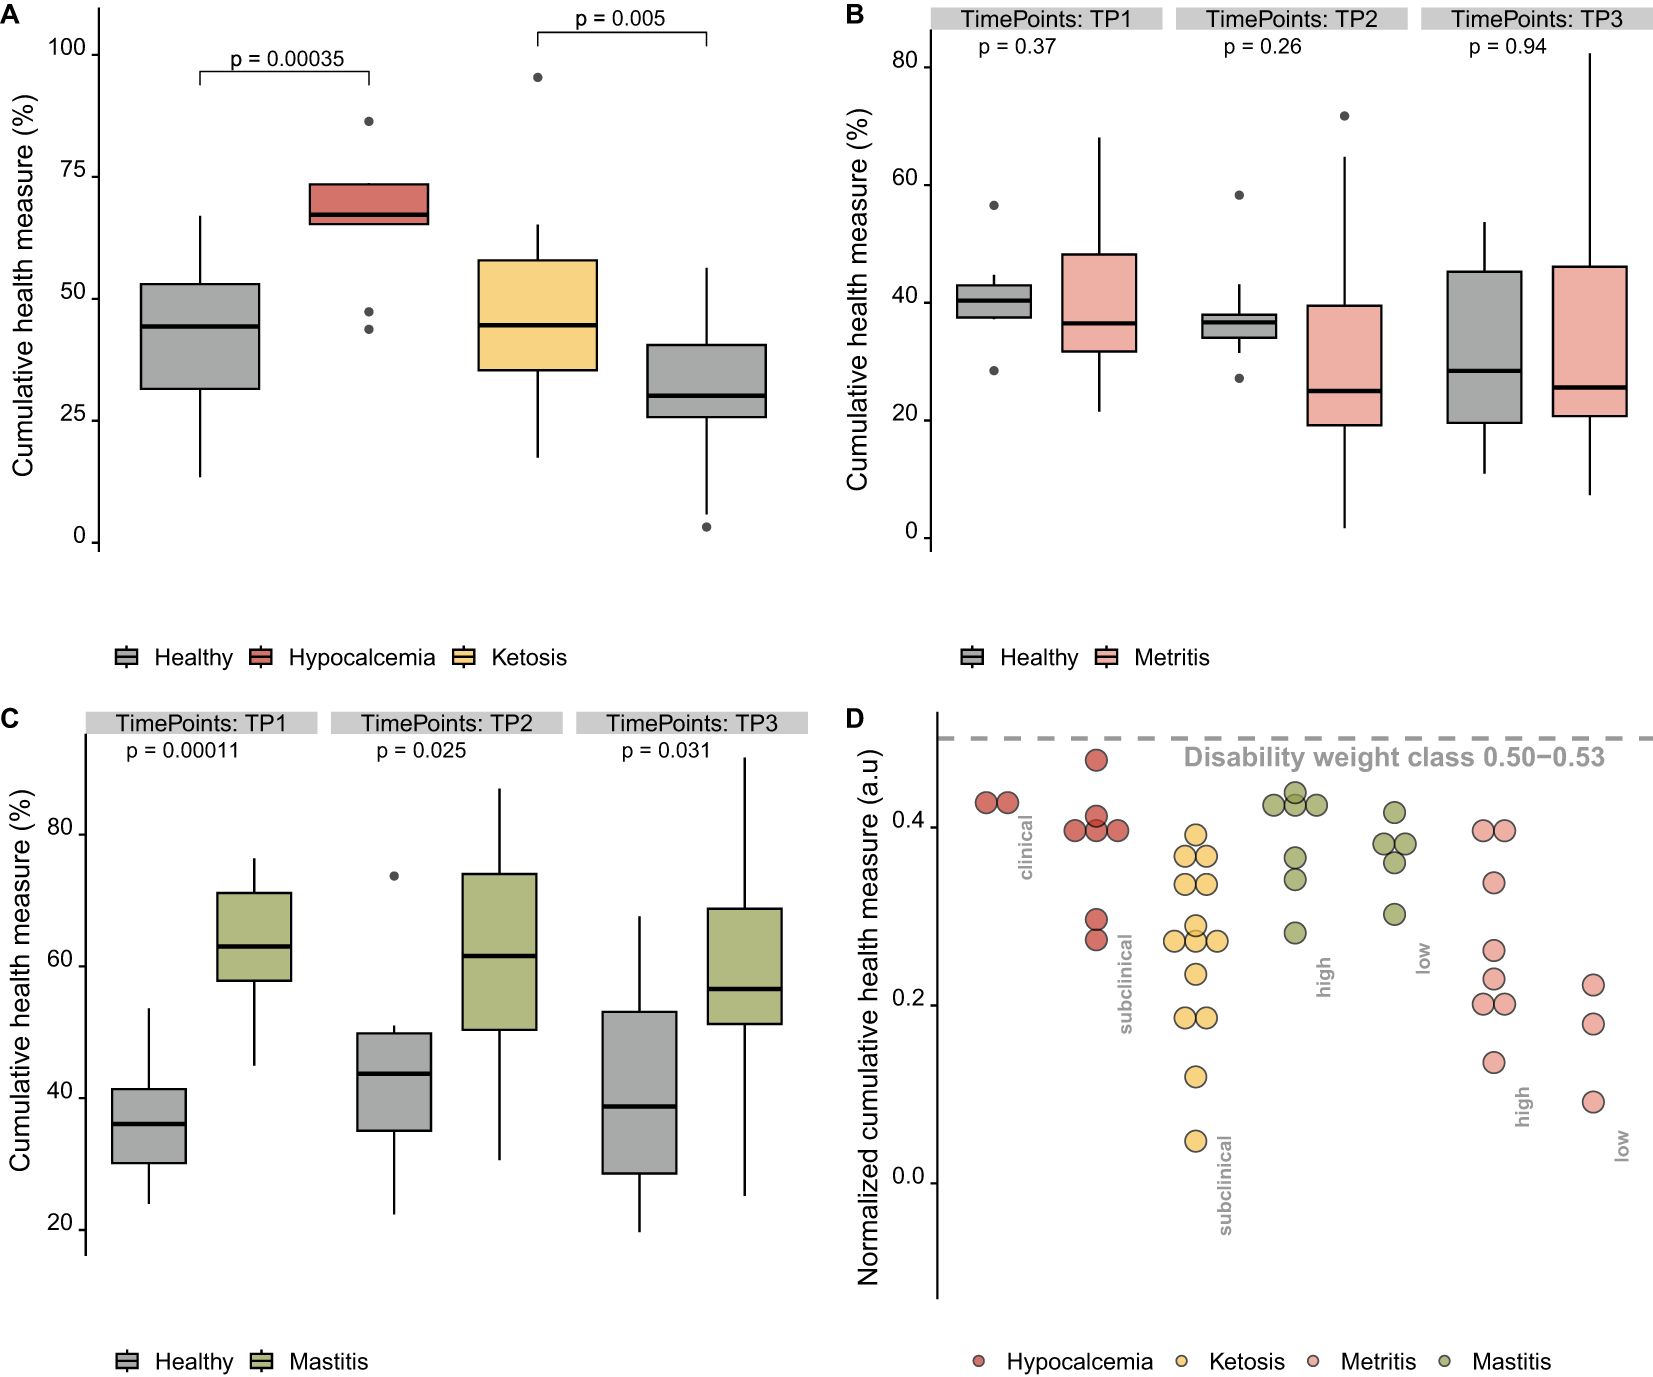
Figure 4. Variation of cumulative health measure data between groups and across time points. (A) Cumulative health measures of dataset 1, (B) cumulative health measures of dataset 2, (C) cumulative health measures of dataset 3, and (D) normalized cumulative health measure data.
The normalized cumulative health measure, which reflects the disease burden as the gap between a diseased group and a reference healthy group, was calculated by normalizing each individual cow’s values in the diseased group by the minimum and maximum values of their corresponding healthy group. This derived feature (Table 5) showed a similar ranking of disease severity across the four conditions when compared to the expert opinion-derived disability weight classes developed by (McConnel et al., 2017). The higher mean and median values of the normalized cumulative health measures for hypocalcemia and mastitis (0.38–0.40) align with their classification as more severe conditions (Table 5). In contrast, ketosis and metritis had lower values (0.22–0.28), consistent with lower disability weights (Table 5). However, the normalized health measure did not show distinct patterns differentiating disease severity classes (high vs. low) or stages (clinical vs. subclinical), as observed in Figure 4D.
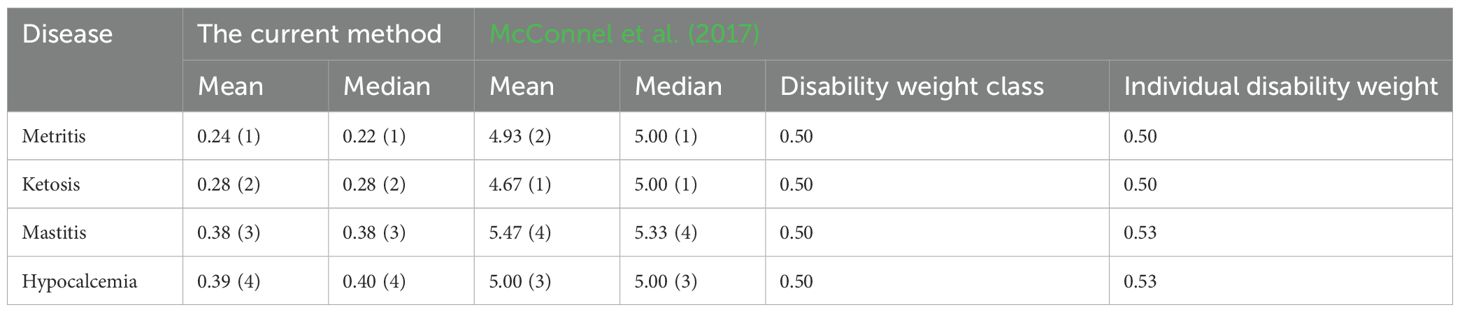
Table 5. Mean and median normalized cumulative health measure and reported disability weight.
3.5 Integration with gene expression and behavioral data
Several gene expression levels were correlated with pathophysiological data associated with mastitis (Spearman coefficient: 0.47 ≤ |ρ| ≤ 0.83; P < 0.05) and metritis (Spearman coefficient: 0.47 ≤ |ρ| ≤ 0.80; P < 0.05) (Supplementary Figures S5, S6). Specifically, the expression of levels of CATHL6, IL17D, LCN2, and PGLYRP1 were either negatively or positively correlated (P < 0.05) with the cumulative health measure representing healthy – mastitis groups and/or with the corresponding pathophysiological features (fibrinogen, glucose, anion gap, and haptoglobin) (Figure 5A and Supplementary Figure S5). In contrast, no genes showed significant correlations with the cumulative health measure for the healthy-metritis groups (Figure 5B). However, gene expression levels of LCN2, PGLYRP1, KCNJ16, CATHL6, and KLRF2 were correlated with the individual pathophysiological features (band count, fibrinogen, haptoglobin, and Pprot) (Supplementary Figure S6).
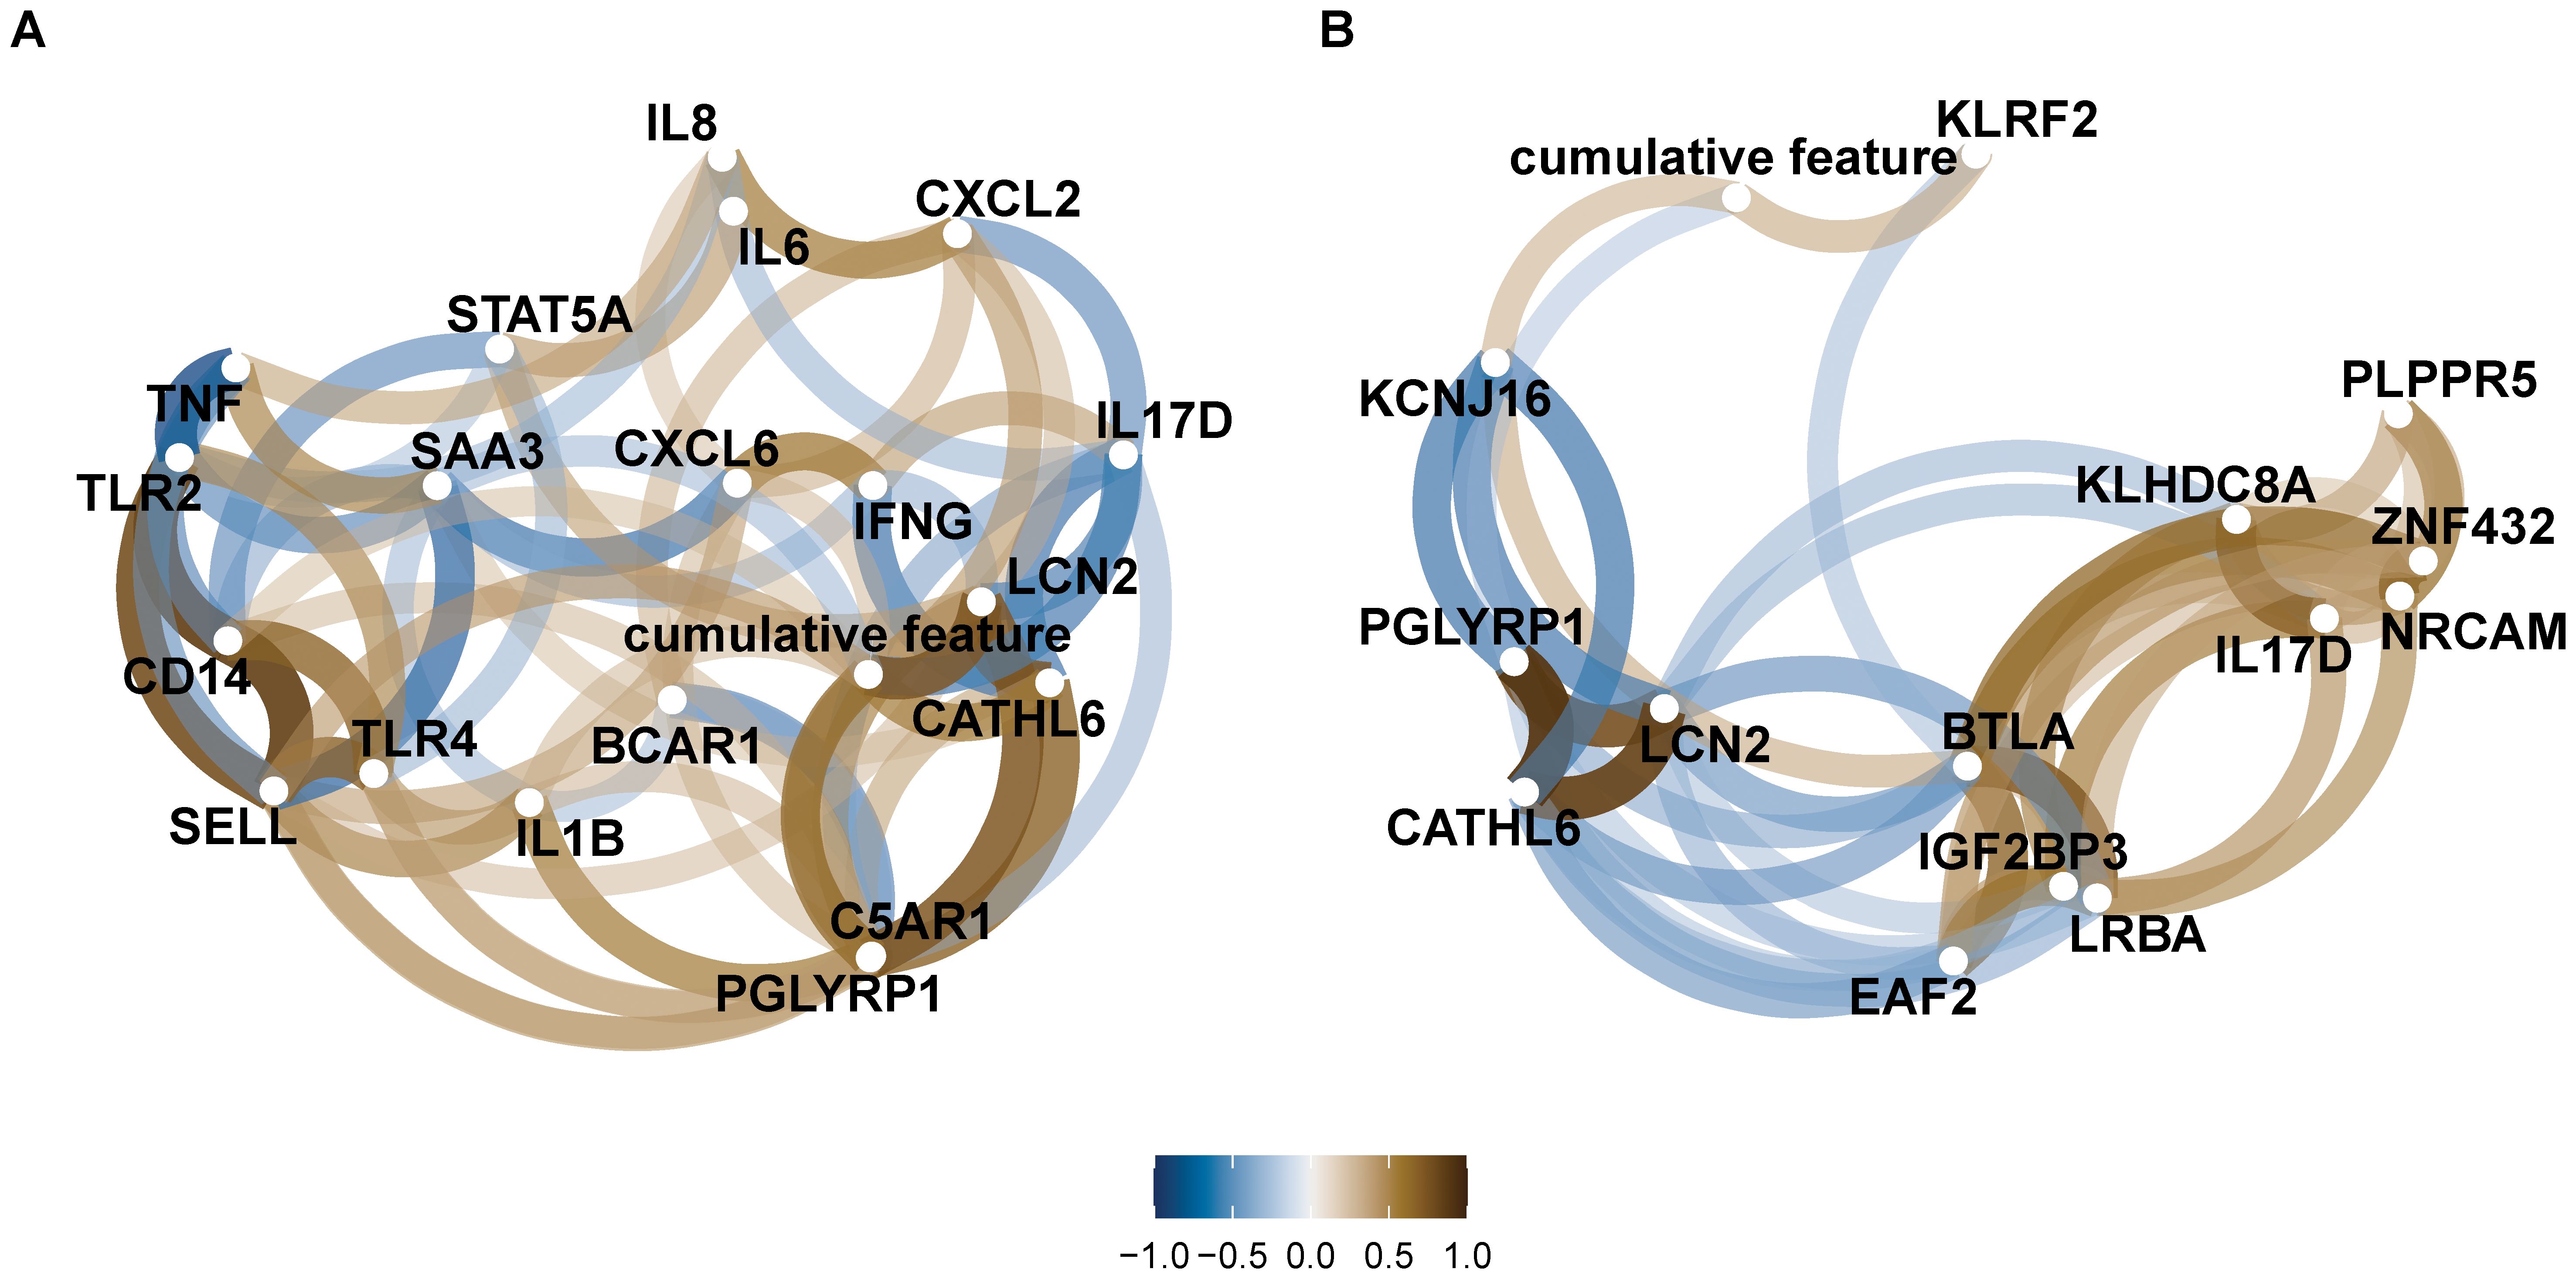
Figure 5. Networks of pairwise correlations between pathophysiological features for each healthy – disease category. (A) Correlation between features in dataset 3 (healthy = 8 samples and mastitis = 10 samples), and (B) correlation between features in dataset 2 (healthy = 9 samples and metritis = 11 samples).
The integration of gene expression data with pathophysiological data influenced the performance of classification models for distinguishing between healthy – mastitis and healthy – metritis groups. For healthy – mastitis classification, model accuracy declined when trained solely with gene expression data (Table 6 and Figure 6A). Of the 19 genes included, only nine were selected during model training (Figure 6B). Re-training the model with both gene and pathophysiological data did not improve the classification accuracy (AUC = 0.91, Sensitivity/Specificity = 0.78/1.00, Table 6). The integration of genes reported in McConnel et al. (2020b) with pathophysiological data yielded similar results (Supplementary Table S6).
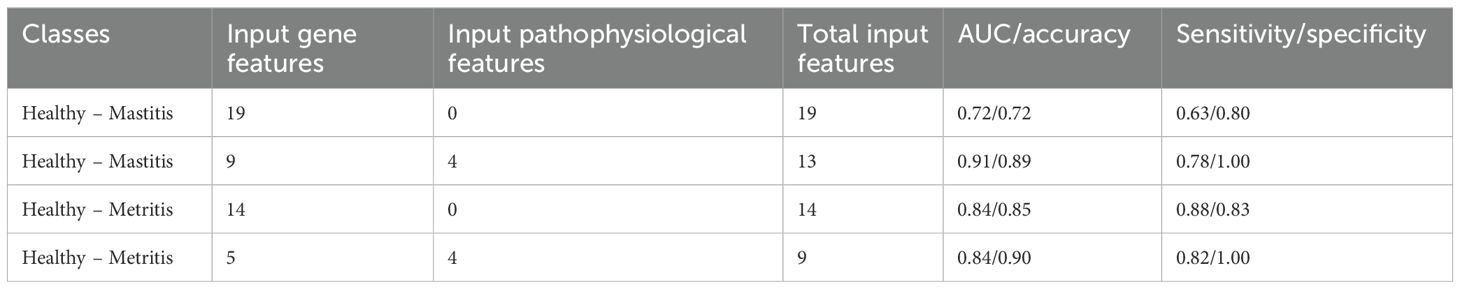
Table 6. Model performance during classification of different disease groups trained with gene features or combined with pathophysiological features.
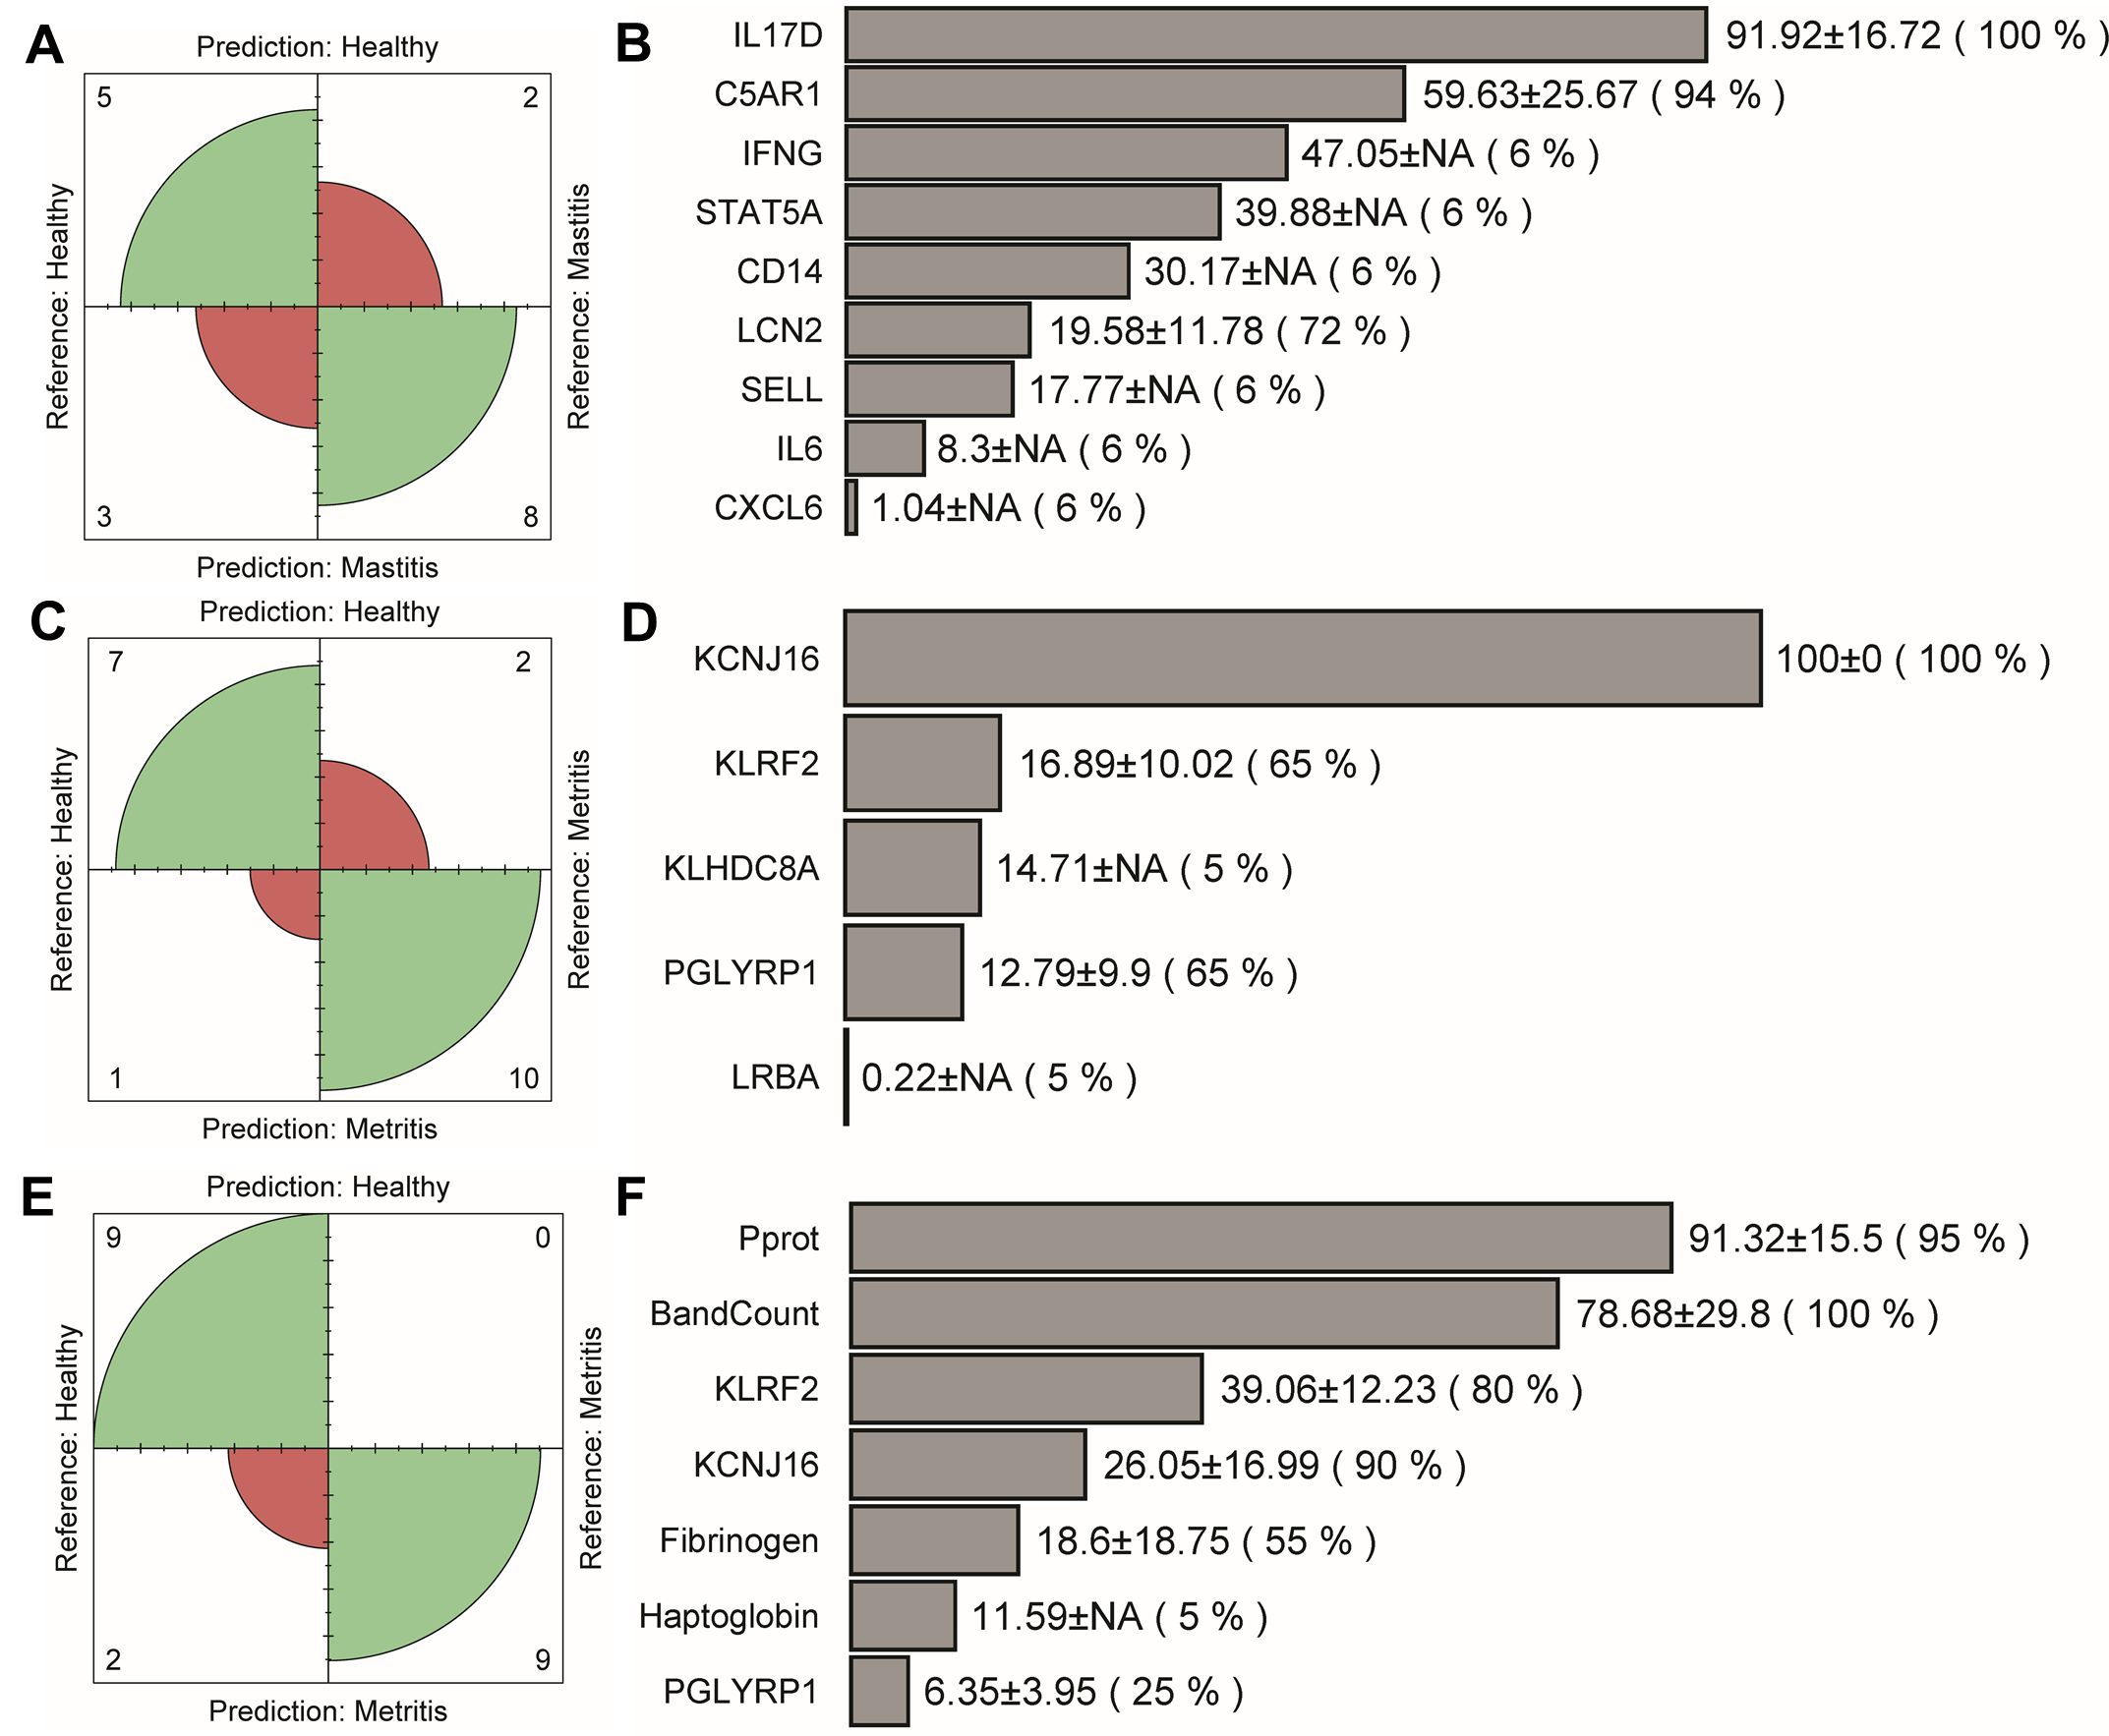
Figure 6. Confusion matrix and the final selected features. (A, B) Healthy – mastitis: model trained with all gene expression data, (C, D) healthy – metritis: model trained with all gene data, and (E, F) healthy – metritis: model trained with selected gene and pathophysiological data.
In the case of healthy – metritis classification, the performance slightly improved when gene expression data were used (Table 6; Supplementary Table S6; Figures 6C, E). The best accuracy was achieved by combining gene expression and pathophysiological data. Of the 14 genes used, five were selected during model training (Figure 6D). Among these, only three genes (PGLYRP1, KCNJ16, and KLRF2) were consistently selected when both data types were integrated (Figure 6F).
Regarding the behavioral data, we examined the normalized average daily activities prior to the initial sampling period. Their correlations with the cumulative health measure for mastitis and the PCA analysis of these features are shown in Figures 7, 8. The average daily behavior patterns were similar between the three dates (Figure 7). However, only the average time spent per hour (min/h) on rumination and being active differed between healthy and mastitis groups on the day prior to disease diagnosis. This pattern can also be observed in the biplots (Figure 8B). Zambelis et al. (2019) reported that the correlation between sensor data and visual observations was the lowest for eating behavior compared to rumination and activity levels. Behavior features one day prior to diagnosis showed better discrimination between healthy and mastitis groups, though they did not distinguish between severity classes (high and low mastitis). In addition, the correlation between behavior and cumulative health measure was also stronger one day prior to diagnosis (Figure 8A).
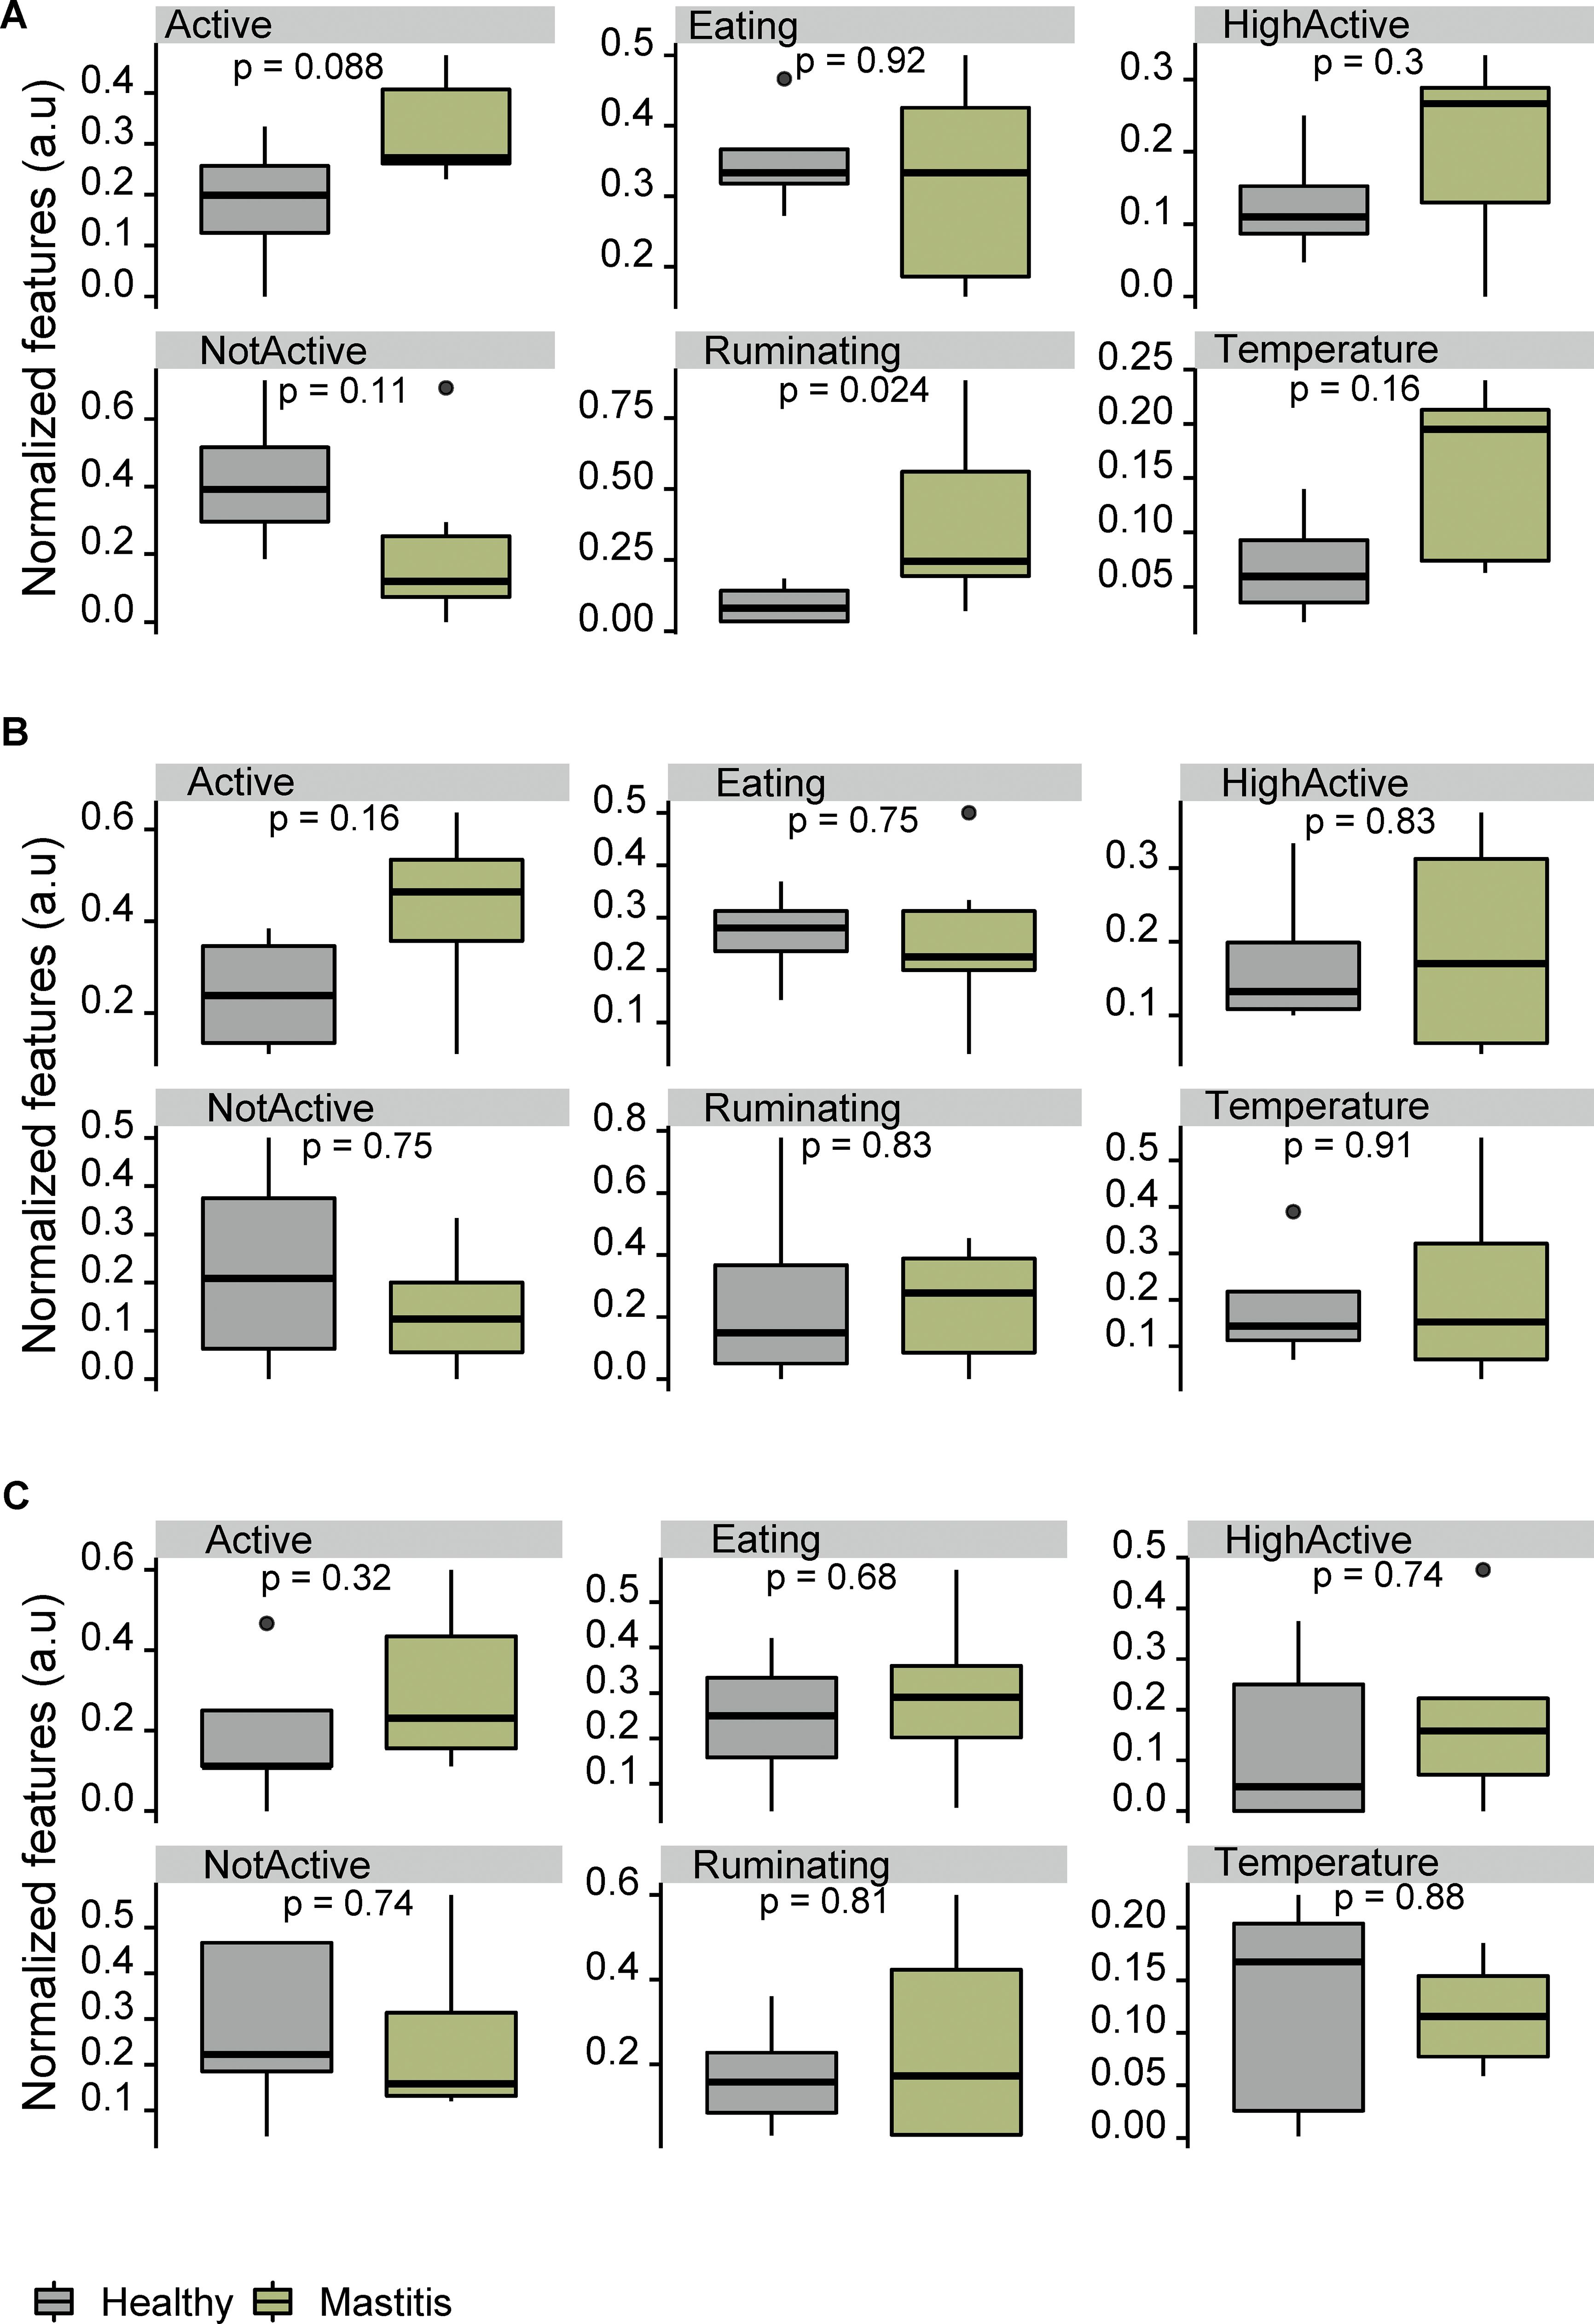
Figure 7. Variation of normalized daily behavior activities and ear temperature between healthy and mastitis groups. (A–C) Data at 1, 2, and 3 days prior to TP1, respectively.
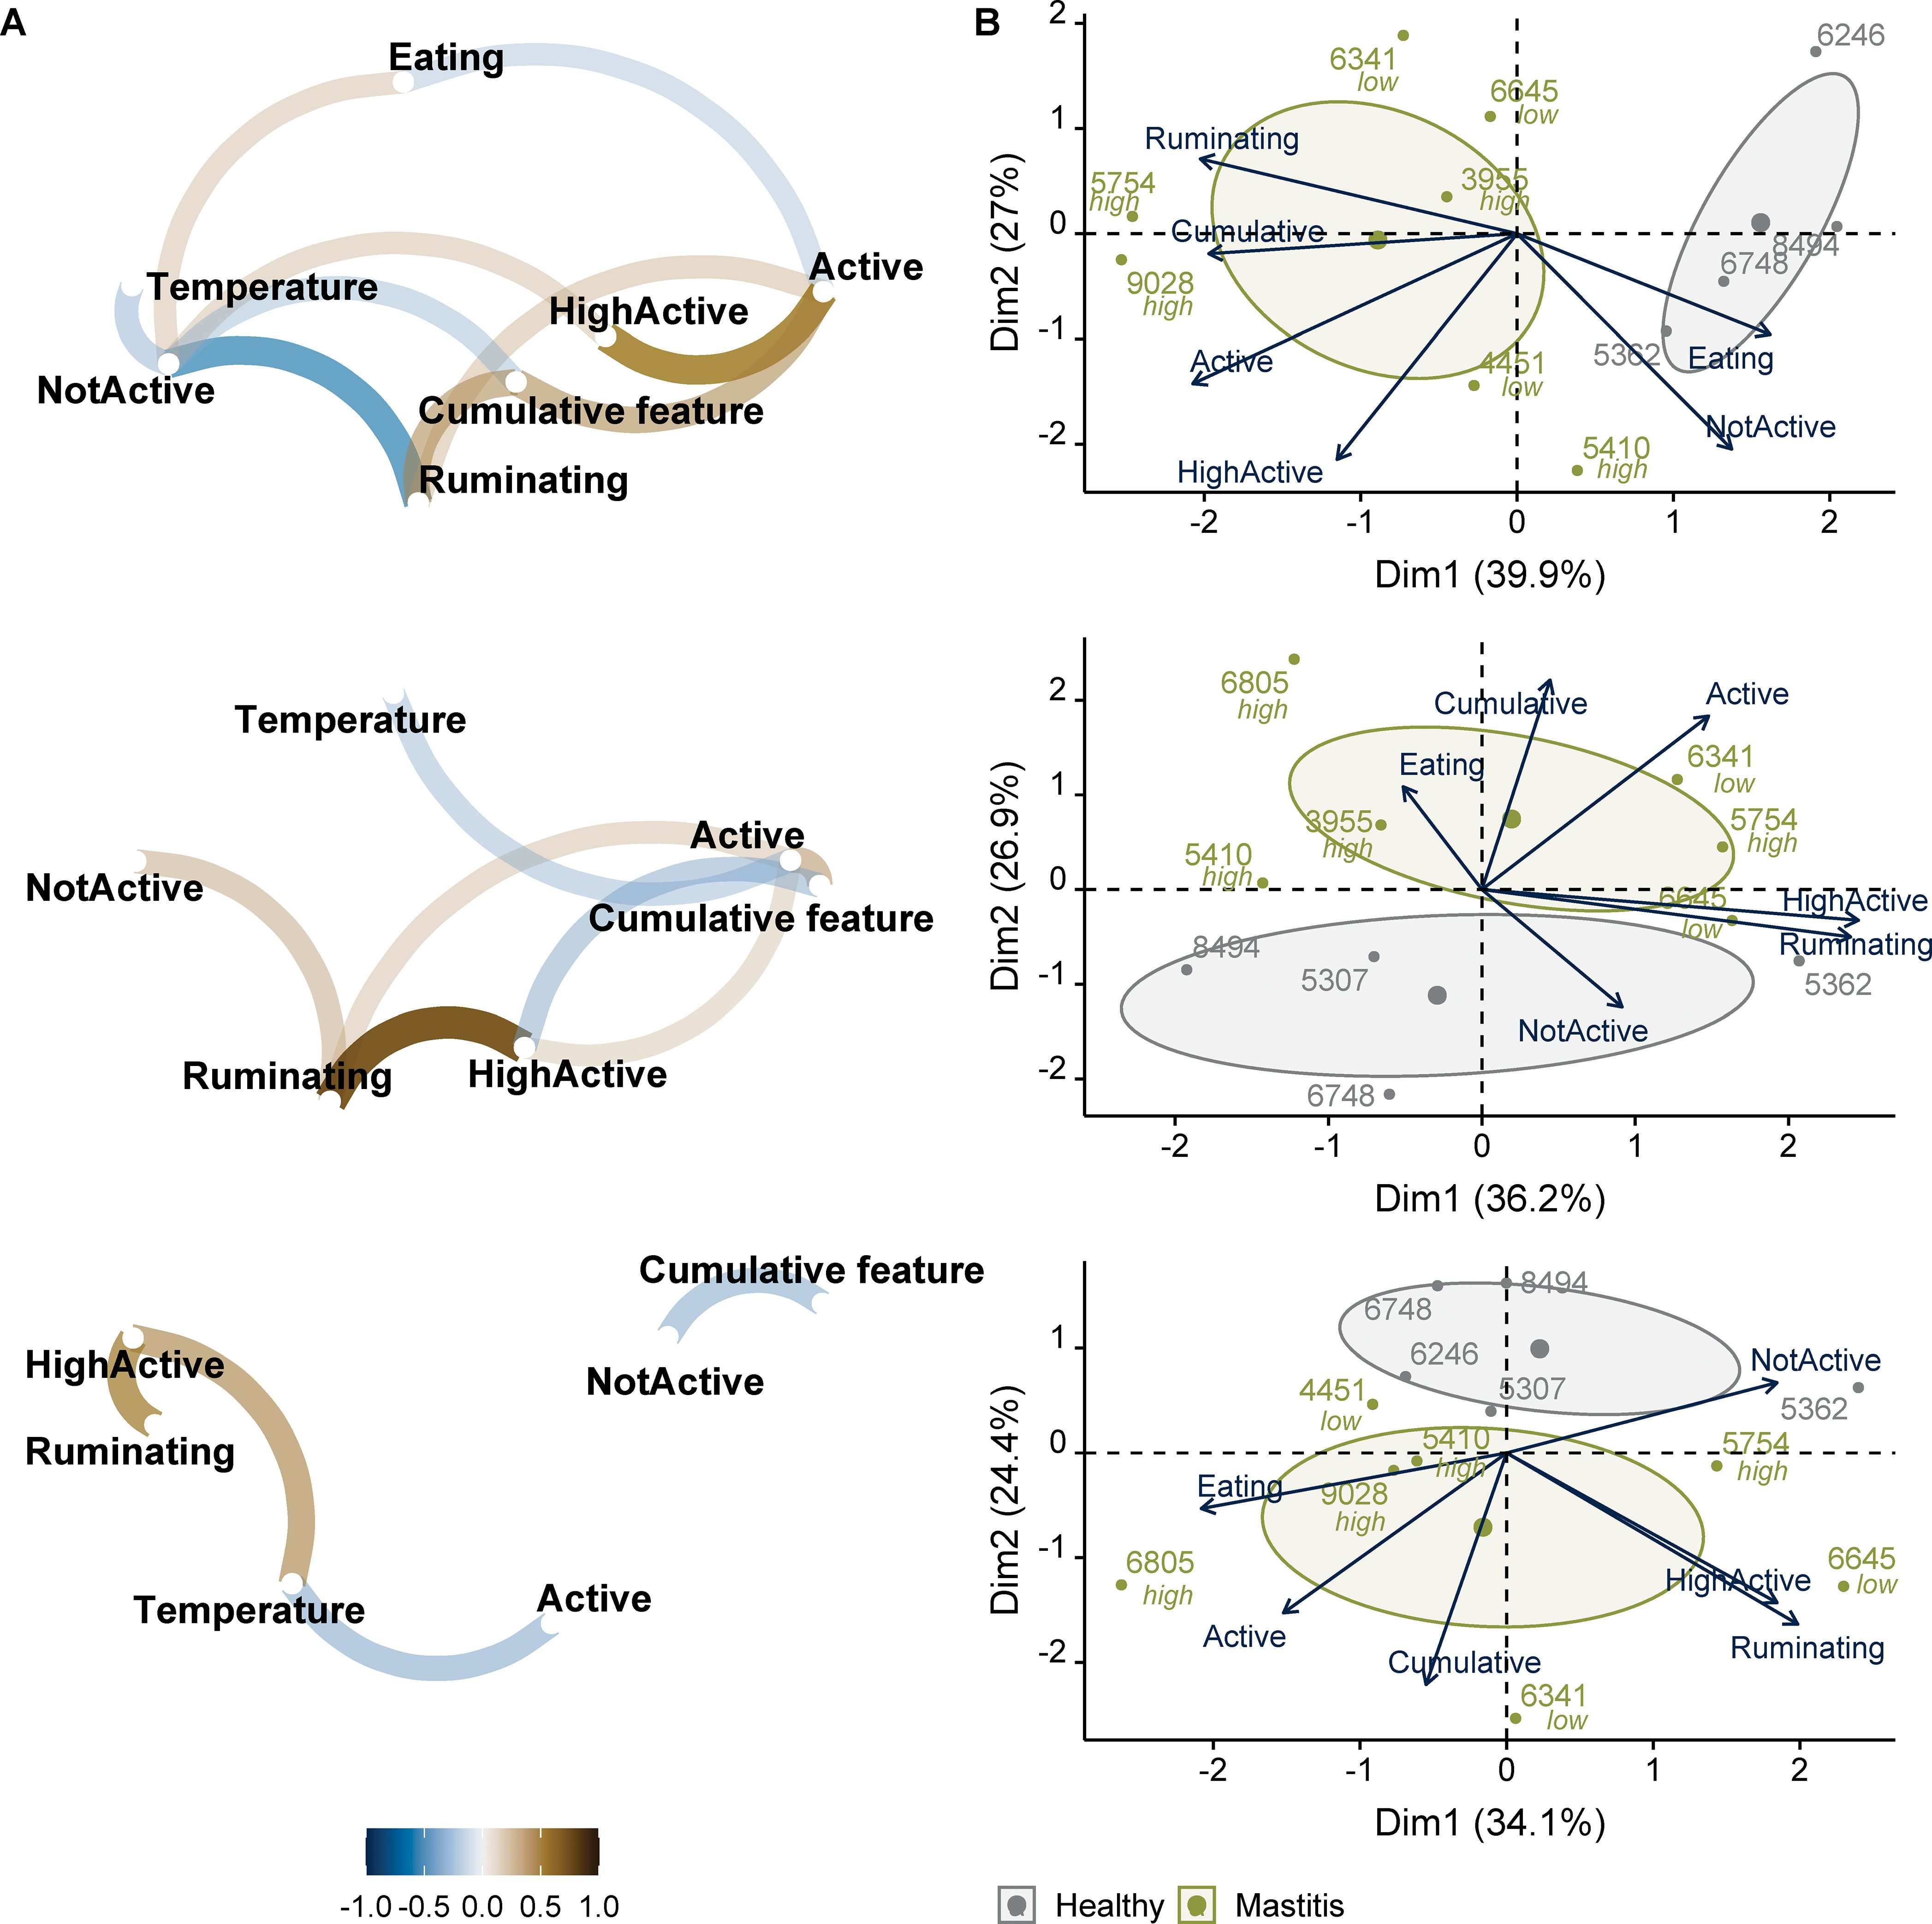
Figure 8. Normalized daily behavior activities, ear temperature, and their association with cumulative health measure in the mastitis dataset. (A) Correlation network between behavior features, ear temperature, and cumulative health measure computed at TP1, and (B) biplot based on behavior and cumulative health measure in healthy and mastitis groups. Low and high represent the severity class of mastitis. From top to bottom, behavior features represent −1, −2, and −3 days prior to TP1.
4 Discussion
In this study, we investigated the association between pathophysiological data in dairy cattle with hypocalcemia, ketosis, mastitis, and metritis to estimate a summary measure of health status using a machine learning approach. Previous studies have used disability weights to assess disease severity in terms of its impact on cows’ health and milk production, based on expert ratings (McConnel et al., 2017, 2018). Here, we extended this concept by developing a more detailed summary health measure that accounts for variability in pathophysiological data. Our approach involved feature selection to identify key indicators of disease, which were used in classification models to create a disease-specific composite score or cumulative health measure representing overall health status for each individual cow.
The classification models achieved accuracies ranging from 66 to 92%, with sensitivity and specificity values between 0.77/0.53 to 0.80/1.00. For example, a previous study reported lower accuracies (F1 score) when identifying hypocalcemic cows (0.265 ± 0.051 to 0.548 ± 0.064); ketotic cows (0.159 ± 0.047 to 0.606 ± 0.050), metritic cows (0.171 ± 0.084 to 0.550 ± 0.143), and mastitic cows (F1 score of 0.51) using the dairy herd improvement (DHI) assessment data (e.g., age, lactation stage, milk indicators, etc.) across over 22,000 observations (Lasser et al., 2021). Other studies using non-blood tests to predict ketosis reported that a logistic regression model trained on features such as fat-to-protein ratio, acetone and BHB concentrations in milk, lactose percentage, lactation number and DIM achieved a sensitivity of ~0.74 and specificity of ~0.76 (Satoła and Bauer, 2021). Although direct comparisons are difficult due to differences in features and sample sizes, these findings highlight the importance of combining milk and blood data for diagnostics.
Low accuracy in classifying healthy and hypocalcemic cows could be attributed to differences in DIM at the initial sampling period, clinical stages (subclinical and clinical), and the seasonal effects (summer vs winter). In the ketosis group, all enrolled cows had subclinical ketosis, yet the model performance was weak, with high rates of false positives and false negatives. Specifically, 35% of healthy cases were misclassified as ketotic, while 33% of ketotic cows were misclassified as healthy. The probability differences between misclassified cases were small (mean ±1 standard deviation; 0.06 ± 0.06 for truehealthy → predictedketosis; 0.11 ± 0.11 for trueketosis → predictedhealthy). This suggests similarities between healthy cows and those with subclinical ketosis, particularly after excluding BHB, calcium, and glucose from the model. Variability in disease history (e.g., prior illnesses) may also have contributed to classification errors. Designing experiments with uniform groups is challenging, especially in field studies where cows may have different health histories and environmental exposures. Controlling for confounding factors and including them in the model can improve accuracy, but this requires larger and more balanced sample size. In our dataset, the samples were skewed towards healthy cows compared to diseased ones, particularly in the ketosis and hypocalcemia groups. Addressing this imbalance and increasing the number of samples per class may help enhance model performance.
The biological interpretation of selected features provides additional insights into the underlying mechanisms of diseases. For mastitis and metritis groups, the identified features were linked to immune responses, as both diseases involve infection and inflammation. Haptoglobin, identified as a key feature in our analysis, was reported to be an indicator of mastitis (Huzzey et al., 2009). These findings were further confirmed with the results of feature selection when models were trained with gene expression and pathophysiological data. The selected genes were found to be associated with immune response (McConnel et al., 2020a, b). Incorporating gene expression data alongside pathophysiological data improved the overall model performance, especially for healthy – metritis groups. In contrast, none of the selected features have been directly reported as indicators of hypocalcemia in the literature. Interestingly, albumin was found to be positively correlated with calcium, which was unexpected given that calcium typically binds to albumin (Ott et al., 2021). This could be an artifact of the model or reflect variability in the calcium–albumin relationship among cows. In our study, sodium and chloride (selected features) were correlated with each other but showed no correlation with the anion gap. To our knowledge, no prior studies have linked changes in these ions with hypocalcemia in cattle, suggesting a need for further investigation. Our use of Lasso regularization helped identifying key features that differentiate health and disease states, but its tendency to select only one feature from a group of highly correlated features may have influenced the selection process. This could explain why certain features, such as sodium and chloride, were chosen over others. To account for this limitation, we incorporated the occurrence of selected features when calculating the cumulative health measure. Future studies could explore alternative feature selection methods.
The cumulative health measure provided an objective estimate of disease burden across different conditions. The ranking of diseases based on this measure was consistent with previously established disability weights. Future studies should consider adding a time component, such as monitoring the rate of change in the cumulative health measure over multiple time points to better capture disease dynamics. Differentiating between severity classes was not possible with our current datasets, likely due to limited sample sizes within each diseased – healthy group. Future studies should attempt to increase the number of samples per class and integrate different types of data that could capture the nuances between samples.
Behavioral data analysis showed that cows with mastitis could be distinguished from healthy cows when combining behavior metrics one day before diagnosis with cumulative health measure. Previous behavior studies linked changes in lying time and feed intake to mastitis, typically observed 3–5 days before diagnosis (Sepúlveda-Varas et al., 2016). As with the pathophysiological data, a larger sample size is needed for robust recognition of behavior patterns and their potential integration with pathophysiological and other omics datasets such as gene expression/transcriptomics data. In this study, we did not anticipate environment and dairy farm conditions to affect the sampling and associated metrics as the cows were from the same dairy farm receiving similar water and feed ratios; nevertheless, differences may be anticipated across different dairy farms, which needs to be investigated further.
5 Summary
In this study, we provide a novel approach to compute a summary disability weight measure of the health status of dairy cattle using pathophysiologic data that can indicate the effect of specific diseases of dairy cattle and their impact at the individual cow level. We evaluated this approach on four common dairy cattle diseases and examined the relationships between pathophysiological data by comparing between healthy and diseased cows. We generated a cumulative health measure as a distinct score for each disease. Such a score can be used to compare health status between diseases. Future studies will validate this approach with larger herd sizes and incorporate a time component to account for disease duration and the associated cumulative health loss. Moreover, integrating behavioral and gene expression data could further enhance the robustness of this measure, especially with larger sample sizes and data from multiple dairy farms. While this approach may currently require substantial time, effort, and costs, focused research using extensive datasets could provide a more comprehensive understanding of disease impacts on dairy cattle.
Data availability statement
The raw data supporting the conclusions of this article will be made available by the authors, without undue reservation.
Ethics statement
The animal study was approved by Institutional Animal Care and Use Committee of Washington State University (20 October 2017, ASAF#05061). The study was conducted in accordance with the local legislation and institutional requirements.
Author contributions
AM: Conceptualization, Investigation, Data curation, Methodology, Formal Analysis, Software, Validation, Writing – original draft. CM: Conceptualization, Data curation, Funding acquisition, Investigation, Methodology, Resources, Supervision, Writing – review & editing. AA: Conceptualization, Data curation, Funding acquisition, Investigation, Methodology, Resources, Supervision, Writing – review & editing. TB: Data curation, Writing – review & editing. SF: Conceptualization, Funding acquisition, Investigation, Project administration, Resources, Supervision, Writing – review & editing. SS: Conceptualization, Data curation, Formal analysis, Methodology, Software, Validation, Writing – review & editing.
Funding
The author(s) declare that financial support was received for the research and/or publication of this article. This work was supported by the Washington State University’s College of Veterinary Medicine (CVM) – College of Agricultural, Human, and Natural Resource Sciences (CAHNRS) Livestock Health and Food Security program, and US Department of Agriculture – National Institute of Food and Agriculture (USDA-NIFA) Agriculture and Food Research Initiative (AFRI) Inter-Disciplinary Engagement in Animal Systems (IDEAS) grant (Grant No. 2021-68014-34144).
Acknowledgments
We thank the participating dairies and associated personnel for their invaluable assistance with this project. In addition, we appreciate the help of student assistants, who helped with collecting and processing the samples.
Conflict of interest
The authors declare that the research was conducted in the absence of any commercial or financial relationships that could be construed as a potential conflict of interest.
Generative AI statement
The author(s) declare that no Generative AI was used in the creation of this manuscript.
Publisher’s note
All claims expressed in this article are solely those of the authors and do not necessarily represent those of their affiliated organizations, or those of the publisher, the editors and the reviewers. Any product that may be evaluated in this article, or claim that may be made by its manufacturer, is not guaranteed or endorsed by the publisher.
Supplementary material
The Supplementary Material for this article can be found online at: https://www.frontiersin.org/articles/10.3389/fanim.2025.1532385/full#supplementary-material
References
Barkema H. W., von Keyserlingk M. A. G., Kastelic J. P., Lam T. J. G. M., Luby C., Roy J. P., et al. (2015). Invited review: Changes in the dairy industry affecting dairy cattle health and welfare. J. Dairy Sci. 98, 7426–7445. doi: 10.3168/JDS.2015-9377
Bobbo T., Biffani S., Taccioli C., Penasa M., Cassandro M. (2021). Comparison of machine learning methods to predict udder health status based on somatic cell counts in dairy cows. Sci. Rep. 11, 1–10. doi: 10.1038/s41598-021-93056-4
de Oliveira E. B., Ferreira F. C., Galvão K. N., Youn J., Tagkopoulos I., Silva-del-Rio N., et al. (2021). Integration of statistical inferences and machine learning algorithms for prediction of metritis cure in dairy cows. J. Dairy Sci. 104, 12887–12899. doi: 10.3168/JDS.2021-20262
Duffield T. (2000). Subclinical ketosis in lactating dairy cattle. Vet. Clin. North Am. Food Anim. Pract. 16, 231–253. doi: 10.1016/S0749-0720(15)30103-1
Friedman J., Hastie T., Tibshirani R. (2010). Regularization paths for generalized linear models via coordinate descent. J. Stat. Software 33, 1. doi: 10.18637/jss.v033.i01
Fuentes S., Viejo C. G., Cullen B., Tongson E., Chauhan S. S., Dunshea F. R. (2020). Artificial intelligence applied to a robotic dairy farm to model milk productivity and quality based on cow data and daily environmental parameters. Sensors (Switzerland) 20 (10), 2975. doi: 10.3390/s20102975
Gertz M., Große-Butenuth K., Junge W., Maassen-Francke B., Renner C., Sparenberg H., et al. (2020). Using the XGBoost algorithm to classify neck and leg activity sensor data using on-farm health recordings for locomotor-associated diseases. Comput. Electron. Agric. 173, 105404. doi: 10.1016/J.COMPAG.2020.105404
Goff J. P. (2008). The monitoring, prevention, and treatment of milk fever and subclinical hypocalcemia in dairy cows. Vet. J. 176, 50–57. doi: 10.1016/J.TVJL.2007.12.020
Gomes F., Henriques M. (2015). Control of bovine mastitis: old and recent therapeutic approaches. Curr. Microbiol. 724 72, 377–382. doi: 10.1007/S00284-015-0958-8
Huntington B., Bernardo T., Rushton J., Allen P. G. (2021). Global Burden of Animal Diseases: a novel approach to understanding and managing disease in livestock and aquaculture. Sch. Rev. Sci. Tech. Off. Int. Epiz 40, 16. doi: 10.20506/rst.40.2.3246
Huzzey J. M., Duffield T. F., LeBlanc S. J., Veira D. M., Weary D. M., Von Keyserlingk M. A. G. (2009). Short communication: Haptoglobin as an early indicator of metritis. J. Dairy Sci. 92, 621–625. doi: 10.3168/JDS.2008-1526
Kuhn M. (2008). Building predictive models in R using the caret package. J. Stat. Soft. 28, 1–26. doi: 10.18637/jss.v028.i05
Kuhn M., Jackson S., Cimentada J. (2020). CORR: correlations in R. R package v.0.4.3. doi: 10.32614/CRAN.package.corrr
Lasser J., Matzhold C., Egger-Danner C., Fuerst-Waltl B., Steininger F., Wittek T., et al. (2021). Integrating diverse data sources to predict disease risk in dairy cattle-a machine learning approach. J. Anim. Sci. 99, 1–14. doi: 10.1093/jas/skab294
Lê S., Josse J., Husson F. (2008). FactoMineR: An R Package for Multivariate Analysis. Journal of Statistical Software. 25(1). doi: 10.18637/jss.v025.i01
Matzhold C., Schodl K., Klimek P., Steininger F., Egger-Danner C. (2024). A key-feature-based clustering approach to assess the impact of technology integration on cow health in Austrian dairy farms. Front. Anim. Sci. 5. doi: 10.3389/fanim.2024.1421299
McConnel C. S., Crisp S. A., Biggs T. D., Ficklin S. P., Parrish L. M., Trombetta S. C., et al. (2020b). A fixed cohort field study of gene expression in circulating leukocytes from dairy cows with and without mastitis. Front. Vet. Sci. 7. doi: 10.3389/FVETS.2020.559279
McConnel C., Crisp S., Biggs T., Parrish L., Sischo W., Adams-Progar A., et al. (2020a). Transcriptomic analysis of peripheral leukocytes in dairy cows with and without evidence of metritis and associated early postpartum disease. Appl. Anim. Sci. 36, 784–798. doi: 10.15232/AAS.2020-02092
McConnel C. S., McNeil A. A., Hadrich J. C., Lombard J. E., Garry F. B., Heller J. (2017). Dairy cow disability weights. Prev. Vet. Med. 143, 1–10. doi: 10.1016/j.prevetmed.2017.04.014
McConnel C. S., McNeil A. A., Hadrich J. C., Lombard J. E., Heller J., Garry F. B. (2018). A comparison of a novel time-based summary measure of dairy cow health against cumulative disease frequency. Ir. Vet. J. 71, 1–14. doi: 10.1186/s13620-018-0119-z
McLennan K. M. (2018). Why pain is still a welfare issue for farm animals, and how facial expression could be the answer. Agriculture 8, 127. doi: 10.3390/agriculture8080127
Ott D., Schrapers K. T., Aschenbach J. R. (2021). Changes in the relationship between ionized and total calcium in clinically healthy dairy cows in the period around calving. Anim 11, 1036. doi: 10.3390/ANI11041036
Raboisson D., Ferchiou A., Pinior B., Gautier T., Sans P., Lhermie G. (2020). The use of meta-analysis for the measurement of animal disease burden: losses due to clinical mastitis as an example. Front. Vet. Sci. 7. doi: 10.3389/fvets.2020.00149
Riaboff L., Poggi S., Madouasse A., Couvreur S., Aubin S., Bédère N., et al. (2020). Development of a methodological framework for a robust prediction of the main behaviours of dairy cows using a combination of machine learning algorithms on accelerometer data. Comput. Electron. Agric. 169, 105179. doi: 10.1016/j.compag.2019.105179
Satoła A., Bauer E. A. (2021). Predicting subclinical ketosis in dairy cows using machine learning techniques. Anim 11, 2131. doi: 10.3390/ANI11072131
Sepúlveda-Varas P., Proudfoot K. L., Weary D. M., von Keyserlingk M. A. G. (2016). Changes in behaviour of dairy cows with clinical mastitis. Appl. Anim. Behav. Sci. 175, 8–13. doi: 10.1016/J.APPLANIM.2014.09.022
Sheldon I. M., Lewis G. S., LeBlanc S., Gilbert R. O. (2006). Defining postpartum uterine disease in cattle. Theriogenology 65, 1516–1530. doi: 10.1016/J.THERIOGENOLOGY.2005.08.021
Shine P., Murphy M. D. (2021). Over 20 years of machine learning applications on dairy farms: A comprehensive mapping study. Sensors 22, 52. doi: 10.3390/S22010052
Sturm V., Efrosinin D., Öhlschuster M., Gusterer E., Drillich M., Iwersen M. (2020). Combination of sensor data and health monitoring for early detection of subclinical Ketosis in dairy cows. Sensors (Switzerland) 20, 1–19. doi: 10.3390/s20051484
Temple D., Manteca X. (2020). Animal welfare in extensive production systems is still an area of concern. Front. Sustain. Food Syst. 4. doi: 10.3389/FSUFS.2020.545902/BIBTEX
Venjakob P. L., Borchardt S., Thiele G., Heuwieser W. (2016). Evaluation of ear skin temperature as a cow-side test to predict postpartum calcium status in dairy cows. J. Dairy Sci. 99, 6542–6549. doi: 10.3168/JDS.2015-10734
Wagner N., Antoine V., Mialon M. M., Lardy R., Silberberg M., Koko J., et al. (2020). Machine learning to detect behavioural anomalies in dairy cows under subacute ruminal acidosis. Comput. Electron. Agric. 170, 105233. doi: 10.1016/j.compag.2020.105233
Keywords: disability weight, pathophysiological data, behavior data, gene expression data, feature selection, disease burden
Citation: Marzougui A, McConnel CS, Adams-Progar A, Biggs TD, Ficklin SP and Sankaran S (2025) Machine learning-derived cumulative health measure for assessing disease impact in dairy cattle. Front. Anim. Sci. 6:1532385. doi: 10.3389/fanim.2025.1532385
Received: 21 November 2024; Accepted: 26 February 2025;
Published: 04 April 2025.
Edited by:
Laura Ozella, University of Turin, ItalyReviewed by:
Riccardo Moretti, University of Turin, ItalyPradip Kumar Das, West Bengal University of Animal and Fishery Sciences, India
Copyright © 2025 Marzougui, McConnel, Adams-Progar, Biggs, Ficklin and Sankaran. This is an open-access article distributed under the terms of the Creative Commons Attribution License (CC BY). The use, distribution or reproduction in other forums is permitted, provided the original author(s) and the copyright owner(s) are credited and that the original publication in this journal is cited, in accordance with accepted academic practice. No use, distribution or reproduction is permitted which does not comply with these terms.
*Correspondence: Sindhuja Sankaran, cy5zYW5rYXJhbkB3c3UuZWR1