
94% of researchers rate our articles as excellent or good
Learn more about the work of our research integrity team to safeguard the quality of each article we publish.
Find out more
ORIGINAL RESEARCH article
Front. Anim. Sci. , 08 November 2024
Sec. Animal Nutrition
Volume 5 - 2024 | https://doi.org/10.3389/fanim.2024.1451266
Introduction: Methane production inhibitors included in feed additives are increasingly used to suppress methane production in the rumen. Most products interact with the rumen microbiome and/or component biochemical pathways that scavenge free hydrogen ions (H+) to make methane (CH4 ). The capacity of these agents to inhibit rumen methane production is determined by the ability of the chemical to block methane production pathways, the amount of agent delivered to the rumen (i.e. the dose) and the absorption, distribution, metabolism and excretion (i.e. the pharmacokinetic) characteristics of the chemical that contribute to removal from the site of action (the rumen). The intrinsic inhibitory capacity of an agent determines the maximum rate of methane suppression. This maximal rate may reduce according to pharmacokinetic effects arising from dose rate and frequency. Most studies of additive methane reduction efficacy use total mixed ration (TMR; with the additive included into the ration) feeding systems and estimate methane reduction (absolute or relative) across a 24-hour period. Few studies report critical pharmacokinetic parameters, making it difficult to extrapolate findings into non-TMR systems (such as grazing) where differing doses and dose frequencies apply.
Methods: We consider the likely behaviour of a rumen-acting oral additive to reduce methane production applying basic pharmacokinetic principles to propose an analytical approach to data from multiple field studies employing different dose rates and dose frequencies to estimate methane suppression responses. This is based upon a logistic transformation of relative efficacy (percentage reduction in methane comparing treatment with control groups) as the dependent variable and includes total dose, dose frequency, quadratic and interaction terms between total dose and dose frequency as independent variables that potentially capture any pharmacokinetic effects on performance. The model was tested using simulation and verified against real data (cattle 3-nitrooxypropanol (3-NOP) methane-reduction studies).
Results: Good fit between predicted and observed methane suppression was obtained.
Discussion: We propose use of the general form of this logistic model with dose and dose frequency components included that address basic pharmacological impacts on methane suppression as the standard approach to meta-analysis.
Methane production inhibitors included in feed supplements are being increasingly used to restrict rumen methane production [for example (Williams et al., 2024; Alvarez-Hess et al., 2024a, b)]. Additives that may suppress rumen methane production include plant secondary compounds (such as tannins, saponins, oils, and essential oils), chemicals (such as nitrate and sulphate), synthetic chemicals (such as ionophores), and targeted inhibitors [such as bromoform, 3- nitroxypropanol (3-NOP)]. These are delivered in a variety of forms such as pellets, impregnated oils, or fed as a direct component of the diet (e.g., grapemarc, dried asparagopsis). The type of additive used and the form of delivery are often dictated by the production system. Agents suitable for use in total mixed ration (TMR; with the additive included in the ration) systems such as in feedlots are often not able to be delivered in or suitable for pasture/rangeland production systems. The efficacy, half-life, toxicity, and cost of the additive and its delivery system are key considerations.
The results from multiple studies are increasingly being combined through meta-analysis to understand general suppression effects [for example (Kebreab et al., 2023; Macdonald et al., 2024)]. Most products operate by interacting with the rumen microbiome and component biochemical pathways that scavenge free hydrogen ions (H+) to produce methane (CH4). The capacity of these agents to inhibit rumen methane production is determined by the amount of agent delivered to the rumen (i.e., the dose) and the duration and concentration of the drug at the site of action in the rumen. The absorption, distribution, metabolism, and excretion [i.e., the pharmacokinetic (PK) characteristics] of a drug influence the concentration of the drug at the site of action over time. The maximal inhibitory capacity of a rumen methane-suppressing agent determines the upper limit of rumen methane suppression. These intrinsic biochemical and physiological impacts of a drug on animal function are collectively referred to as the drug’s pharmacodynamic (PD) properties. Basic pharmacological principles in veterinary applications are described elsewhere (Riviere and Papich, 2018). Knowledge of a drug’s PK/PD characteristics combined with information on a drug’s safety profile inform the development of optimal treatment regimens by finding the suitable dose rate, frequency, and delivery modality that provide the desired clinical effects with minimal adverse effects.
Most studies of additive methane reduction efficacy use TMR feeding systems and estimate methane reduction (absolute or relative) across a 24-hour period. A few studies have reported critical pharmacokinetic parameters (Bhusal et al., 2024). This lack of basic PK/PD information likely impedes the identification of the optimal dose rate, frequency, and modality for the delivery of a drug (Bjornsson, 1997; Toutain and Lees, 2004). Practically, this suggests that the results from studies, or combinations of studies (such as from a meta-analysis), that do not use or report PK/PD information cannot be reliably extended into non-TMR systems (such as grazing) where differing doses and dose frequencies must apply. This study examines how pharmacokinetics and pharmacodynamics may impact the efficacy of feed additives in abating rumen methane production and provides a general approach to combining data on efficacy across studies. The proposed meta-analytic framework fills a gap in the literature and supports a more effective combination of results from different studies.
Combining results from across studies is not simply a function of controlling differences in dose and dose frequency in analysis. Differences in the rate of rumen methane production arising from factors outside the feed additive being examined may also be present. The base rate of methane production may vary between studies according to differences in dietary intakes, diet compositions (such as fibre), animal genetics, and the presence or otherwise of other methane inhibitors within the diet (and any interactions between methane inhibitors that are present). Some additives may have different efficacies according to the delivery system [e.g., monensin under TMR or pasture systems (Ranga Niroshan Appuhamy et al., 2013)]. All potential sources of variation must be controlled for in the analysis. Where this is not possible, clear study inclusion/exclusion criteria (with stated limits on the production systems and use cases that the results apply to) must be developed and applied.
Most drugs have a log-normal-shaped concentration vs. time curve in vivo. The compartment model of drug pharmacokinetics models the average concentration of a drug in a theoretical body compartment using mathematical constants that multiply the average concentration of the drug in the relevant sample compartment to represent the rate of drug entry/exit into/from the compartment (Shankar and Pathak, 2023). Typically, the shape of the up-slope of the compartment concentration curve is mostly determined by the rate and characteristics of absorption (A) and distribution (D) of the drug and the shape of the concentration down-slope (post-peak concentration) is mostly a function of metabolism (M) and excretion (E) of the drug. The pharmacokinetics of a drug are defined as the combined effects of drug absorption, distribution, metabolism, and excretion (ADME) characteristics which determine the active concentration of the drug in the sample compartment over time, which is generally regarded as proportional to the concentration at the site of action. An orally-delivered rumen modifier has effectively zero time to be ‘absorbed’ and available at the site of action (i.e., the rumen fluid). The concentration in the rumen fluid after ingestion is therefore simplified to be a function of the rumen volume, dose, dose frequency, and rumen half-life. For a single dose of a short-lived active drug, the concentration vs. time curve typically has a log-linear shape (see Figure 1).
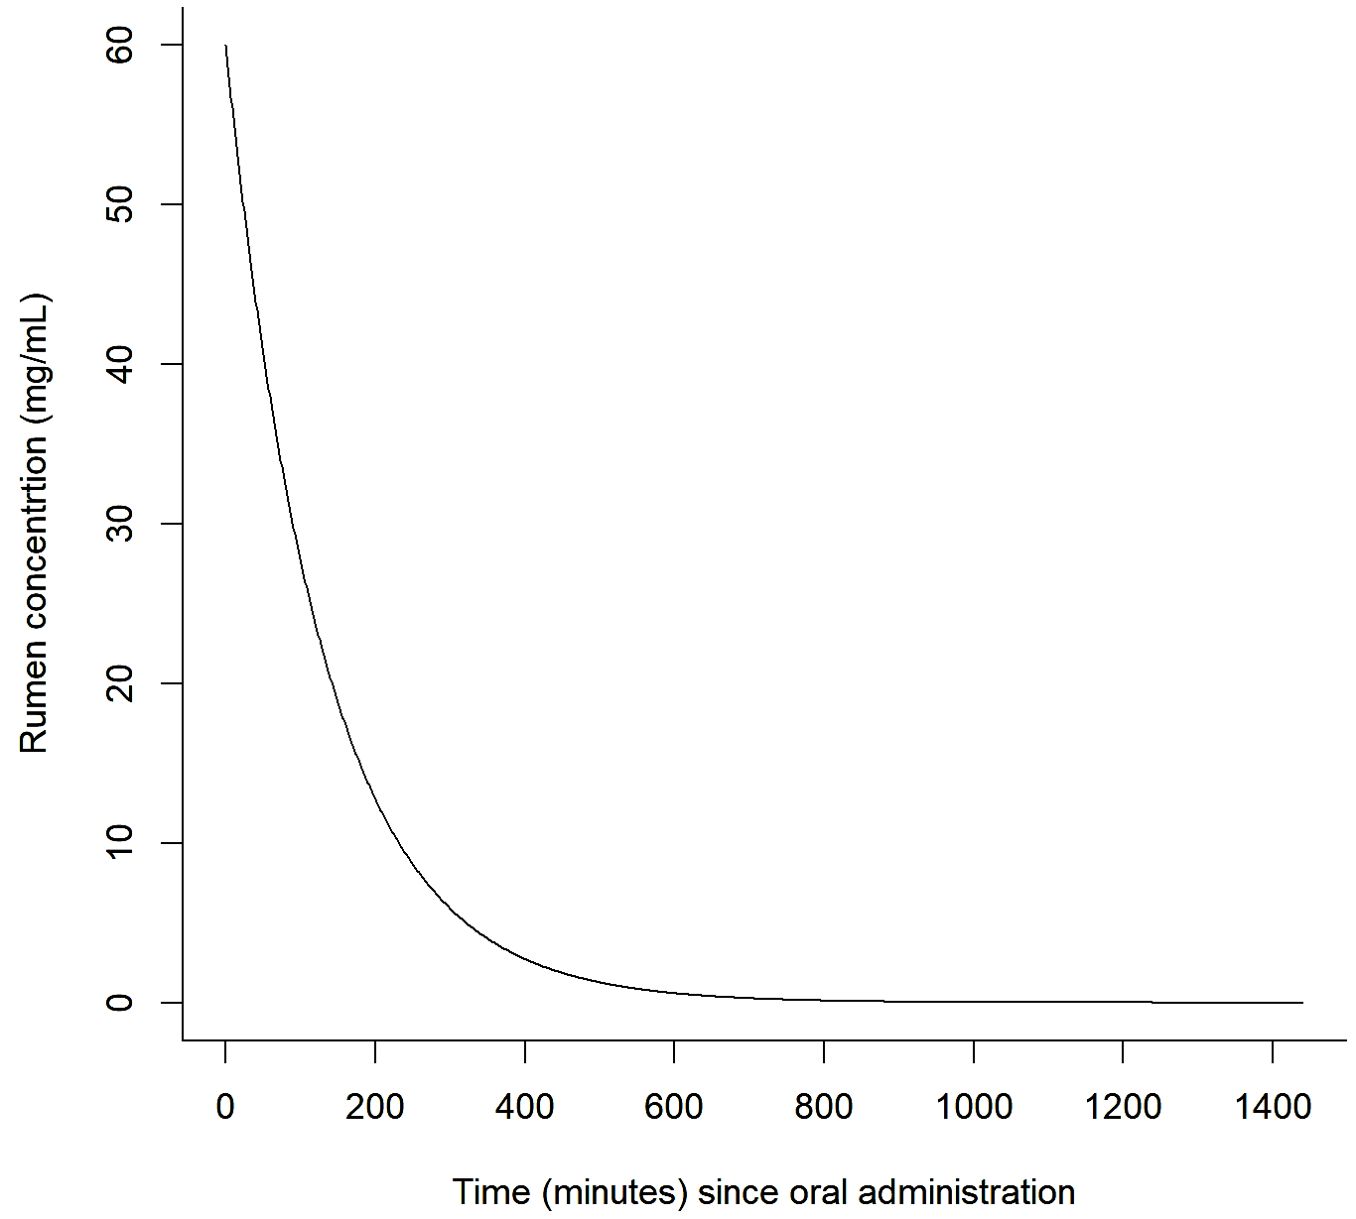
Figure 1. Example of a theoretical rumen drug concentration decay curve (note that availability is assumed to be immediate and complete on intake and that absorption is instantaneous).
Most drugs operate at the enzyme, receptor, or chemical levels and typically have Michaelis–Menten kinetics (Cornish-Bowden, 2015). The clinical effect of such a drug is then partly determined by the degree of saturation of the enzyme or receptor binding site and the effectiveness of the (bound) drug (as an agonist or antagonist) on enzyme/receptor activity. An example of the Michaelis–Menten kinetics function is presented in Figure 2. Practically, this means most drugs are ineffective if at concentrations below a certain minimum and effectiveness peaks at a certain maximum concentration beyond which no further effect is observed.
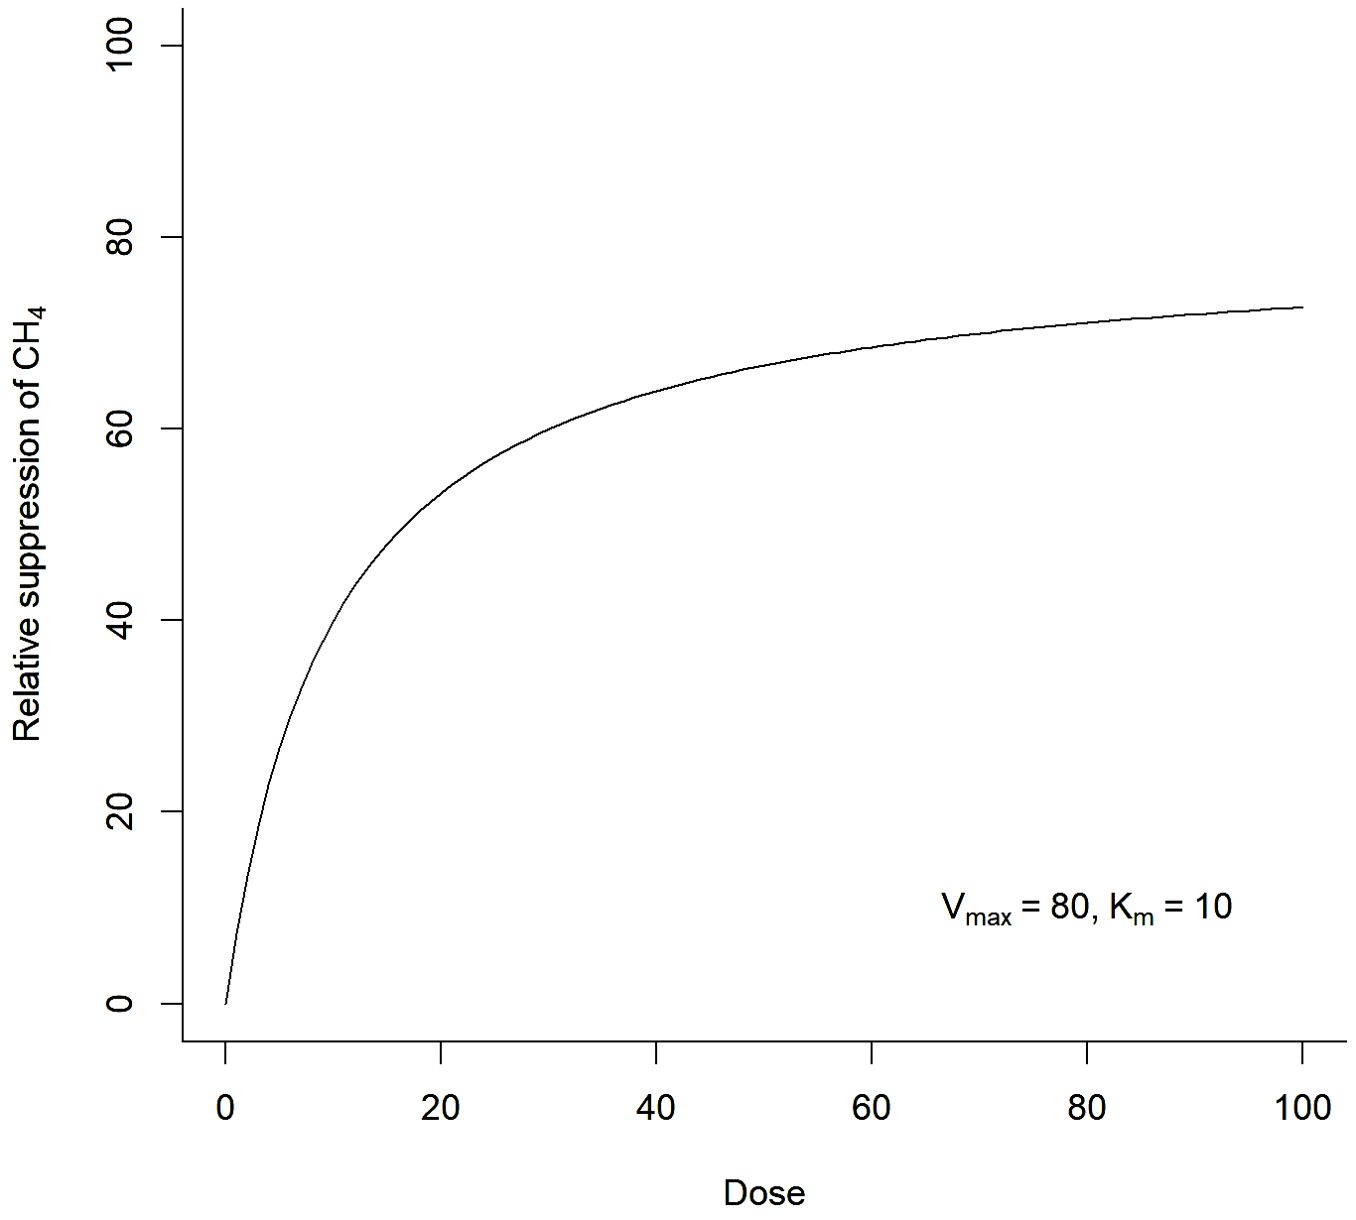
Figure 2. Example of Michaelis–Menten efficacy dose-response curve typical of many drugs that modify biochemical reaction equilibria or impact receptor sites. Most feed additives that abate rumen methane production are likely to have Michaelis–Menten dose-response characteristics.
It is the combination of drug dose, dose frequency, modality and PK/PD characteristics that determine the clinical response following treatment. The efficacy response is typically sigmoidal in nature. The more of a drug that is administered, the more likely the active concentration of the drug at the site of action will be at or above the minimal efficacy concentration for a period of time. Similarly, the more frequently a drug is administered, the greater the proportion of time that the drug concentration at the site of action will be above the minimum effective concentration. The more frequently a drug is administered, the more likely the concentration curves of the current and preceding dose(s) will overlap, resulting in a higher active concentration of the drug for a period than predicted for a single dose (see Figure 3). This summative pattern for clinical response implies that dose and frequency of administration should be included in statistical analysis to control for these effects and to allow a generalisation of the results. This is especially important for drugs that are administered to ruminants through feed because ruminants can spend a high proportion of the day eating and the addition of a feed additive (drug) to a TMR is effectively the same as providing multiple doses of a drug or a zero-order infusion within a set period of a day.
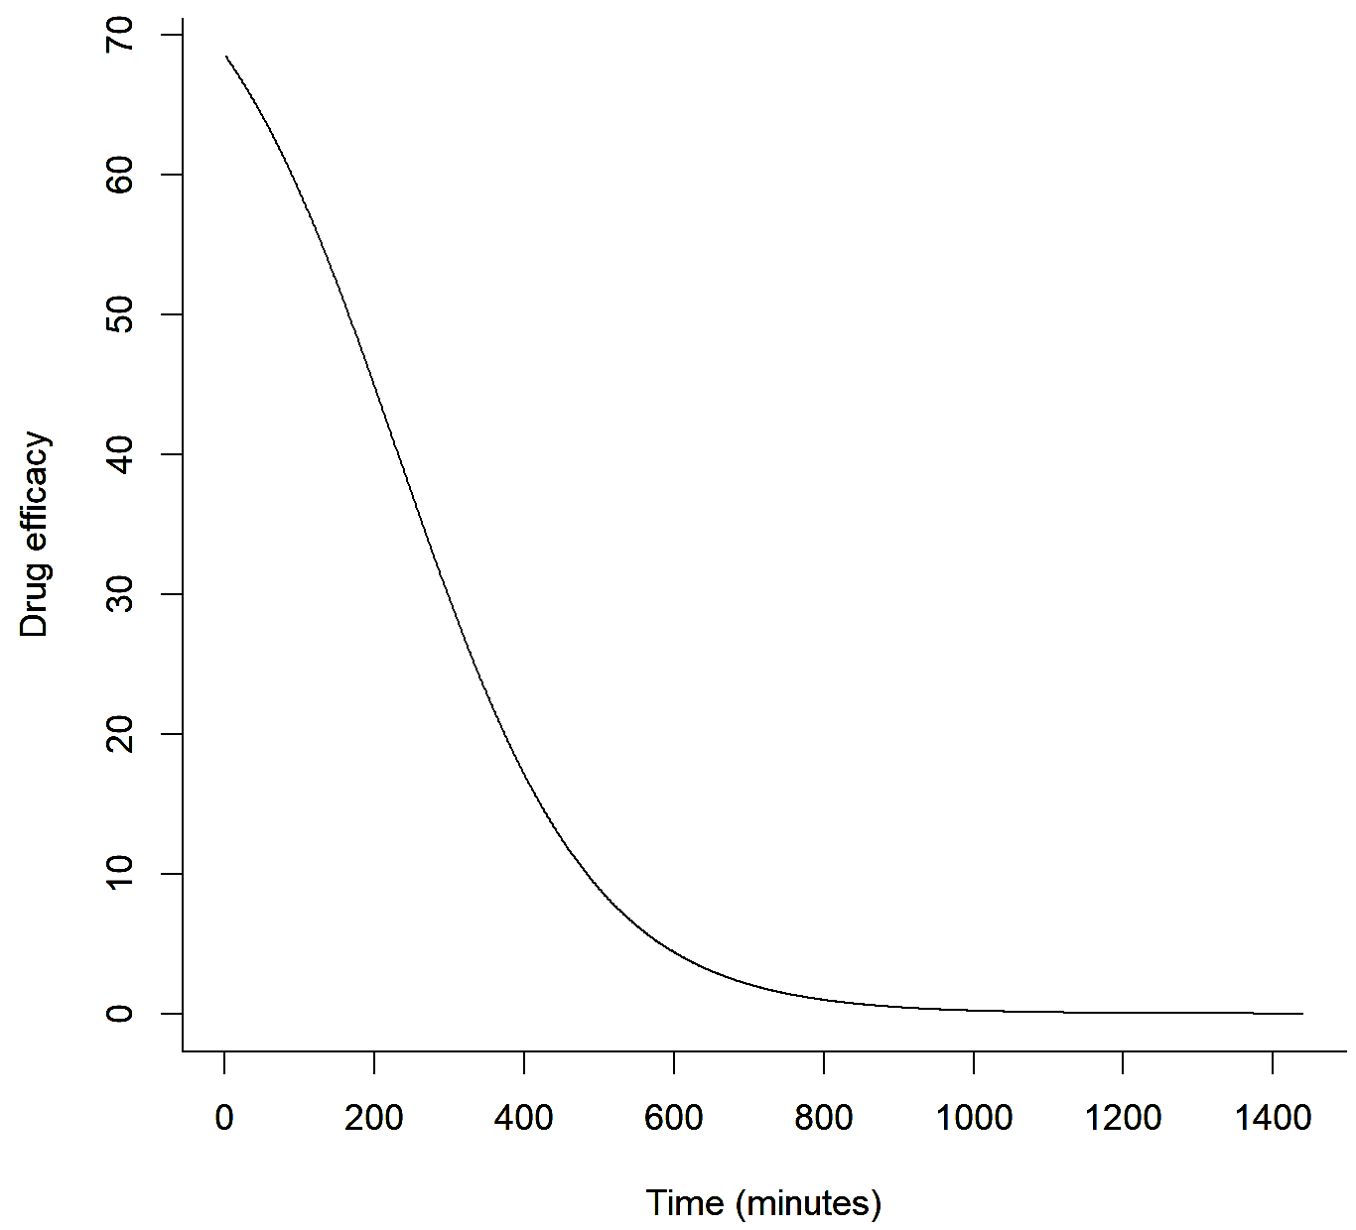
Figure 3. Example of a feed additive rumen-acting methane suppression efficacy response curve over time from single dose administration that considers pharmacokinetic and pharmacodynamic effects.
Meta-analysis is increasingly used to combine results from similar studies and provide generalisations about expected performance from across the body of research. Because the dose rate and dose frequency of additive used may affect the methane suppression response and these may differ between studies the dose rate and dose frequency used in each study must be included in meta-analysis to control for these effects. A key challenge of meta-analysis is determining effective inclusion/exclusion rules for combining results from different studies. One option relevant to this application would be to only combine data from studies of similar design (especially dose frequency, like TMR systems), however, the results would then only apply to similar use scenarios in practice (e.g. TMR system). An alternative approach considers likely pharmacological impacts upon performance and instead specifically examines the relative reduction in methane production across dose and dose frequency combinations. This analytical approach supports combination of studies measuring the methane-reduction response to additive across a range of delivery systems because it does not assume that additional doses or more treatments provide for linearly-predictable change in methane suppression. It also bypasses need for specific PK/PD parameter knowledge but instead controls for these unknown effects in analysis. Another feature of the proposed statistical model is that it constrains methane suppression to lie between 0–100% by using a suitable transformation of efficacy response.
We propose an analytical model for combining data from field studies involving ruminants fed with methane-reducing additives, encompassing both TMR and non-TMR feeding systems with differing dose rates and frequencies to estimate likely methane suppression. The proposed analytical method estimates methane suppression responses controlled for the amount and frequency of delivery of the additive, thereby supporting use in meta-analyses that combine studies across the range of rumen additive delivery systems. A logistic transformation of the relative efficacy (the percentage reduction in methane when comparing the treatment with control groups) is proposed as the dependent variable and the analysis includes total dose, dose frequency, and quadratic and interaction terms as the independent variables to capture any curvilinear PK/PD effects on methane suppression. A first-principles PK/PD model of an orally-delivered feed additive was tested using simulation and verified against simulated and an example of real data (cattle 3-NOP methane-reduction studies).
A simulation model of a (theoretical) short-lived rumen additive supplement with arbitrary PK/PD was built. The model was applied across all feeding systems ranging from dedicated single-point-in-time supplementation, as may occur in pastured animals, through to total mixed ration systems where the supplement was included in the formulated diet. The model assumed non-linear suppression of methane production in the rumen according to Michaelis–Menten principles. An equation of this form was used to estimate the efficacy of methane suppression at given active concentrations of the additive in the rumen. Cow intake was set as a percentage of body weight (3.5 ± 0.2%). A regular intake of feed was assumed given the model was of farmed ruminants.
Data was generated for additive use scenarios across differing dose rates and dose frequencies (doses per 24-hour period). The total amount of methane generated by the treatment (supplemented) and control (non-supplemented) cattle per 24-hour period was calculated. Scenarios with the uniform inclusion of the additive into the diet were modelled as a total-mixed-ration (TMR) feeding system and were assigned a theoretical maximum dose frequency estimated as the maximum number of meals that a cow within a TMR system would choose to consume in a day. Cows receiving the diet with the included additive but in a partial-mixed-ration (PMR) system were assigned a dose frequency as the proportion of each 24-hour period that PMR was available multiplied by the theoretical maximum number of meals consumed in a day (under TMR feeding). The average number of meals per day for dairy cows under TMR systems was found to be 10 ± 0.1 meals, each lasting an average of 35 ± 3 minutes per day (Beauchemin et al., 2002). This dose frequency was used to represent TMR delivery systems. The maximum simulated dose frequency was extended beyond this to 30 individual administrations within a 24-hour period in order to model more additive-saturated rumen environments and so encourage any non-linearity in methane suppression to be expressed. The dose frequencies modelled were: 0.25, 0.5, 1, and 2 times per day to represent grazing systems (where the additive is separated from pasture and administered individually at set times1); 3, 6, and 8 times per day to represent PMR systems (calculated either as a proportion of total dry matter intake or as the proportion of each day of feeding via PMR multiplied by the maximum number of meals within a TMR system); 8, 10, and 12 to represent TMR systems (being the range in the number of meals within a TMR system); and 18, 20, 22, 25, and 30 to represent extreme (but non-PMR/TMR) additive delivery systems. These higher rates conceivably reflect slow-release technology forms of the additive, such as a rumen bolus containing sequentially partitioned and available active concentrations.
It was assumed that dietary intake was not limited (i.e., ad libitum feeding) and thus there were no restrictions in the supply of substrate to the rumen methanogens. Studies indicate that for bovines the rate of production of methane is proportional to the amount of dry matter consumed (Charmley et al., 2015; Cottle and Eckard, 2018), with a possible exception being for cattle on below-maintenance dry matter intake rations that provide for prolonged gut passage times and more complete digestion of fibrous dietary matter thereby results in greater methane production per unit of dry matter consumed (Goopy et al., 2020). This is unlikely to be present in farming systems considering the use of feed additives to abate rumen methane production such as we have simulated. The estimated methane production of the untreated (control) cows was set at 20.7 grams of methane produced per kilogram of dry matter intake (Charmley et al., 2015). The parameter values used for the simulation model are presented in Table 1. Stochasticity was introduced into the model using random sampling from the relevant parent (normal) distribution (where a standard deviation was listed).
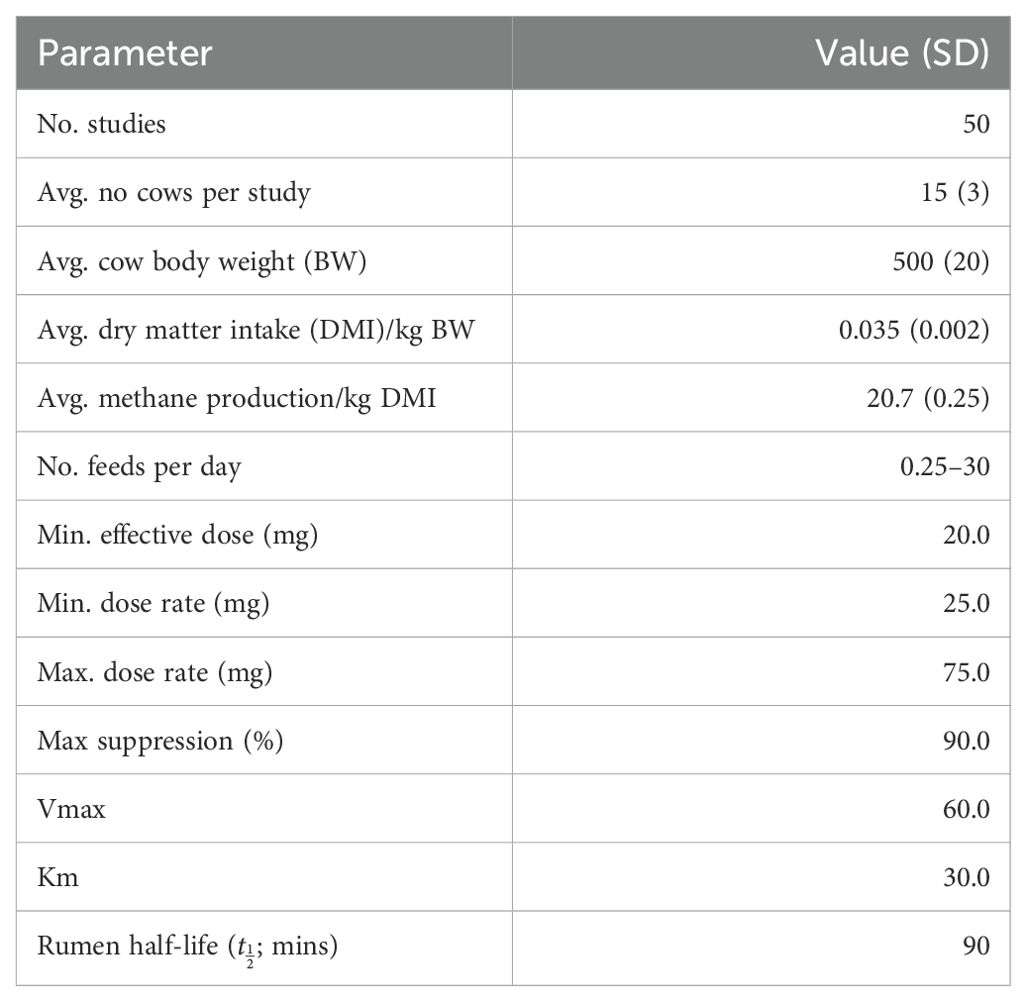
Table 1. Simulation model input parameters (a normal distribution was assumed for variables with means and standard deviations presented).
The estimated reduction in methane was calculated for each group within the study. The relative suppression in methane production in the treated compared to the control groups within the study was transformed before statistical analysis using a logistic transformation, namely the natural logarithm of the suppression odds (i.e., Ln[]). The logistic transformation of the dependent variable allows this to range between -∞ and +∞, making it suitable for regression analysis. On back transformation, the relative suppression can only range between 0%–100%, thereby providing biologically plausible output. The basic regression model included dose (24-hour total supplement intake) and dose frequency (the number of times the supplement was administered per 24-hour period) with quadratic and interaction terms between these variables offered to the model to capture potential curvilinear methane suppression responses.
The (saturated) model is of the form:
Where , , , , , , and are constants and Dose is the total 24-hour period dose and Dose Freq. is the number of doses administered in any 24-hour period. The percentage suppression of methane production is provided by the back transformation of the model output as follows:
The final model was determined using stepwise removal of non-significant predictors from the model. If a removed term resulted in a significant reduction in model fit, it was returned to the model. Model fit was determined using the Chi-squared test of change in deviance between nested models using the stats::anova() command in R. Significance was set at p = 0.05. The R Language and Environment for Statistical Computing version 4.2.1 was used for all modelling and analysis (R Core Team, 2024).
The performance of the statistical model was examined using a recent meta-analysis of the methane suppressive effects of feeding a 3-nitrooxypropanol (3-NOP) supplement to ruminants (Macdonald et al., 2024). All studies used TMR feeding systems with 3-NOP incorporated into the treatment group ration. The number of meals was unknown for any included study, and was likely (on average) identical within and between studies. This absence of variation in dose frequency between studies prevented meaningful inclusion of dose frequency into the model. However, the logistic transformation of the suppressive effect of treatment was amenable to study and so this was the primary subject for validation. A model to predict the percentage reduction in methane production between treatment and control groups was developed. The dependent variable was the log of the odds of percentage reduction in methane per kilogram of dry matter between treated and control cows. In some circumstances, treated cows produced more methane than control cows, so the percentage reduction was set to a nominal small amount (0.1%), to allow logarithms to be taken. Treated and control cows also often ate different amounts of dry matter (generally treated cows ate less dry matter than control cows), so this was controlled in analysis by inclusion of the total amount of dry matter (kilograms) eaten by the treated cows and the ratio of dry matter intake between control and treatment groups. Other variables included in the model were the organic matter (OM) and neutral detergent fibre (NDF) contents of the diet. The number of animals in each study was used to weight the regression.
The default (base) model was:
Where Dose is the 24-hour total dose of the additive, Dose Frequency is the number of individual treatment administrations per 24-hour period, DMI is dry matter intake (per 24 hours), Ratio DMI is the ratio of dry matter intake between the treated and control groups (within the study), NDF is the neutral detergent fibre content of the diet (%), OM is the organic matter content of the diet (%), and , , , , , , , and are constants. Dose and dose frequency quadratic and interaction terms were offered to the model to capture non-linearity in methane reduction due to PK/PD effects. Quadratic terms for dose, dose frequency, and interaction terms were also examined. The optimal model was selected as the most parsimonious model with the best fit and statistically significant predictor variables (or interaction terms between individual predictor variables).
The simulation model methane production output was examined. The relationship between dry matter intake, total dose, and dose frequency was less apparent in the treatment group compared to the control group (see Figures 4A, B). This suggests that the model produced a non-linear methane reduction response following the inclusion of the additive in the diet, as would be expected from the PK/PD parameters used. The model was not sensitive to changes in underlying distribution parameters; the standard deviation of the population distributions was altered to examine this effect.
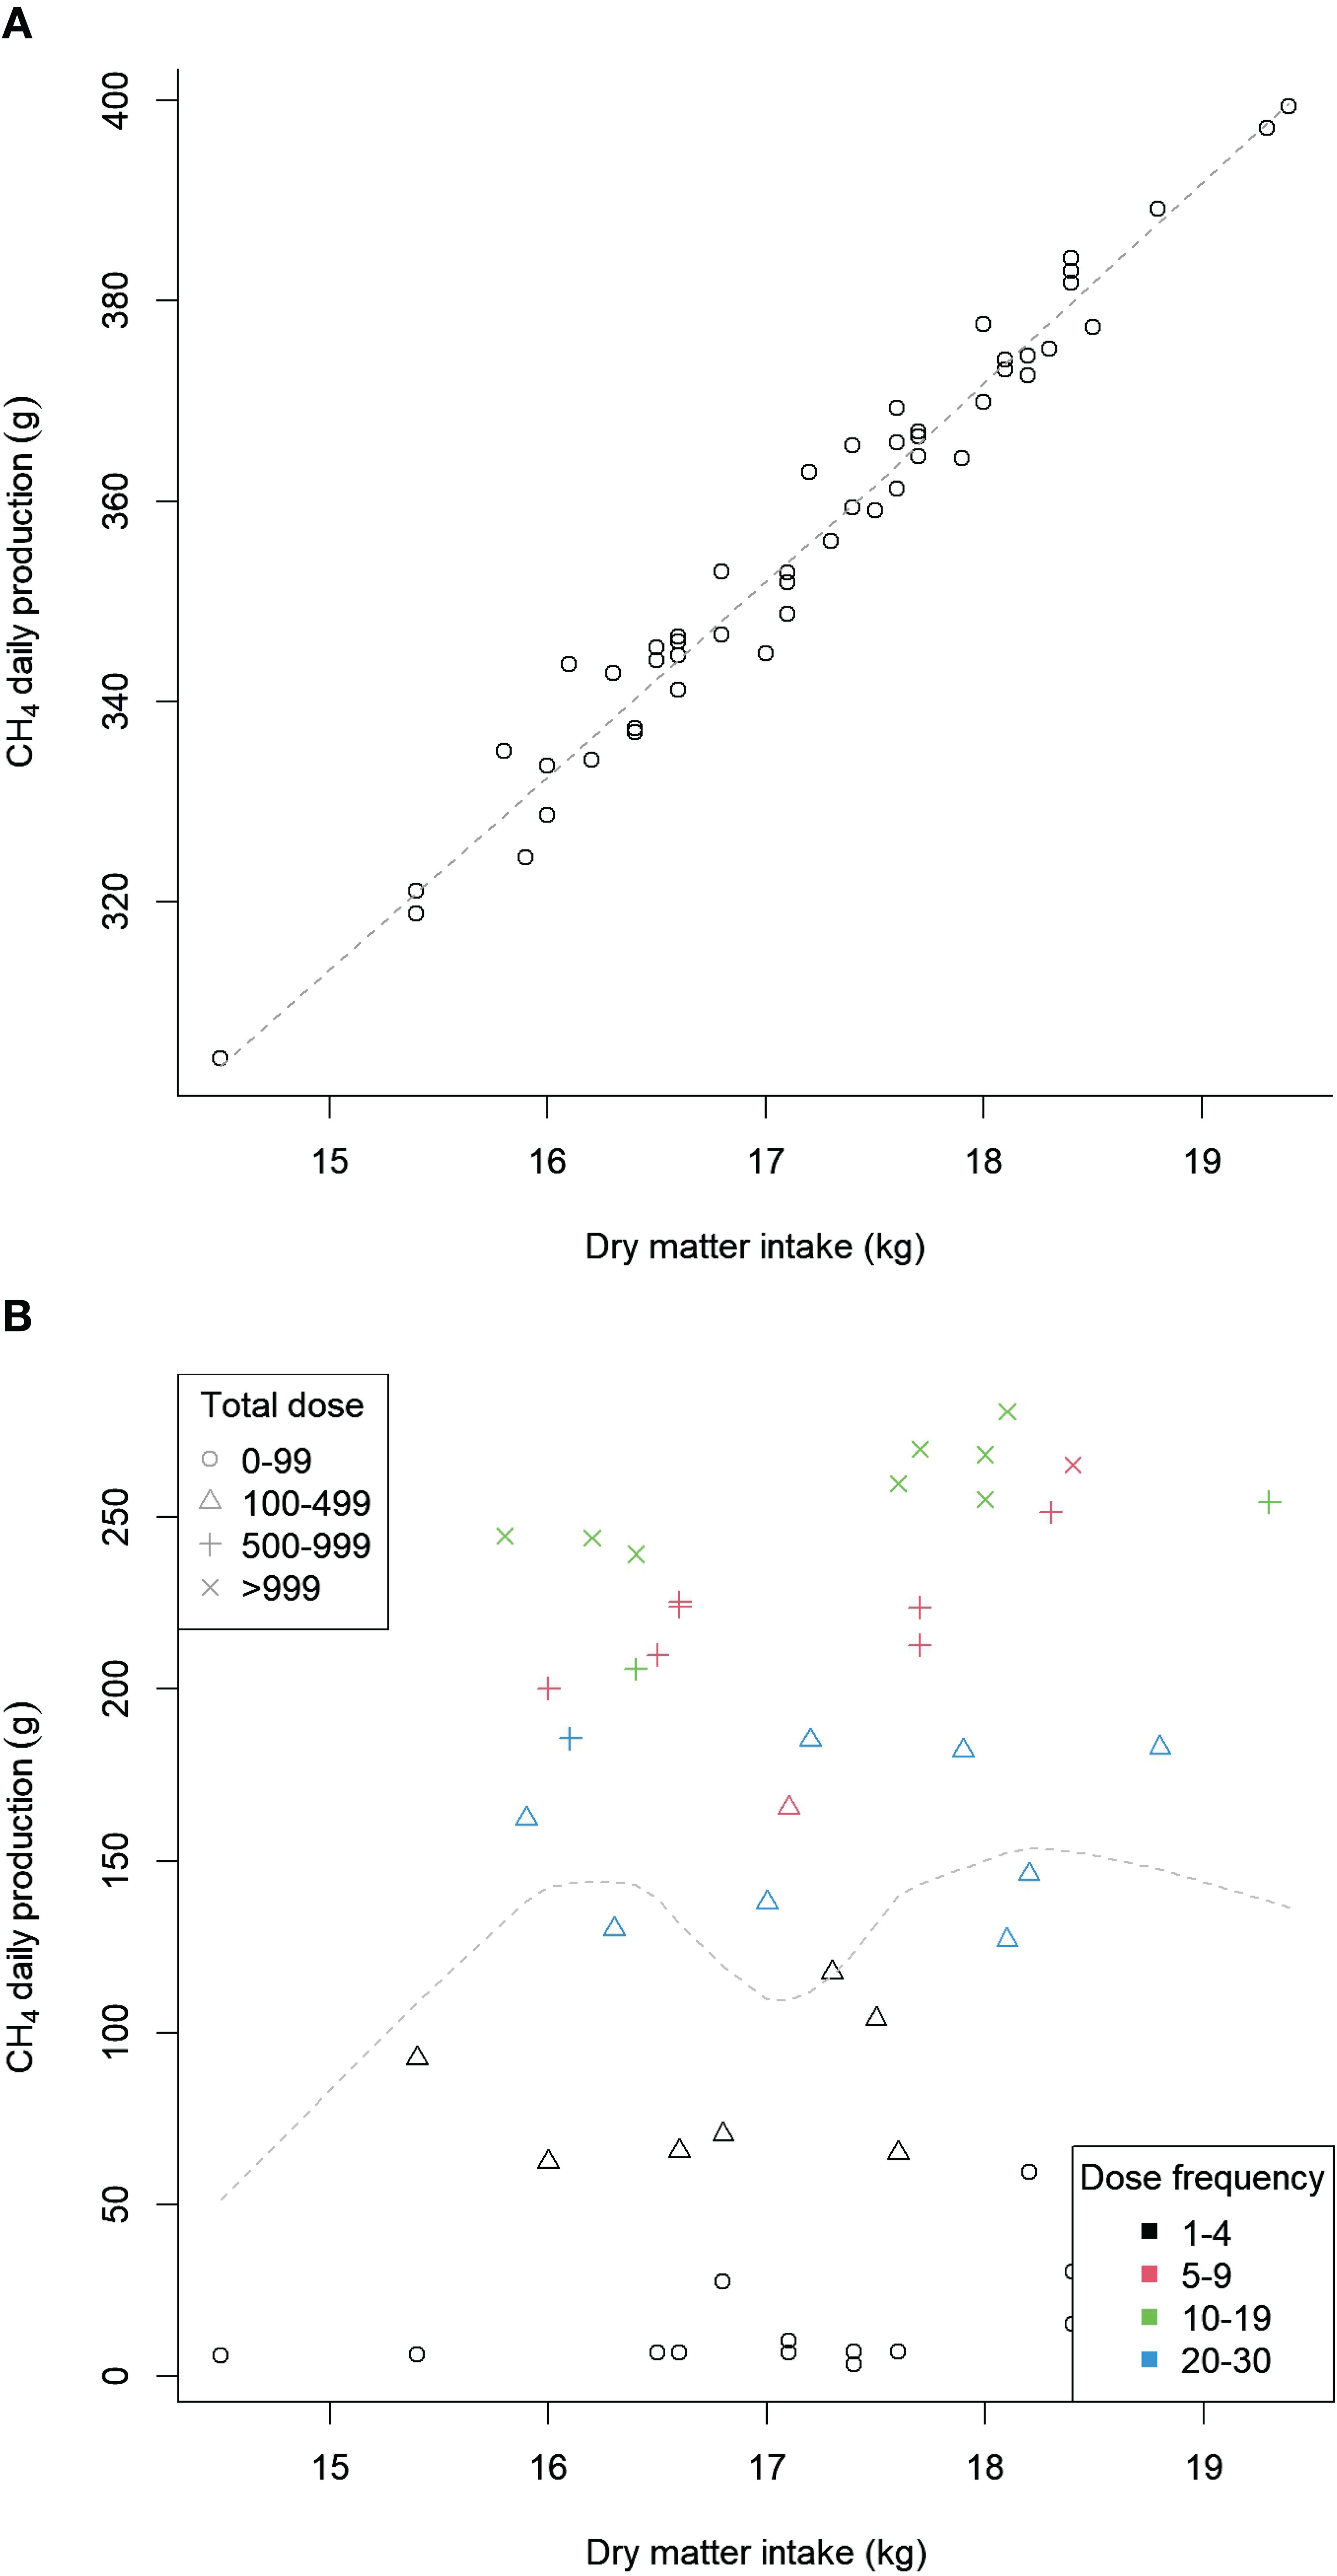
Figure 4. Total simulated methane (CH4) production by dry matter intake for the control and treatment groups. (A) Control, (B) Treatment.
The logistic transformation regression model with interaction and quadratic terms between total dose and dose frequency provided the best fit. The model output is presented in Table 2. The regression model R2 was 0.946, indicating good agreement between the predicted percentage suppression of methane production by the model and the actual percentage suppression (see Figure 5). There was no systematic pattern in model residuals, further suggesting that the inclusion of interaction and quadratic terms in the regression model adequately captured any PK/PD impacts upon methane suppression efficacy within the range of simulated dose rates and frequencies. The regression model was used to estimate the response curves for combinations of total dose and dose frequencies across the range of likely total dose rates and frequencies per 24-hour period. Results were biologically plausible and are presented in Figure 6.
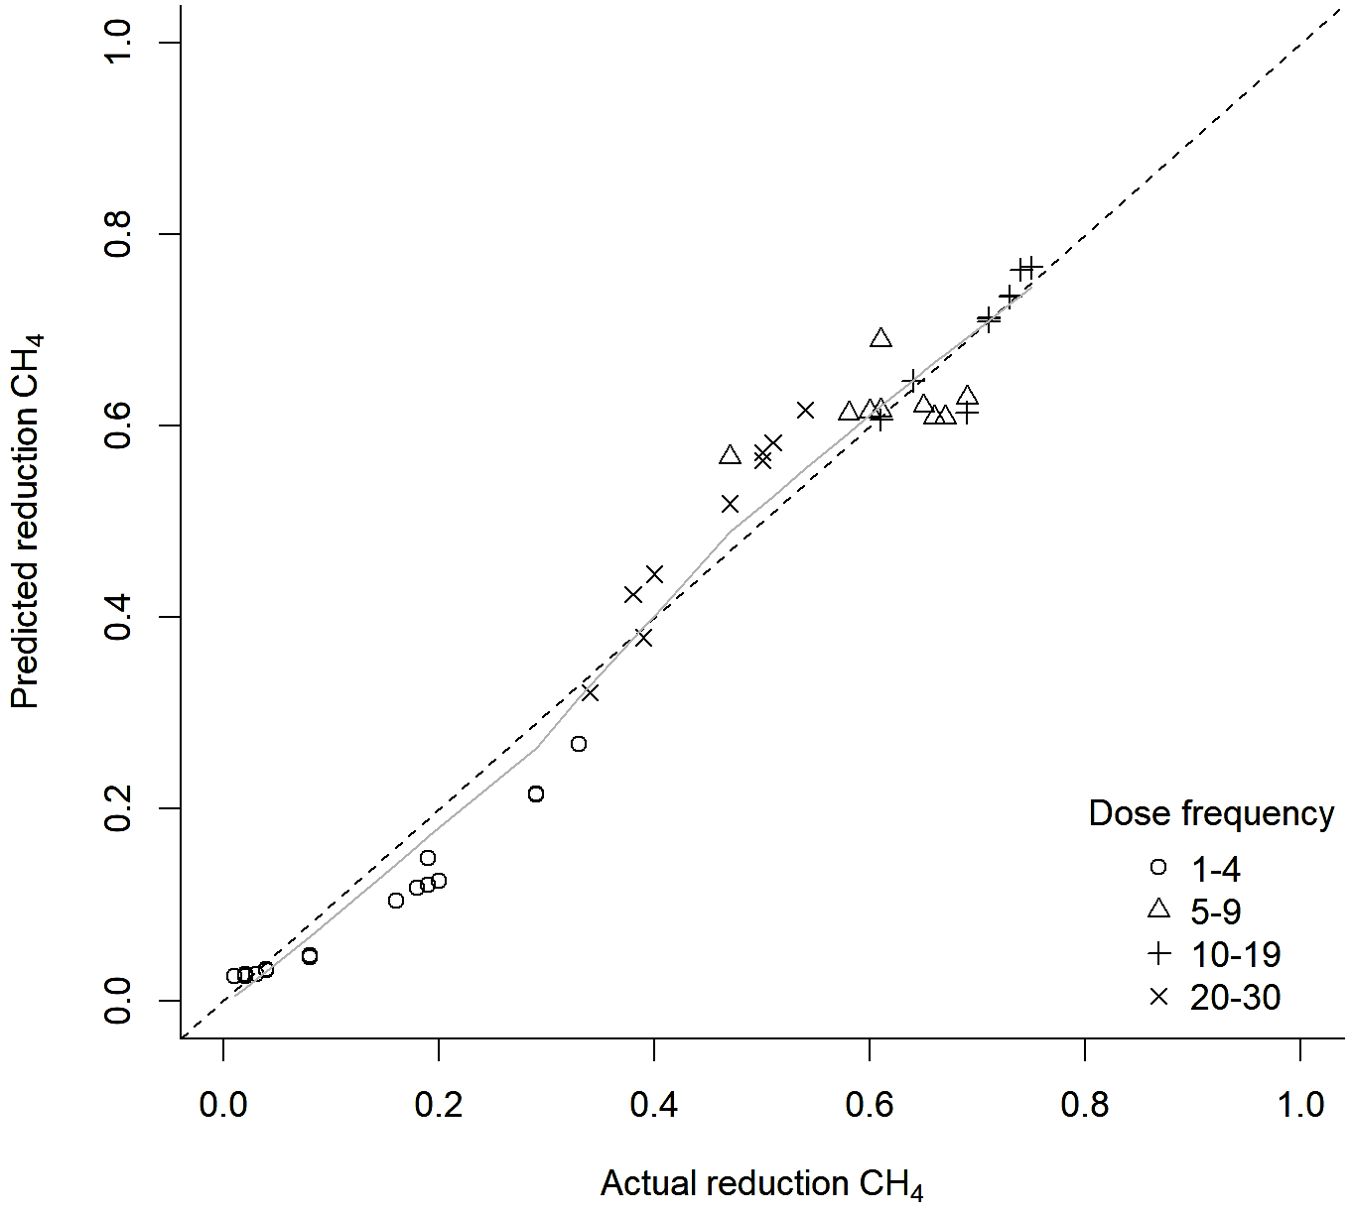
Figure 5. Actual vs predicted simulated methane (CH4) proportional suppression from a logistic transformation regression model.
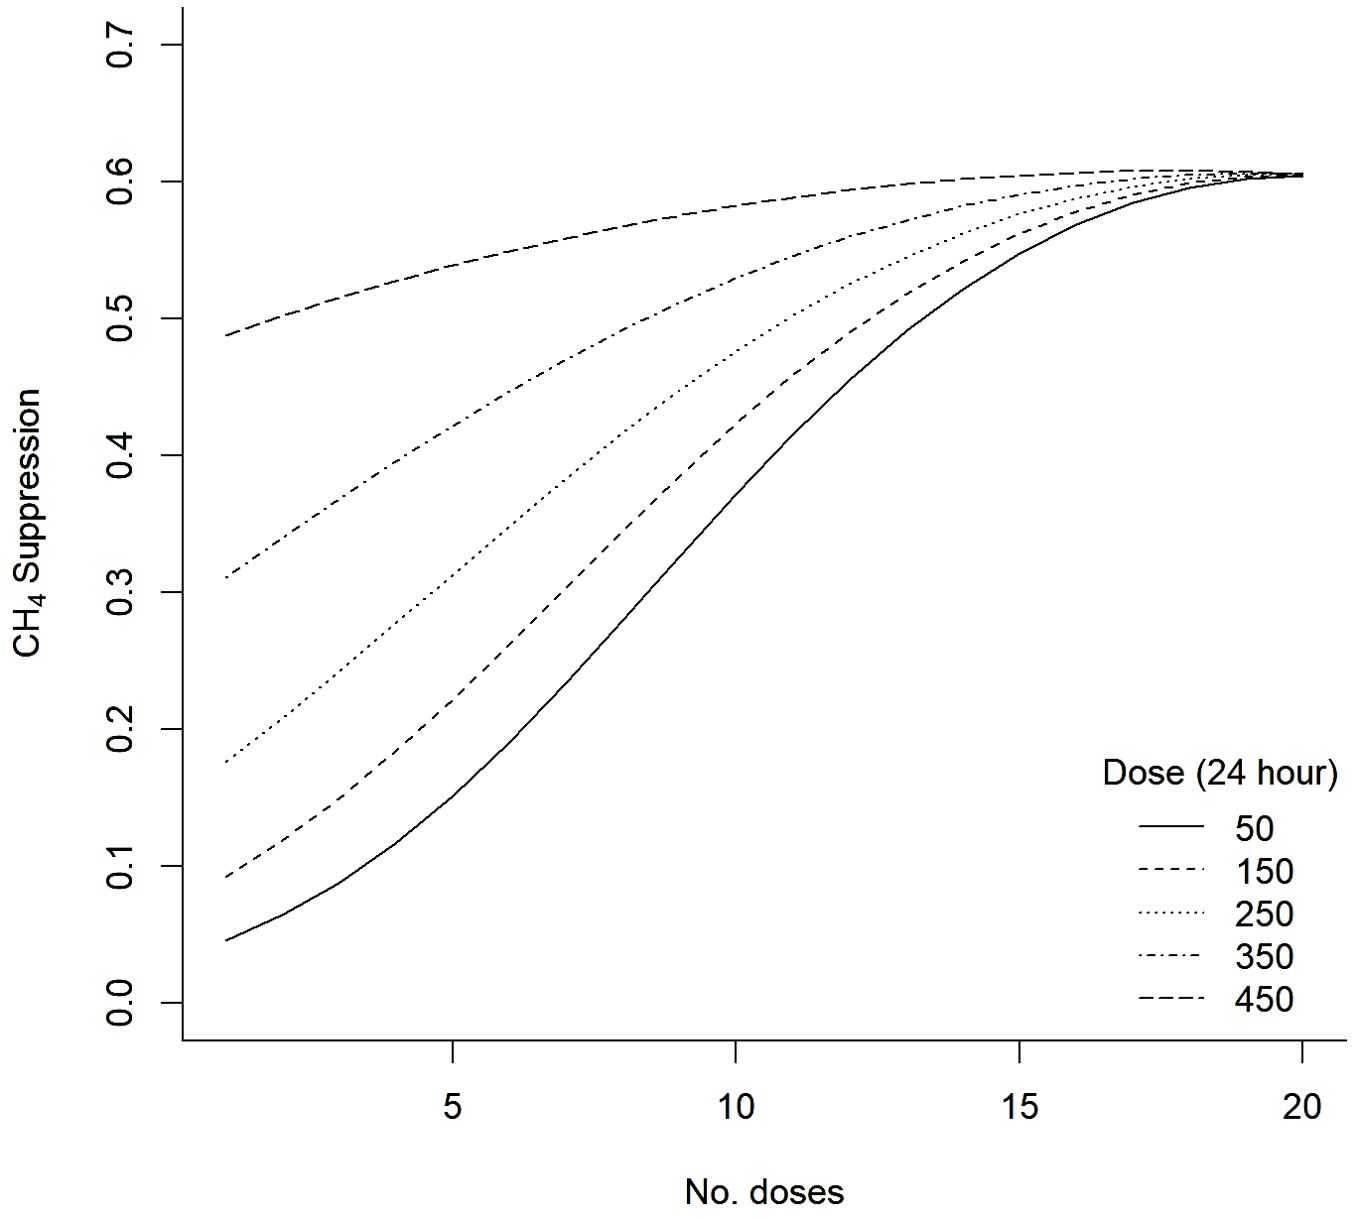
Figure 6. Predicted methane (CH4) suppression response curves from the logistic transformation regression model.
Data from cattle studies with NDF measurements from the Macdonald et al. 3-NOP rumen additive methane suppression meta-analysis were used in the logistic transformation regression examination (Macdonald et al., 2024). Neutral detergent fibre was the only ration component that was a significant predictor and was retained in the final model. The final model is presented in Table 3. The residuals were randomly distributed, consistent with the assumptions of the model. This was supported by an examination of the predicted versus actual methane suppression arising from treatment with 3-NOP, as presented in Figures 7A, B, showing kilograms of dry matter intake and dose of 3NOP, respectively. The R2 for these regressions were 0.330 and 0.167, respectively, indicating modest methane suppression predictive ability (i.e., modest model fit). This suggests that factors not included in the regression equation were also influential.

Table 3. Logistic transformation regression model coefficients [data from Macdonald et al. (2024)].
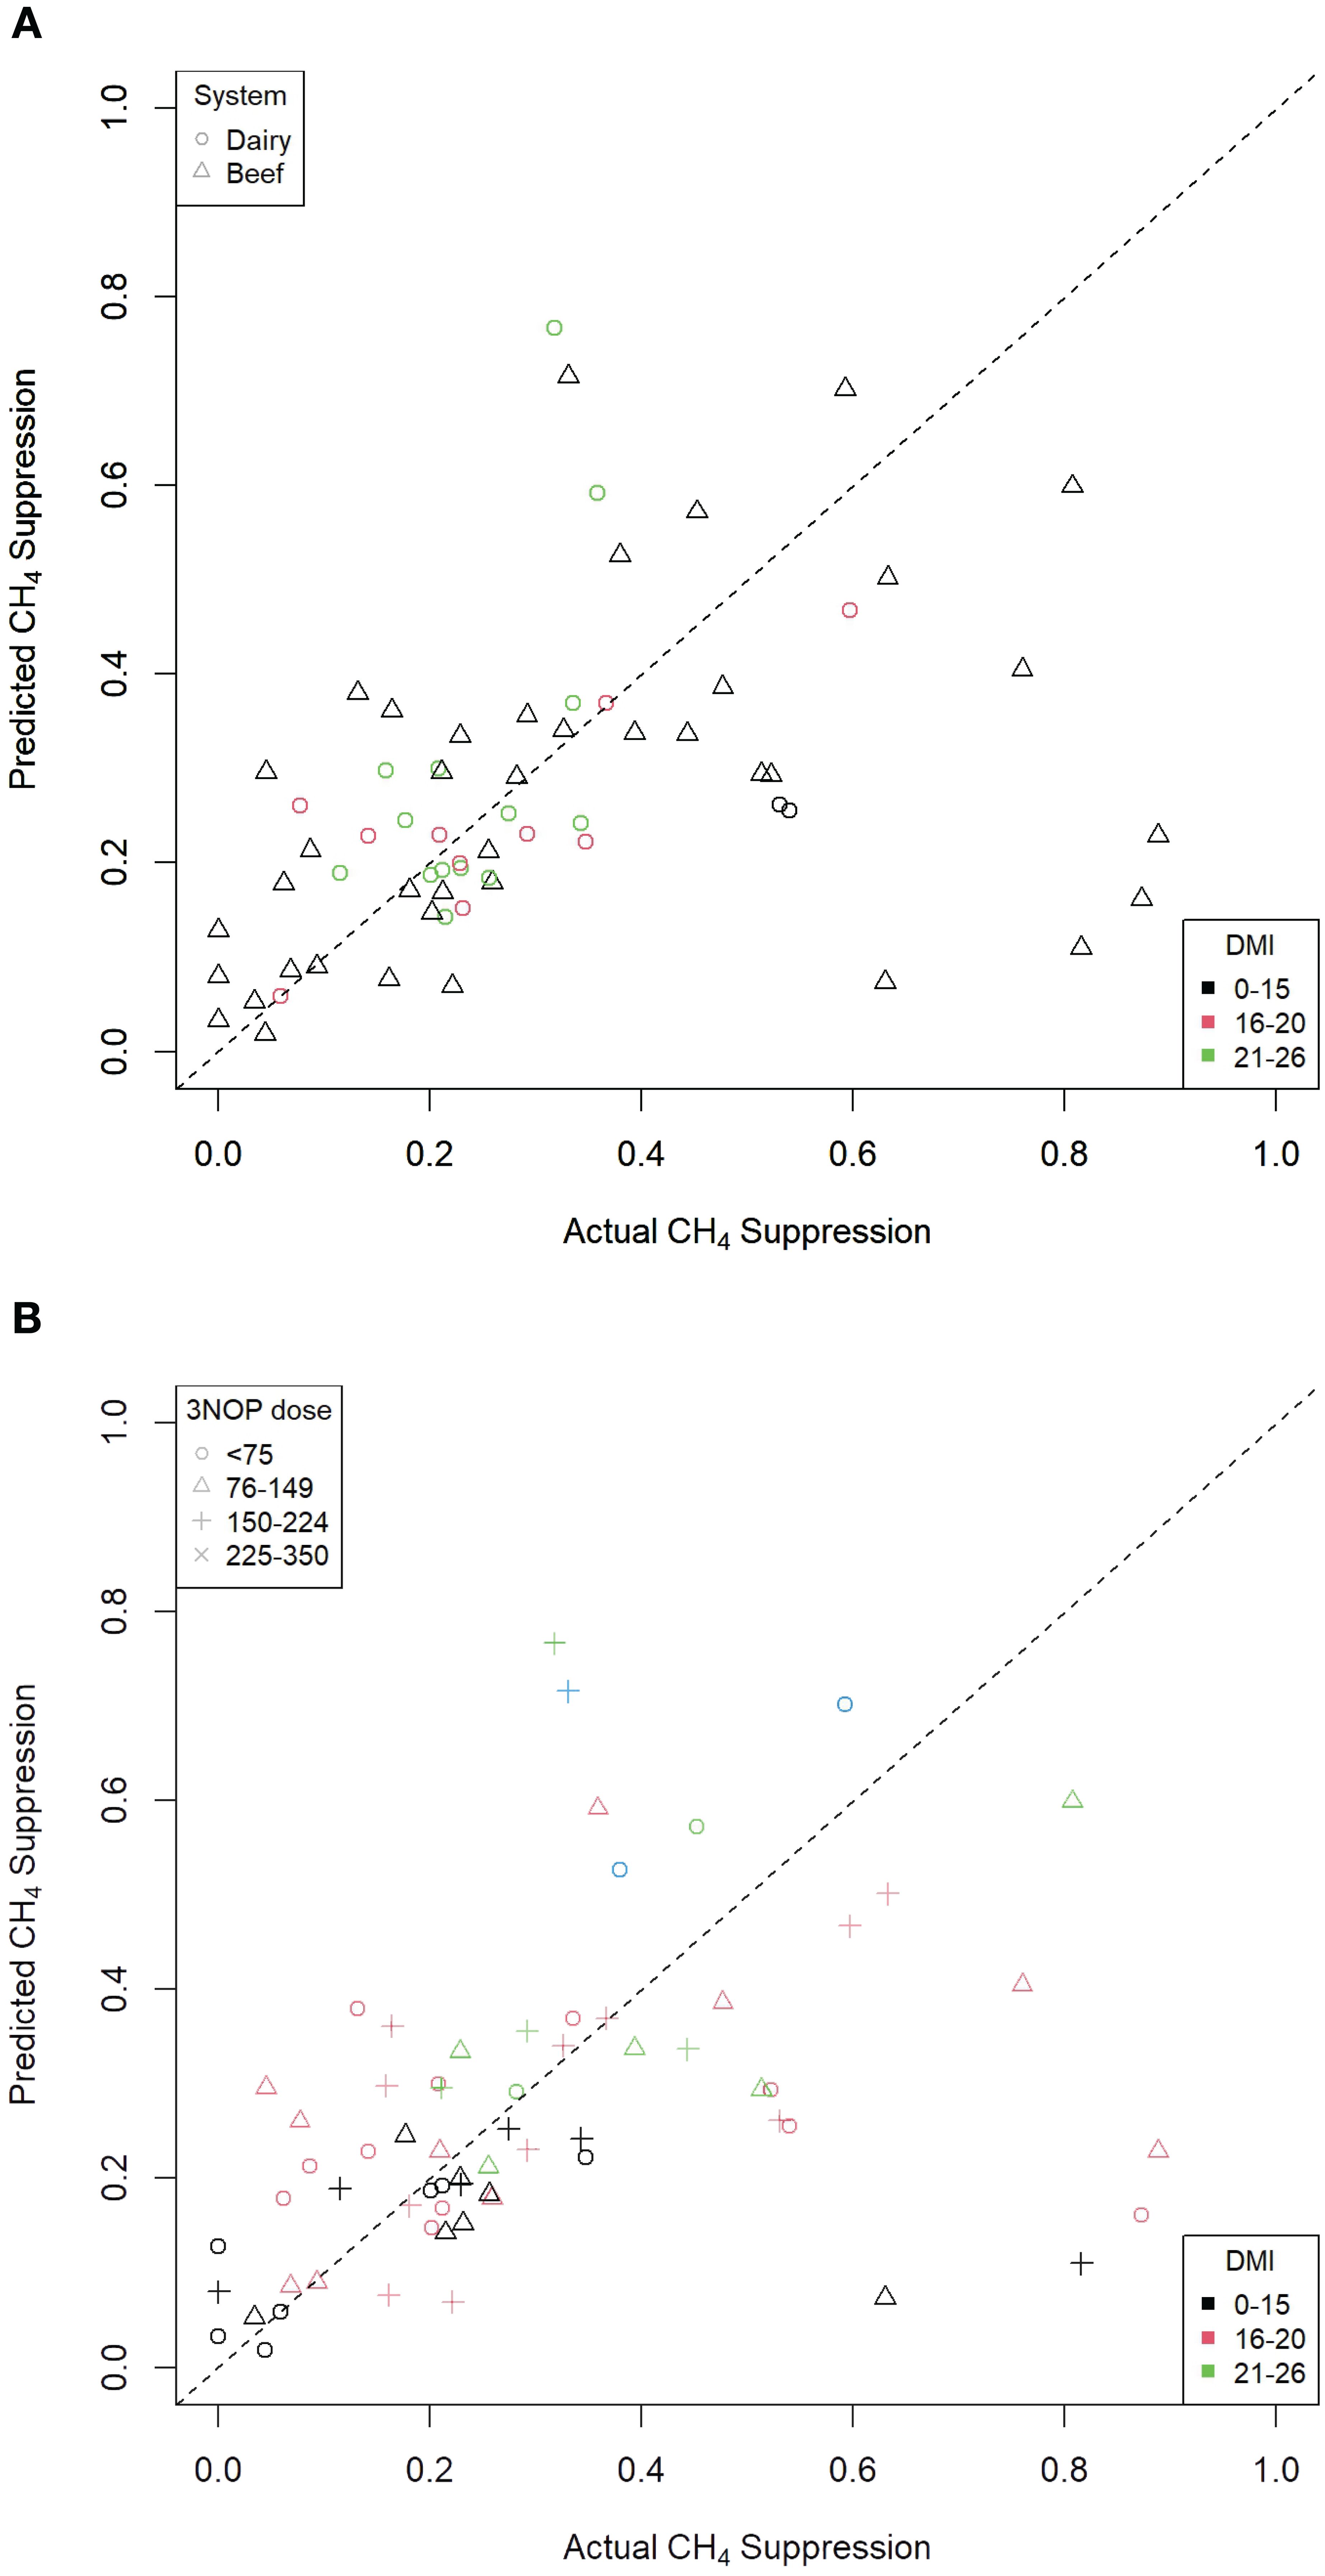
Figure 7. Predicted versus actual percentage methane (CH4) suppression from a logistic transformation 3-NOP regression model [from Macdonald et al. (2024)]. (A) By kilograms of DMI (R2 = 0.330). (B) By dose of 3NOP (R2 = 0.167).
The use of a logistic transformation for rumen methane production suppression as the dependent variable in the analysis is supported by this work. This approach ensures that suppression is constrained to lie within 0%–100% and is reflective of the biological range. It is recommended that meta-regression models employ a logistic transformation of rumen methane production for use as the dependent variable. The model should also include terms to control for any non-linear pharmacological impacts. The inclusion of independent variable terms for the total amount of additive administered, the number of times the additive was administered (i.e. meals/doses), and the combinations of quadratic and interaction terms between these variables was demonstrated to control for PK/PD non-linearity in methane suppression responses. We also recommend that the dose frequency average of 10 meals per day, as estimated by Beauchemin et al., be used as an estimate for studies that include the additive in the base ration within TMR systems (Beauchemin et al., 2002). For PMR systems, this number is adjusted downwards by the proportion of total intake or feeding time per day to capture the spectrum of feeding within PMR delivery systems.
This approach avoids the need to either know or calculate PK/PD parameters and thus supports the use of a meta-analysis that combines studies that examine the same additive but use different dose rates and dose frequencies. This will help to ensure that existing studies (most are without PK/PD information) can be combined and the effects generalised across the spectrum of likely dose rates, dose delivery/administration systems, and diets.
Whilst this study did not specifically consider the potential toxicity of the modelled additive, it was assumed that information on the safety margin for any proposed additive would be obtained from dose-setting toxicological studies conducted in advance of any efficacy study [for example (Borgert et al., 2021)] and that the dose rate and frequency combinations examined would minimise the risk of toxicity or other adverse effects.
Meta-analysis is a technique for combining data from studies that address a common research question. Often, this is to quantify the effect of a specific intervention (such as the feeding of an additive) on the outcome of interest. A well-designed meta-analysis will consider other variables that may impact the outcome of interest and include terms for these predictors in the statistical model. Ruminant dietary intervention studies can be particularly challenging to combine in a meta-analysis because of the inherent variation in dietary composition and inclusions, feed intakes, management systems, genetics, and animal exposures that exist across the range of production systems around the world. The implication is that the meta-analysis should include terms for other methanogenesis moderators that may be variably present to allow some control over these natural differences between studies. These analytical controls extend beyond just dietary components and feed additives, as discussed previously, to include any vaccination (against methanogens) and breeding or management intervention (such as early life programming) that may impact rumen methane production. The model should also include terms that control for differences in the percentage composition of the diet and relative digestibility of these components along with total dry matter intake. The inclusion of these other causes of variation will help to refine the estimate of the effect of the dietary additive of interest. The study by Almeida, Hegarty, and Cowie exemplifies this approach (Almeida et al., 2021). Whilst our logistic transformation model provided an unbiased prediction of methane suppressive effectiveness of 3-NOP as a rumen additive, there remained important variations around the regression line. This suggests that other (non-included) factors influencing rumen methane production were variably present across the studies examined in the meta-analysis (Macdonald et al., 2024).
The pharmacokinetic and pharmacodynamic properties of a drug (including feed additives for the control of rumen methane production) impact efficacy. Most studies do not measure or control for these effects so any impact must be controlled for in a meta-analysis. This is especially necessary if the meta-analysis includes data from studies using different dose rates and frequency of use. These effects can be at least partly controlled for by the inclusion of total dose rate, dose frequency, and combinations of quadratic and interaction terms between these variables to capture any PK/PD-related non-linearity in response. Whilst it is preferable for necessary PK/PD characteristics of feed additives to be known in advance and for this knowledge to help guide the design of suppression studies and to optimise drug delivery systems, these are rarely studied. There are few published studies on rumen additive pharmacokinetics and pharmacodynamics. The analytical method that we present provides effective control for any pharmacokinetic- and/or pharmacodynamic-related non-linearity in the rumen methane suppression response. An important implication is that relative and not absolute methane suppression is analysed, and this further supports combining studies ranging from single-dose delivery to continuous infusion administrations in the meta-analysis. The use of a logistic transformation ensures that the relative suppression can only lie within the biologically plausible range of 0%–100% suppression. The meta-analysis must also examine other (non-feed-additive) predictors that may modify rumen methane production. The set of non-feed-additive predictor variables would ideally be identified in advance, which in turn should help set the meta-analysis’s study inclusion/exclusion criteria. Individual studies that did not record important non-feed-additive variables may be excluded from the meta-analysis and this potentially limits the generalisation of expected rumen methane suppression effects to only the specific production systems and use scenarios analysed within the meta-analysis. We recommend this approach as the standard for meta-analyses.
The raw data supporting the conclusions of this article will be made available by the authors, without undue reservation.
RS: Conceptualization, Formal analysis, Investigation, Methodology, Project administration, Validation, Visualization, Writing – original draft, Writing – review & editing. TW: Conceptualization, Methodology, Writing – original draft, Writing – review & editing, Formal analysis. GH: Formal analysis, Methodology, Writing – original draft, Writing – review & editing. AM: Writing – original draft, Writing – review & editing, Data curation, Resources. RE: Resources, Writing – original draft, Writing – review & editing, Conceptualization, Funding acquisition, Methodology, Supervision, Visualization.
The author(s) declare financial support was received for the research, authorship, and/or publication of this article. The lead author was funded by the University of Melbourne to assist in this research.
Author RS was employed by the company Herd Health Pty Ltd. Author TW was employed by the company Djanowot Pty Ltd. Author GH was employed by the company Statistical Consulting Centre.
The remaining authors declare that the research was conducted in the absence of any commercial or financial relationships that could be construed as a potential conflict of interest.
All claims expressed in this article are solely those of the authors and do not necessarily represent those of their affiliated organizations, or those of the publisher, the editors and the reviewers. Any product that may be evaluated in this article, or claim that may be made by its manufacturer, is not guaranteed or endorsed by the publisher.
Almeida A. K., Hegarty R. S., Cowie A. (2021). Meta-analysis quantifying the potential of dietary additives and rumen modifiers for methane mitigation in ruminant production systems. Anim. Nutr. 7, 1219–1230. doi: 10.1016/j.aninu.2021.09.005
Alvarez-Hess P., Jacobs J., Kinley R., Roque B., Neachtain A., Chandra S., et al. (2024a). Effects of a range of effective inclusion levels of asparagopsis armata steeped in oil on enteric methane emissions of dairy cows. Anim. Feed Sci. Technol. 310, 115932. doi: 10.1016/j.anifeedsci.2024.115932
Alvarez-Hess P., Thomson A., Williams S., Logan A., Taylor C., Singh T., et al. (2024b). The influence of feeding canola oil steeped asparagopsis armata on resulting fatty acid profile and dairy processing properties of cow’s milk. Anim. Feed Sci. Technol. 310, 115924. doi: 10.1016/j.anifeedsci.2024.115924
Beauchemin K., Maekawa M., Christensen D. (2002). Effect of diet and parity on meal patterns of lactating dairy cows. Can. J. Anim. Sci. 82, 215–223. doi: 10.4141/A01-080
Bhusal P., Lay M. C., Kraakman K. L., Corbett G. E., Gladden N. R. (2024). Pharmacokinetics of bromoform in dairy heifers. New Z. Vet. J. 72, 183-190. doi: 10.1080/00480169.2024.2330914
Bjornsson T. D. (1997). Practical uses of individual pharmacokinetic parameters in drug development and clinical practice: examples and simulations. Eur. J. Drug Metab. Pharmacokinet. 22, 1–14. doi: 10.1007/BF03189779
Borgert C., Fuentes C., Burgoon L. (2021). Principles of dose-setting in toxicology studies: the importance of kinetics for ensuring human safety. Arch. Toxicol. 95, 3651–3664. doi: 10.1007/s00204-021-03155-4
Charmley E., Williams S. R. O., Moate P. J., Hegarty R. S., Herd R. M., Oddy V. H., et al. (2015). A universal equation to predict methane production of forage-fed cattle in Australia. Anim. Product. Sci. 56, 169–180. doi: 10.1071/AN15365
Cornish-Bowden A. (2015). One hundred years of Michaelis–Menten kinetics. Perspect. Sci. 4, 3–9. doi: 10.1016/j.pisc.2014.12.002
Cottle D., Eckard R. (2018). Global beef cattle methane emissions: yield prediction by cluster and meta-analyses. Anim. Product. Sci. 58, 2167–2177. doi: 10.1071/AN17832
Goopy J. P., Korir D., Pelster D., Ali A., Wassie S. E., Schlecht E., et al. (2020). Severe below-maintenance feed intake increases methane yield from enteric fermentation in cattle. Br. J. Nutr. 123, 1239–1246. doi: 10.1017/S0007114519003350
Kebreab E., Bannink A., Pressman E. M., Walker N., Karagiannis A., van Gastelen S., et al. (2023). A meta-analysis of effects of 3-nitrooxypropanol on methane production, yield, and intensity in dairy cattle. J. dairy Sci. 106, 927–936. doi: 10.3168/jds.2022-22211
Macdonald A., Hepworth G., Eckard R. (2024). Quantifying the effect of 3-nitrooxypropanol on methane emissions from confinement fed bovines: A meta-analysis. [in press] doi: 10.2139/ssrn.4765733
Ranga Niroshan Appuhamy J., Strathe A., Jayasundara S., Wagner-Riddle C., Dijkstra J., France J., et al. (2013). Anti-methanogenic effects of monensin in dairy and beef cattle: A meta-analysis. J. Dairy Sci. 96, 5161–5173. doi: 10.3168/jds.2012-5923
R Core Team. (2024). R: A Language and Environment for Statistical Computing (Vienna, Austria: R Foundation for Statistical Computing).
Riviere J. E., Papich M. G. (2018). Veterinary pharmacology and therapeutics (Hoboken, USA: John Wiley & Sons).
Shankar R., Pathak K. (2023). “An update on pharmacokinetic models,” in Recent advances in pharmaceutical innovation and research. Ed. Singh P. P. (Singapore:Springer Nature Singapore), 395–412. doi: 10.1007/978-981-99-2302-116
Toutain P. L., Lees P. (2004). Integration and modelling of pharmacokinetic and pharmacodynamic data to optimize dosage regimens in veterinary medicine. J. Vet. Pharmacol. Ther. 27, 467–477. doi: 10.1111/j.1365-2885.2004.00613.x
Williams S., Neachtain A. O., Chandra S., Burgess R., Labaf S., Aylward G., et al. (2024). The effects of feeding liquid or pelleted formulations of asparagopsis armata to lactating dairy cows on methane production, dry matter intake, milk production and milk composition. Anim. Feed Sci. Technol. 309, 115891. doi: 10.1016/j.anifeedsci.2024.115891
Keywords: rumen additives, pharmacokinetics, efficacy, methane, model, meta-analysis
Citation: Shephard R, Whittem T, Macdonald A, Hepworth G and Eckard R (2024) A meta-analytical approach for estimating methane suppression from dietary additives in ruminants. Front. Anim. Sci. 5:1451266. doi: 10.3389/fanim.2024.1451266
Received: 18 June 2024; Accepted: 08 October 2024;
Published: 08 November 2024.
Edited by:
Fred Provenza, Utah State University, United StatesReviewed by:
Ravikanth Reddy Poonooru, University of Missouri, United StatesCopyright © 2024 Shephard, Whittem, Macdonald, Hepworth and Eckard. This is an open-access article distributed under the terms of the Creative Commons Attribution License (CC BY). The use, distribution or reproduction in other forums is permitted, provided the original author(s) and the copyright owner(s) are credited and that the original publication in this journal is cited, in accordance with accepted academic practice. No use, distribution or reproduction is permitted which does not comply with these terms.
*Correspondence: Richard Shephard, cmljaGFyZC5zaGVwaGFyZEB1bmltZWxiLmVkdS5hdQ==
Disclaimer: All claims expressed in this article are solely those of the authors and do not necessarily represent those of their affiliated organizations, or those of the publisher, the editors and the reviewers. Any product that may be evaluated in this article or claim that may be made by its manufacturer is not guaranteed or endorsed by the publisher.
Research integrity at Frontiers

Learn more about the work of our research integrity team to safeguard the quality of each article we publish.