 Caspar Matzhold
 Katharina Schodl
 Peter Klimek
 Franz Steininger
 Christa Egger-Danner
94% of researchers rate our articles as excellent or good
Learn more about the work of our research integrity team to safeguard the quality of each article we publish.
Find out more
METHODS article
Front. Anim. Sci., 12 September 2024
Sec. Precision Livestock Farming
Volume 5 - 2024 | https://doi.org/10.3389/fanim.2024.1421299
This article is part of the Research TopicExploring Novel Data Sources to Improve Health and Welfare in Dairy CattleView all 7 articles
In the domain of precision livestock farming, the integration of diverse data sources is crucial for advancing sustainability and evaluating the implications of farm management practices on cow health. Addressing the challenge of data heterogeneity and management diversity, we propose a key-feature-based clustering method. This approach, merging knowledge-driven feature selection with unsupervised machine learning, enables the systematic investigation of management effects on cow health by forming distinct clusters for analysis. Utilizing data from 3,284 Austrian farms, including 80 features related to feeding, milking, housing, and technology systems, and health information for 56,000 cows, we show how this methodology can be applied to study the impact of technological systems on cow health resulting from the incidence of veterinary diagnoses. Our analysis successfully identified 14 distinct clusters, further divided into four main groups based on their level of technological integration in farm management: “SMART,” “TRADITIONAL,” “AMS (automatic milking system),” and “SENSOR.” We found that “SMART” farms, which integrate both AMS and sensor systems, exhibited a minimally higher disease risk for milk fever (OR 1.09) but lower risks for fertility disorders and udder diseases, indicating a general trend toward reduced disease risks. In contrast, farms with “TRADITIONAL” management, without AMS and sensor systems, showed the lowest risk for milk fever but the highest risk of udder disease (OR 1.12) and a minimally higher incidence of fertility disorders (OR 1.07). Furthermore, across all four groups, we observed that organic farming practices were associated with a reduced incidence of milk fever, udder issues, and particularly fertility diagnoses. However, the size of the effect varied by cluster, highlighting the complex and multifactorial nature of the relationship between farm management practices and disease risk. The study highlights the effectiveness of the key-feature-based clustering approach for high-dimensional data analyses aimed at comparing different management practices and exploring their complex relationships. The adaptable analytical framework of this approach makes it a promising tool for planning optimizing sustainable and efficient animal husbandry practices.
In dairy farming, evaluating farm management practices in relation to cattle health is both complex and critical. The complexity of livestock farming increases as it continually evolves through the application of innovative technologies toward more precise farm management. This progress generates a growing volume of dynamic (e.g. daily milk yields) and static (e.g. type of housing system) information. When integrated, these various data streams offer a holistic perspective on the effects of farm management on cow health (Berckmans, 2014). However, the assessment of the impact of different management practices on cattle health is often based on a limited amount of information. The lack of holistic farm management analyses that integrate several types of static information with dynamic data is likely attributed to challenges of data collection (Cabrera et al., 2019). In particular, reliable information on management practices and farm equipment, often acquired through surveys, is more challenging to obtain at a large scale relative to dynamic data, which is produced by documentation systems (e.g. veterinarian diagnoses) or in real-time and extensively by sensors and automatic milking systems (AMS). A sufficiently large sample size is required for a thorough comparison of different management practices, which contributes to the fact that such analyses are less often conducted on the basis of large datasets. Alongside data collection, a methodological challenge arises in handling the analysis of large datasets aggregated at farm level. The inherent heterogeneity of farm data and the diversity of different farm management practices make it challenging to categorize farms based on their management practices for systematic studies. When grouping farms based on their management practices, we can distinguish between two approaches: knowledge-based and machine learning-based grouping.
In the traditional knowledge-based approach farms are grouped based on one or more pre-selected distinguishing management practices (features) and differences can be assessed between farms with different (inter-group analysis) or similar (intra-group analysis) features. Inter-group analysis is used to examine differences between farms of different groups (e.g. comparison of animal welfare in tie- and free-stall housing systems (Popescu et al., 2014). Conversely, intra-group analysis serves as a qualitative benchmarking tool by comparing farms that are more similar, such as those exclusively utilizing free-stall barns, and further distinguishing them based on other criteria like production level (von Keyserlingk et al., 2012). A knowledge-based selection of groups to analyze has the potential to investigate specific relationships of interest. However, this approach falls short in addressing complexity as it tends to isolate the individual effects of features or pre-defined relationships, neglecting the potential to reveal unexpected interactions between them. Alternative knowledge-based approaches use a rule-based assignment strategy grouping based on multiple traits (Mavura et al., 2022), which allows to address the increasing complexity of available data for analysis. Nevertheless, knowledge-based grouping faces the challenge of balancing the number of grouping features and the resulting group size. Too many features can lead to many groups with the risk of over-fitting the data, whereas a selection of a low number of features can lead to a broad grouping that carries the risk of confounding effects. As the implementation of Precision Livestock Farming (PLF) systems, such as AMS and sensor technologies, introduces novel features, the dimensionality of data for farm management analysis expands. This expansion requires innovative grouping methods, such as (unsupervised) machine learning approaches, which are tailored to high-dimensional data sets.
Machine learning (ML) approaches aim to overcome challenges arising from high-dimensional data and the necessity to pre-select only relevant features by adopting a holistic approach, which utilizes all features to classify groups. These approaches encompass unsupervised techniques for dimension reduction, such as Principal Component Analysis (PCA) or Uniform Manifold Approximation and Projection (UMAP), as well as clustering methods like K-Means or Hierarchical Density-Based Spatial Clustering of Applications with Noise (HDBSCAN). In a previous study we showed how a UMAP-HDBSCAN clustering method, which is a combination of both, can be used to improve the classification process (Matzhold et al., 2021). Unsupervised methods are particularly useful in discovering new patterns as they operate without predetermined assumptions, allowing the algorithm to extract insights directly from the dataset. By leveraging all available data instead of selecting only specific features for clustering, this method has the potential to reveal novel insights. However, this approach often lacks “discriminatory power” to effectively distinguish between different patterns. In contrast to a supervised approach, an unsupervised approach is more likely to produce contradictory results, such as the simultaneous occurrence of mutually exclusive features within a single cluster, e.g. tie- and free-stalls. This lack of discriminatory power impairs the accuracy required to effectively separate and evaluate different management practices and thus reduces the potential to gain practically meaningful insights. To overcome the challenges associated with grouping high-dimensional data and to achieve an optimal balance between the number of features and group size, a combination of both approaches, knowledge-based and machine learning-based, should be considered. For instance, Nyambo et al. (2019), demonstrated how an initial knowledge-based selection of several criteria, followed by machine learning methods such as PCA, enables the identification of homogeneous clusters describing certain farm management practices.
The objective of this study was to demonstrate the effectiveness of a key-feature-based clustering approach to evaluate the impact of different management practices on cow health, emphasizing the role of technology. In particular, we aim to explore how management practices that incorporate AMS and sensor technologies affect cow health. Building on an earlier study using unsupervised clustering (Matzhold et al., 2021) we apply a key-feature-based clustering methodology that integrates a knowledge-driven selection of crucial features with unsupervised ML techniques to enhance discriminative power. Key-features, which greatly influence farm management (e.g. housing system or altitude) are identified to enable a precise differentiation and meaningful comparisons across varying farm management types. By selecting key-features, the dataset used for cluster analysis is reduced, which improves the ability to distinguish between clusters and effectively solves the problem of discriminatory power. This delineation is essential for further analysis aimed at a more comprehensive assessment of the impact of farm management practices on cow health, through analysis between different clusters or groups of clusters (inter-group analysis) and within a particular cluster or group (intra-group analysis).
The dataset used for the analysis encompasses data from 3,284 farms in Austria with a total of 104,259 cows, covering the period from January 1, 2020, to November 30, 2021. This dataset was created by merging two different datasets: one dataset containing information on farm management practices and equipment (hereafter referred to as the “farm dataset”) and another dataset containing information on health events (hereafter referred to as the “health dataset”), both aggregated at farm level.
The farm dataset comprised a total of 52 features including an identifier (ID), 4 numeric features, 47 character features with varying levels of expression. All features are updated annually by Dairy Herd Improvement (DHI) employees to ensure verification of current conditions on the farms. To assure the integrity and logical consistency of character features, a rule-based validation process was developed. For instance, discrepancies such as a farm marked negatively for “access to open areas” but positively for open areas ground conditions (“natural” or “solid”), a DHI employee was consulted to resolve the discrepancy. To enable a more detailed analysis of categorical features, i.e. features with more than two levels, we applied one-hot encoding. One-hot encoding converts categorical features into a binary format, creating separate binary features for each level of the original category. For example, instead of having a single categorical feature “Housing system”, one-hot encoding creates distinct binary features such as “Free-stall housing system” and “Tie-stall housing system”.
Numeric features such as the number of lying, eating, and milking places were checked for plausibility. For example farms using AMS were expected to have only 1 or 2 milking places equaling the number of AMS. Other numeric features, such as altitude, have been scrutinized for plausibility concerning Austrian geography and entries above 2000 meters have been excluded. To ensure a meaningful comparison across farms, we included only those with a minimum herd size of 10 cows. For herds exceeding 300 animals, we verified accuracy by cross-referencing case number entries with other databases, such as databases containing information from annual reports on farm performance. Additionally, the farm dataset has been enriched with annual data on average milk yield and cell count, derived from yearly farm performance reports and averaged over a two-year period. These metrics, considered reliable, were not subjected to further validation. They have been integrated as they serve as supplementary indicators for estimating farm productivity through milk yield and cow health through cell counts. In the data cleaning process, we further checked for information completeness of each feature, keeping only features with at least 80 percent information content in the analysis. Post-cleaning and one-hot encoding, the final farm dataset consisted of 80 features providing information on feeding, milking, housing systems, general farm management (organic or conventional), husbandry management (such as whether cows have access to pastures or if calves are raised on the farm), and information on the application of novel technologies like sensor systems or AMS. A detailed description of the data cleaning and filtering methodology is provided in the Supplementary Materials, ensuring transparency and replicability of the research process (Supplementary Table S1).
The health dataset for this analysis was extracted from the national cattle database. Information from this database follows the documentation protocols outlined by Egger-Danner et al. (2012), which ensures high quality through standardized and validated procedures and in compliance with legal requirements as stipulated by the Veterinary Medicinal Products Law. From this comprehensive dataset, we extracted veterinary diagnoses and documented events recorded specifically during calving observations, providing additional information on cases of mastitis and on standard postpartum behaviors. Within the scope of this analysis, all data collected from these sources is uniformly labeled as “diagnosis,” irrespective of its initial classification or source. For all cow-based health events that occurred from 2020 to 2021, only the first occurrence of a specific diagnosis was counted to mitigate biases related to chronically ill animals causing multiple entries. The health information was further aggregated at farm level. In addition, health data of a farm was only classified as valid if at least 10 percent of the herd had a veterinarian diagnosis within one year, and only first diagnoses were considered. To gain a more comprehensive understanding of disease complexes, diagnostic codes describing similar diseases were grouped into three main categories: udder diseases, milk fever, and fertility disorders. Acute mastitis and chronic mastitis were combined under the collective term “udder diseases”, while a range of reproductive disorders – including uterus inflammation, anestrous, ovarian cysts, retained placenta, and puerperal disorder – were grouped together as fertility disorders.
A key-feature is defined as a crucial factor that influences the choice or possibilities for management practices on a farm. Key-features were selected based on existing knowledge of important farm management factors, aligning with our research interests in investigating the influence of technological systems, particularly AMS and sensor systems. This selection led to the identification of the following eight key-features that form our dataset for cluster analysis:
● Herd size
To distinguish farms by their operational scale, separating small from large farms. Larger herd sizes present challenges in monitoring individual animal health and managing disease outbreaks, impacting overall cow health (Beggs et al., 2015).
● Average milk yield per year
To distinguish farms based on their milk production intensity. High milk yield can be associated with increased health risks, such as ketosis (Stengärde et al., 2012) and fertility disorders (Lucy, 2007).
● Altitude
To distinguish farms based on their altitude allows for distinctions to be made regarding climatic and spatial conditions. Altitude indirectly indicates whether cows are exposed to high temperatures, with heat stress being a known risk factor (Badinga et al., 1985). The location of a farm also determines whether cows can access alpine pastures and impacts the feeding ratio composition.
● Pasture access
To distinguish farms based on their ability to provide cows with pasture access, influencing feeding strategies and physical activity. Pasture access can contribute to better overall cow health and welfare offering benefits such as more freedom for movement and lower stress levels (Schuppli et al., 2014; Ghassemi Nejad et al., 2021).
● Access to open areas
To distinguish farms based on open area availability, which impacts the physical activity and welfare of a cow, for example, increased mobility improves estrus detection (Roelofs et al., 2005).
● Free-stall housing system
To distinguish between different housing systems, such as free- versus tie-stall. Housing systems can impact cow health by providing animals with more freedom to move, potentially reducing the incidence of injuries and improving welfare (Beaver and Weary, 2021).
● Automatic milking system (AMS)
To distinguish farms based on the use of automatic versus traditional milking systems. The AMS can influence cow health through reduced stress during milking and potentially improved milking hygiene (Hogenboom et al., 2019). The adoption of AMS has been associated with a lower risk of mastitis and improved animal welfare, although the outcomes can vary depending on management practices (Karttunen et al., 2016).
● Sensors
To distinguish farms that use sensor technology for herd monitoring and management, this analysis exclusively considers animal-mounted sensor systems, which record e.g. behavior and/or physiological measurements. The application of these sensor systems enables more precise farm management practices, improving production efficiency and animal health. For example, sensor-triggered alerts can help identify health problems more easily (Stygar et al., 2021).
Through this selection, we reduced the complexity, i.e., dimensionality, of the data. Numeric key-features, such as herd size and average milk yield and altitude, were normalized to ensure a consistent comparison across different scales. In a next step, the similarities of the dataset were assessed by creating a similarity matrix.
Within the key-feature-established dataset, similarity between individual farms is assessed through statistical methods using cosine similarity for numerical data and Jaccard similarity for binary data. Jaccard similarity is particularly suitable for binary data where each element is present or absent. Cosine distance, on the other hand, is a metric used for quantifying the similarity between two numeric vectors. Both similarity measurements are frequently used, particularly in text analysis. Combining both similarity measurements is expected to increase the overall similarity value (Zahrotun, 2016). The resulting similarity vectors, where each farm is represented by a combined similarity vector, formed the basis of the similarity matrix. This matrix was then converted into a dissimilarity metric to facilitate further cluster analysis.
The HDBSCAN algorithm (Campello et al., 2013; McInnes and Healy, 2017) is a density-based hierarchical clustering method designed to transform data into relatively homogeneous groups of similarity, i.e., clusters. The underlying principle of density-based data analysis techniques is based on the assumption that the data is a sample from an unknown probability density function, describing the mechanism or mechanisms responsible for generating the observed data (Campello et al., 2015). Unlike other clustering methods such as K-Means, HDBSCAN does not require specifying the number of clusters to extract. Instead, it relies on defining a minimum distance and/or a minimum number of data points to form a cluster. In this analysis, we evaluated several parameters for the minimum cluster size and determined that 32 farms were optimal. This configuration ensured an adequate sample size within each cluster, facilitated robust statistical analysis, and resulted in a sufficient number of distinguishable clusters, allowing for the examination of differences between them. HDBSCAN was chosen because it facilitates cluster formation, as the algorithm automatically handles the assignment of points to clusters. This streamlines the clustering process without the necessity for manual intervention in determining the relevance of feature combinations. HDBSCAN was applied to the dissimilarity matrix transformed from the similarity matrix to extract clusters. The obtained clusters were then further grouped based on our main research interest, the level of technological integration on the farm (e.g., AMS, SENSOR). This grouping allowed us to assess the effects of individual key-features, such as the use of AMS or sensor systems, at a group level.
In addition, a supervised clustering procedure was applied as an alternative approach to extract clusters. Utilizing the similarity matrix, various thresholds ranging from 0.80 to 0.95 were employed to cluster similar farms. Both methodologies – supervised clustering and unsupervised clustering – produced comparable results i.e. a similar number of clusters. However, since the supervised approach requires extensive manual review, which can be performed more effectively by an unsupervised method, we chose the unsupervised approach. This strategy not only simplifies the determination of the optimal number of clusters but also improves the feasibility of future analyses based on selected key-features. The script containing the code for the clustering procedure is provided in the Supplementary Material Section 4: R Code. All data analyses were performed using R (version 4.3.2) with the following libraries: data.table and lubridate for data manipulation, proxy and dbscan for computations, and ggplot2 and cowplot for data visualization.
The assessment of disease risks and pertinent features was conducted using a similar methodology as implemented in our previous study on farm-risk-profiles (Matzhold et al., 2021). Variations in the frequency of diagnoses served as an approximation of the disease risk. Consequently, the term “disease risk” in this context refers to the probability of a diagnosis occurring. Disease risks were evaluated by determining the incidence rate (R) and odds ratios (OR) for each disease across both cluster groups and individual clusters. Disease incidence rate was determined according to the following formula:
where:
– i denotes a specific population group, which can be a cluster, a group of clusters, or the whole population.
– j denotes a disease group.
– is the sum of unique diagnoses of disease j within population i throughout the entire two-year observation period.
– represents the herd size for population i, with memberships estimated based on the number of days a cow is fed.
To mitigate the risk of bias toward cows with chronic illnesses, multiple diagnoses of the same disease in a single cow were counted as one (unique) positive case. The association of a cow with a farm was determined based on feeding days, which enables a more accurate estimate of the number of cows associated with the farm. Note that our approach, which involves aggregating multiple health data collected over a two-year period and grouping similar health events, might result in higher incidence rates compared to other studies (Egger-Danner et al., 2020). However, it provides a more comprehensive overview of specific health groups by linking as much information as possible.
The cluster or cluster group with the lowest disease incidence rate was used as a reference for OR calculation for other clusters. The OR is computed by the formula:
where:
– i denotes a specific population group, which can be a cluster or a group of clusters.
– j denotes a disease group.
– and denote the sum of unique diagnoses in population i and in the population with the lowest incidence rate, respectively.
– and represent the herd sizes for population i and the population with the lowest incidence rate, respectively.
ORs and significance levels were derived using a one-sided Fisher’s exact test.
To investigate the characteristics of a cluster, we evaluated the pertinent features by computing the z-scores for each cluster’s features. The z-score is computed by the formula:
where:
– i denotes a specific population group, which can be a cluster or a group of clusters.
– is the mean of a given feature within i.
– is the global mean of the feature across all populations.
– is the standard deviation of the feature across all populations.
A high z-score suggests that a factor is highly relevant for characterizing a cluster. Statistical significance was assessed using a 2-sided t-test or Fisher’s exact test.
To assess the impact of the numerical features, we performed an additional statistical analysis to complement the z-score evaluations. We conducted a two-tailed t-test for comparisons between two groups and an ANOVA for comparisons between more than two groups. An initial visual inspection of the distribution of individual features indicated deviations from normality for some features. Consequently, we also performed a Kruskal-Wallis test to validate the t-test results. Results were considered significant if p.values p ≤0.05.
To assess the impact of farm management practices on cow health, disease risk (Equations 1, 2) and pertinent feature (Equation 3) assessments were conducted across different groups of clusters (inter-group analysis), as well as within a specific cluster group (intra-groupanalysis). Inter-group analysis is applied to compare the impacts of different farm management practices on cow health. This analysis examines the relationship between key-features, i.e., features with high discriminatory power, especially those relevant to the research interest, and their impact on disease incidence in different clusters. The effects are assessed both at group level by comparing different cluster groups and at individual cluster level by comparing individual clusters between these groups. To deepen our understanding of the impact of farm management practices on cow health beyond the key-features, an intra-cluster analysis was performed. In this analysis, investigations are carried out within a group, i.e., between clusters that show similarities in the key-features. The aim was to uncover and explore the effects of feature interactions and their impact on cow health.
Furthermore, numerical features were compared to gain additional insights that assist in more accurately classifying and distinguishing farm management types. Metrics such as cow count, average milk yield, altitude, and cell count were used to evaluate farm size, dairy farming intensity, climatic influences on farming techniques, and cattle health indicators. We report the mean and standard deviation to highlight the central tendencies of these metrics. In addition, box plots were created to assess variability and identify outliers within the numerical features.
The results obtained from the key-feature-based clustering indicated that we can differentiate among 14 distinct clusters. These clusters were further categorized into four distinct groups based on their technological integration in farm management: The “TRADITIONAL” group, where AMS nor sensor systems are incorporated; “AMS” or “SENSOR” group, each characterized by the exclusive use of one of these technologies; and the “SMART” category, where both AMS and sensor systems are synergistically integrated, representing the most technologically advanced cohort in our study. Figure 1A illustrates the individual clusters, the number of farms, and the group relationships by color. Of the 3,284 farms analyzed, 3,101 were successfully assigned to a cluster with a satisfactory sample size (a minimum of 32 farms per cluster), allowing a comprehensive inter- and intra-group analysis of farm management practices.
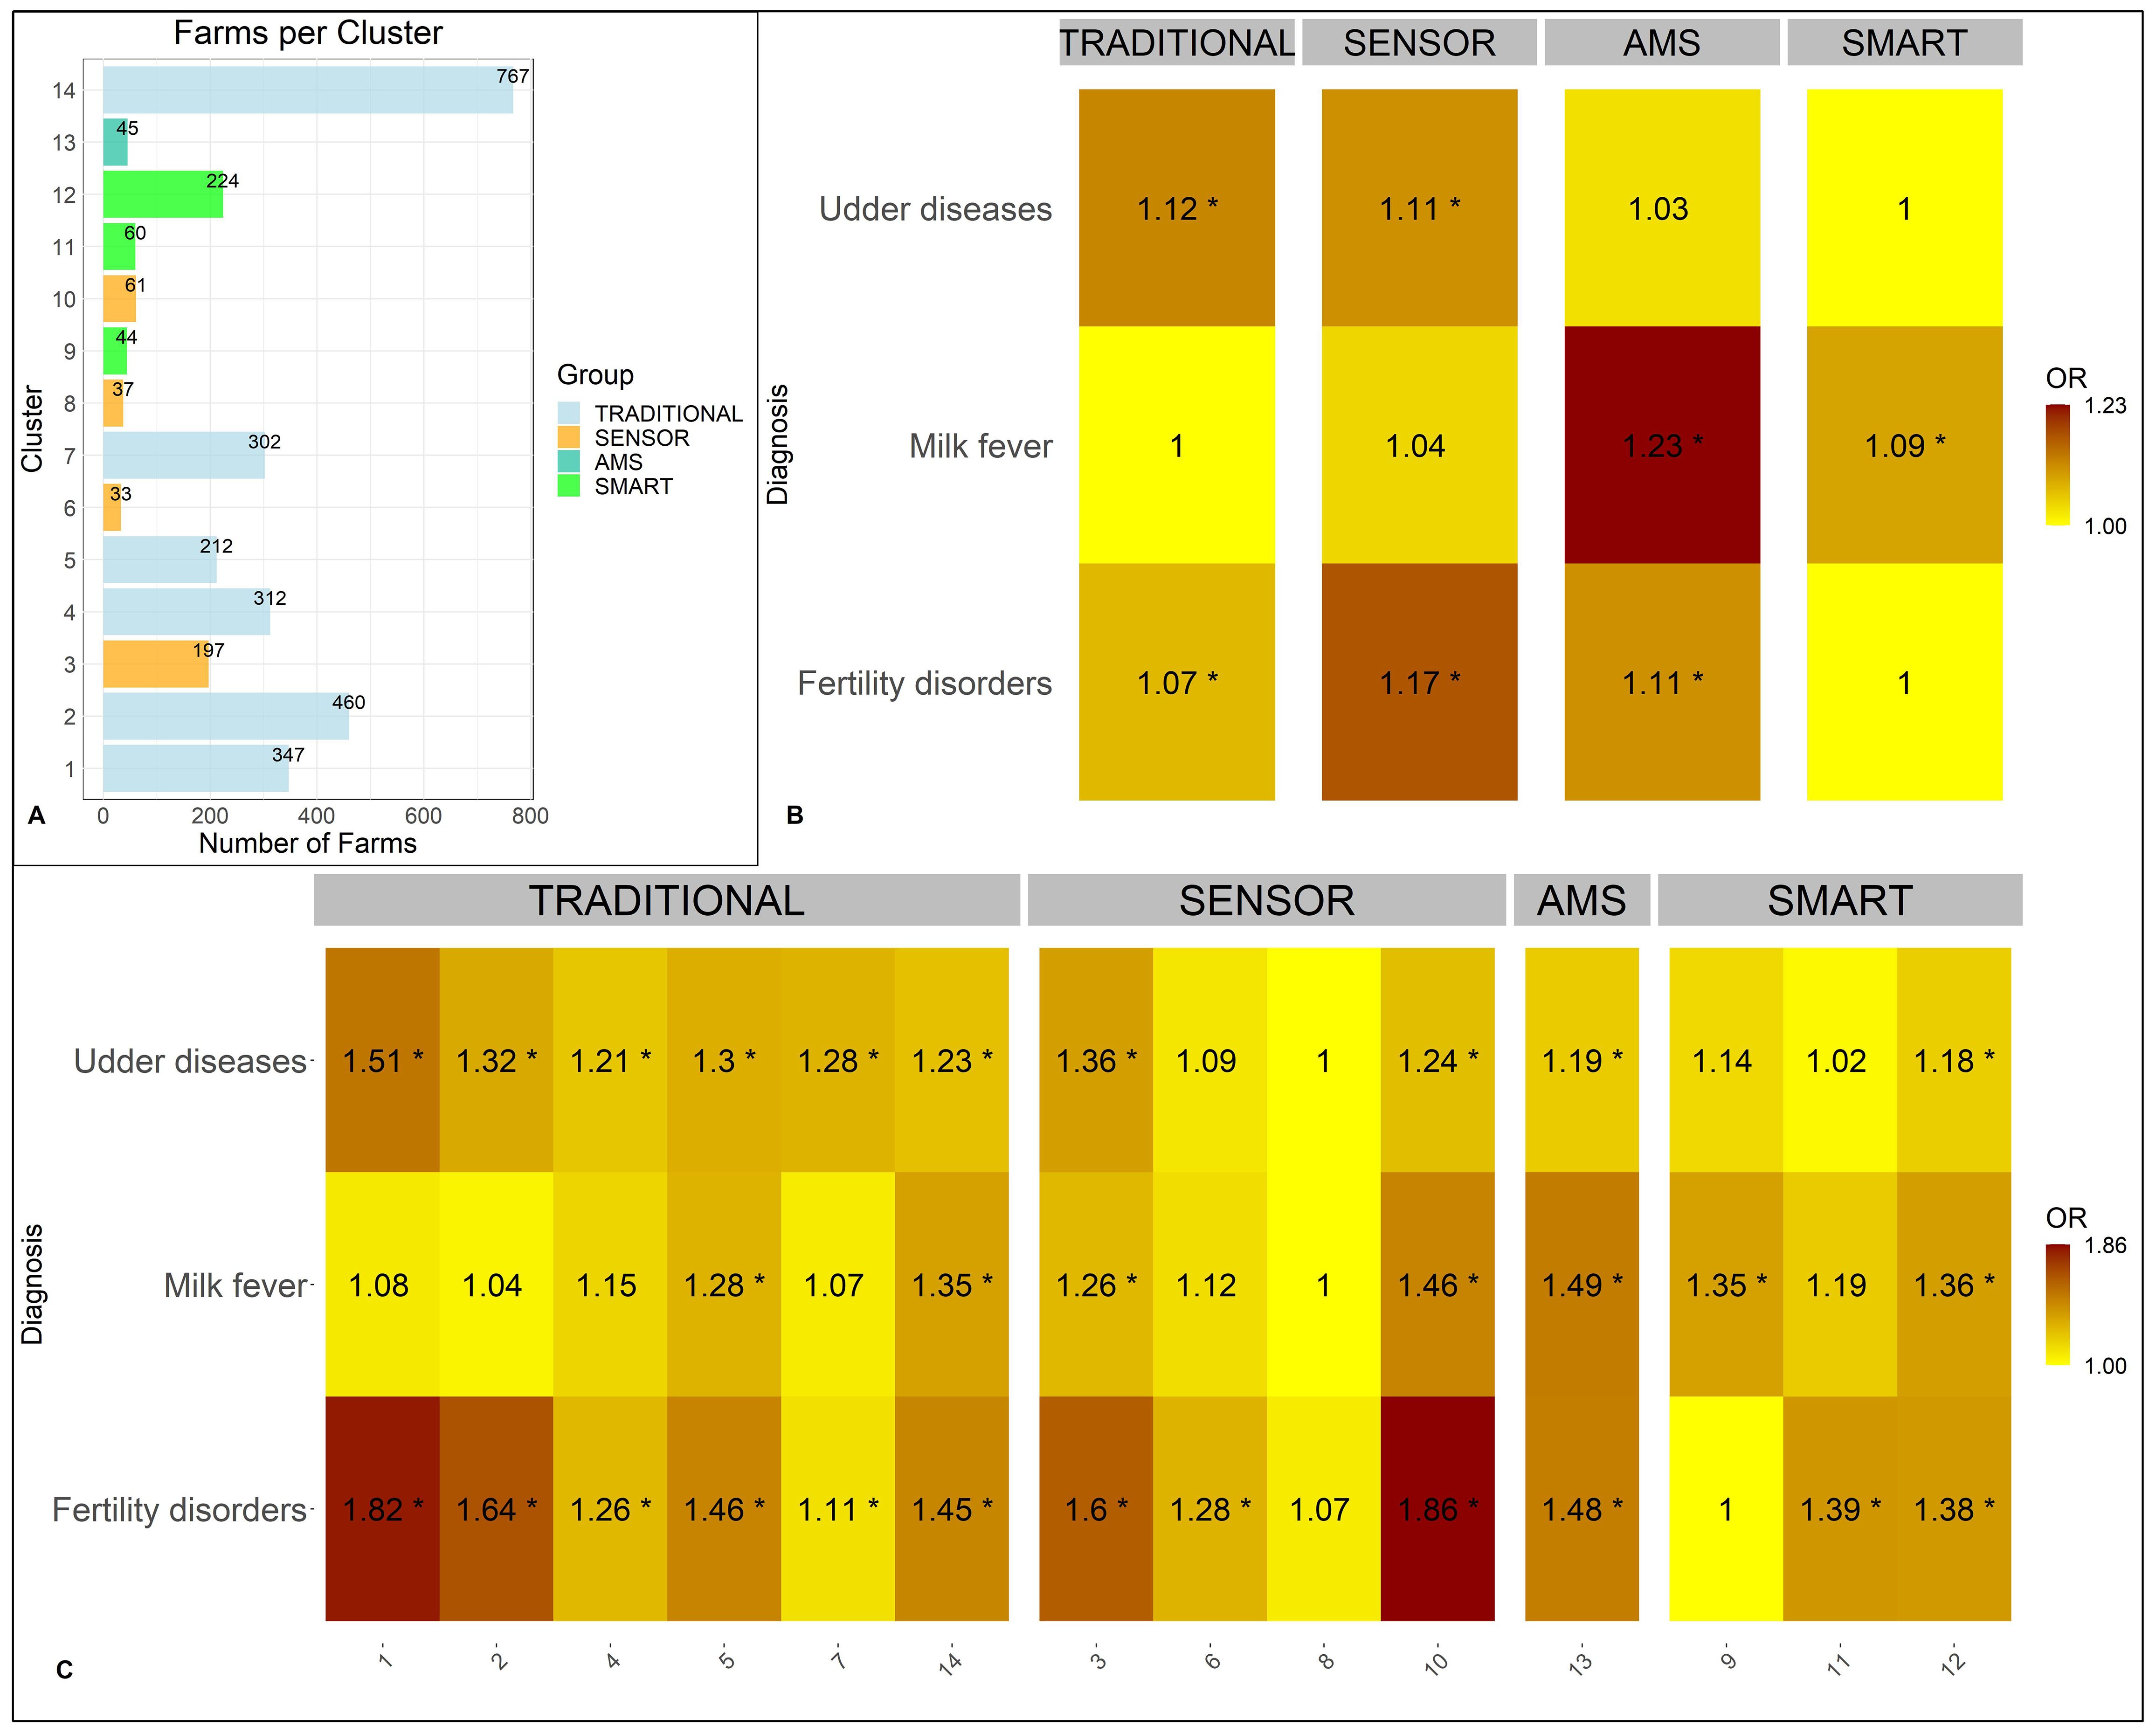
Figure 1. Inter-group analysis: cluster results (A) display the extracted clusters including the number of farms in each cluster and color-coded groups. Grouped (B) and cluster-individual (C) risks for udder diseases, milk fever, and fertility disorders are displayed as heat maps with yellow indicating the lowest disease incidence rate and red indicating the highest risk. Each number in the heat map corresponds to an Odds Ratio (OR), with * used to highlight results significant at p.values p ≤0.05.
In the baseline analysis, the “TRADITIONAL” group emerged as the largest group, comprising 2,400 farms (77.39%). Among all farms, 373 are equipped with an AMS system. The smallest group within this subset is the “AMS” group, which includes 45 farms (1.45% of total number of farms). The remaining 328 AMS-equipped farms also employ sensor systems, forming the “SMART” group, and representing 10.58% of all farms. The “SENSOR” group also encompasses 328 farms, constituting the remaining 10.58% of the dataset.
Investigating the disease incidence rates over a two-year period among all 98,037 cows in the dataset, the highest rate was observed for fertility disorders (39.87%) followed by udder diseases (24.40%) and milk fever (11.52%) (Supplementary Figure S1A).
The outcomes of the inter-group analysis are presented in Figure 1. Disease risks are displayed through heat maps, at a grouped level in the upper right section of Figure 1B, and at an individual level for all clusters in the lower section of Figure 1C. In the inter-group analysis we focus on key-features, specifically those used for grouping, and their impact on disease incidence.
At the cluster group level, we observed a trend toward a reduced overall disease risk in SMART farms, indicated by the lowest disease incidence rates for fertility disorders (38.80%; baseline: 39.87%) and udder diseases (22.82%; baseline: 24.4%) and a minor increased risk for milk fever (OR 1.09, p.values p ≤0.05). The group level data revealed the lowest disease incidence rate for milk fever (11.26%; baseline: 11.42%) in TRADITIONAL farm management. Nevertheless, this group also presents the highest disease risk for udder diseases (OR 1.12, p.values p ≤ 0.05) and a marginal increase in fertility disorder occurrences (OR 1.07, p.values p ≤0.05). Conversely, the highest risk for milk fever (OR 1.23, p.values p ≤0.05) was observed in the AMS group. Additionally, AMS farms exhibited an elevated occurrence of fertility disorders (OR 1.11, p.values p ≤0.05) and a moderately lower incidence rate of udder diseases (23.42%). The SENSOR group demonstrated an increased occurrence of all three diseases. It showed the highest risk for fertility disorders (OR 1.17, p.values p ≤0.05), with a moderate yet increased risk for udder diseases (OR 1.11, p.values p ≤0.05) and milk fever (OR 1.04).
On an individual cluster level, however, we observed a slightly different trend than on group level. For instance, the lowest risk for milk fever and udder diseases was observed in Cluster 8, which is assigned to the SENSOR group. This demonstrates that there is also a high variance within the individual cluster groups.
Information on the pertinent features of each cluster is provided in the Supplementary Material in the form of z-score-ranked tables for all features (Supplementary Tables S2–S29). The focus of the inter-group analysis in this study was on identifying features that reveal trends, such as recurring characteristics, and on assessing features that contribute to the understanding of the observed trends, such as metrics related to the size and performance of a farm.
The analysis of numeric features, employing means to assess central tendencies and box plots in Figure 2 to explore distributions, showed expected associations at the group level. TRADITIONAL farming was characterized by a significantly lower average yearly milk yield of 8,049 kg with a standard deviation of ±1,402 kg and a significantly smaller average herd size of 27 ± 14 cows, in contrast to clusters within the AMS, SENSOR, and SMART group. Farms in the latter three groups were situated at an average altitude of 558 ± 165 masl (meters above sea level), yielded a higher average milk production of 8,994 ± 1,181 kg per year and had larger herd sizes, averaging 48 ± 19 cows. Geographic distinctions were evident, with TRADITIONAL farming clusters located at a significantly higher average altitude of 623 ± 222 masl. Furthermore, there were notable differences in average cell counts among these clusters: Clusters within the TRADITIONAL and SENSOR groups exhibited lower average cell counts (177,000 ± 86,000 cells/ml; 177,000 ± 70,000 cells/ml, respectively), whereas the AMS and SMART clusters reported higher averages (198,000 ± 61,000 cells/ml; 206,000 ± 69,000 cells/ml, respectively). Significant differences were observed between the SMART and SENSOR clusters, as well as between the SMART and TRADITIONAL clusters.

Figure 2. Inter-group analysis: box plots of four characterizing numeric features, with color denoting group correspondence.
Aside of the observed positive impact of SMART farm management on cow health, the investigation of pertinent features revealed a trend toward decreased disease rates on farms that practice organic farming and offer cows more freedom of movement. This trend becomes apparent when comparing the pertinent features of the individual clusters that exhibit the lowest overall disease risks within their respective groups. Organic farming Clusters 7 and 8 are identified as the healthiest within their group (TRADITIONAL and SENSOR, respectively) with the third organic Cluster 9 ranking second in its group (SMART). A more in-depth discussion on pertinent features among all clusters is beyond the scope of this paper, as the inter-analysis in this study predominantly aims to provide insights into the impact of technological use on cow health.
The SMART group was selected for the intra-group analysis due to its high incorporation of technological systems in farm management. This examination aims to reveal additional factors besides the shared use of technology that contribute to effective disease risk management. The disease risks are illustrated with a heat map in Figure 3A, while the distributions of the relevant numerical characteristics are shown as box plots in Figure 3B.
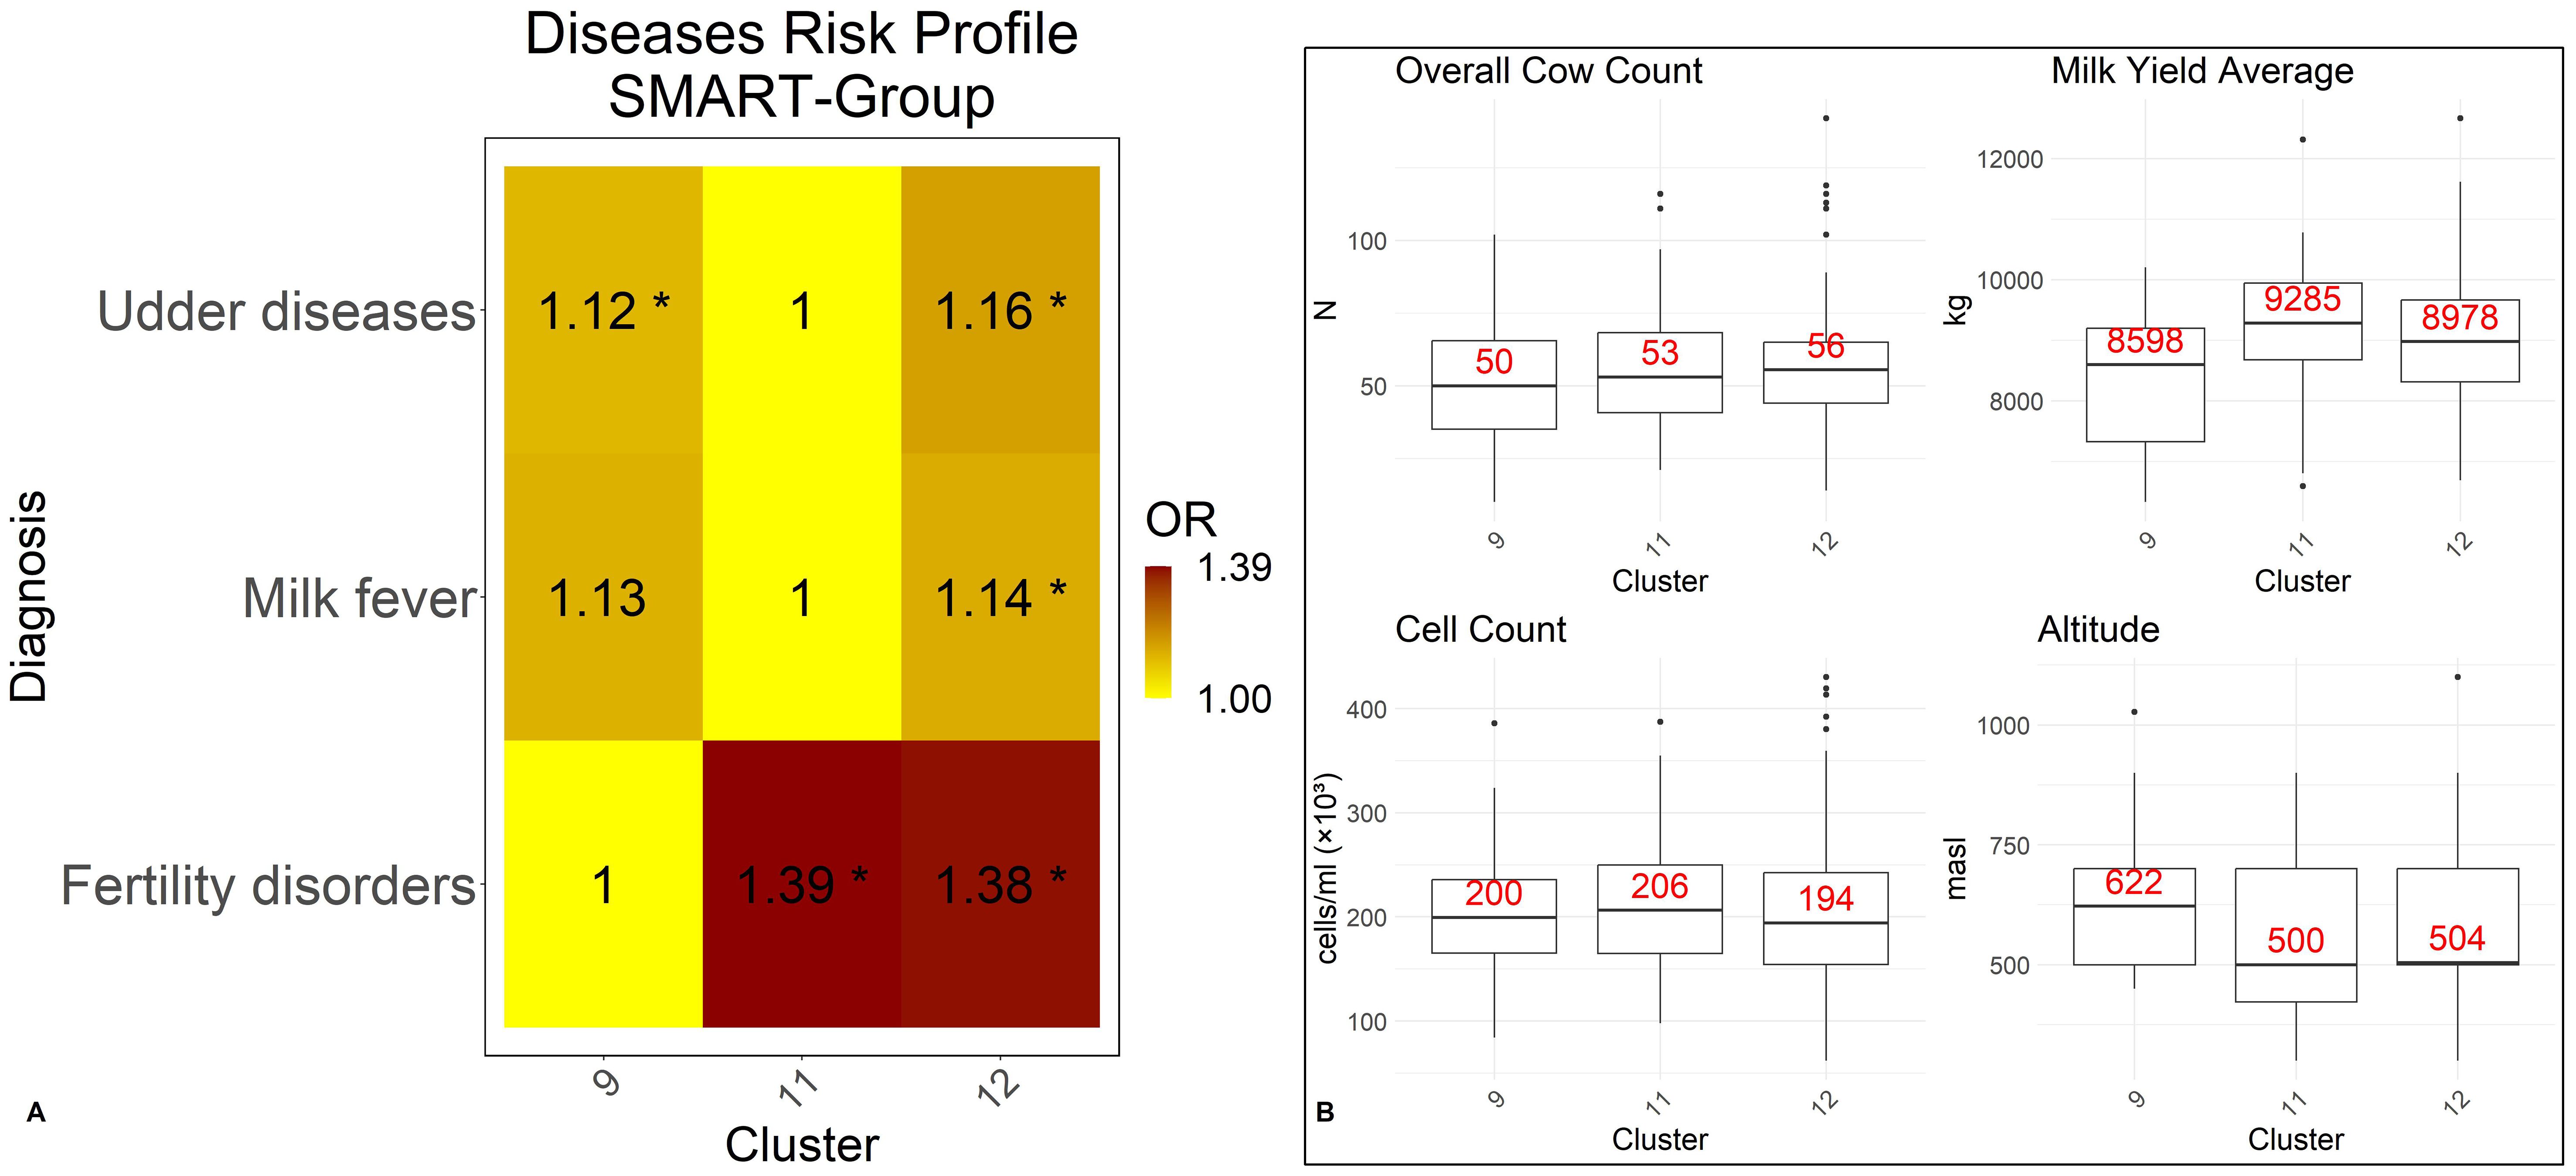
Figure 3. Intra-group analysis: disease risks (A) and box plots (B) of four characterizing numeric features. The box plots show the three quartiles, the minimum, the maximum and the median (marked in red). Disease Risks are displayed as heat maps. Yellow indicates clusters with the lowest disease prevalence (OR = 1). Orange marks for a slight increase in the risk of a disease, red for a greater increase. Each number in the heat map corresponds to an Odds Ratio (OR), with * used to highlight that results are significant at p.values p ≤0.05.
The intra-group disease risk analysis indicates that among all SMART clusters, Cluster 11 has the lowest disease incidence rate for milk fever and udder diseases (11.09% and 20.78%, respectively). However, Cluster 11 also has the highest risk for fertility disorders (OR 1.39, p.values p ≤0.05). In contrast, Cluster 9 has the lowest incidence rate of fertility disorders (31.67%) but shows a minimally higher disease risk for milk fever (OR 1.13) and udder diseases (OR 1.12, p.values p ≤0.05). Cluster 12 exhibits an increased disease risk, with the highest risk for udder diseases (OR 1.16, p.values p ≤0.05) and milk fever (OR 1.14, p.values p ≤0.05) and a higher risk for fertility disorders (OR 1.38, p.values p ≤0.05).
Results of the intra-group pertinent features assessment is provided in Table 1. Note, to facilitate the comparative analysis of cluster characteristics, only features exhibiting positive z-scores that are statistically significant (as determined by p.values p ≤0.05) are included in Table 1. Features with high z-scores are considered important in characterizing a particular cluster. Numeric feature comparison is provided in Figure 3B.
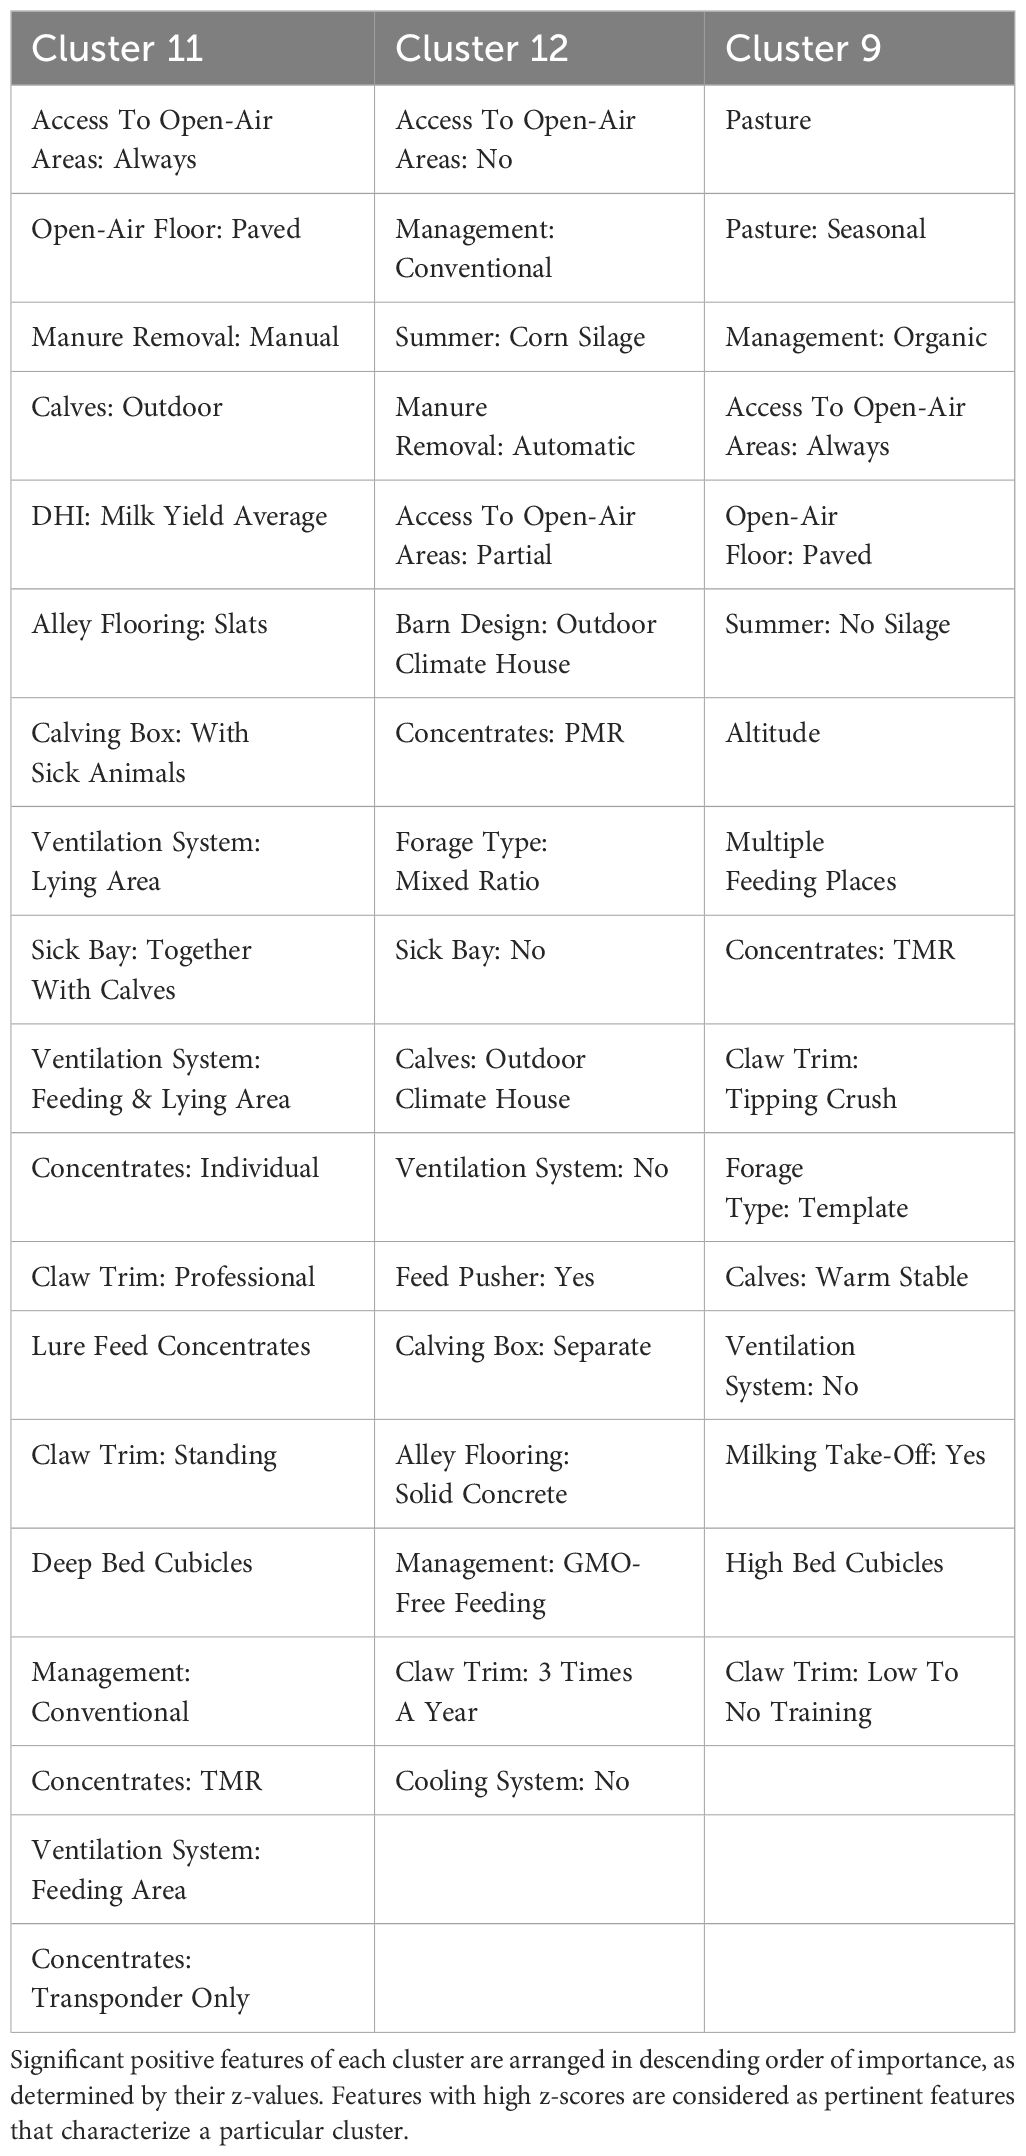
Table 1. Intra-group analysis: pertinent features comparison.
Within the SMART group, Cluster 11 describes farms located at the lowest altitudes (533 ± 160 masl) and with management practices that achieve the highest milk yield (9,284 ± 1,050 kg). The pertinent feature analysis shows that the majority of farms practice conventional management with an average herd size of 56 ± 20 cows and permanent access to open areas. Indoor conditions reveal the utilization of cooling systems within lying and eating areas, along with slatted alley flooring, and deep bed cubicles are employed for lying areas. Feeding features indicate a preference for individual concentrate feeding. Regarding health we observed an unexpected paradox: with the highest average cell count of 213,000 ± 67,000 cells/ml milk, indicative of potential mastitis (Foster et al., 2021), it simultaneously recorded the lowest incidence rate of udder diseases and milk fever.
Similar to Cluster 11, Cluster 12 describes a conventional farm management practice for farms with a similar herd size (56 ± 18 cows) and altitude (550 ± 163 masl), but with a lower average yearly milk yield (9,000 ± 1,054 kg). In contrast to Cluster 11, however, cows in Cluster 12 had only partial or no access to open areas, and no cooling systems were used in the barns. Feeding was mainly corn silage-based and concentrates were fed via partial mixed ration (PMR) including the utilization of feeding robots. Further, we observe that Cluster 12 exhibited the lowest average cell count per year at 205,000 ± 71,000 cells/ml within the SMART group, while facing the highest risks for milk fever and udder diseases. As shown in Figure 3B it is likely that some farms assigned to this cluster have significant cell count issues, contributing to this cluster having the highest overall risk, as indicated by outliers.
Farms in Cluster 9 were located at the highest altitude (633 ± 131 masl), while milk yield was lowest with averagely 8,369 ± 1,117 liters per cow and year. The smallest herd size was also observed in this cluster, with an average of 51 ± 20 cows per farm. In contrast to Cluster 11 and 12, farms in Cluster 9 were organic farms that offer more opportunities for physical activity. Cows in this cluster had access to open areas and pasture. In the context of indoor management, the utilization of lying areas with high bed cubicles was observed. As for feeding, it was characterized by the absence of silage and the use of a concentrate distribution system with transponders.
In this study, we demonstrated the use of a key-feature-based clustering approach to analyze the effects of farm management practices on cow health. We showed how this approach allows tailoring analyses to specific research questions such as the impact of technological systems on cow health. We successfully extracted 14 farm management clusters, each of which contains a sufficient sample size for meaningful further analysis. The achieved discriminatory power between the clusters enabled their classification into 4 distinct groups based on the integration of technologies: TRADITIONAL, SENSOR, AMS, and SMART. This delineation formed the basis for further analysis aimed at a more comprehensive assessment of the impact of individual farm management practices on cow health. It enabled analysis both between groups of clusters (inter-group analysis) and within a specific cluster group (intra-group analysis).
The inter-group analysis examined the relationship between farm management features with a high discriminatory power, particularly those pertinent to the research interest, and their impact on disease occurrences among different clusters. At the group level, the inter-group analysis revealed a trend toward lower disease risks in technologically advanced farms, in particular for SMART farms that combine AMS with sensor systems. Farms in the SMART group showed the lowest risk for udder diseases and fertility disorders, and only a marginal elevation in milk fever risk. Interestingly, we observed a rather unexpected increase in the risk for fertility disorders in the SENSOR group, which is contrary to the low risk in the SMART group. It can be hypothesized that especially farms with higher incidences of reproductive disorders and consequently low performance in fertility parameters install sensor systems to improve fertility. However, long-term improvements through the use of sensors may take some time, as the positive effects of sensor technology on reproductive performance requires further changes in reproductive management (Neves and LeBlanc, 2015).
On an individual level, the inter-group analysis results indicated a positive impact of organic farm management on cow health, which is consistent with research showing the benefits of organic farming practices for longevity and animal welfare (Lund and Algers, 2003; Berentsen et al., 2012). This trend is highlighted as organic farming clusters (Cluster 7, Cluster 8, Cluster 9) consistently exhibited low disease risks within their specific cluster group. Looking at the pertinent features of these clusters, our analysis suggested potential explanations for this trend, including a lower milk yield and higher altitude 2. Higher altitude is associated with more organic farming in Austria (Schneeberger et al., 2002). Higher milk yield is often associated with an increased risk of some diseases (Lasser et al., 2021). This relationship is primarily based on the negative genetic correlation between milk yield and in particular fertility disorders (Koeck et al., 2010). Due to stricter regulations concerning e.g. feeding regimes, medical drug use or pasture access in organic farming farmers may put more emphasis on fitness traits such as fertility than on milk yield when selecting cattle for breeding (Bieber et al., 2019).
However, the relationship between organic farming and cow health is not straightforward. For instance, Clusters 7 and 9 exhibit increased risks for udder infections. A possible explanation is that the restricted antimicrobial usage policy in organic farming contributes to these issues (Orjales et al., 2016). This concern is part of a larger, multifactorial risk that encompasses several factors, such as outdoor management practices, diets, or housing systems, highlighting the complexity of assessing disease risks (Wagenaar et al., 2011). The inter-group results also demonstrated the need for a more comprehensive view of disease risks, as indicated by the considerable variation both within and between the different clusters, underscoring the complexity involved in comprehending and managing these risks effectively.
The exploratory intra-group analysis was applied to examine in more detail the specific risk factors associated with cow health within an individual group of clusters. The intention was to gain insights into relationships that go beyond key-feature associations. However, in the comparative analysis of feature variances within similar groups, the differences are less pronounced than those observed between different groups of clusters. This implies that the discriminative power of features describing certain farm management aspects, such as feeding management (see Table 1), tends to be less pronounced or may not be present at all. The reduced discriminatory power complicates the interpretation of the results. Nonetheless, this exploratory approach offers valuable insights into the interaction effects of farm management factors on cow health. In line with the inter-group analysis, we found that within the group of SMART farms, organic management was associated with a lower fertility disorder risk but an increased risk of udder diseases and milk fever, in contrast to conventional management. In particular, the combination of interacting features obtained in Cluster 9, i.e. organic management that is not heavily geared toward intensive milk production, that does not use silage and offers more freedom to move, had a positive effect on fertility. In addition, the intra-group analysis of non-organic farms in Cluster 12, which were located at similar altitudes and therefore exposed to similar environmental conditions as organic farms in Cluster 11, revealed differences in disease incidence rates. We encountered an unexpected paradox: the highest average cell count of 213,000 ± 67,000 cells/ml milk in Cluster 11, indicative of potential mastitis, was unexpectedly associated with the lowest incidence rates of udder diseases in this group. One potential explanation may be that farms in Cluster 11 implemented air conditioning in both the lying and feeding areas, whereas farms in Cluster 12 did not employ any cooling system. As heat stress weakens resistance this may lead to a higher incidence of intramammary infections (Rakib et al., 2020). Furthermore, regarding feeding practices, Cluster 12 used more corn silage and fed a partial mixed ratio, whereas in Cluster 11, concentrates were fed individually. This individualized feeding of concentrated feed can indicate a generally increased focus on animal-related farming practices, which can positively impact animal health.
In terms of study limitations, we recognize that data reuse studies are subject to various biases, including reporting bias (McGauran et al., 2010) and survey design (Foster et al., 2021) bias. In particular, this analysis was affected by two types of bias, which we refer to as “farm survey reporting bias” and “diagnosis detection bias”. Farm reporting bias emerges from inconsistencies between the information provided by respondents regarding their farm management practices and the actual execution of these reported practices. Although we implemented logical rules to verify the internal consistency of the information, the practical implementation remains beyond our control and may differ in some cases. Diagnosis detection bias is influenced by the level and frequency of veterinary consultation resulting in a higher number of veterinary diagnoses and consequently in an overestimation of disease prevalence within the studied populations. Additionally, a specific form of detection bias may occur when farms adopt new systems in response to health challenges. This is exemplified in our findings regarding increased fertility disorder risks within the SENSOR group. A plausible interpretation is that farms experiencing fertility issues may install sensor systems aiming to mitigate these risks. This observation underscores the complexity of interpreting associations, akin to the classic causality dilemma of “the chicken or the egg.” It raises a critical question in the context of animal health management: Does the adoption of specific technologies or the increased engagement with veterinary services act as a response to pre-existing health issues, or are they deployed as proactive preventative strategies? Despite these limitations, data-reuse studies hold the potential to uncover new associations by integrating and linking various data sources, enabling a detection of patterns that may not have been detected within isolated, small-scale data analysis.
We believe that the methodology presented represents a further step forward in data-reuse studies to turn farm management information into actionable knowledge. Our approach merges key-feature-based data reduction with unsupervised clustering techniques to enhance our understanding of how various farm management strategies impact cow health. By integrating a multi-faceted methodology, we address the complexities inherent in high-dimensional data analyses aimed at comparing different management practices and discovering new relationships between interacting features. The presented methodology supports the customized analysis of specific research questions by allowing an adaptive selection of key-features. This flexible methodology has the potential to become a valuable tool for the planning and optimization of sustainable and efficient practices in livestock farming.
The raw data supporting the conclusions of this article will be made available by the authors, without undue reservation.
Ethical approval was not required for this project because the data collection was conducted under existing agreements that have already been reviewed and approved for scientific use. This negates the need for a separate review by an ethics committee for the specific activities conducted in this project. Written informed consent was not obtained from the owners of the animals because consent from the farmers is already in place, making additional approvals unnecessary for this project. The data were collected under existing agreements that cover their use for scientific purposes, fulfilling the requirements for consent.
CM: Conceptualization, Formal analysis, Investigation, Methodology, Validation, Visualization, Writing – original draft, Writing – review & editing. KS: Conceptualization, Validation, Writing – review & editing. PK: Methodology, Writing – review & editing. FS: Data curation, Writing – review & editing. CE-D: Conceptualization, Funding acquisition, Project administration, Resources, Validation, Writing – review & editing.
The author(s) declare financial support was received for the research, authorship, and/or publication of this article. This study was carried out under the project BiTKuh, (Project number: FO999903261), managed by the Austrian Research Promotion Agency (FFG). In addition, the study was conducted as part of the COMET-Project D4Dairy (Digitization, Data integration, Detection, and Decision support in Dairying, Project number: 872039), which is generously supported by the Federal Ministry for Climate Action, Environment, Energy, Mobility, Innovation and Technology (BMK), the Federal Ministry for Digital and Economic Affairs (BMDW) of the Republic of Austria, and the provinces of Lower Austria and Vienna, under the COMET-Competence Centers for Excellent Technologies initiative.
We thank the staff of Dairy Herd Improvement (DHI), farmers and representatives of various organizations for data recording and provision and/or their invaluable input on the requirements for routine applications. Their expertise and insights were critical to the success of our study. Further acknowledgment goes to the Zentralanstalt für Meteorologie and Geodynamik (ZAMG), Austria, for providing essential climate data for the farm locations involved in our study, thereby facilitating a comprehensive analysis of environmental impacts on agricultural practices. Additionally, we extend our gratitude to Christa Singer for her invaluable support throughout the research process, from reviewing the manuscript to contributing to the development of methods and discussing various approaches. The exchange of ideas and their feedback played a decisive role in refining our methodology. We also acknowledge the use of ChatGPT-4, a generative AI technology developed by OpenAI, which assisted in improving the English language and formatting LaTeX tables in this manuscript.
Authors CM, KS, FS, and CE-D were employed by the company ZuchtData EDV-Dienstleistungen GmbH.
The remaining author declares that the research was conducted in the absence of any commercial or financial relationships that could be construed as a potential conflict of interest.
All claims expressed in this article are solely those of the authors and do not necessarily represent those of their affiliated organizations, or those of the publisher, the editors and the reviewers. Any product that may be evaluated in this article, or claim that may be made by its manufacturer, is not guaranteed or endorsed by the publisher.
The Supplementary Material for this article can be found online at: https://www.frontiersin.org/articles/10.3389/fanim.2024.1421299/full#supplementary-material
Term: Definition
Key-feature: A factor that has a crucial influence on farm management practices and thus serves as a distinguishing feature between different types of farm management.
Cluster: A collection of several farms (minimum 34) clustered based on shared similar key-features, indicating a homogeneous management practice or approach.
Group of clusters: An aggregation of clusters categorized based on common similarities among them, facilitating comparative analyses.
Inter-analysis: Comparative analysis conducted between different clusters or groups of clusters to identify distinct patterns or impacts.
Intra-analysis: Analysis conducted within a single group of clusters to understand the nuances and dynamics internal to the group.
ML: Machine learning. Refers in this context to unsupervised methods employed for identifying patterns or clusters within the data without prior labeling.
AMS: Automatic milking system
OR (odds ratio): A statistical measure used to compare the occurrence of a certain event in one group to its occurrence in another group, often used in risk assessment.
PLF: Precision livestock farming
TRADITIONAL Cluster Group: Group representing farms that use neither AMS nor sensor systems.
AMS Cluster Group: Group is characterized by farms that exclusively use AMS system, but no sensor systems attached to animals
SENSOR Cluster Group: Group representing farms that exclusively utilize sensor systems for monitoring various aspects of farm and animal health, without integrating AMS
SMART Cluster Group: Group representing farms where both AMS and sensor systems are synergistically integrated, representing the most technologically advanced farming practice in our study.
TMR: Total mixed ration. A method of feeding livestock.
PMR: Partial mixed ration. A method of feeding livestock.
GMO: Genetically modified organisms. Organisms whose genetic material has been altered using genetic engineering techniques, often used in agriculture for crops resistant to pests or herbicides.
masl: Meters above sea level. A measurement of altitude.
Badinga L., Collier R. J., Thatcher W. W., Wilcox C. J. (1985). Effects of climatic and management factors on conception rate of dairy cattle in subtropical environment1. J. Dairy Sci. 68, 78–85. doi: 10.3168/jds.S0022-0302(85)80800-6
Beaver A., Weary D. M. (2021). Keyserlingk MAGv. Invited review: The welfare of dairy cattle housed in tiestalls compared to less-restrictive housing types: A systematic review. J. Dairy Sci. 104, 9383–9417. doi: 10.3168/jds.2020-19609
Beggs D. S., Fisher A. D., Jongman E. C. (2015). Hemsworth PH. A survey of Australian dairy farmers to investigate animal welfare risks associated with increasing scale of production. J. Dairy Sci. 98, 5330–5338. doi: 10.3168/jds.2014-9239
Berckmans D. (2014). Precision livestock farming technologies for welfare management in intensive livestock systems. Rev. Scientifique Et Technique (International Office Epizootics) 33, 189–196. doi: 10.20506/rst.33.1.2273
Berentsen P. B. M., Kovacs K., van Asseldonk M. A. P. M. (2012). Comparing risk in conventional and organic dairy farming in the Netherlands: An empirical analysis. J. Dairy Sci. 95, 3803–3811. doi: 10.3168/jds.2011-5200
Bieber A., Wallenbeck A., Leiber F., Fuerst-Waltl B., Winckler C., Gullstrand P., et al. (2019). Production level, fertility, health traits, and longevity in local and commercial dairy breeds under organic production conditions in Austria, Switzerland, Poland, and Sweden. J. Dairy Sci. 102, 5330–5341. doi: 10.3168/jds.2018-16147
Cabrera V., Barrientos-Blanco J. A., Delgado H., Fadul-Pacheco L. (2019). Symposium review: Real-time continuous decision making using big data on dairy farms. J. dairy Sci. 103 (4), 3856–3866. doi: 10.3168/jds.2019-17145
Campello R. J. G. B., Moulavi D., Sander J. (2013). “Density-based clustering based on hierarchical density estimates,” in Advances in Knowledge Discovery and Data Mining. Eds. Pei J., Tseng V. S., Cao L., Motoda H., Xu G. (Springer, Berlin, Heidelberg), 160–172. doi: 10.1007/978-3-642-37456-2_14
Campello R. J. G. B., Moulavi D., Zimek A., Sander J. (2015). Hierarchical density estimates for data clustering, visualization, and outlier detection. ACM Trans. Knowl. Discov. Data 10, 1–51. doi: 10.1145/2733381
Egger-Danner C., Fuerst-Waltl B., Obritzhauser W., Fuerst C., Schwarzenbacher H., Grassauer B., et al. (2012). Recording of direct health traits in Austria—Experience report with emphasis on aspects of availability for breeding purposes. J. Dairy Sci. 95, 2765–2777. doi: 10.3168/jds.2011-4876
Egger-Danner C., Köck A., Fuchs K., Grassauer B., Fuerst-Waltl B., Obritzhauser W. (2020). Use of benchmarking to monitor and analyze effects of herd size and herd milk yield on cattle health and welfare in Austrian dairy farms. J. Dairy Sci. 103, 7598–7610. doi: 10.3168/jds.2019-16745
Foster S. D., Vanhatalo J., Trenkel V. M., Schulz T., Lawrence E., Przeslawski R., et al. (2021). Effects of ignoring survey design information for data reuse. Ecol. Appl. 31, e02360. doi: 10.1002/eap.2360
Ghassemi Nejad J., Lee B. H., Kim J. Y., Chemere B., Sung K. I., Lee H. G. (2021). Effect of alpine grazing on plasma and hair cortisol, serotonin, and DHEA in dairy cows and its welfare impact. Domest. Anim. Endocrinol. 75, 106581. doi: 10.1016/j.domaniend.2020.106581
Hogenboom J. A., Pellegrino L., Sandrucci A., Rosi V., D’Incecco P. (2019). Invited review: Hygienic quality, composition, and technological performance of raw milk obtained by robotic milking of cows. J. Dairy Sci. 102, 7640–7654. doi: 10.3168/jds.2018-16013
Karttunen J. P., Rautiainen R. H., Lunner-Kolstrup C. (2016). Occupational health and safety of finnish dairy farmers using automatic milking systems. Front. Public Health 4. doi: 10.3389/fpubh.2016.00147
Koeck A., Egger-Danner C., Fuerst C., Obritzhauser W., Fuerst-Waltl B. (2010). Genetic analysis of reproductive disorders and their relationship to fertility and milk yield in Austrian Fleckvieh dual-purpose cows. J. Dairy Sci. 93, 2185–2194. doi: 10.3168/jds.2009-2570
Lasser J., Matzhold C., Egger-Danner C., Fuerst-Waltl B., Steininger F., Wittek T., et al. (2021). Integrating diverse data sources to predict disease risk in dairy cattle—a machine learning approach. J. Anim. Sci. 99, skab294. doi: 10.1093/jas/skab294
Lucy M. C. (2007). Fertility in high-producing dairy cows: reasons for decline and corrective strategies for sustainable improvement. Soc. Reprod. Fertil Suppl. 64, 237–254. doi: 10.5661/RDR-VI-237
Lund V., Algers B. (2003). Research on animal health and welfare in organic farming—a literature review. Livest. Prod. Sci. 80, 55–68. doi: 10.1016/S0301-6226(02)00321-4
Matzhold C., Lasser J., Egger-Danner C., Fuerst-Waltl B., Wittek T., Kofler J., et al. (2021). A systematic approach to analyse the impact of farm-profiles on bovine health. Sci. Rep. 11, 21152. doi: 10.1038/s41598-021-00469-2
Mavura F., Pandhare S. M., Mkoba E., Nyambo D. G. (2022). Rule-based engine for automatic allocation of smallholder dairy producers in preidentified production clusters. Sci. World J. 2022, e6944151. doi: 10.1155/2022/6944151
McGauran N., Wieseler B., Kreis J., Schüler Y. B., Kölsch H., Kaiser T. (2010). Reporting bias in medical research - a narrative review. Trials 11, 37. doi: 10.1186/1745-6215-11-37
McInnes L., Healy J. (2017). “Accelerated hierarchical density clustering,” in 2017 IEEE International Conference on Data Mining Workshops (ICDMW). 33–42. doi: 10.1109/ICDMW.2017.12
Neves R. C., LeBlanc S. J. (2015). Reproductive management practices and performance of Canadian dairy herds using automated activity-monitoring systems. J. Dairy Sci. 98, 2801–2811. doi: 10.3168/jds.2014-8221
Nyambo D. G., Luhanga E. T., Yonah Z. O., Mujibi F. D. N. (2019). Application of multiple unsupervised models to validate clusters robustness in characterizing smallholder dairy farmers. Sci. World J. 2019, e1020521. doi: 10.1155/2019/1020521
Orjales I., López-Alonso M., Rodríguez-Bermúdez R., Rey-Crespo F., Villar A., Miranda M. (2016). Is lack of antibiotic usage affecting udder health status of organic dairy cattle? J. Dairy Res. 83, 464–467. doi: 10.1017/S0022029916000601
Popescu S., Borda C., Diugan E. A., Niculae M., Stefan R., Sandru C. D. (2014). The effect of the housing system on the welfare quality of dairy cows. Ital. J. Anim. Sci. 13 (4), 653–660. doi: 10.4081/ijas.2014.2940
Rakib M. R. H., Zhou M., Xu S., Liu Y., Khan M. A., Han B., et al. (2020). Effect of heat stress on udder health of dairy cows. J. Dairy Res. 87, 315–321. doi: 10.1017/S0022029920000886
Roelofs J. B., van Eerdenburg F. J. C. M., Soede N. M., Kemp B. (2005). Pedometer readings for estrous detection and as predictor for time of ovulation in dairy cattle. Theriogenology 64, 1690–1703. doi: 10.1016/j.theriogenology.2005.04.004
Schneeberger W., Darnhofer I., Eder M. (2002). Barriers to the adoption of organic farming by cash-crop producers in Austria. Am. J. Altern. Agric. 17, 24–31. doi: 10.1079/AJAA20017
Schuppli C. A., von Keyserlingk M. A. G., Weary D. M. (2014). Access to pasture for dairy cows: Responses from an online engagement. J. Anim. Sci. 92, 5185–5192. doi: 10.2527/jas.2014-7725
Stengärde L., Hultgren J., Tråvén M., Holtenius K., Emanuelson U. (2012). Risk factors for displaced abomasum or ketosis in Swedish dairy herds. Prev. Vet. Med. 103, 280–286. doi: 10.1016/j
Stygar A. H., Gómez Y., Berteselli G. V., Dalla Costa E., Canali E., Niemi J. K., et al. (2021). A systematic review on commercially available and validated sensor technologies for welfare assessment of dairy cattle. Front. Vet. Sci. 8. doi: 10.3389/fvets.2021.634338
von Keyserlingk M. A. G., Barrientos A., Ito K., Galo E., Weary D. M. (2012). Benchmarking cow comfort on North American freestall dairies: Lameness, leg injuries, lying time, facility design, and management for high-producing Holstein dairy cows. J. Dairy Sci. 95, 7399–7408. doi: 10.3168/jds.2012-5807
Wagenaar J. P., Klocke P., Butler G., Smolders G., Nielsen J., Canever A., et al. (2011). Effect of production system, alternative treatments and calf rearing system on udder health in organic dairy cows. NJAS: Wageningen J. Life Sci. 58, 157–162. doi: 10.1016/j.njas.2011.06.001
Keywords: farm management practices, technological systems, cow health, key-feature-based clustering, discrimination power
Citation: Matzhold C, Schodl K, Klimek P, Steininger F and Egger-Danner C (2024) A key-feature-based clustering approach to assess the impact of technology integration on cow health in Austrian dairy farms. Front. Anim. Sci. 5:1421299. doi: 10.3389/fanim.2024.1421299
Received: 22 April 2024; Accepted: 14 August 2024;
Published: 12 September 2024.
Edited by:
Marcia Endres, University of Minnesota Twin Cities, United StatesReviewed by:
Gemma A. Miller, Scotland’s Rural College, United KingdomCopyright © 2024 Matzhold, Schodl, Klimek, Steininger and Egger-Danner. This is an open-access article distributed under the terms of the Creative Commons Attribution License (CC BY). The use, distribution or reproduction in other forums is permitted, provided the original author(s) and the copyright owner(s) are credited and that the original publication in this journal is cited, in accordance with accepted academic practice. No use, distribution or reproduction is permitted which does not comply with these terms.
*Correspondence: Caspar Matzhold, bWF0emhvbGRAenVjaHRkYXRhLmF0
Disclaimer: All claims expressed in this article are solely those of the authors and do not necessarily represent those of their affiliated organizations, or those of the publisher, the editors and the reviewers. Any product that may be evaluated in this article or claim that may be made by its manufacturer is not guaranteed or endorsed by the publisher.
Research integrity at Frontiers
Learn more about the work of our research integrity team to safeguard the quality of each article we publish.