- 1Department of Animal and Dairy Science, University of Georgia, Athens, Georgia, GA, United States
- 2College of Veterinary Medicine, University of Georgia, Athens, Georgia, GA, United States
- 3Department of Entomology, University of Georgia, Athens, Georgia, GA, United States
- 4North Florida Research and Education Center, University of Florida, Quincy, FL, United States
- 5Department of Poultry Science, University of Georgia, Athens, Georgia, GA, United States
The genetic basis of horn fly abundance remains largely unknown and only few heritability estimates are available based on small scale studies. In this study, one subjective and two image-based fly abundance phenotypes were analyzed. Each animal was assessed subjectively for fly abundance by at least one trained agent (SUB). Additionally, several digital images were taken and the best image for each animal was used to assess fly abundance. A box that runs roughly from the withers to the hook and from the chest floor to the fore of the udder was established and all horn flies (PA) and sampling-based estimated number of flies (PR) within the box were calculated. Horn fly counts (SUB, PA, and PR) were discretized into 4 classes based on the quartiles of their respective distributions. Heritability estimates ranged between 0.10 and 0.15 and between 0.14 and 0.16 for the continuous and discrete cases, respectively. The genetic correlation was 0.66 between PA and PR and decreased significantly between the image-based (PA and PR) and the subjective (SUB) assessments for the continuous case. For the discrete case, the genetic correlations between the three traits were very similar, indicating a high concordance between traits.
1 Introduction
Horn flies (Haematobia irritans) are a major nuisance to livestock due to frequent blood feeding. There can be upward of 1,000 flies on an animal at a given time, and each fly can feed more than 30 times a day with each meal averaging about 1.5 ml of blood (Kuramochi and Nishijima, 1980: Meisch and Lancaster, 1987). This causes animals stress, resulting in elevated heart and respiratory rates, reduced growth rate due to decreased grazing time and feed efficiency, reduced milk production, and reduced weaning weights (Meisch and Lancaster, 1987: Machtinger et al., 2021). In the United States, horn flies are estimated to cause more than $1 billion in economic losses on pastured cattle annually (Maday, 2018). In fact, Arther (1991) and Kunz et al. (1991) estimated the yearly impact of horn flies to be $700 and $876 million, respectively; this is the equivalent of $1.6 and $1.8 billion in 2018 dollars. Although staggering, these numbers may still be an underestimation of the full economic impact of horn flies (Taylor et al., 2012). Several southeastern and midwestern states in the US are major cow-calf production states and cattle spend a significant portion of their lives on pasture. These states are characterized by an extended summer season. These two factors maximize the exposure of the beef cattle population to horn flies, resulting in substantial economic losses (Hinkle, 2018).
Several control methods including life cycle interruption, diet additives, and insecticides have been proposed to deal with horn fly infestations. In general, their effects are only temporary, and their efficacy is hampered by the need for multiple applications during a season, migration of flies from neighboring herds, and adverse environmental impact. In addition to the economic cost of these mitigation methods, the intensive use of insecticides has led to horn fly insecticide resistance and reduction in predation by other insects (Cilek et al., 1991: Byford et al., 1999: Barros et al., 2001).
Several studies have clearly shown differences in abundance of horn flies across breeds and among animals within the same breed (Steelman et al., 1993: Guglielmone et al., 2001). These differences, both within and across breeds, have also been linked to variation in blood enzymes, primarily those associated with blood clotting. Furthermore, genetic analyses of horn fly abundance traits in cattle have shown sufficient genetic variation to allow for improvement in resistance through selection, with heritability estimates ranging from 10 to 80% (Brown et al., 1992: Fraga et al., 2005: Ling et al., 2020). Similar results, although with lower heritability estimates, were observed for self-reported wheal size, itch intensity and attractiveness to mosquitoes in humans (Jones et al., 2017).
Relying solely on management and chemical control agents has proven inadequate. Increasing production efficiency and eliminating (or at least reducing) chemical use in horn fly control are of crucial importance to the beef cattle industry. Genetic selection for horn fly attraction, resistance and tolerance could provide an attractive alternative which could have tremendous potential to provide a long-term solution to a complex problem.
One of the major problems impeding genetic selection for horn fly resistance and tolerance is the economic and logistic costs associated with measuring fly abundance phenotypes, especially under pasture conditions. Counts of horn fly load per animal have been frequently used as a proxy to measure resistance/tolerance. The accuracy of this approach depends largely on the quality of subjective assessments of evaluating agents or the acquisition and processing of digital images. As a result, only small data sets of horn fly abundance have been collected in beef cattle. Estimates of heritability of count-based horn fly abundance range from 10 to 80%, clearly indicating the impact of the small sample size, the potential lack of uniformity in data collection (i.e., subjective assessment or images), and trait definition (Brown et al., 1992: Fraga et al., 2005). This high variation clouds the ability to dissect the genetic basis of horn fly abundance and limits the ability to derive accurate estimates of the onset of the economic injury threshold (abundance at which an animal’s performance starts becoming negatively impacted) and the rate of decay in performance after onset (decay in performance with the increase of HF abundance).
The genetic basis of these traits remains largely unknown due to the cost and logistic complexity of measuring fly abundance traits under commercial conditions. Only a few heritability estimates are available based on small scale studies. The objectives of this study are to: 1) assess the concordance between subjective and image-based measurements of horn fly abundance, and 2) estimate the genetic parameters of the fly abundance related phenotypes using continuous and discrete classification.
2 Materials and methods
2.1 Data collection
All the data used in this project were collected following the Animal Care and Use Protocol approved by the Institutional Animal Care and Use Committee at the University of Georgia (A2019 03- 034Y3-A0 and A2021 09-0140Y1-A0). Two University of Georgia farms (Eatonton Beef Research Unit and Northwest Georgia REC in Calhoun) participated in this project. Data collection was carried out during the summers of 2019 and 2022. Animals were not treated or managed in any way to control horn flies prior to data collection. Animals were assessed for fly abundance on the pasture in the mornings or on overcast days to avoid working animals in the heat of the day and to evaluate while most horn flies were located on the side of the animals. Every effort was made to minimize the disturbance of the animals on the pasture. Each animal was assessed subjectively for the abundance of horn flies by at least one trained agent (SUB). When multiple trained agents were used, they calibrated their estimates on 5-10 animals at the start of each day prior to viewing animals used in the study. Additionally, several digital images were taken to capture the side profile of each animal. Blood samples were collected from the tail of the majority of assessed animals roughly within one week of fly count collection. Environmental conditions including temperature, humidity, wind speed, and precipitation in the last 24 hours were recorded. Animals scored for horn fly abundance by more than one agent were used to assess the consistency across trained evaluators. Animals with more than one score were identified and those with differences between evaluators of less than 500 flies were kept. This was necessary to remove records where the assessment by the different evaluators was likely to have been conducted under markedly different conditions (i.e., animal has moved/disturbed the flies). After edits, the final data file consisted of 1680 records collected on 840 cows and heifers. The pedigree file included 1350 animals. A summary description of the data is presented in Table 1. When comparing subjective scoring to image-based methods the average of the evaluator scores was used.
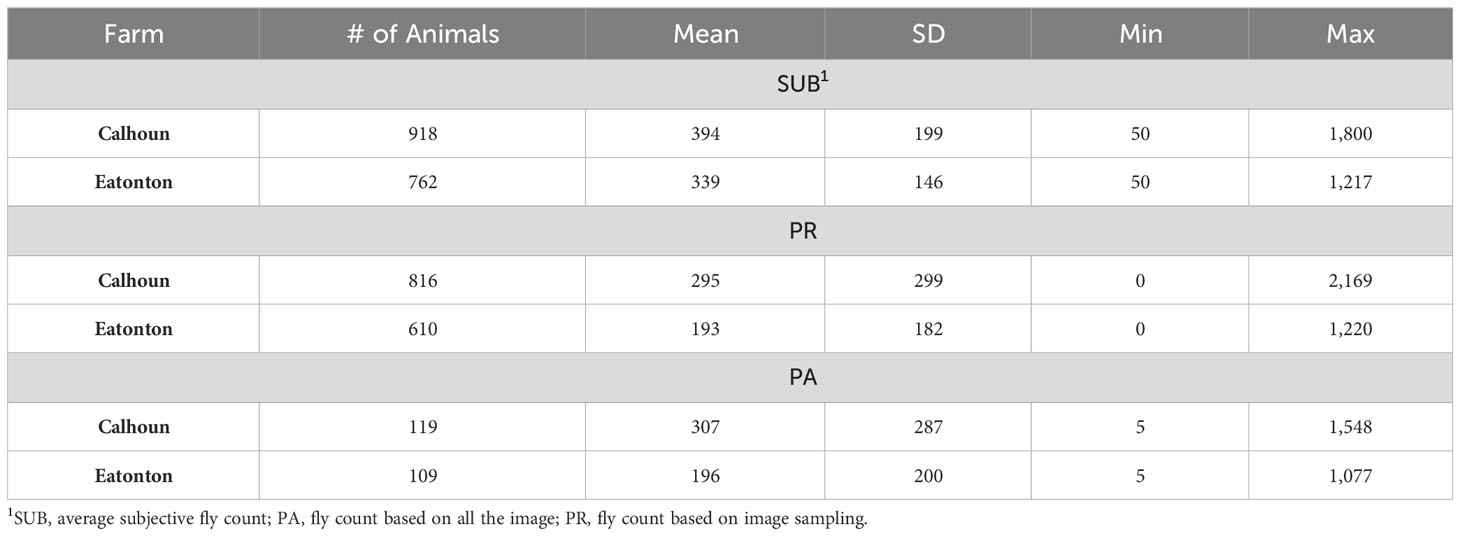
Table 1 Summary of fly count distribution based on subjective and image-based assessments across two farms.
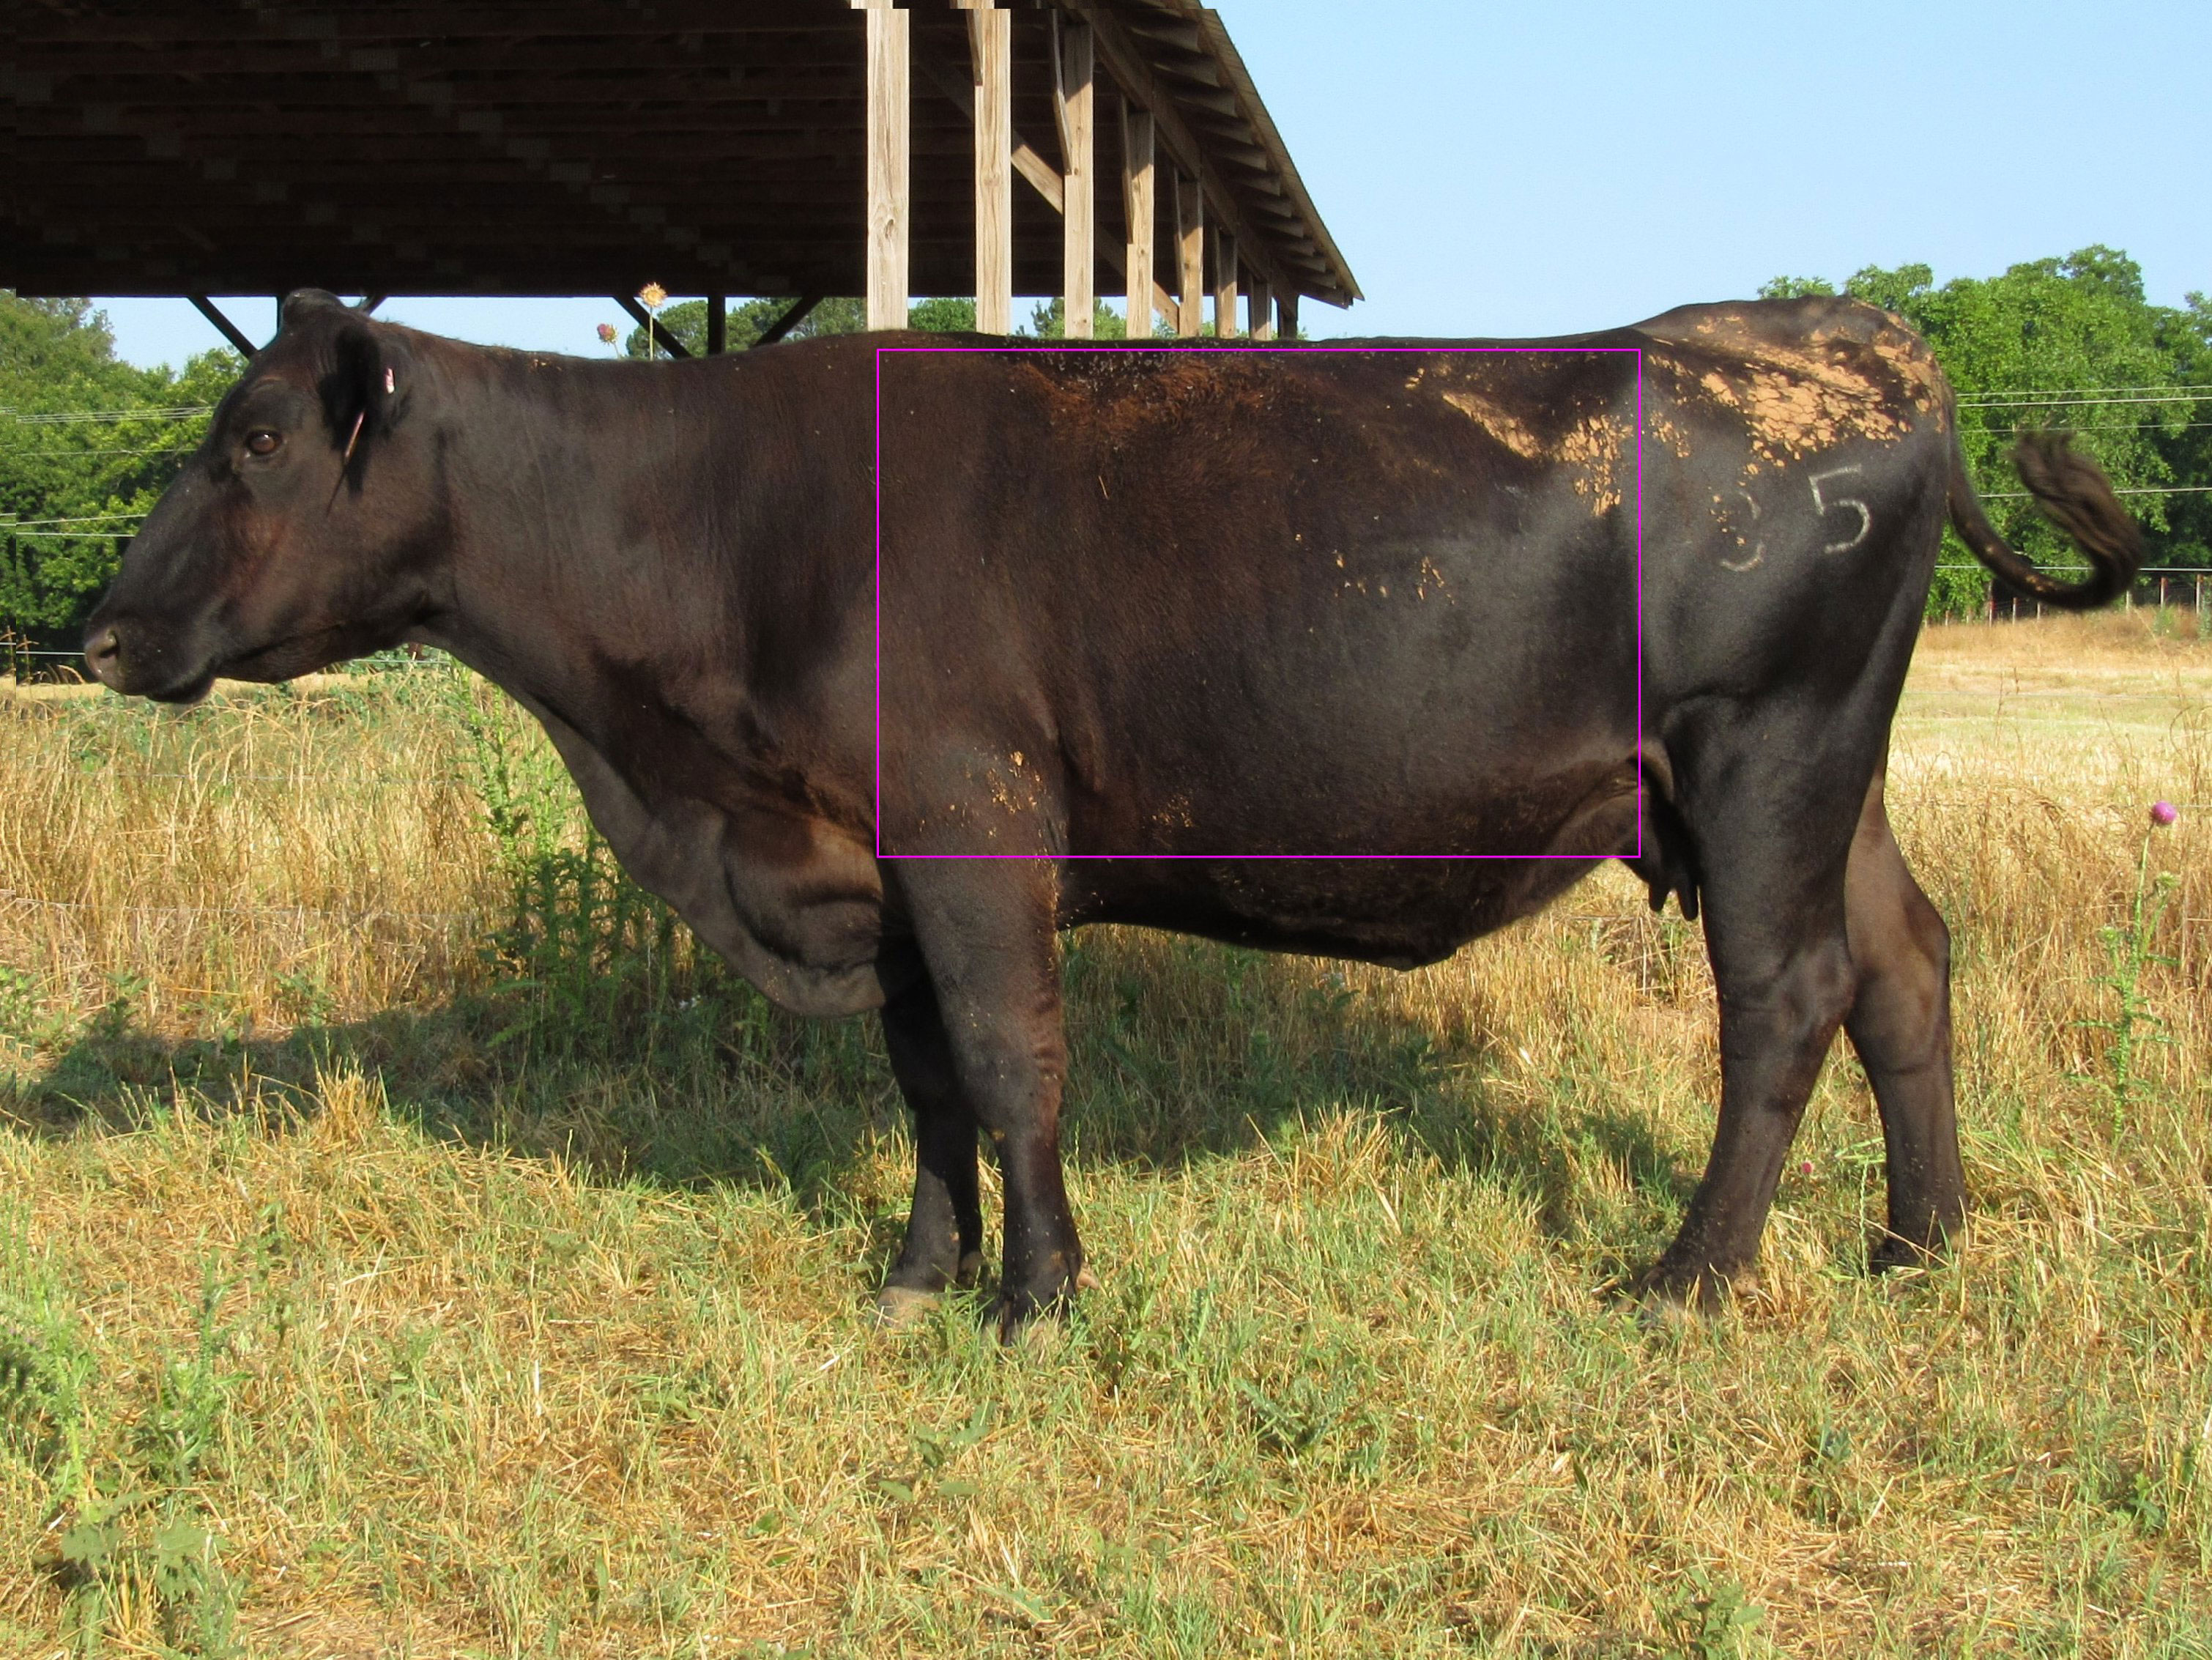
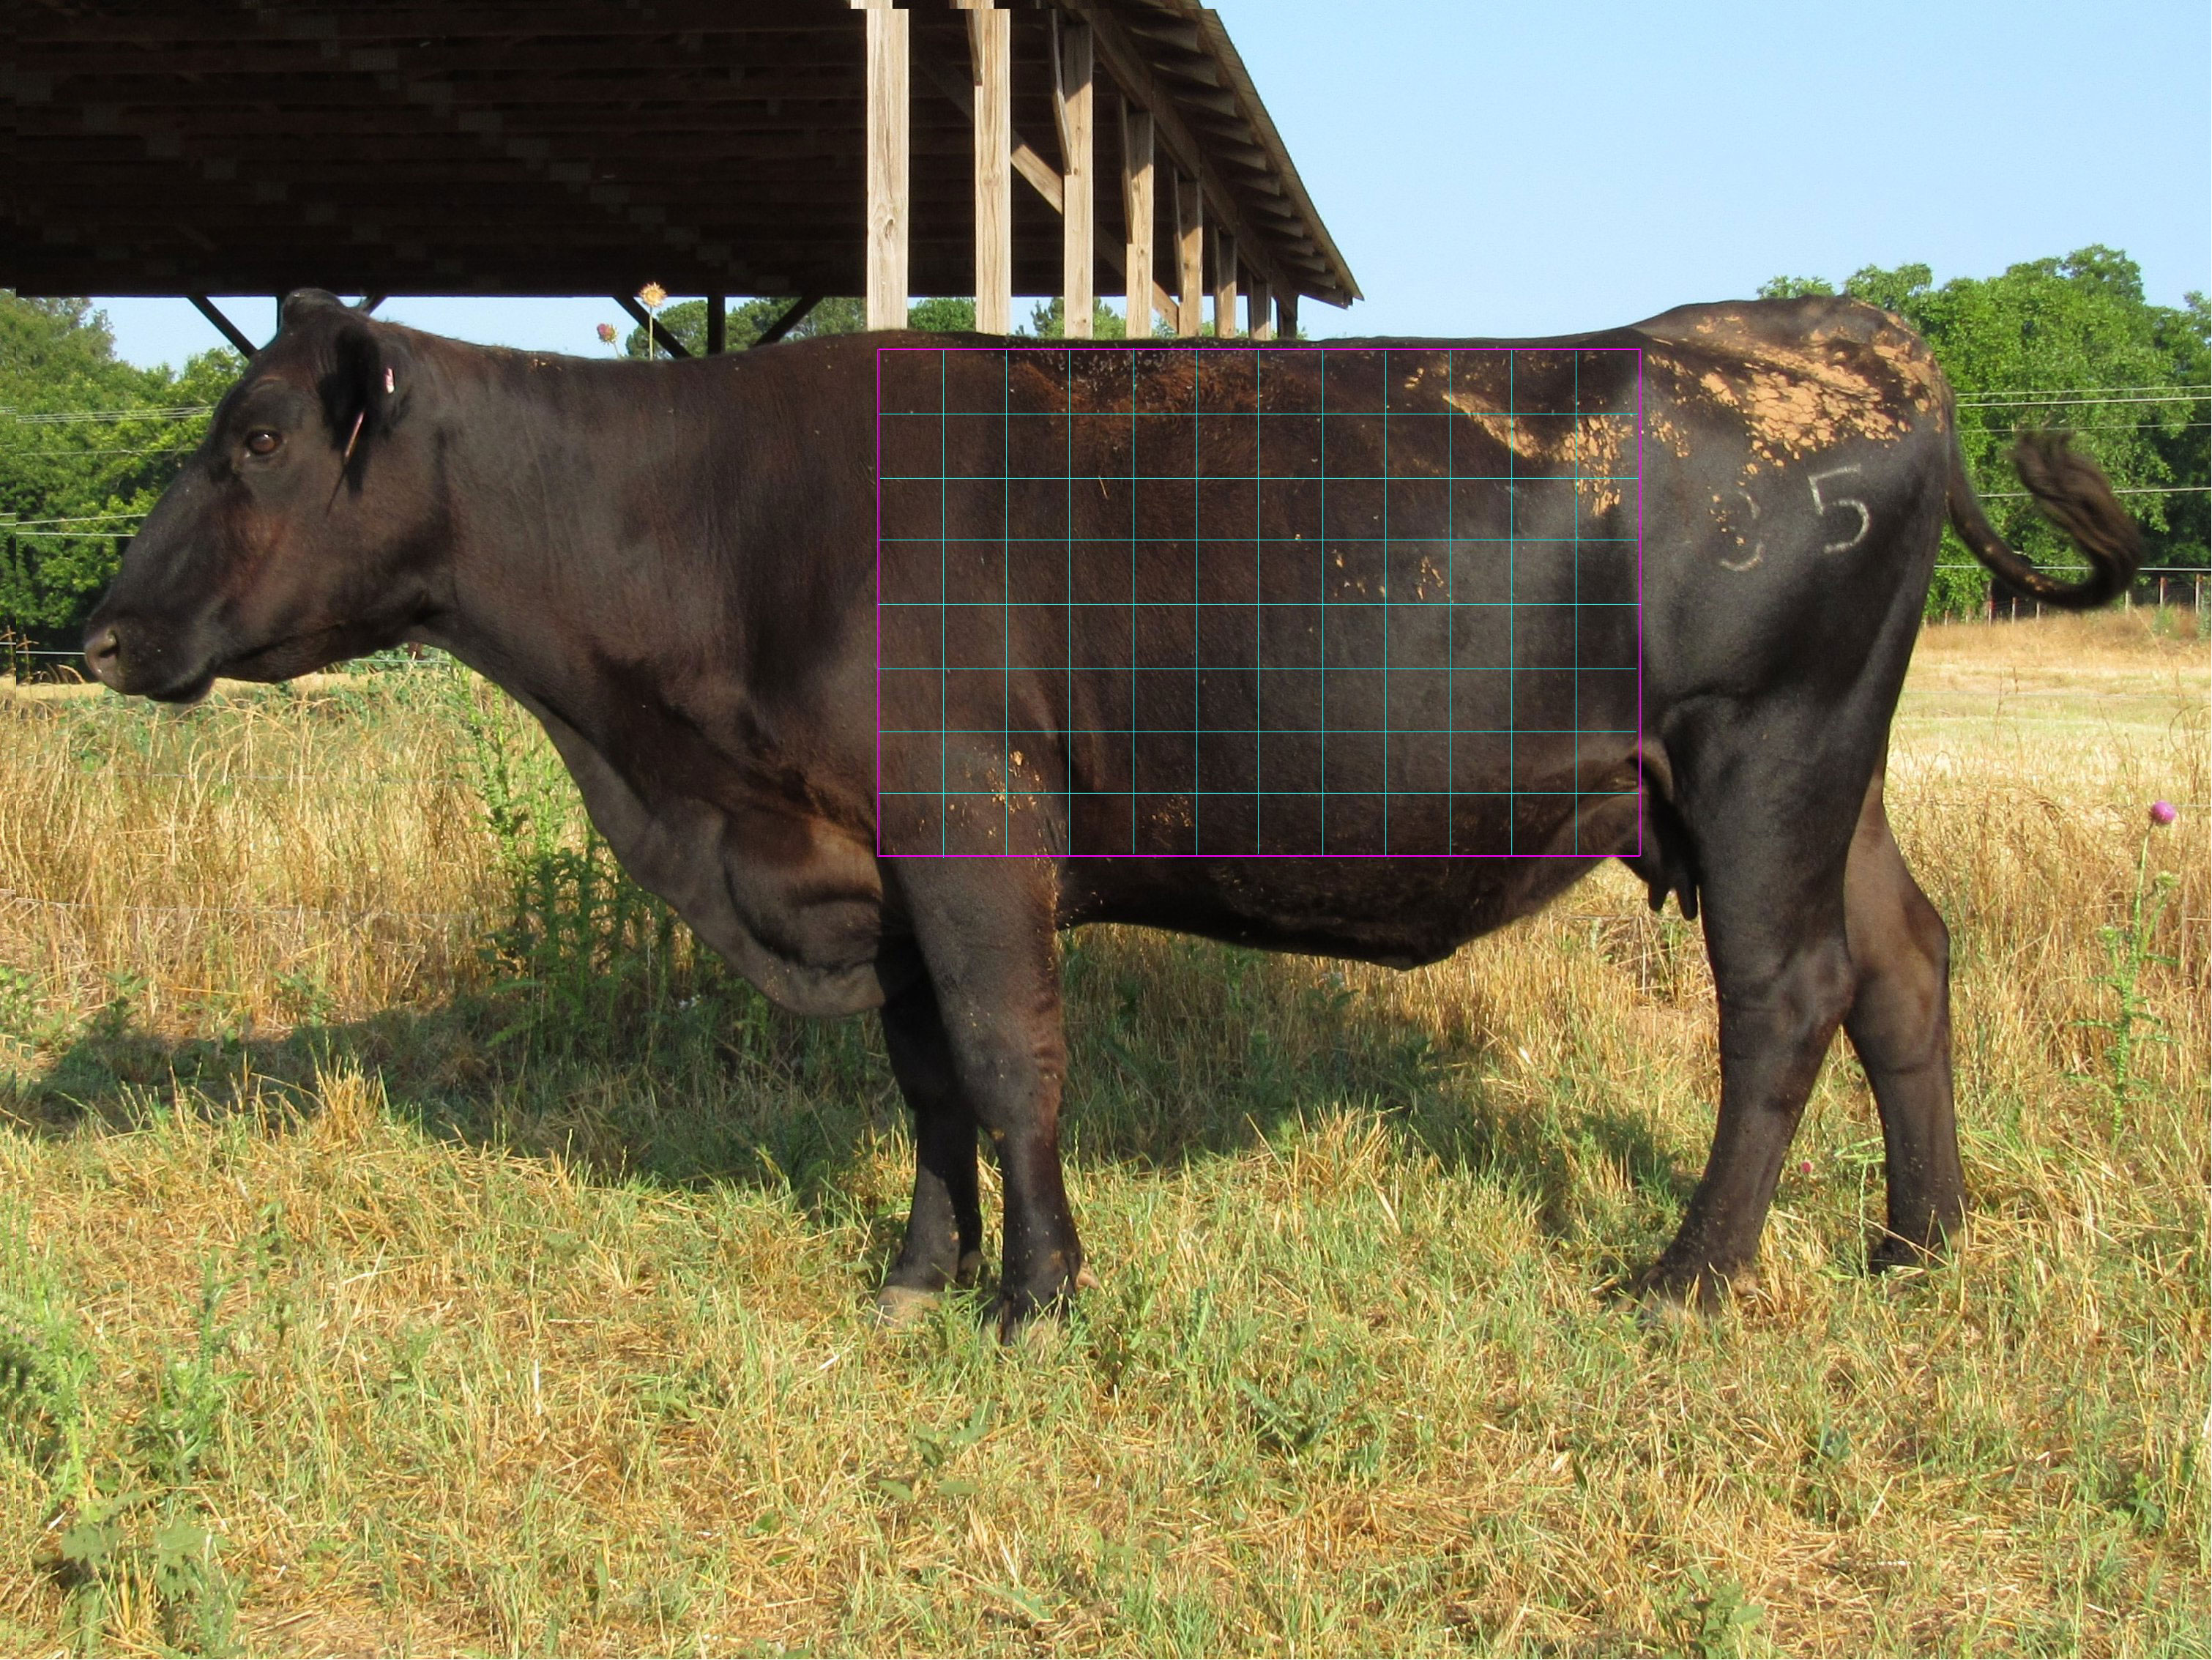
Image-based horn fly abundance phenotypes: For each animal, the best digital image taken was identified and then used to assess horn fly abundance. The best digital image was determined by image clarity, lighting, animal position (side profile with a neutral position of the tail and head), and no obstructions in front of the animal (such as a calf, tree, or grass). A box that runs roughly from the withers to the hook and from the chest floor to the fore of the udder (Figure 1) was established. Using the ImageJ software, all visible hornflies within the established box were manually counted (PA) (ImageJ, 2019). For animals with high horn fly abundance, the counting was tedious (close proximity between flies) and time consuming (some animals requiring upwards of 30 minutes). To remedy these problems, the established box (Figure 1) was subdivided into small squares as indicated in Figure 2. Squares were grouped into high, moderate, and low fly abundance classes by visual assessment. Randomly, 20%, 10 and 5% of squares were sampled within the high, moderate, low abundance classes, respectively. Flies within the selected squares were counted using the ImageJ software and then used to estimated fly abundance (PR). Image-based methods were compared to the average of the subjective evaluations, any animals where the average subjective evaluation differed by 500 or more flies from the PR or PA were removed. This was done to remove records where the photo was taken under different conditions than when the evaluators viewed the animal.
In order to assess the potential impact of the simplification of fly abundance assessment and to potentially reduce the uncertainties associated with the continuous counts, horn fly counts (SUB, PA, and PR) were discretized into 4 classes based on the quartiles of their respective distributions.
2.2 Data analysis
A mixed linear model was implemented for the joint analysis of the three horn fly counts (SUB, PA, and PR). In matrix notation, the following model was assumed:
where y is the vector of observed phenotypes for SUB, PA, and PR, β is the vector of systematic effects of year (2 levels), farm (2 levels), month (3 levels), pregnancy status (2 levels), and a regression on the animal’s age (in years). u∼N (0, A⊗G) and p∼N (0, I⊗P) are the additive and permanent environmental effect vectors, respectively, and e is the vector of residual terms that was assumed to be distributed as N (0, I⊗ R). X,W and Z are known incidence matrices with the appropriate dimensions, and G, P, and R are 3x3 genetic, permanent, and residual covariance matrices, respectively.
Only a small subset of the animals (n=184) had a PA assessment due to the time-consuming nature of counting every fly. The missing PA records were imputed based on the assumed sampling model presented in the equation.
When the horn fly abundance was treated as a discrete response with 4 classes, a multivariate threshold model was used. At the liability scale, the model included the same effects indicated in equation 1. A full Bayesian analysis was carried out to implement both models (at the continuous and discrete scales). A unique chain of 100,000 samples was implemented where the first 25,000 samples were discarded as burn-in period based on visual inspection of the behavior of the chain. Computer software developed by Rekaya et al. (2013) was used for the analyses.
3 Results
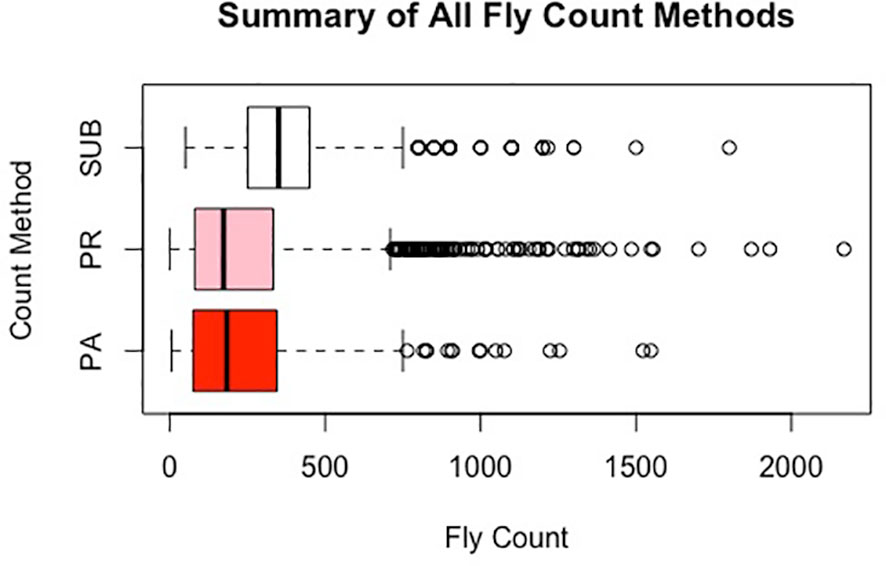
Table 1 presents a summary description of the distribution of horn fly abundance in each of the farms based on the subjective (SUB) and image-based (PA and PR) assessments. For animals scored by more than one evaluator, the average of their assessments was used. There is a similarity between the mean fly abundance using the different methods within farm (Figure 3). However, SUB count assessments are substantially higher compared to PR and PA across the two farms. The two image-based count phenotypes had similar means. There seems to be a higher variance in fly counts on the Calhoun farm as reflected by the higher range and slightly larger standard deviations. The image-based assessments seem to have a slightly higher variability as indicated by larger standard deviations. On both farms, the average horn fly abundance, especially using SUB, was substantially higher than the economic injury threshold currently set at around 200 flies.
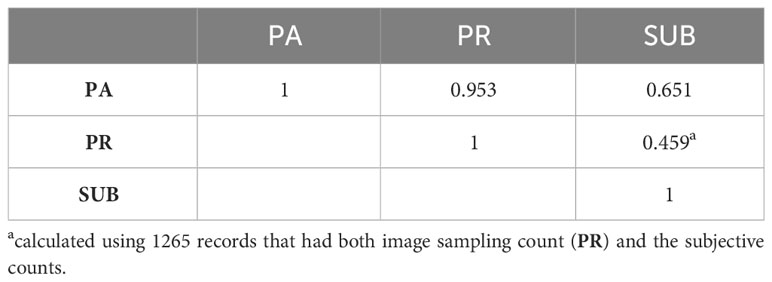
There were 448 animals assessed by all three evaluators. The Pearson correlations between evaluators ranged between 0.43 and 0.52 as indicated in Table 2. When the counts were discretized into four classes, the concordance between evaluators did not improve. In fact, it decreased slightly as indicated in Table 2. The correlations between the different methods of assessing horn fly abundance are presented in Table 3. The Pearson correlation was around 0.66 between the subjective and PA assessments (n=184) and decreased to 0.46 between SUB and PR based fly counts (n=1266).
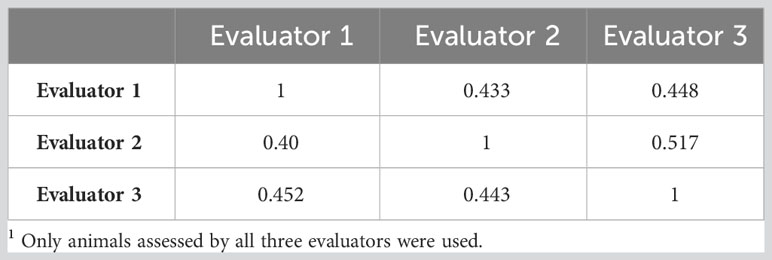
Table 2 Correlations between three evaluators for the subjective assessment of horn fly abundance as a continuous (upper diagonal) and as a discrete trait (lower diagonal: on the liability scale)1.
Table 4 presents the residual, genetic, and permanent environmental variances for the three traits under the continuous and discrete scenarios. For both cases, SUB has the lowest variances due to a smaller phenotypic variation in the trait, especially at low fly abundance. PA and PR had similar variances. In the discrete case, there was a high similarity across the three traits with exception of the residual variance for PA (Table 4). The permanent environmental variances were low and accounted for less than 1% for the phenotypic variance for all traits under both scenarios indicating low repeatability. The heritability estimates of the three count traits using the continuous and discrete classification are presented in Table 5. Heritability estimates ranged between 0.10 and 0.15 for the continuous case and between 0.14 and 0.16 when counts were discretized into four classes.

Table 4 Residual, genetic, and permanent environmental variances of the three horn fly abundance phenotypes under the continuous and discrete (on the liability scale) classifications.
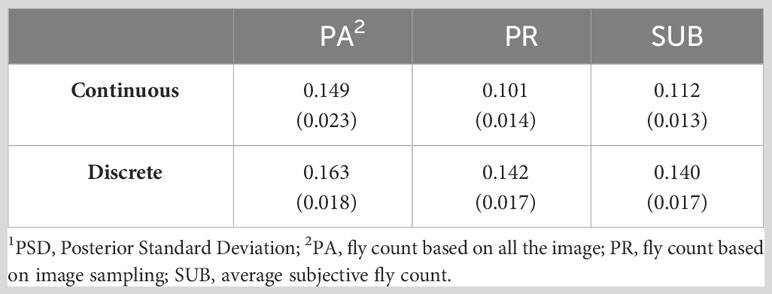
Table 5 Heritability (PSD1) of three horn fly abundance traits using continuous and discrete (on the liability scale) classification.
Table 6 presents the genetic correlations between the three trait estimation methods for the continuous and discrete scenarios. The correlation was 0.66 between PA and PR and decreased significantly between the image-based counts (PA and PR) and the subjective (SUB) assessments for the continuous case. These genetic correlations follow a similar trend to the phenotypic correlations between the three traits (Table 3) although smaller in magnitude. For the discrete case, the genetic correlations between the three estimation methods were very similar, indicating a higher concordance in trait classification across the three methods. A similar trend was observed for the continuous residual correlations where PA and PR are highly correlated (0.94); however, the correlation dropped to around 0.30 between SUB and the image-based assessments for the continuous case (Table 7). For the discrete case, the residual correlations were high and similar across the three traits (Table 7). The permanent environmental correlations ranged between 0.20 and 0.42 and between 0.26 and 0.35 for the continuous and discrete cases (Table 8).
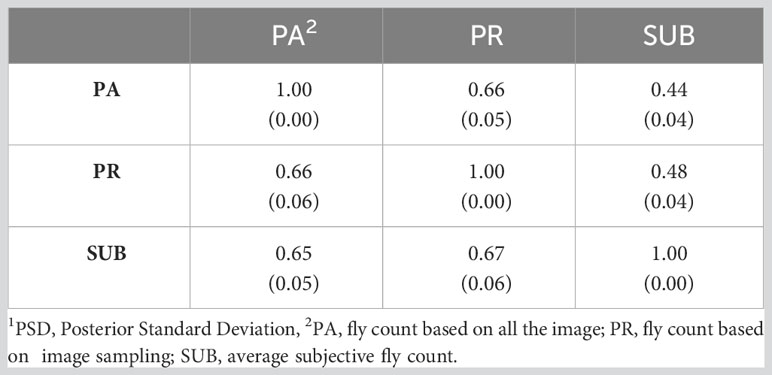
Table 6 Genetic correlations (PSD1) between the three horn fly abundance phenotypes for the continuous (above diagonal) and discrete (below diagonal) cases.
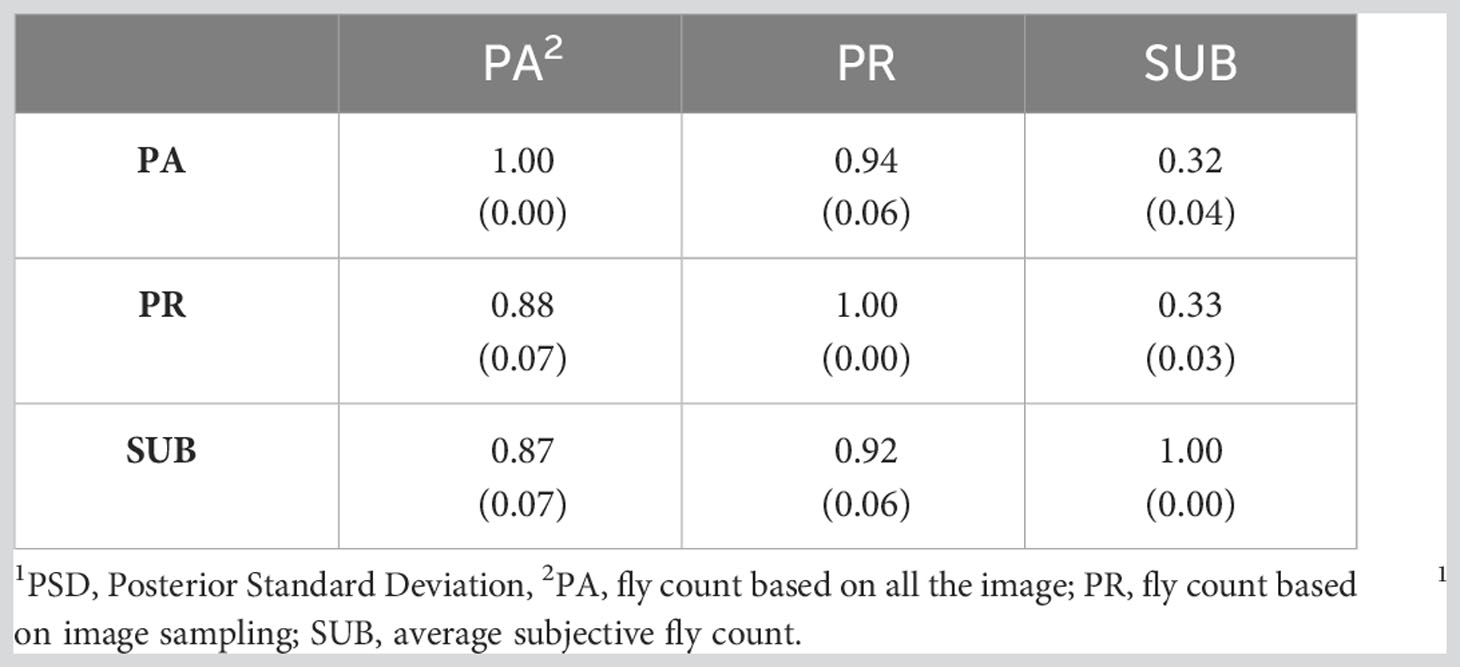
Table 7 Residual correlations (PSD1) between the three horn fly abundance phenotypes for the continuous (above diagonal) and discrete (below diagonal) cases.
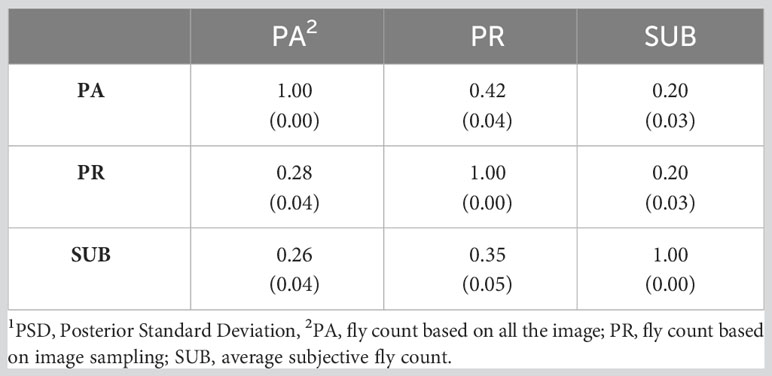
Table 8 Permanent environment correlations (PSD1) between the three horn fly abundance phenotypes for the continuous (above diagonal) and discrete (below diagonal) cases.
4 Discussion
Across the two farms used in this study, there was a substantial variation in horn fly abundance between animals under similar management and environmental conditions as indicated in Table 1 and Figure 3. In fact, the coefficient of variation ranged between 0.43 and 1.02 which may suggest the presence of non-negligible genetic component. These correlations between evaluators were relatively smaller than those reported by our group when only two evaluators were used for horn fly assessment [20]. This unexpected decrease in concordance could be the result of an increased agitation of the animals due to higher human presence or/and a higher likelihood that one or more evaluators viewed the animal under slightly different conditions such as right after the animal disturbs the flies with their tail.
The correlations between the different assessment methods showed a higher correlation between the subjective and PA (0.65) compared to SUB and PR (0.46). This might be due to the small data set (n=184) used to assess the correlation between SUB and PA compared to when PR was used (n=1266). In fact, there were more animals assessed by multiple evaluators in the larger data set. The correlation increased to 0.95 between the two image-based counts (Table 4) indicating that one can assess the total number of flies by counting a portion of randomly selected boxes within density regions placed across the animal’s body. The PR method was far less time consuming for animals with high fly counts and it cuts the time needed to process an image by almost 80%. Due to this drastic increase in efficiency and high accuracy, we proceeded to assess the remaining photos using the PR method.
Under the continuous and discrete scenarios, PA has the highest heritability estimates. Heritability estimates for SUB and PR were very similar. It is worth mentioning that PA has a high missing rate in excess of 85%. Although our data set is the largest, to the best of our knowledge, that was used to estimate heritability of horn fly abundance in beef cattle, it remains relatively small, resulting in large posterior standard deviations (Table 6). Based on the 95% high posterior density intervals (HPD), all heritability estimates are not statistically different from each other. Although similar to recent results reported by Ling et al. (2020), our heritability estimates, at the continuous and liability scales, are at the lower end of reported estimates (Brown et al., 1992: Fraga et al., 2005) These early studies are based on small datasets with limited pedigree information. Furthermore, they only used subjective assessment of horn fly abundance.
The heritability estimates indicate the existence of sufficient genetic variance across the three horn fly abundance related trait methods that can be exploited for selection against horn fly attraction. Although small, these estimates are similar to those of some traits already included in regular genetic evaluations. The genetic correlations indicate only a small similarity between the image-based and the subjective assessment of horn flies, especially in the continuous case. This is likely due to the inconsistency of fly count assessment across methods. Subjective assessments are logistically demanding and suffer from great variability across evaluators, which will reduce its attractiveness as a practical option to assess fly abundance. Image-based assessments are more objective and logistically less demanding than the subjective assessments. However, they are highly affected by animal movement, and one image per animal is often insufficient. Furthermore, accurate and automated image-based fly counts are needed. This is an active area of research and hopefully a practical method will emerge soon. Alternative methods based on non-count assessment of horn fly abundance are being investigated (Warner et al., 2022). These methods rely on the predictive power of correlated phenotypes and endo-phenotypes to assess fly abundance.
Discrete assessment of horn fly abundance showed a greater consistency across the three methods and may offer an alternative solution that could simplify the subjective and image-based assessments. Although we are interested in reducing the fly abundance as much as possible, from an economic and animal welfare point of view, it is sufficient to reduce the fly abundance below the economic injury threshold. Currently, that threshold is heuristically set to 200 flies. Thus, even a binary classification of fly abundance (below and above the threshold) might offer a practical solution.
With the rise in ambient temperature, we are witnessing an expansion of the geographical areas affected by horn flies and the length of the fly season. This will further increase economic losses to the livestock industry and negatively impact the well-being of animals. Cost effective and scalable new machine and sensor-based data collection approaches together with artificial intelligence tools are needed to develop practical large-scale horn fly data collection.
Data availability statement
The original contributions presented in the study are included in the article, further inquiries can be directed to the corresponding author/s.
Ethics statement
The animal study was approved by Institutional Animal Care and Use Committee University of Georgia. The study was conducted in accordance with the local legislation and institutional requirements.
Author contributions
AW: Data curation, Formal Analysis, Software, Validation, Writing – original draft, Writing – review & editing. BH: Conceptualization, Resources, Validation, Writing – review & editing. NH: Conceptualization, Resources, Writing – review & editing. TP: Conceptualization, Resources, Writing – review & editing. SA: Conceptualization, Writing – review & editing. RR: Data curation, Formal Analysis, Funding acquisition, Investigation, Project administration, Resources, Software, Supervision, Writing – original draft, Writing – review & editing, Conceptualization.
Funding
The author(s) declare financial support was received for the research, authorship, and/or publication of this article. This research was funded by Georgia Commodity Commission for Beef, grant number RGABF0001025701 and USDA-NIFA grant number USDA-NIFA 2021-07072.
Acknowledgments
A special thank you to the farm crew at Northwest Georgia Research and Education Center and the Eatonton Beef Research unit for their assistance with data collection.
Conflict of interest
The authors declare that the research was conducted in the absence of any commercial or financial relationships that could be construed as a potential conflict of interest.
Publisher’s note
All claims expressed in this article are solely those of the authors and do not necessarily represent those of their affiliated organizations, or those of the publisher, the editors and the reviewers. Any product that may be evaluated in this article, or claim that may be made by its manufacturer, is not guaranteed or endorsed by the publisher.
References
Arther R. G. (1991) Management of horn fly resistance. Available at: https://animal.ifas.ufl.edu/beef_extension/bcsc/1991/pdf/arther.pdf.
Barros A. T. M., Ottea J., Sanson D., Foil L. D. (2001). Horn fly (Diptera: muscidae) resistance to organophosphate insecticides. Vet. Parasitol. 96, 243–256. doi: 10.1016/S0304-4017(00)00435-0
Brown A. H., Steelman C. D., Johnson Z. B., Rosenkrans C. F., Brasuell T. M. (1992). Estimates of repeatability and heritability of horn fly resistance in beef cattle. J. Anim. Sci. 70, 1375–1381. doi: 10.2527/1992.7051375x
Byford R. L., Craig M. E., DeRouen S. M., Kimball M. D., Morrison D. G., Wyatt W. E., et al. (1999). Influence of permethrin, diazinon and ivermectin treatments on insecticide resistance in the horn fly (Diptera: muscidae). Int. J. Parasitol. 29, 125–135. doi: 10.1016/S0020-7519(98)00196-9
Cilek J. E., Steelman C. D., Knapp F. W. (1991). Horn fly (Diptera: muscidae) insecticide resistance in kentucky and arkansas. J. Econ. Entomol. 84, 756–762. doi: 10.1093/jee/84.3.756
Fraga A. B., Alencar M. M., Figueiredo L. A., Razook A. G., Cyrillo G. N. (2005). Genetic Analysis of the Infestation of Females of the Caracu Cattle Breed by Horn Fly (Haematobia irritans irritans) (L.) (Diptera, Muscidae). Genet. Mol. Biol. 28, 242–247. doi: 10.1590/S1415-47572005000200011
Guglielmone A., Curto E., Anziani O., Mangold A. (2001). Cattle breed-variation in infestation by the horn fly. Haematobia irritans. Med. Vet. Entomol. 14, 272–276. doi: 10.1046/j.1365-2915.2000.00235.x
Hinkle N. (2018). Livestock, poultry, and pets. In: Georgia entomological society arthropod survey. Available at: https://site.caes.uga.edu/ges/files/2019/04/2018-GES-Arthropod-Survey.Report.FINAL_.pdf (Accessed 10 August 2022).
ImageJ. Available at: https://imagej.nih.gov/ij/download.html (Accessed June 2019).
Jones A. V., Tilley M., Gutteridge A., Hyde C., Nagle M., Ziemek D., et al. (2017). GWAS of self-reported mosquito bite size, itch intensity and attractiveness to mosquitoes implicates immune-related predisposition loci. Hum. Mol. Genet. 26, 1391–1406. doi: 10.1093/hmg/ddx036
Kunz S. E., Murrell K. D., Lamber G., James L. F., Terrill C. E. (1991). Estimated losses of livestock to pests. CRC Handb. Pest Manage. Agric. 1, 69–98.
Kuramochi K., Nishijima Y. (1980). Measurement of the meal size of the horn fly, Haematobia irritans (L.)(Diptera: Muscidae), by the use of amaranth. Appl. Entomol. Zool. 15, 262–269. doi: 10.1303/aez.15.262
Ling A., Krause T., Heins B., Hinkle N., Pringle D., Aggrey S. E., et al. (2020). Genetic study of horn fly abundance in beef cattle. J. Anim. Sci. 98, 16–17. doi: 10.1093/jas/skaa278.031
Machtinger E. T., Gerry A. C., Murillo A. C., Talley J. L. (2021). Filth fly impacts to animal production in the United States and associated research and extension needs. J. Integr. Pest Manage. 12 (1). doi: 10.1093/jipm/pmab026
Maday J. (2018) Fly service. Drovers. Available at: https://www.drovers.com/news/fly-service.
Meisch M., Lancaster J. (1987). Arthropods in livestock and poultry production. Poult Sci. 66 (1), 192.
Rekaya R., Sapp R. L., Wing T., Aggrey S. (2013). Genetic evaluation for growth, body composition, feed efficiency, and leg soundness. Poult. Sci. 92, 923–929. doi: 10.3382/ps.2012-02649
Steelman C. D., Edward E. G., Tolley G., Hayden B. A. (1993). Individual variation within breeds of beef cattle in resistance to horn fly (Diptera: muscidae). J. Med. Entomol. 30, 414–420. doi: 10.1093/jmedent/30.2.414
Taylor D. B., Moon R. D., Mark D. R. (2012). Economic impact of stable flies (Diptera: muscidae) on dairy and beef cattle production. J. Med. Entomol. 49 (1), 198–209. doi: 10.1603/ME10050
Keywords: horn fly, heritability, subjective, image-based analysis, continuous, discrete
Citation: Warner AM, Heins BD, Hinkle NC, Pringle TD, Aggrey SE and Rekaya R (2023) Genetic parameters of subjective and image-based horn fly abundance phenotypes. Front. Anim. Sci. 4:1284684. doi: 10.3389/fanim.2023.1284684
Received: 28 August 2023; Accepted: 30 October 2023;
Published: 16 November 2023.
Edited by:
Peer Berg, Norwegian University of Life Sciences, NorwayReviewed by:
Jennifer Thomson, Montana State University, United StatesMatthew L Spangler, University of Nebraska-Lincoln, United States
Copyright © 2023 Warner, Heins, Hinkle, Pringle, Aggrey and Rekaya. This is an open-access article distributed under the terms of the Creative Commons Attribution License (CC BY). The use, distribution or reproduction in other forums is permitted, provided the original author(s) and the copyright owner(s) are credited and that the original publication in this journal is cited, in accordance with accepted academic practice. No use, distribution or reproduction is permitted which does not comply with these terms.
*Correspondence: Amanda M. Warner, YW1hbmRhLndhcm5lckB1Z2EuZWR1
 Amanda M. Warner
 Bradley D. Heins2
 Samuel E. Aggrey
 Romdhane Rekaya