
95% of researchers rate our articles as excellent or good
Learn more about the work of our research integrity team to safeguard the quality of each article we publish.
Find out more
ORIGINAL RESEARCH article
Front. Anim. Sci. , 02 May 2023
Sec. Animal Physiology and Management
Volume 4 - 2023 | https://doi.org/10.3389/fanim.2023.1180975
This article is part of the Research Topic Current State of Male Physiological Research and the Impacts of Environment and Fetal Programming in Livestock View all 6 articles
 Saulo Menegatti Zoca1,2
 Thomas W. Geary3
 Abigail L. Zezeski3
 Karl C. Kerns4
 Joseph C. Dalton5
 Bo R. Harstine6
 Matthew D. Utt6
 Robert A. Cushman7
 Julie A. Walker2
 George A. Perry8*
Introduction: This study evaluated whether post in vitro capacitation changes in sperm could be used to estimate field fertility differences between bulls.
Methods: Frozen-thawed semen from five bulls (two to four ejaculates per bull) previously identified as high (48.1% and 47.7%), intermediary (45.5%) or low (40.7% and 43.1%) fertility, based on pregnancy per AI (P/AI), were evaluated for total and progressive motility, sperm plasma membrane integrity (viability), acrosome integrity (viable sperm with an intact or disrupted acrosome), reactive oxygen species (ROS; viable sperm ROS+ or ROS-), mitochondrial membrane energy potential, zinc signatures (signatures 1-to-4) and CD9 protein populations at pre-wash and post-wash (only total and progressive motility), h0 (diluted with non-capacitation media), and at h0, h0 CM, h3, h6, and h24 after dilution with capacitation media (CM) and incubation at 37ºC. Data were analyzed using the GLIMMIX procedure as repeated measures in SAS with bull, time and the interaction as fixed effects.
Results: Bull by time interaction was significant (P≤0.03) for total motility, viability, viable sperm with disrupted acrosome, and zinc signature 3. There tended (P=0.06) to be a bull by time interaction for zinc signatures 1+2 combined. Time was significant (P≤0.003) in all analyses, except viable ROS- (P=0.12). There was a significant effect of bull (P≤ 0.03) for viability, viable sperm with disrupted acrosome, zinc signatures 1, 2 and 1+2, viable CD9- and dead CD9+. High and intermediary fertility bulls had greater (P≤0.04) percentages of viable sperm, zinc signature 2 and zinc signature 1+2 compared to low fertility bulls. High and intermediary fertility bulls had decreased (P≤0.05) percentage of dead CD9+ compared to low fertility bulls. Viable CD9+ differed (P=0.02) and viable sperm with an intact acrosome and viable CD9+ tended to differ (P=0.06) amongst bulls; however, association with field fertility was not observed. There was a positive correlation between P/AI and zinc signature 2 (P=0.04), and there tended to be a positive correlation between P/AI and viability (P=0.10), and zinc signature 1+2 (P=0.10).
Discussion: In summary, incubation of sperm in CM and flow cytometry analyses for viability, zinc signatures 2 and 1+2, and dead CD9+ seems promising to estimate in vivo fertility differences amongst bulls.
An ejaculate is a heterogeneous population of sperm; consequently, some sperm will likely display undesirable characteristics. For a bull to be categorized as “high fertility”, it is important that a large proportion of its ejaculate has desirable characteristics (normal morphology, progressive motility, intact acrosome and plasma membranes, stable DNA, the ability to undergo capacitation) (Rodriguez-Martinez, 2003; Saacke, 2008; Vincent et al., 2012; Garner, 2014). The concentrations and types of undesirable characteristics of a bull’s ejaculate will determine, to some extent, the bull’s fertility rating. Some insemination problems (i.e. caused by “compensable” sperm characteristics) can be overcome by increasing the insemination dose; however, increasing the insemination dose cannot overcome other problems (i.e. caused by “uncompensable” sperm characteristics). In brief, defects that prevent the sperm from reaching the site of fertilization are considered to be compensable and defects that hinder embryo development after fertilization are considered to be uncompensable. The concept of compensable and uncompensable sperm characteristics was originally described by Saacke et al. (1994).
According to the Society for Theriogenology, a bull breeding soundness exam (BSE) focuses on the potential quantity of sperm produced (measure of scrotal circumference) and evaluates the quality of sperm ejaculated and physical soundness of the sperm on the day of the exam (Koziol and Armstrong, 2018). Conventional BSEs can detect differences in fertility levels with a high degree of accuracy; however, animals with a fertility level that is below average or low may still be incorrectly classified as satisfactory potential breeders. Even among artificial insemination (AI) sires that pass semen quality control analysis, it is impossible to guarantee a high level of fertility because of unknown or unmeasured semen characteristics (DeJarnette, 2005). Thus, the development of new methods to estimate bull field fertility is still necessary.
Sperm need to reside in the oviduct for approximately 6 h to acquire fertilization capacity. During this time, sperm undergo a series of biochemical transformations that are collectively called capacitation (Austin, 1951; Chang, 1951). Capacitation can be induced in vitro and has been reported to affect in vitro oocyte fertilization (Parrish et al., 1986; Parrish et al., 1988). Several methods of measuring sperm capacitation have been developed (reviewed by Gillan et al., 2005). Recently, intracellular zinc was used to determine sperm capacitation status through changes in zinc signatures, and this method has been used to improve boar fertility (Kerns et al., 2018). The ability of individual sperm to undergo capacitation varies within an ejaculate and across bulls and may affect fertility; thus, evaluation of sperm capacitation could be a suitable new method to estimate bull field fertility.
It has been demonstrated that proteins present in the sperm head are associated with sperm adhesion to or fusion with the oocyte plasma membrane in mice. These proteins are equatorin (or MN9 antigen), CD9, and IZUMO1 (Toshimori et al., 1998; Manandhar and Toshimori, 2001; Inoue et al., 2005; Ito et al., 2010; Satouh et al., 2012). In addition, oocyte JUNO (IZUMO1 receptor) and tetraspanins CD9 and CD81 have been demonstrated to be required for fertilization in mice (Kaji et al., 2000; Le Naour et al., 2000; Miyado et al., 2000; Rubinstein et al., 2006; Bianchi et al., 2014). The proteins CD9, JUNO, and IZUMO1 have been reported to be present in bovine gametes (Zhou et al., 2009; Antalíková et al., 2015; Fukuda et al., 2016; Zhao et al., 2018). When zona-free oocytes were incubated with anti-CD9 antibodies, oocyte fertilization rates significantly decreased (41.6% vs. 81.3%; Zhou et al., 2009); however, the requirement for JUNO and IZUMO1 in bovine fertilization has not been demonstrated. The protein CD9 has been well characterized in oocytes (Kaji et al., 2000; Le Naour et al., 2000; Miyado et al., 2000; Rubinstein et al., 2006; Sutovsky, 2009; Zhou et al., 2009). In relation to sperm, the characterization and function of CD9 is not fully understood; however, it has been reported that CD9 is present in the sperm of mice (Rubinstein et al., 2006; Barraud-Lange et al., 2007; Ito et al., 2010; Barraud-Lange et al., 2012), boars (Kaewmala et al., 2011), and bulls (Antalíková et al., 2015; Zoca et al., 2022a; Zoca et al., 2022b). The objective of this study was to evaluate whether in vitro capacitation of sperm coupled with flow cytometric analysis can be used to estimate fertility differences among bulls. A secondary objective was to identify the presence of CD9 in bovine sperm and its possible role as a fertility biomarker.
Semen from five Angus bulls with known field fertility as evaluated in two research trials (Richardson et al., 2017; Zoca et al., 2020) were used in this study. Bull identification was the same as in Zoca et al. (2020) for bulls A through E (bull age at the time of semen collection was 2, 4, 3, 2, and 2 years for bulls A through E, respectively). Bulls A and D were used in both research projects (Zoca et al., 2020 and Richardson et al., 2017) and were bulls 1 and 2, respectively, from Richardson et al. (2017). Samples from a total of 15 collection dates were evaluated, with a 55-d range between first and last collection. For bulls A to E, pregnancy per artificial insemination (P/AI) rate, number of breedings per research project per bull, collection dates per bull evaluated, range of days between first and last semen collection, and P/AI rate in relation to estrus expression as described by Richardson et al. (2017) are described in Table 1. Semen straws were thawed and evaluated at pre-wash, at post-wash, and at h0, h3, h6, and h24 of incubation at 37°C for total motility (TMOT) and progressive motility (PROG). Plasma membrane integrity (viability), acrosome integrity, reactive oxygen species (ROS), zinc signatures, mitochondrial membrane energy potential (mito-potential), CD9 protein populations, and CD9 fluorescence intensity (i.e., relative concentration) were measured with flow cytometry as described below. Samples were also used to characterize the localization of CD9 in sperm by fluorescence microscopy. At h0 samples were diluted in a capacitation medium (CM) and in a bovine non-capacitation medium (bNCM) for baseline assessment of each measurement.
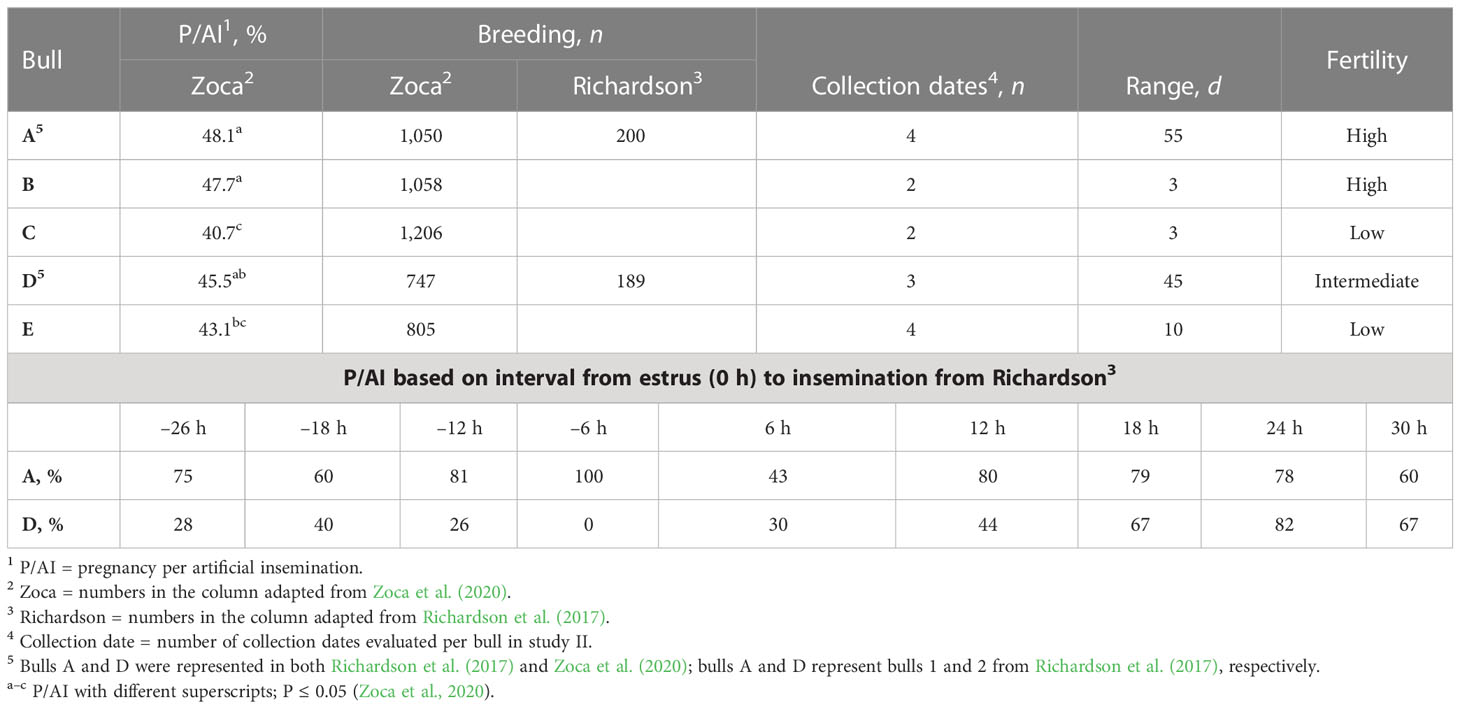
Table 1 Bulls A to E P/AI1, number of AI per research (breeding), number of collection dates used, range of d between first and last collection date, evaluated (range), and field fertility level assignment (fertility; adapted from Richardson et al., 2017; Zoca et al., 2020).
Two or three straws of semen from the same bull and collection date were thawed at 37°C for 60 s and combined in a single tube. An aliquot was removed for computer-assisted TMOT and PROG analysis (CASA; IVOS II; Hamilton Thorne, Beverly, MA, USA). The remaining semen was pipetted into two or three (according to number of straws thawed) 15-mL conical tubes filled with 10 mL of bNCM pre warmed to 37°C; tubes were centrifuged at 500 × g for 10 min, the supernatant was removed, and pellets were combined in a 2-mL tube and resuspended with approximately 200 µL of bNCM. bNCM was composed of NaCl (100 mM), NaH2PO4 (0.3 mM), KCl (3.1 mM), MgCl2·6H2O (0.4 mM), polyvinyl alcohol (PVA; 0.01 mM, FW 10,000 with unknown % hydrolyzed), Na-pyruvate (1 mM), Na-lactate (22 mM, 60% w/w), HEPES (40 mM), Gentamicin 10 mg/mL stock (21 mM), and penicillin G (0.174 mM); pH 7.20. The medium was sterile filtered and stored at 4°C for no more than 14 d. Bovine CM was composed of bNCM with the following reagents added (final concentration): CaCl2·2H2O (2.1 mM), NaHCO3 (2 mM), heparin (10 µg/mL), and fatty acid-free bovine serum albumin (BSA; 6 g/mL); pH 7.40. The CM was prepared daily.
Samples were evaluated for post-wash TMOT, PROG, and sperm concentration. The samples were then diluted in bNCM to a concentration of 40 million sperm per mL, followed by dilution in CM to 17 million sperm per mL. At baseline (h0) an aliquot was diluted to 17 million sperm per mL in bNCM. Thus, the final volume and concentration of semen in each tube used for incubation was the same for all samples. A preliminary study conducted in our laboratory determined that samples diluted in CM and samples diluted only in bNCM, and incubated for up to 24 h at 37°C, reacted differently. For sperm diluted in CM compared with sperm diluted in bNCM only, there was a significant (P < 0.0001) decrease in viability (14.6 vs. 21.8), zinc signature 2 (10.5 vs. 18.2), and zinc signature 1+2 (12.0 vs. 20.9) percentages. Because of semen extender mixed with semen in straws and the sperm concentration was unknown, evaluation of pre- and post-wash sperm by flow cytometry was not possible. Semen from a control bull was thawed and washed as described in this section at each time point (h0, h0 CM, h3, h6, and h24). Semen from the control bull was diluted in bNCM at h0 and used to ensure proper machine accuracy for all analyses; therefore, the control results were used as a covariate adjustment for all analyses. Semen was always maintained at 37°C except when at centrifugation- and assay-specific temperatures. Aliquots of semen were removed at each time point for analysis. All samples were analyzed in duplicate, and the average of the duplicates were used for statistical analyses. In vitro capacitation was induced as described previously (Kerns et al., 2018).
Sperm motility analyses were performed using CASA. In brief, 10 µL of semen was diluted in 10 µL of bNCM and 20 µL of Hoechst 33342 (final concentration 40 µg/mL), and samples were incubated at 37°C for 10 min. After incubation, samples were loaded on a Leja slide (IMV Technologies, France) and evaluated for sperm concentration, TMOT, and PROG.
All flow cytometric assays were performed in flat-bottom polystyrene 96-well plates and evaluated with a Guava EasyCyte 5HT (IMV Technologies, France) flow cytometer; data acquisition and analyses were performed using the GuavaSoft software (version 1.0; IMV Technologies). A total of 10,000 cells were analyzed per sample (5,000 cells per duplicate). The flow cytometer was cleaned and EasyCheck calibration beads were used to assure proper machine performance daily.
Plasma membrane integrity was evaluated with SYBR-14 and propidium iodide (PI) (adapted from Garner et al., 1994; 1997). In brief, samples were incubated for 10 min with SYBR-14 (900 nM working solution) and PI (1 mg/mL). Results for viability were expressed as percentage of sperm with intact plasma membrane (viable; SYBR-14 positive and PI negative). Sperm acrosome integrity was determined by fluorescein isothiocyanate-conjugated peanut agglutinin (PNA) as previously described (Purvis et al., 1990; Tao et al., 1993). In brief, samples were incubated for 10 min with a stain mix (1 µL of PI, 0.5 µL of PNA, and 48.5 µL of bNCM, and filtered in a 0.22-nm filter). Results for acrosome status were expressed as percentage of viable sperm with intact acrosome (viable intact; PI negative and PNA negative) or disrupted acrosome (viable disrupted; PI negative and PNA positive) and disrupted sperm plasma membrane (dead) with intact acrosome (dead intact; PI positive and PNA negative) or disrupted acrosome (dead disrupted; PI positive and PNA positive).
Reactive oxygen species in sperm were measured using EasyKit 3 (IMV Technologies) following the manufacturer’s procedures. In this assay, sperm are challenged with H2O2; sperm that react to this challenge are considered ROS positive [ROS+; green dye (proprietary information) positive] and sperm that do not react to this challenge are considered ROS negative (ROS–; green dye negative). Results for ROS were expressed as percentage of viable ROS+, viable ROS–, dead ROS+, and dead ROS–. The main population of interest in this assay was the viable and ROS+ sperm, and it is worth noting that, as this was a 3-hour assay, modifications in sperm physiology were expected and a true 0 h was not possible. Mitochondrial membrane potential (mito-potential) was evaluated with JC-1 (8 µM), diluted in ethanol (200 proof) and bNCM, and incubated for 30 min (adapted from Garner et al., 1997; Guthrie and Welch, 2008). Results were expressed as percentage of high mito-potential.
Sperm zinc signatures are a measure of sperm capacitation and have been characterized for human, boar, and bovine sperm by Kerns et al. (2018). The zinc signature assay used here was adapted from Kerns et al. (2018). In brief, 90 µL of sample and 10 µL of Fluozin-3 AM (FZ3; 1:400 dilution in bNCM; Invitrogen, Thermo Fisher, Waltham, MA, USA) were incubated at room temperature for 30 min without light exposure. After incubation, samples were centrifuged at 300 × g for 5 min, supernatant was removed, 75 µL of bNCM was added, and the pellet was resuspended; samples were incubated at room temperature for 30 min without light exposure. After incubation, 25 µL of PI (1 mg/mL at 1:50 dilution in bNCM) was added to samples and incubated at room temperature for 15 min without light exposure, followed by evaluation with flow cytometry. Zinc signature results were expressed as percentage of signature 1 (viable non-capacitated sperm with high intracellular zinc), signature 2 (viable sperm in the process of capacitation with low intracellular zinc), signature 3 (dead and capacitated sperm with high intracellular zinc in the mitochondrial sheath or the acrosome region or both), and signature 4 (dead sperm without zinc). Events negative for FZ3 and PI were considered to be debris and removed from analyses. Zinc signatures 1 and 2 combined (zinc signature 1+2) were considered to be the population with fertilization potential.
For CD9 evaluation, anti-CD9 antibody (mouse anti-bovine, IVA50, monoclonal; Invitrogen, Waltham, MA, USA) was conjugated to fluorescein isothiocyanate [FITC conjugation kit (fast) – lightning-link, ab188285, ABCAM, United Kingdom], final concentration 0.83 µg/µL. Samples (15 µL; ~250,000 sperm) were diluted in bNCM (35 µL) and incubated with 1 µL of anti-CD9/FITC and 1 µL of PI for 1 h at 37°C (adapted from Antalíková et al., 2015). Flow cytometric CD9 and PI evaluation included the following populations: viable CD9+, dead CD9+, viable CD9–, and dead CD9–. Assays were performed using 250 µL of bNCM and 5 µL of incubated sample per well. In addition, CD9 concentrations in viable and dead populations were evaluated. The localization of CD9 in sperm was characterized by fluorescence microscopy (BZ-X710; Keyence) at 600× magnification under oil immersion.
Flow cytometry and CASA results were evaluated with the GLIMMIX procedure of SAS (9.4). For all analyses, data were assumed to be beta distributed and the link function logit was used. The degrees of freedom method used was the Kenward–Roger method. Bull (A to E), time (pre wash, post wash, h0, h0 CM, h3, h6, and h24), and their interaction were used as fixed effects. Bulls A and B were “high-fertility” bulls, bulls C and E were “low-fertility” bulls, and bull D was an “intermediate-fertility” bull. Three random statements were used. The first random statement was used to model the R-side of residuals to analyze the data as repeated measures. The subject was collection date per bull, with covariate structures selected based on the smaller -2 Res Log Pseudo-Likelihood. The covariate structures selected for each variable were first-order ante-dependence (ANTE(1); dead intact, dead disrupted, dead ROS+, zinc signature 3, zinc signature 4, viable CD9–, and dead CD9–), first-order autoregressive (AR(1); viable disrupted), heterogeneous first-order autoregressive (ARH(1); viable intact, viable ROS– and ROS+, dead ROS–, mito-potential, zinc signature 1+2), heterogeneous compound symmetry (CSH; viability and zinc signature 2), Toeplitz (TOEP; TMOT, zinc signature 1, viable CD9+, and dead CD9+), and variance components (VC; PROG). The second random statement was the intercept and the third was the residual. Least square means were compared using the PDIFF option, and the ilink function was used to inverse transform least square means. CD9 concentration was evaluated with the MIXED procedure of SAS for repeated measures with bull, time, and their interaction as fixed effects. Collection date per bull was used as subject, and ANTE(1) was selected as the covariate structure for both live and dead sperm CD9 concentration based on the smaller BIC value. CD9 localization in sperm was characterized; however, no statistical analysis was performed. Both the correlation between overall bull effect least square mean and P/AI reported by Zoca et al. (2020) and the correlation of CD9 population and CD9 concentration with all sperm parameters were evaluated using the CORR procedure in SAS. Results are presented as mean ± SE. The level of significance was P ≤ 0.05, and a P-value > 0.05 and ≤ 0.10 was considered to indicate a tendency.
There was no interaction between bull and time for PROG (P = 0.36; Figure 1A), dead disrupted (P = 0.33; Supplementary Figure 1A), viable intact (P = 0.82; Supplementary Figure 1B), dead intact (P = 0.20; Supplementary Figure 1C), viable ROS+ (P = 0.21; Supplementary Figure 2A), dead ROS+ (P = 0.47; Supplementary Figure 2B), viable ROS– (P = 0.93; Supplementary Figure 2C), mito-potential (P = 0.88; Supplementary Figure 3A), zinc signatures 1, 2, and 4 (P ≥ 0.16; Figures 2A, C, D, respectively), and CD9 populations (P ≥ 0.18; Figures 3A–D). Nevertheless, the effect of bull by time interaction was significant for TMOT (P = 0.0002; Figure 1B). All bulls had a decrease in percentage of TMOT by time (P ≤ 0.05); however, bulls C and E had a greater TMOT at h0 CM than in bNCM at h0. At pre wash, high-fertility (bulls A and B) and intermediate-fertility (bull D) bulls had a greater percentage of TMOT (P ≤ 0.05) than low-fertility bulls (bulls C and E). After washing (post wash), bull E’s TMOT was decreased compared with that of bulls A and D (P ≤ 0.03) but was not different from that of bull B (P = 0.48); however, bull C’s TMOT tended to be decreased compared with that of bulls A and D (P = 0.07) and was not different from that of bull B (P = 0.55; Figure 1B). At h0, bull A had greater TMOT than bulls C and E (P ≤ 0.03) and at time h0 CM, h3, h6, and h24 no differences (P > 0.10) were detected among bulls. Thus, total motility measured by CASA after thawing (pre-wash time point) of multiple ejaculates was able to estimate fertility differences between these five Angus bulls, with increased percentages of TMOT for high- and intermediate-fertility bulls compared with those of low-fertility bulls.
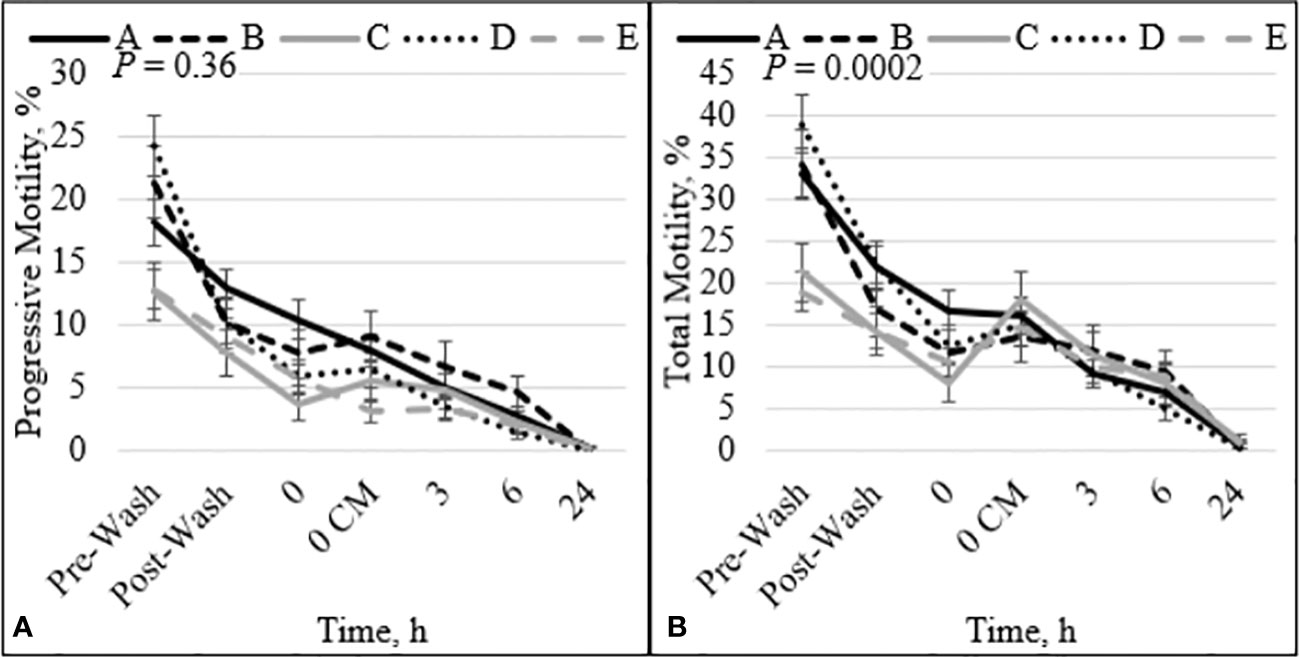
Figure 1 Effect of bull by time interaction on sperm progressive (A) and total (B) motility. Bulls that were previously classified as high fertility (A, B), low fertility (C, E), and intermediate fertility (D) were evaluated for total and progressive motility by computer-assisted sperm analysis. Sperm were evaluated after thawing (pre wash), after being washed (post wash), and after 0 (diluted in non-capacitation medium), 0 CM (diluted in capacitation medium), 3, 6, and 24 h of incubation at 37°C.
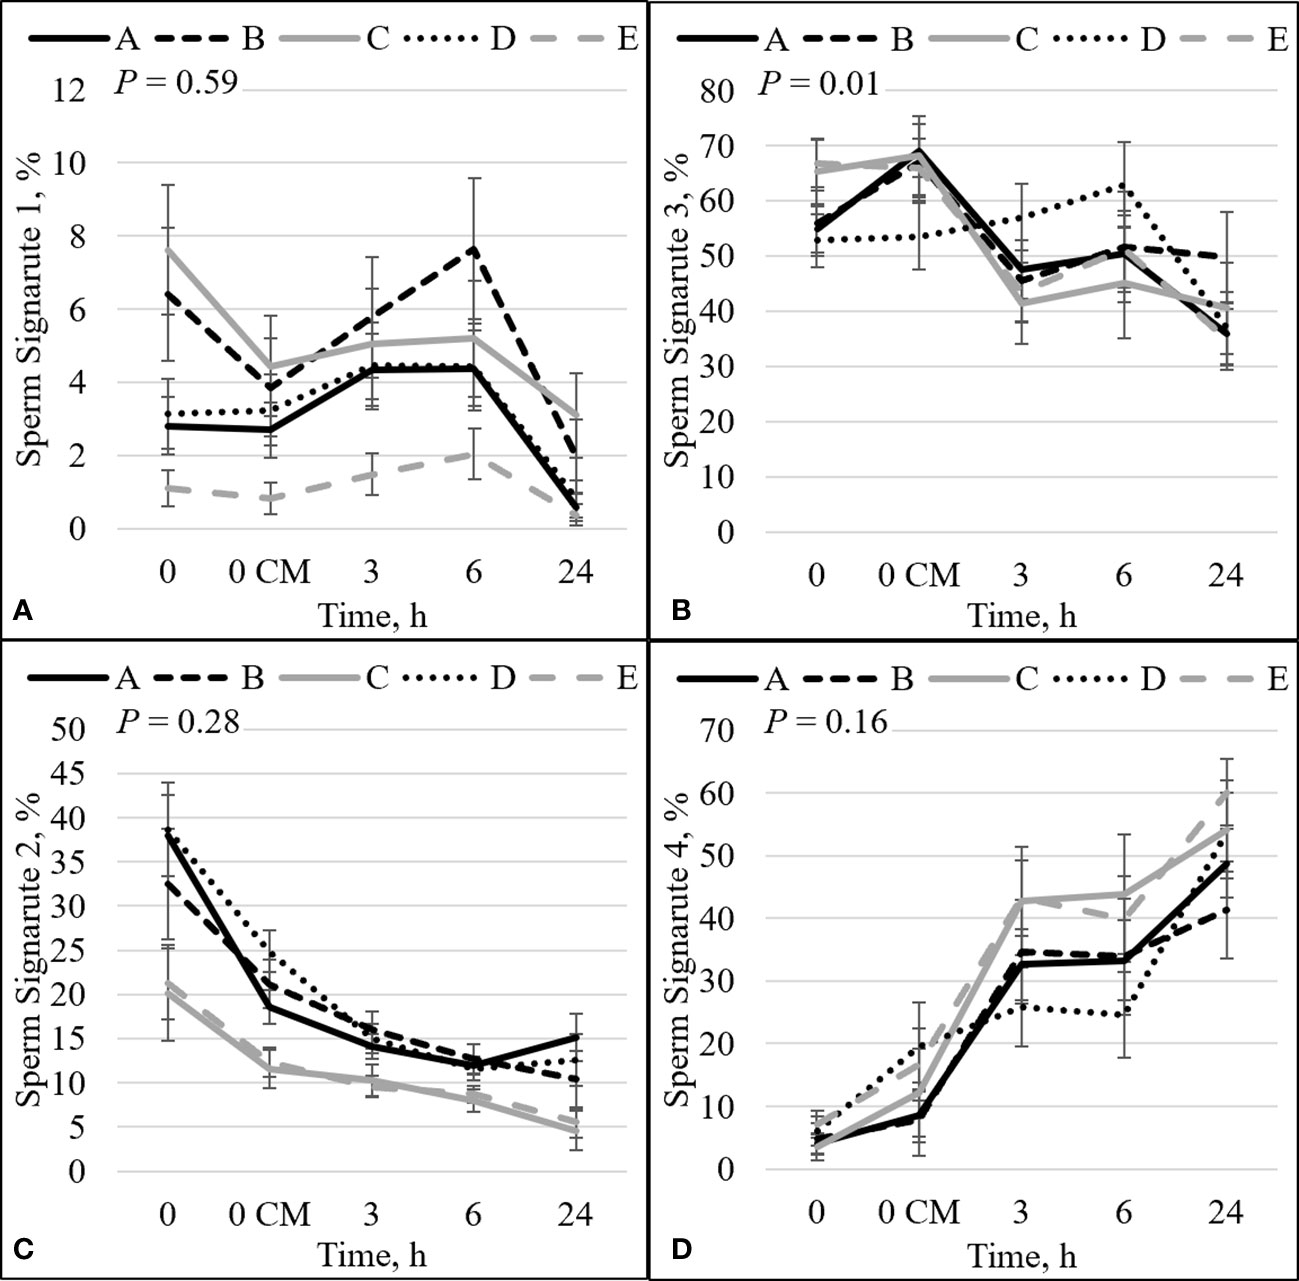
Figure 2 Effect of bull by time interaction on sperm plasma membrane integrity (viability) and zinc concentration. The percentage of sperm with intact plasma membrane (viable) and high zinc concentration (signature 1; sperm not capacitated; A). The percentage of sperm with disrupted plasma membrane (dead) and high zinc concentration (signature 3; sperm that capacitated and died; B). The percentage of viable sperm with low zinc (signature 2; sperm undergoing capacitation; C). The percentage of dead sperm with no zinc (signature 4; dead sperm that may or may not have gone through capacitation before dying; D). Bulls that were previously classified as high- fertility (A, B), low fertility (C, E), and intermediate fertility (D) were evaluated for viability and zinc concentration by flow cytometry. Sperm were evaluated at 0 (diluted in non-capacitation medium), 0 CM (diluted in capacitation medium; CM), 3, 6, and 24 h of incubation at 37°C.
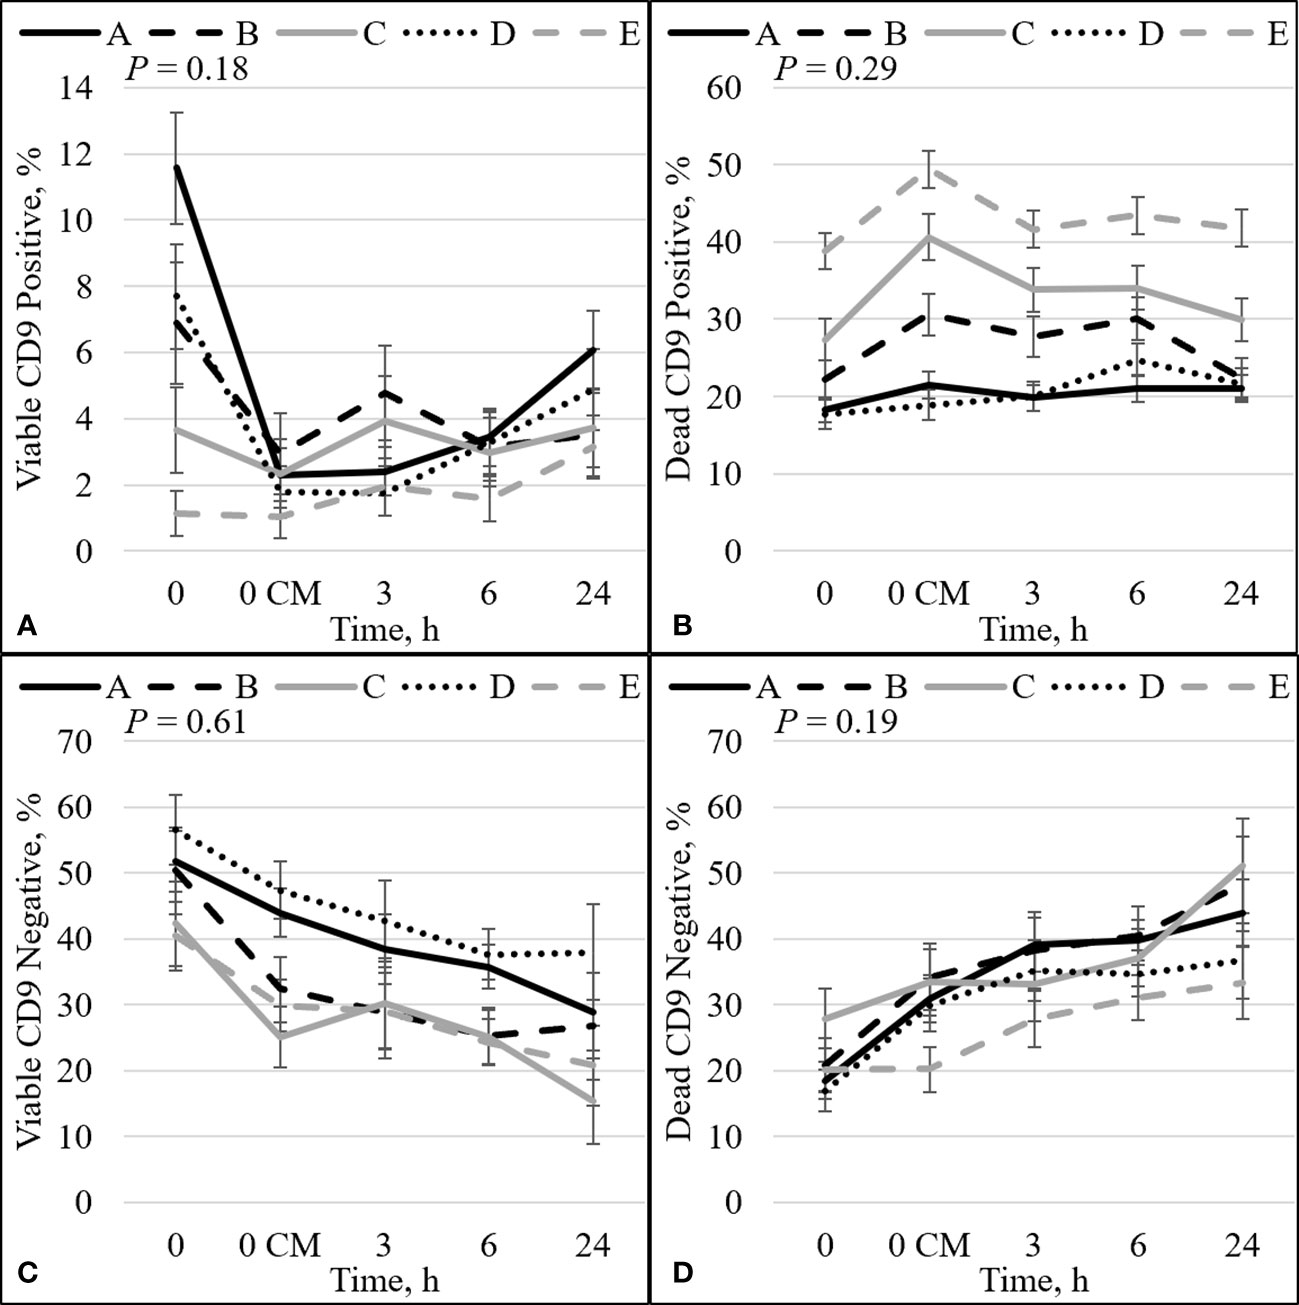
Figure 3 Effect of bull by time interaction on sperm plasma membrane integrity (viability) and CD9. The percentage of sperm with intact plasma membrane (viable) and CD9 positive (A). The percentage of sperm with disrupted plasma membrane (dead) and CD9 positive (B). The percentage of viable sperm and CD9 negative (C). The percentage of dead sperm and CD9 negative (D). Bulls that were previously classified as high fertility (A, B), low fertility (C, E), and intermediate fertility (D) were evaluated for viability and CD9 protein (IVA50; Invitrogen) by flow cytometry. Sperm were evaluated at 0 (diluted in non-capacitation medium), 0 CM (diluted in capacitation medium; CM), 3, 6, and 24 h of incubation at 37°C.
The percentage of sperm undergoing spontaneous acrosome reaction (viable disrupted) was significant for the interaction effect between bull and time (P = 0.03; Figure 4A). The viable disrupted percentage increased over time for bulls A, B, D, and E (P ≤ 0.05; Figure 4A), and bull C did not differ between time points. Nevertheless, there was no association between viable disrupted differences and bull fertility. There was also a significant interaction between bull and time for dead ROS– (P = 0.03; Figure 4B). There was an increase in the percentage of dead ROS– over time for all bulls (P ≤ 0.05). At h0, high-fertility (bulls A and B) and intermediate-fertility (bull D) bulls had a decreased percentage of dead ROS– compared with bull E (P ≤ 0.005). Bull A had a decreased percentage of dead ROS– compared with bull C (P = 0.05), and bulls B and D tended to have a decreased percentage of dead ROS– compared with bull C (P ≤ 0.08). At h0 CM, bulls A and D had a decreased percentage of dead ROS– compared with bulls C and E (P ≤ 0.04); however, bull B’s percentage of dead ROS– did not differ from that of bulls C and E (P ≥ 0.16). Thus, dead ROS– at 0 h could be used to estimate differences in fertility, with high- and intermediate-fertility bulls having a decreased or a tendency to have a decreased percentage of dead ROS– compared with low-fertility bulls.
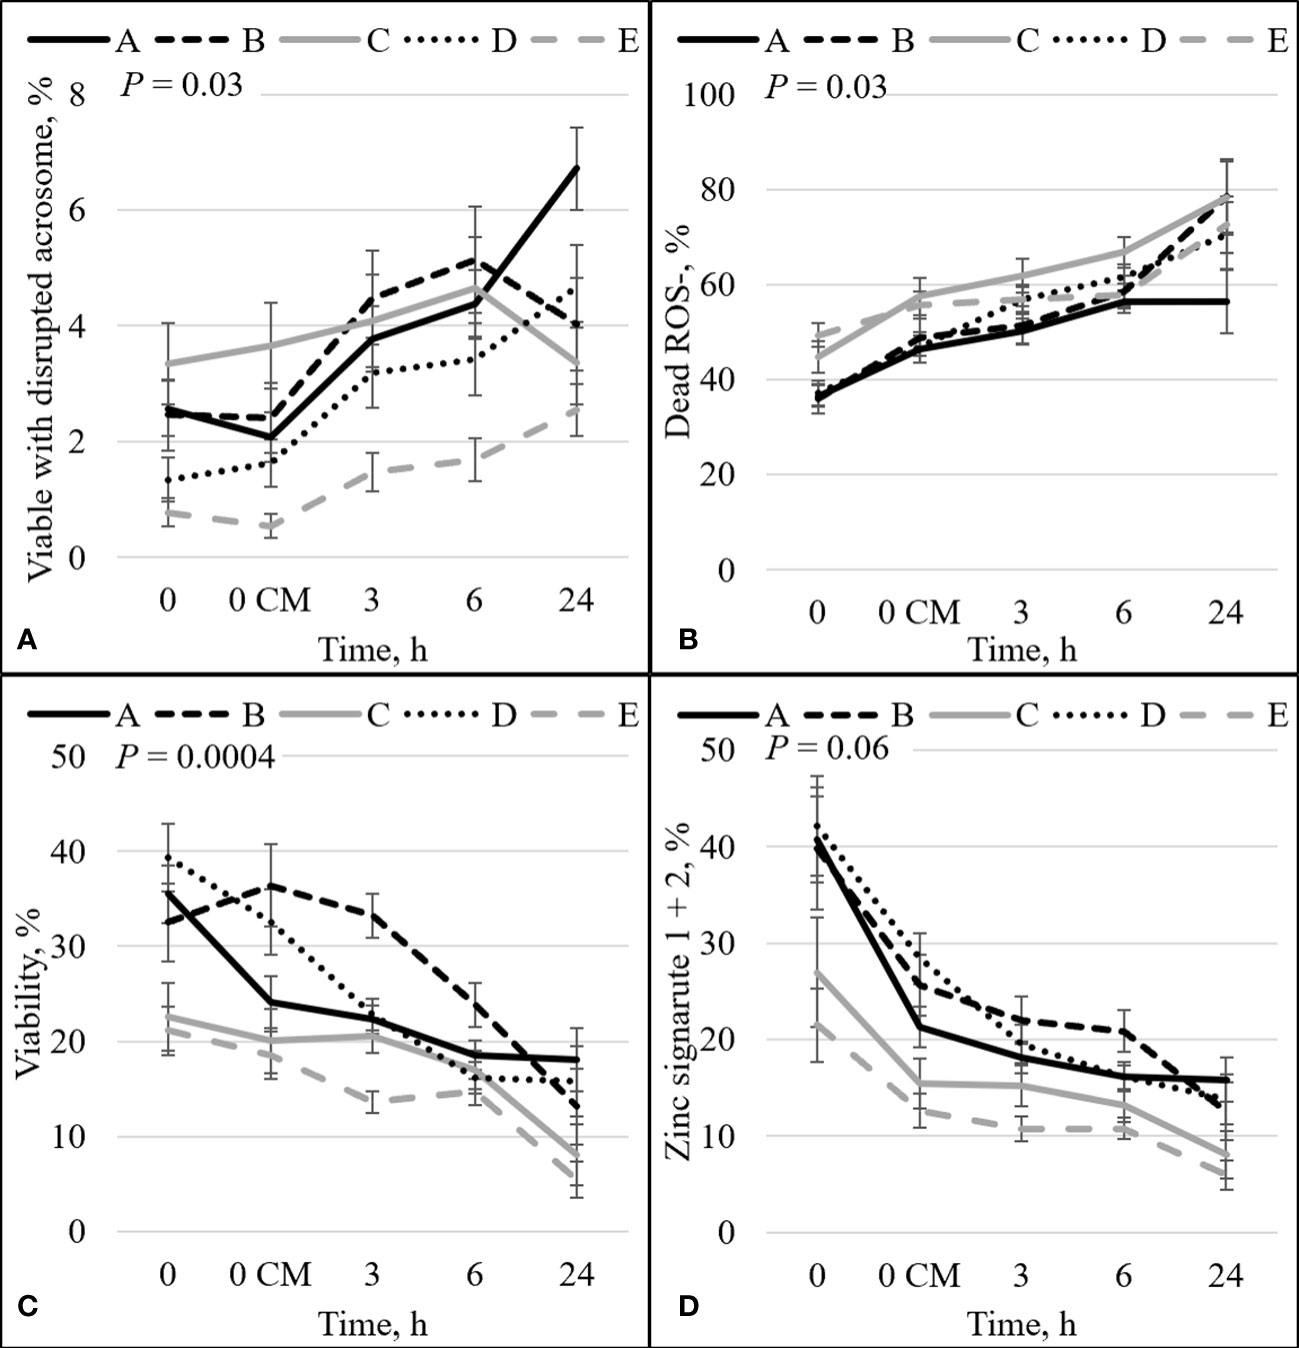
Figure 4 Effect of bull by time on the percentage of: sperm with intact plasma membrane (viable) and disrupted acrosome (A), dead and ROS negative (ROS–) sperm (B), sperm plasma membrane integrity (viability; C), and sperm with an intact plasma membrane (viable) with high (signature 1) and low (signature 2) zinc concentration combined (signature 1+2; D). Bulls that were previously classified as high fertility (A, B), low fertility (C, E), and intermediate-fertility (D) were evaluated by flow cytometry. Sperm were evaluated at 0 (diluted in non-capacitation medium), 0 CM (diluted in capacitation medium), 3, 6, and 24 h of incubation at 37°C.
There was an interaction between bull and time for zinc signature 3 (P = 0.01; Figure 2B). In high-fertility bulls, zinc signature 3 increased statistically (bull A; P = 0.02) or numerically (bull B; P = 0.19) between 0 h and 0 CM, followed by a decrease in the percentage of zinc signature 3; however, low-fertility bulls (bulls C and E) had no changes in zinc signature 3 between 0 h and 0 CM (P ≥ 0.73), followed by a decrease in the percentage of zinc signature 3. Interestingly, bull D (the intermediate-fertility bull) had no change in the percentage of zinc signature 3 from 0 to 6 h incubation, despite a numerical increase at 6 h incubation (P ≥ 0.26); however, there was a decrease in the percentage of zinc signature 3 at h24.
There was a significant interaction between bull and time on the percentage of viable sperm (P = 0.0004; Figure 4C). There was a decrease over time for all bulls (P < 0.05). Even though an increase in the percentage of viable sperm appeared between h0 and h0 CM for bull B (32.5% vs 36.4%), no statistical differences were detected (P = 0.38). At h0, high- and intermediate-fertility bulls had a greater (P ≤ 0.03) or tended to have a greater (P = 0.09) percentage of viable sperm than low-fertility bulls. A greater percentage of viable sperm was observed in high- and intermediate-fertility bulls than in low-fertility bulls at h0; however, sperm diluted with CM could not be used to estimate fertility differences between high- and low-fertility bulls at any single time point. Thus, viability at h0 in bNCM could be used to estimate fertility differences, with differences (or tendencies) between high- and intermediate-fertility and low-fertility bulls.
The combination of zinc signatures 1+2 represents the percentage of viable cells measured by zinc signature assay (≈1 h difference from viability assay). There tended to be an effect of the interaction between bull and time for zinc signature 1+2 (P = 0.06; Figure 4D). All bulls had a decrease in the percentage of zinc signature 1+2 over time (P ≤ 0.05). At h0, high-fertility (bulls A and B) and intermediate-fertility (bull D) bulls had a greater percentage of signature 1+2 (P ≤ 0.02) than bull E. In addition, bulls A and D tended (P ≤ 0.10) to be different than C; however, bull B did not differ (P = 0.16) from bull C. At h0 CM, high- and intermediate-fertility bulls had a greater (P ≤ 0.003) percentage of zinc signature 1+2 than bull E. In addition, bulls B and D were different (P ≤ 0.02) and bull A tended (P = 0.10) to be different than bull C. Thus, zinc signature 1+2 at 0 CM can be used to estimate fertility differences, with all high- and intermediate-fertility bulls having a greater or tending to have a greater percentage of zinc signature 1+2 than low-fertility bulls. No other individual time point could be used to successfully estimate fertility among bulls.
There was no overall effect of bull on the percentage of TMOT, PROG, dead intact, viable ROS+, dead ROS+, viable ROS–, mito-potential, zinc signatures 3 and 4, and dead CD9– (Table 2). The overall effect of bull was significant; however, it could not be used to estimate fertility differences between bulls for viable and dead disrupted, dead ROS–, zinc signature 1, and viable CD9–. In addition, it tended to be significant for viable intact and viable CD9+ (Table 2). The overall effect of bull that was significant and estimated fertility differences between bulls were viability, zinc signature 2, zinc signature 1+2, and dead CD9+ (Table 2), of which high- and intermediate-fertility bulls had a greater overall percentage of viable, zinc signature 2, zinc signature 1+2, and a decreased percentage of dead CD9+ than low-fertility bulls. There was a positive correlation between field fertility and zinc signature 2 (r = 0.89; P = 0.04) and there tended to be a positive correlation between field fertility and viability (r = 0.81; P = 0.10) field fertility and zinc signature 1+2 (r = 0.80; P = 0.10); however, dead CD9+ did not correlate with field fertility (r = –0.68; P = 0.20). Although the percentage of dead ROS– did not estimate fertility differences between bulls, dead ROS– was negatively correlated with field fertility (r = –0.91; P = 0.03). There was no correlation between field fertility and the other sperm parameters evaluated (P > 0.10).
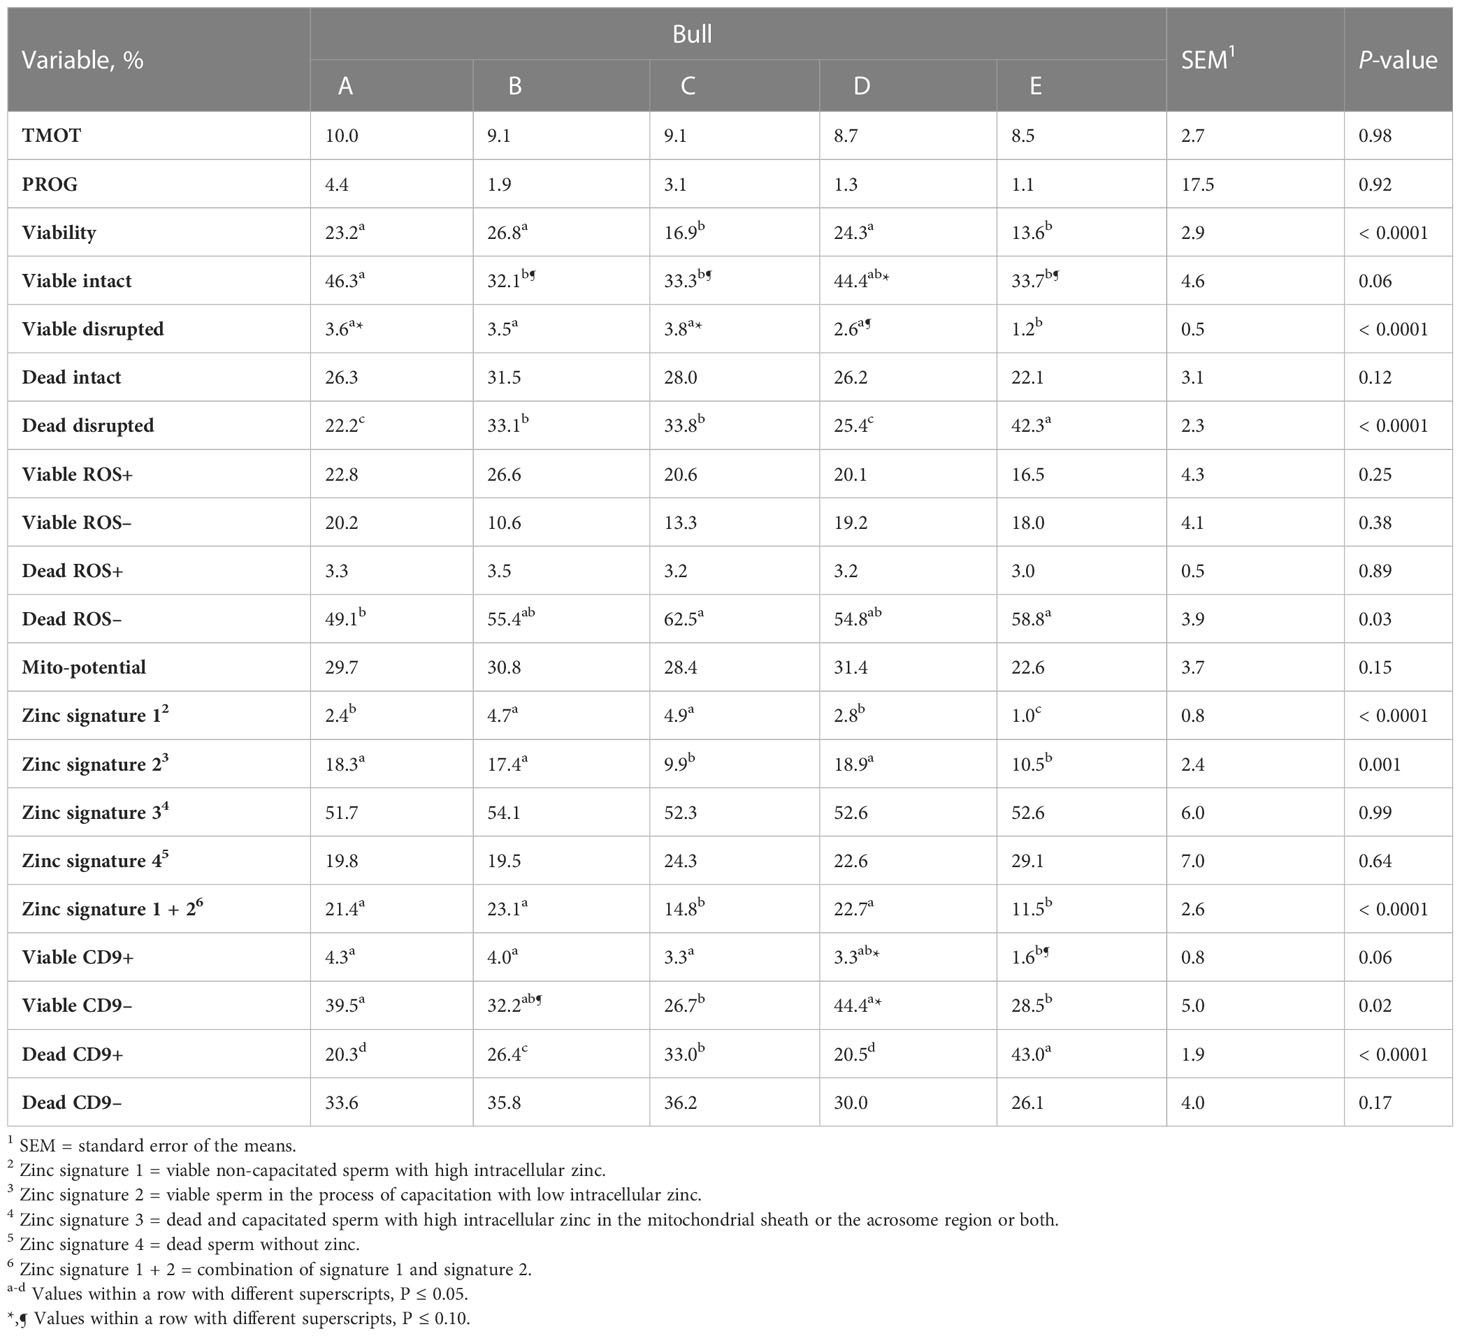
Table 2 Effect of bull on sperm total motility (TMOT) and progressive motility (PROG), plasma membrane integrity (viability), acrosome integrity (viable intact, viable disrupted, dead intact, dead disrupted), reactive oxygen species (ROS; viable ROS+, viable ROS–, dead ROS+, dead ROS–), mitochondrial membrane energy potential (mito-potential), zinc signatures (zinc signature 1, 2, 3, 4, and 1 + 2), and CD9 populations (viable CD9+, viable CD9–, dead CD9+, and dead CD9–).
The overall effect of time was significant for all analyses except for viable ROS– (P = 0.12; Supplementary Figure 4C). There was a decrease (P ≤ 0.001) over time of the percentage of TMOT, PROG, mito-potential, viability, zinc signature 1+2, viable ROS+, viable intact, zinc signature 2 (Supplementary Figures 3–9), and viable CD9– (P < 0.0001; Figure 5C). There was an increase (P ≤ 0.0001) over time in the percentage of dead ROS–, viable disrupted, dead intact, zinc signature 4 (Supplementary Figures 4, 8, 9), and dead CD9– (P < 0.0001; Figure 5D). Other significant (P ≤ 0.001) effects of time were on dead ROS+, dead disrupted acrosome, zinc signatures 1 and 3 (Supplementary Figures 4, 8, 9), and viable CD9+ and dead CD9+ (P ≤ 0.0002; Figures 5A, B).
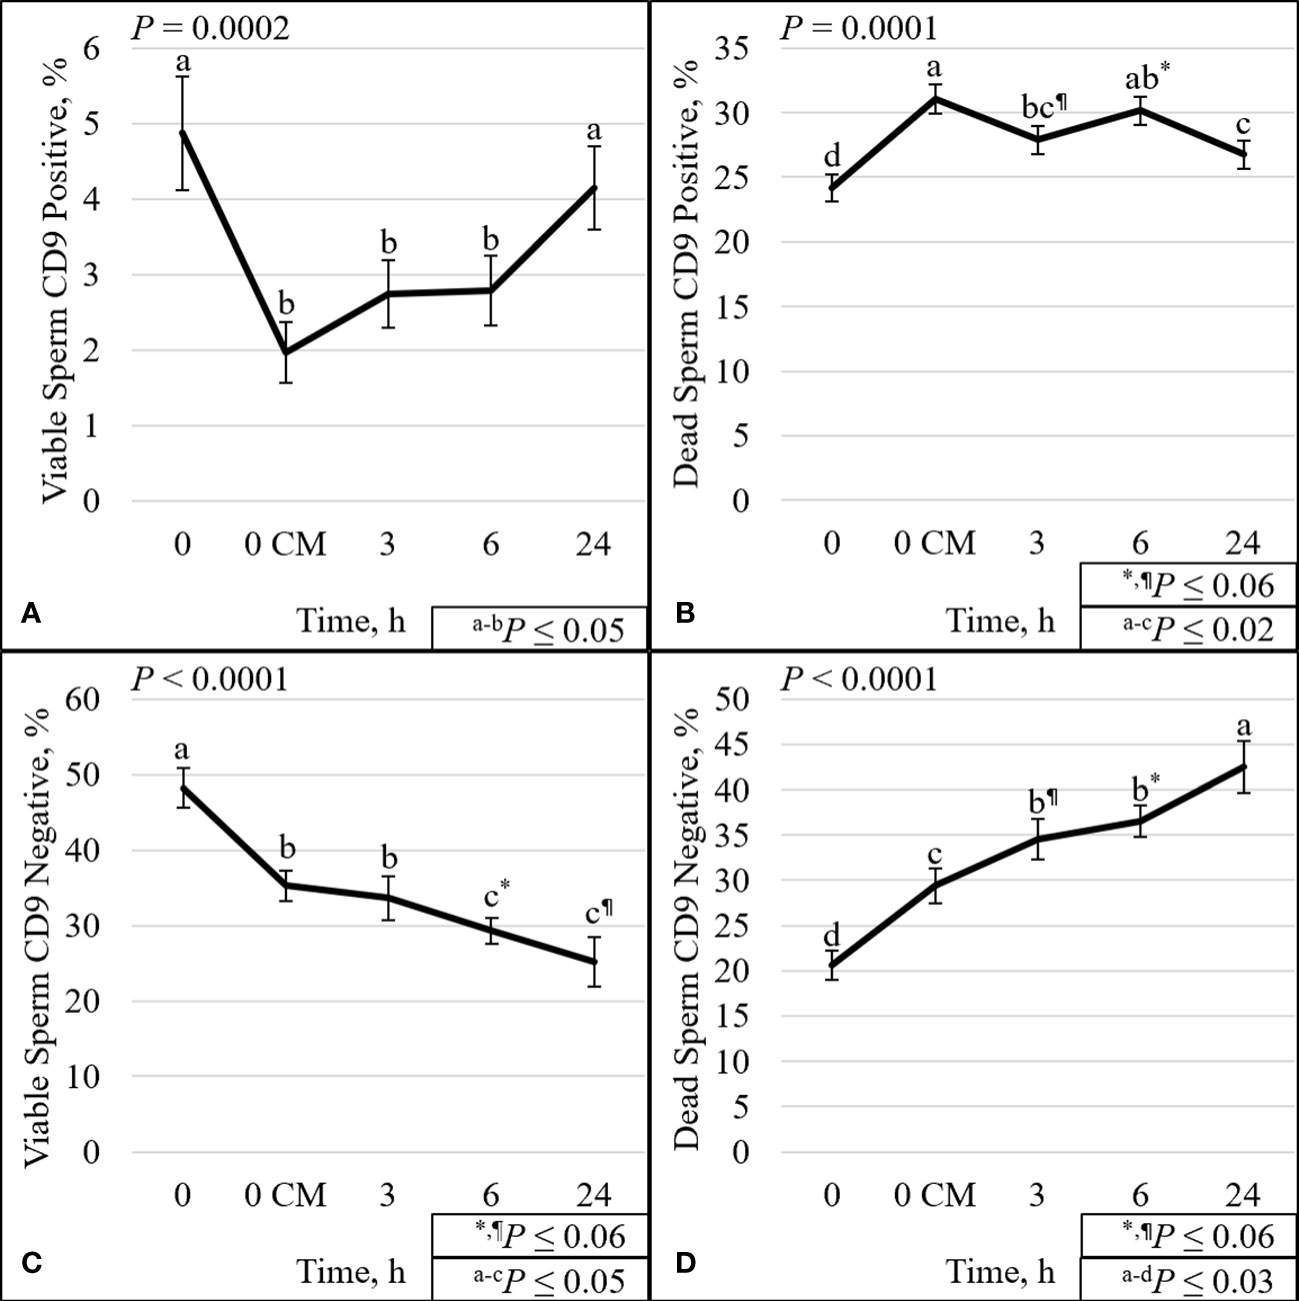
Figure 5 Effect of time on sperm plasma membrane integrity (viability) and CD9 protein. The percentage of sperm with intact plasma membrane (viable) and CD9 positive (A). The percentage of sperm with disrupted plasma membrane (dead) and CD9 positive (B). The percentage of viable sperm and CD9 negative (C). The percentage of dead sperm and CD9 negative (D). Sperm were evaluated for viability and CD9 protein (IVA50; Invitrogen) by flow cytometry at 0 (diluted in non-capacitation medium), 0 CM (diluted in capacitation medium; CM), 3, 6, and 24 h of incubation at 37°C.
The protein CD9 was present in the acrosomal region in both viable and dead sperm (Figures 6–8). Staining varied from all acrosomal region stained to partial acrosomal region stained; however, there was no change in localization of CD9 before and after capacitation (data not shown). Nevertheless, there were changes in population percentage (Figure 5) and concentration (Figure 9) of viable and dead populations. There was no effect of bull (P = 0.12) or bull by time interaction (P = 0.55) on viable CD9 concentration. There was a significant interaction of bull by time on dead CD9 concentration (P = 0.03; Figure 9F); bull E had the greatest concentration at all time points except at 0 h, where bull E was not different than bull B (P = 0.26), and tended to be different than bulls A, C, and D (P ≤ 0.10). There was a bull effect for dead CD9 concentration (Figure 9B); bull E had the greatest concentration among all bulls (P ≤ 0.002). There was an effect of time for both viable and dead CD9 concentration (P ≤ 0.0004; Figures 9C, D, respectively). Concentration for viable sperm decreased when sperm were diluted with CM and increased during the incubation period; however, dead sperm CD9 concentration decreased over time (Figures 9C, D).
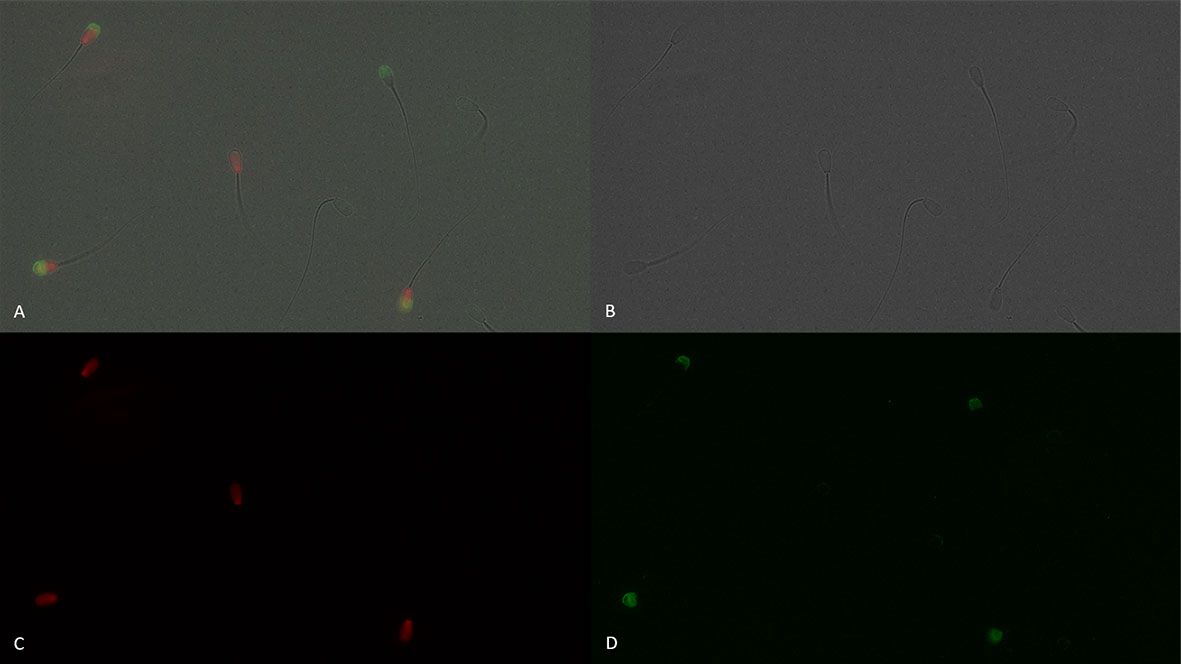
Figure 6 Sperm plasma membrane integrity [dead, propidium iodide positive (red), and viable, propidium iodide negative] and positive (green fluorescence) or negative for CD9 protein (IVA50; Invitrogen). (A): merged view of fields (B, C, and D) (B): bright field. (C): red fluorescence = propidium iodide. (D): green fluorescence = anti-CD9-FITC labeling. 600× magnification under oil immersion.
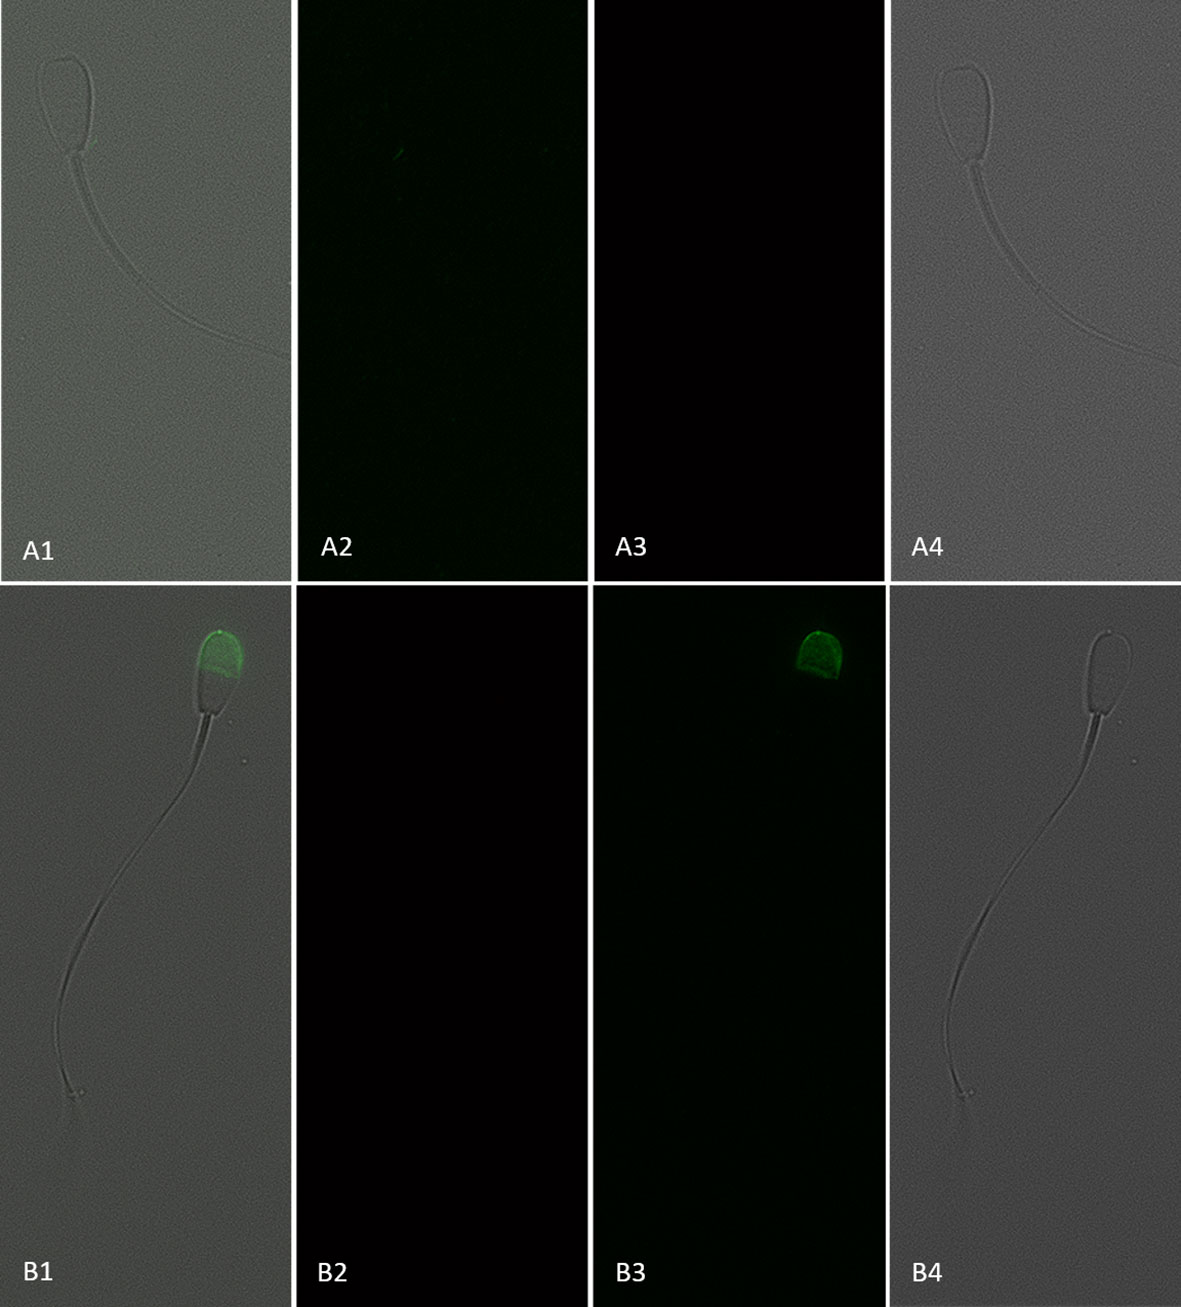
Figure 7 Sperm with an intact plasma membrane (viable; propidium iodide negative) and negative (A1–4) or positive (B1–4) for CD9 protein (IVA50; Invitrogen). (1) Merged view of fields 2, 3, and 4. (2) Red fluorescence = propidium iodide. (3) Green fluorescence = anti-CD9-FITC labeling. (4) Bright field. 600× magnification under oil immersion.
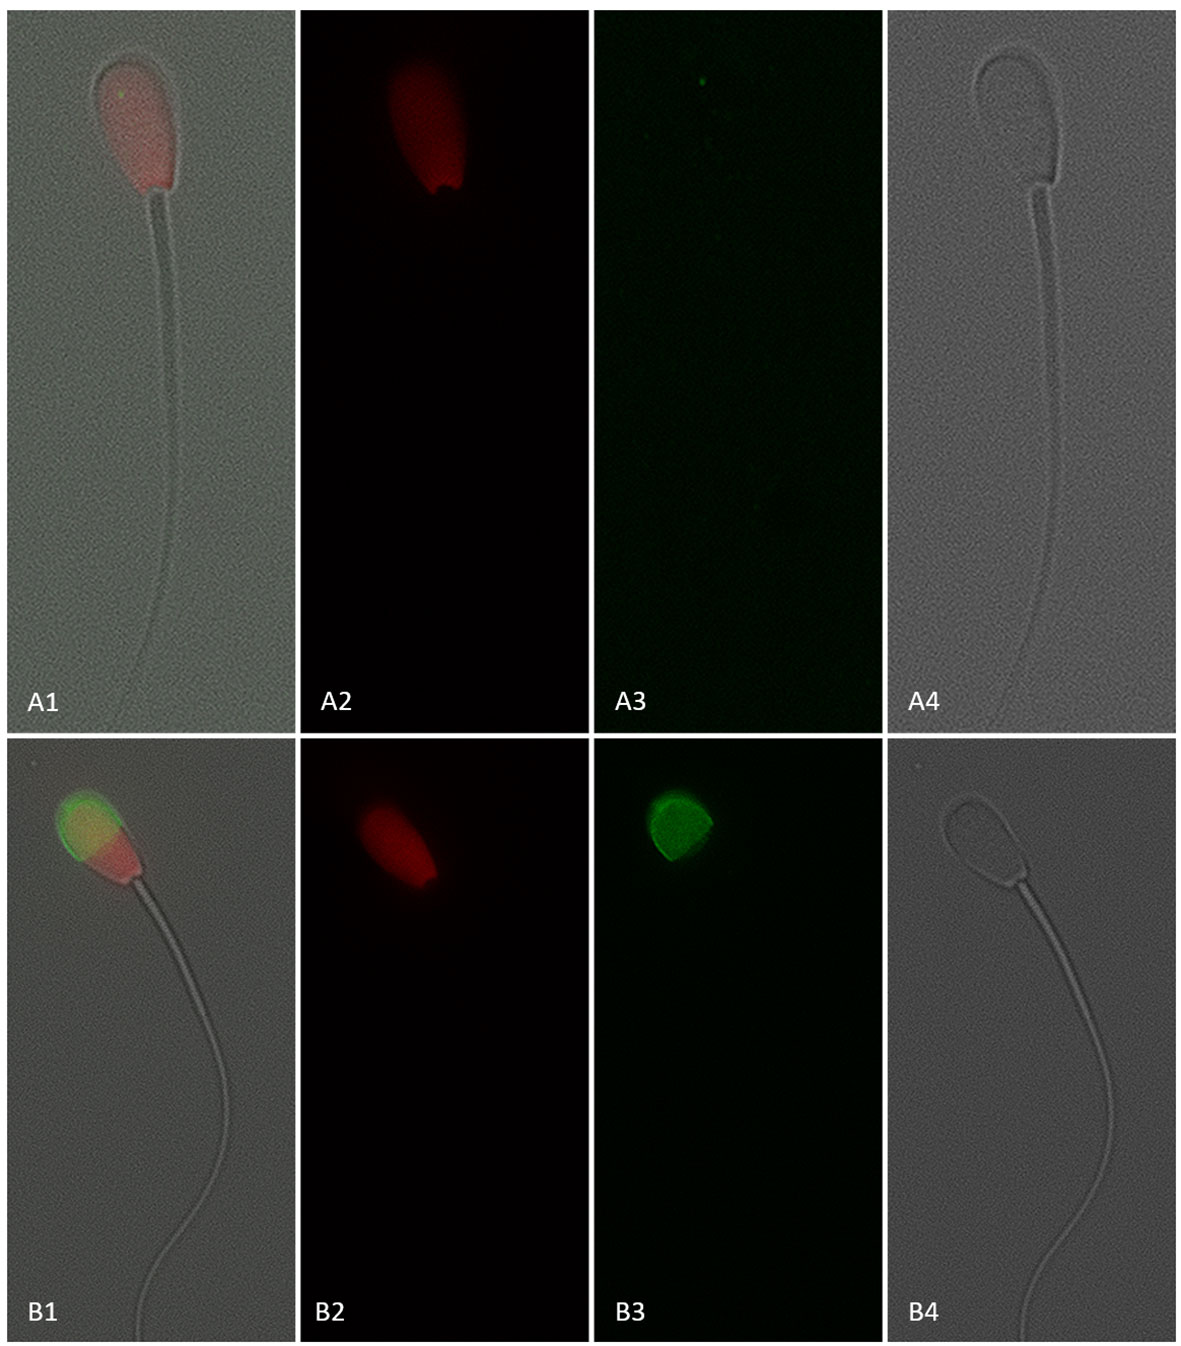
Figure 8 Sperm with a disrupted plasma membrane (dead; propidium iodide positive) and negative (A1–4) or positive (B1–4) for CD9 protein (IVA50; Invitrogen). (1) Merged view of fields 2, 3, and 4. (2) Red fluorescence = propidium iodide. (3) Green fluorescence = anti-CD9-FITC labeling. (4) Bright field. 600× magnification under oil immersion.
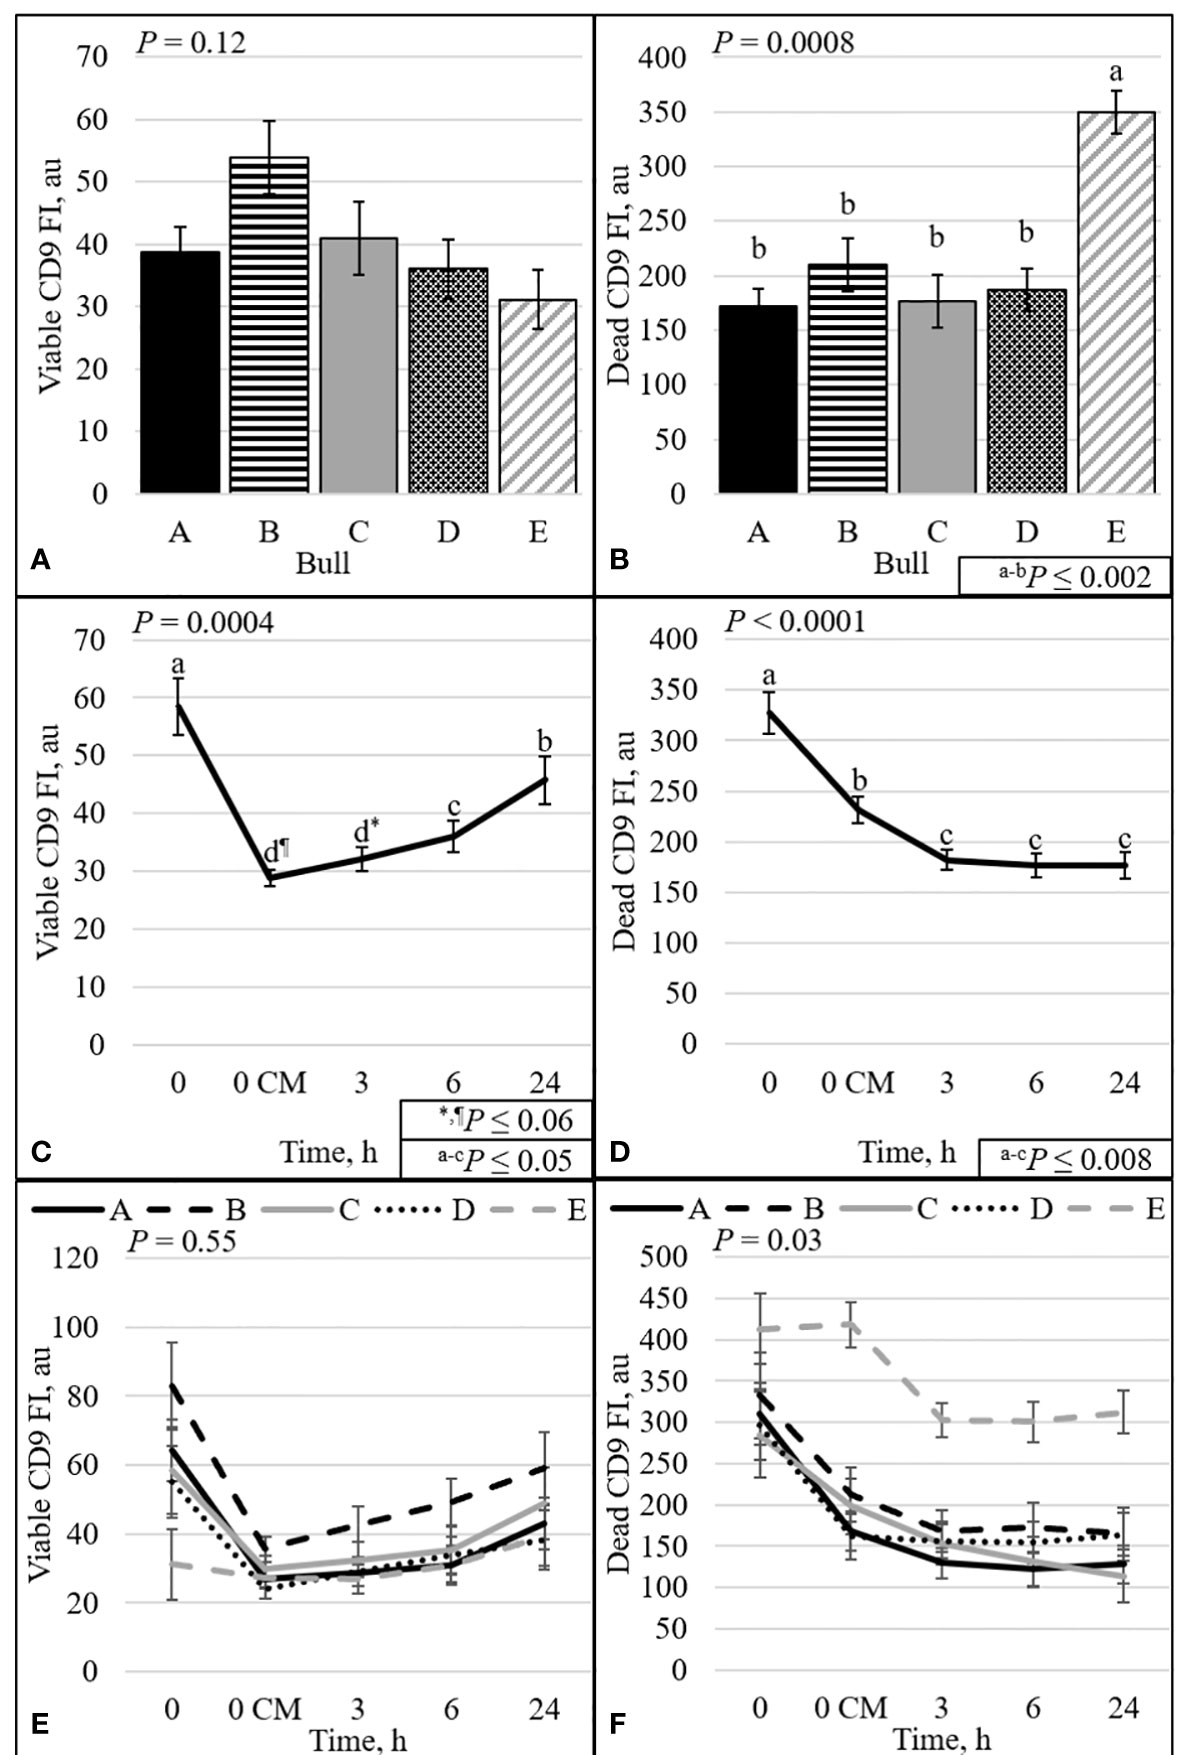
Figure 9 Effect of bull (A, B), time (C, D), and bull by time interaction (E, F) on fluorescence intensity (FI) of sperm with intact plasma membrane (viable; A, C, and E) or disrupted plasma membrane (dead; B, D, and F). Bulls that were previously classified as high- fertility (A, B), low- fertility (C, E), and intermediate fertility (D) were evaluated for viability and CD9 protein (IVA50; Invitrogen) by flow cytometry. Sperm were evaluated at 0 (diluted in non-capacitation medium), 0 CM (diluted in capacitation medium; CM), 3, 6, and 24 h of incubation at 37°C.
The correlation between the CD9 population and CD9 concentration was evaluated. Not surprisingly, there were positive correlations (P < 0.01) between viable CD9+ and viable CD9 concentration (r = 0.61) and between dead CD9+ and dead CD9 concentration (r = 0.54; Table 3). In addition, there was a positive correlation (P < 0.01) between viable CD9– and dead CD9 concentration (r = 0.21; Table 3). There were negative correlations (P < 0.01) between viable CD9+ and dead CD9+ (r = –0.30), dead CD9+ and viable CD9– (r = –0.57), viable CD9– and dead CD9– (r = –0.68), and dead CD9– and dead CD9 (r = –0.72; Table 3) concentrations. Viable CD9+ was correlated (P < 0.05) with viable disrupted, dead disrupted, zinc signature 2, zinc signature 3, and zinc signature 1+2, and tended (P ≤ 0.10) to be correlated with dead ROS+ (Table 4). Dead CD9+ was correlated (P < 0.05) with viability, viable intact, viable disrupted, dead disrupted, dead ROS–, mito-potential, and zinc signatures 2 and 1+2, and tended (P ≤ 0.10) to be correlated (P < 0.05) with PROG, viable ROS+, and zinc signatures 1 and 4 (Table 4). Viable CD9– was correlated (P < 0.05) or tended (P ≤ 0.10) to be correlated with all sperm parameters except zinc signatures 1 and 3 (Table 4). Dead CD9– was correlated (P < 0.05) or tended (P ≤ 0.10) to be correlated with all sperm parameters except dead disrupted, viable ROS–, and zinc signatures 1 and 3 (Table 4). Viable sperm CD9 concentration was correlated (P < 0.05) with viable ROS+, viable ROS–, and zinc signatures 2, 4, and 1+2 (Table 4). In addition, dead CD9 concentration was correlated (P < 0.05) with all sperm parameters except for viable intact, viable ROS–, dead ROS+, and zinc signature 1 (Table 4).

Table 3 Pearson’s correlation coefficient (shaded area above diagonal) and significance level (below diagonal) between CD9 populations [intact (viable) or disrupted (dead) sperm plasma membrane and CD9 positive (+) or negative (-)] and concentration (FI; n = 70).
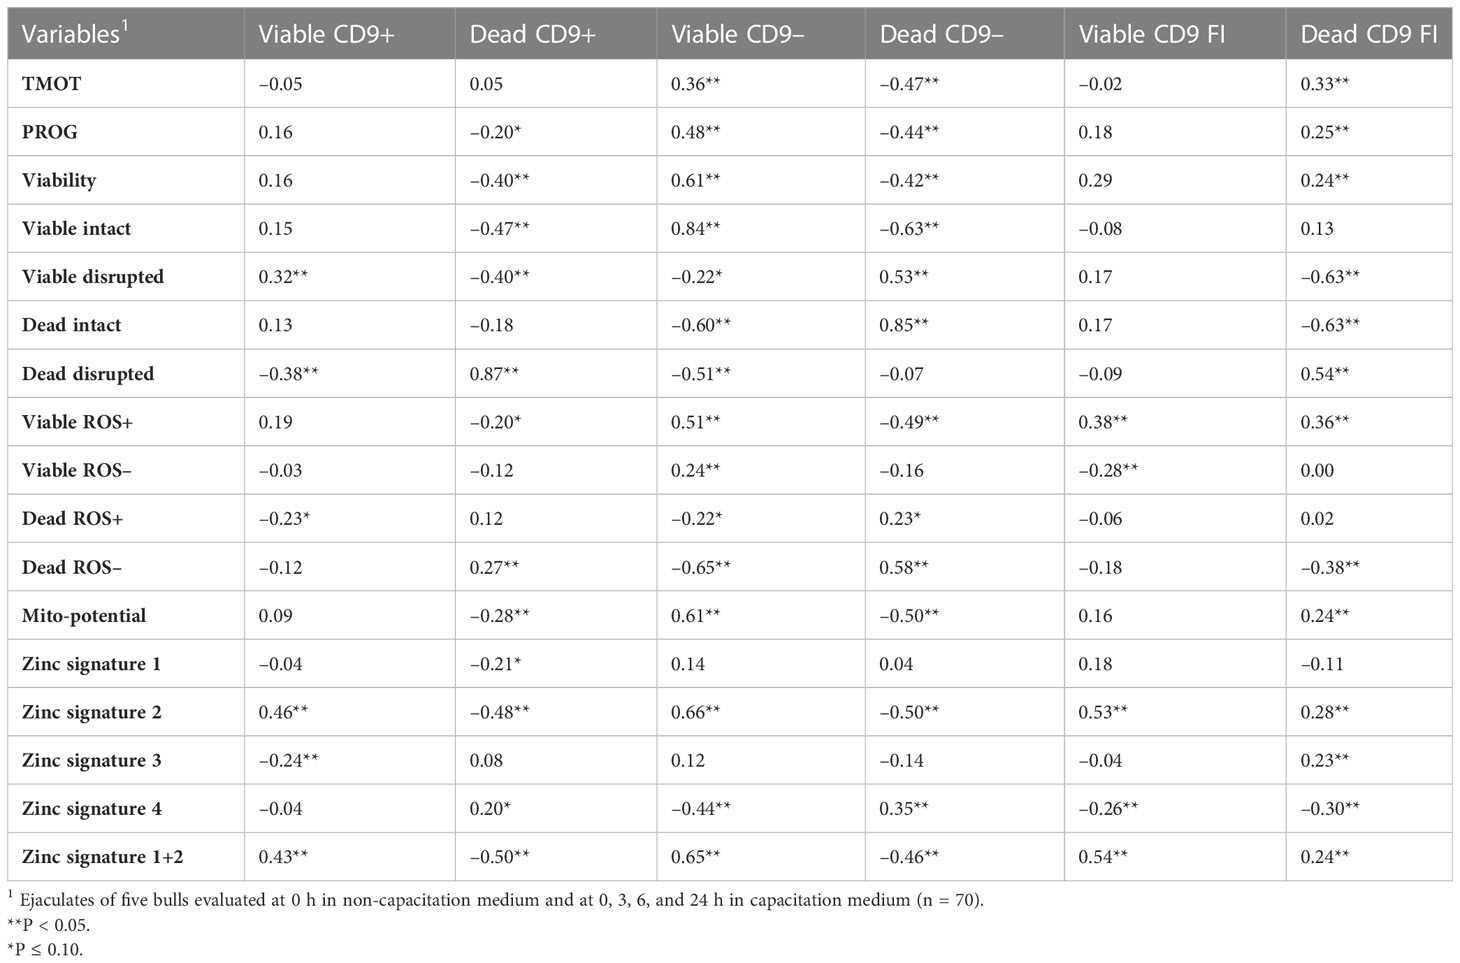
Table 4 Pearson’s correlation coefficient of CD9 populations [intact (viable) or disrupted (dead) sperm plasma membrane and CD9 positive (+) or negative (-)] and concentration (FI) with sperm total motility (TMOT) and progressive motility (PROG), viability, acrosome integrity (viable intact, viable disrupted, dead intact, dead disrupted), reactive oxygen species (ROS; viable ROS+, viable ROS–, dead ROS–, dead ROS–), mitochondrial membrane potential (mito-potential), and zinc signatures (signature 1, signature 2, signature 3, signature 4, and signature 1 + 2).
It is well established that cows must conceive in the first 21 d of the breeding season to achieve maximum fertility potential and maximize profitability. A delay in conception will lead to a decrease in the longevity of the cows and will hinder calf weaning weight and overall productivity (Cushman et al., 2013). To conceive early in the breeding season and maintain a pregnancy, cows must have resumed regular estrous cycle, in good physical condition and on a positive plane of nutrition; however, bull fertility also plays an important role. A BSE is essential for the selection of bulls with potential satisfactory fertility levels that will contribute to early conception in a breeding season (Barth, 2018); however, passing a BSE does not guarantee a high level of fertility. In the beef and dairy industries, frozen semen is used for AI. It is expected that differences in fertility between AI sires are not statistically significant and that more than 90% of semen from these bulls is within ± 3% of the average fertility rate (Clay and McDaniel, 2001; DeJarnette, 2005).
An ejaculate is composed of a heterogeneous population of sperm, and fertility is multifactorial (Rodriguez-Martinez, 2003). Amann and Hammerstedt (1993) suggest that an ejaculate or inseminate must have “enough” of all necessary sperm characteristics to reach a high level of fertility. In the present study, most of the sperm characteristics measured were not associated or correlated with field fertility. It has been reported that acrosome integrity, ROS, and mito-potential are associated or correlated with bull fertility (Oliveira et al., 2014; Kumaresan et al., 2017; Bernecic et al., 2021), but in the present study these traits were not associated with the field fertility of the evaluated bulls. One difference between the studies is the range in fertility levels among the tested bulls. There was on average difference of 11 to 28 percentages points in pregnancy rates between high- and low-fertility bulls (Oliveira et al., 2014; Kumaresan et al., 2017; Bernecic et al., 2021); however, bulls in the present study varied by only 4.6 to 7.4 percentage points in their pregnancy rates. Thus, it is possible to conclude that the fertility of bulls in this study was not associated with only acrosome integrity, ROS, or mito-potential.
Fertility variation is not expected to be significant in a large sample of bulls (Clay and McDaniel, 2001; DeJarnette, 2005). Nevertheless, Richardson et al. (2017) and Zoca et al. (2020) demonstrated fertility differences between bulls. Thus, the study of semen characteristics that can better estimate bull fertility is necessary. In the present study, semen from two studies (Richardson et al., 2017; Zoca et al., 2020) was analyzed to evaluate the effect of inducing capacitation in vitro and the ability to estimate differences between different fertility levels by CASA and flow cytometry analyses. The interaction between bull and time for TMOT was associated with differences in the field fertility of bulls, but only pre wash. Zoca et al. (2020) reported differences in TMOT between bulls, but TMOT did not differ between bulls A (high fertility) and C (low fertility) (31.8% vs 26.5%, respectively). In the present study, more ejaculates were evaluated (bull A) and differences in TMOT at pre-wash between high- and low-fertility bulls were detected; however, the present study failed to detect differences between high-fertility bulls and the intermediate-fertility bull. Farrell et al. (1998) reported a moderate correlation (r = 0.58) between TMOT and bull fertility, which agrees with the lack of relationship between TMOT and field fertility observed in the overall bull effect and by Zoca et al. (2020); however, when more ejaculates were added to the analysis in the present study the relationship between TMOT and field fertility was observed at pre-wash. In addition, it is important to highlight that the intermediate-fertility bull (bull D) had the greatest TMOT in the present study (38.9%) and in Zoca et al. [ (2020); 51.6%] but not in Richardson et al. [ (2017); bull A (1) 51%; bull D (2) 38.5%], which agrees with the moderate correlation between TMOT and fertility reported previously (Farrell et al., 1998). Thus, it is possible to infer that TMOT is a useful tool in identifying poor-quality ejaculates (samples); however, prediction of fertility level beyond that is questionable.
Sperm viability (defined as plasma membrane integrity; SYBR-14 positive and PI negative) was associated with the field fertility of bulls. High-fertility bulls had a greater overall percentage of viable sperm than low-fertility bulls. Again, the intermediate-fertility bull was not different from the high-fertility bulls. There was also a positive correlation (tendency) between field fertility and sperm viability (overall bull effect). The interaction of bull by time could be used to detect differences related to fertility at time h0 in bNCM; however, no other time point could be used to estimate differences associated with field fertility. It is possible that high- and intermediate-fertility bulls required a smaller concentration of capacitating agents (e.g., heparin and bicarbonate) than low-fertility bulls, since only small changes in sperm viability were observed in low-fertility bulls compared with high- and intermediate-bulls. This hypothesis is supported by an increase (statistically or numerically) in zinc signature 3 at h0 CM for high-fertility bulls and at h6 for intermediate-fertility bulls, whereas low-fertility bulls had decreased zinc signature 3. Nevertheless, the induction of capacitation and incubation of sperm allowed for better separation between high and low fertility as observed in the overall effect of bull, because high- and intermediate-fertility bulls maintained a greater (numerically or statistically) percentage of viable sperm at all time points. Differences in sperm viability between bulls were detected by Zoca et al. (2020), and their results were similar to what was observed at 0 h. Interestingly, the intermediate-fertility bull had the greatest value for viability in both studies at 0 h, but this was not the case in Richardson et al. (2017), where no differences were detected between high- and intermediate-fertility bulls when overall viability was evaluated. The correlation between sperm plasma membrane integrity and field fertility has been widely studied; however, results vary, with a weak correlation (r = 0.05 to 0.20; Alm et al., 2001; DeJarnette et al., 2021), moderate correlation (r = 0.41 to 0.68; Januskauskas et al., 2001; Anzar et al., 2002; Januskauskas et al., 2003; Christensen et al., 2005), and strong correlation (r = 0.85 and 0.87; Anzar et al., 2002; Kumaresan et al., 2017) having been reported. In the present study, the correlation between field fertility and viability was strong. In addition, both low-fertility bulls had decreased viability either statistically or numerically at all time points and overall, which suggests that the inclusion of a viability assay as a quality control analysis for AI studs and possibly at a BSE test would assist in the identification of high-fertility bulls.
A new marker of sperm capacitation has been recently reported. This marker uses zinc ion efflux to determine the capacitation status of the sperm and classifies sperm into four signatures (Kerns et al., 2018; 2020). It has been reported that non-capacitated sperm, usually found in fresh ejaculates, has elevated intracellular zinc (signature 1; Michailov et al., 2014; Kerns et al., 2018). The active removal of zinc (i.e., the transition from signature 1 to signature 2) has been reported to be a prerequisite of sperm capacitation (Andrews et al., 1994); however, complete removal of zinc has been reported to abolish sperm motility (Michailov et al., 2014; Kerns et al., 2018). Thus, sperm zinc signatures 1 and 2 represent the population of sperm with a high degree of fertility potential, while signature 3 represents sperm that have completed capacitation and are dead or dying. Signature 4 represents sperm that are dead and may or may not have gone through capacitation before dying (Kerns et al., 2018). In boars, zinc signature 3 was increased from pre-capacitated to post-capacitated sperm among high-fertility boars, but no change was observed in low-fertility boars (Kerns et al., 2018). In the present study, the percentage of zinc signature 3 in bull sperm decreased over time and did not seem to follow the same trend as was reported for boars (Kerns et al., 2018). Nonetheless, zinc signature 2 and zinc signature 1+2 were associated with the field fertility of bulls. As for viability, the zinc signature 1+2 of the intermediate-fertility bull was not different to that of the high-fertility bulls, but low- and high-fertility bulls were different.
Richardson et al. (2017) reported differences in fertility by time between bulls A and D when cows were inseminated prior to estrus but not after the onset of estrus; however, bull D (intermediate fertility) had a similar level of viability and zinc signatures 2 and 1+2 to those of bull A (high fertility). Thus, the mechanism for decreased fertility of bull D compared with bull A is likely associated with other factors not related to sperm capacitation ability as measured in this study. Nevertheless, bull A and D had a similar reduction in the percentage of zinc signature 2 between h0 and h0 CM. However, bull A had an increase in zinc signature 3 while bull D maintained similar percentages; thus, it is likely that bull A’s sperm was undergoing capacitation and bull D’s sperm was dying, which can be observed by a numerical increase in sperm zinc signature 4 for bull D at h0 CM compared to bull A.
In the present study, the presence of, localization, and quantity of CD9 in relationship with bull fertility was evaluated. The protein CD9 has been well characterized in oocytes (Kaji et al., 2000; Le Naour et al., 2000; Miyado et al., 2000; Rubinstein et al., 2006; Sutovsky, 2009; Zhou et al., 2009); however, in sperm, the characterization and function of CD9 is not fully understood. The localization of CD9 described here was similar and agrees with what has been previously described for bull sperm (Antalíková et al., 2015). Antalíková et al. (2015) reported that 75% to 85% of sperm were positive for CD9, with minimal change during capacitation. The proportion of CD9+ sperm observed in the present study was lower than that reported elsewhere (only 20% to 50% of sperm were positive for CD9), with the lowest percentage and the greatest percentage identified at h0 CM (bulls D and E, respectively). Differences between the two studies could be related to breed (Holstein vs. Angus), method of analysis (fixed samples vs. “fresh” samples; primary and secondary antibodies vs. primary antibody), or simply animal-to-animal variation; however, it was observed that dead sperm with a disrupted acrosome were strongly positively correlated with dead CD9+ sperm. This finding may indicate that CD9 is present in the inner portion of the acrosome and may be externalized during capacitation, or that CD9 can be detected only in sperm with a disrupted acrosome. This may explain the differences in CD9+ percentage identified between the results of the present study and Antalíková et al.’s (2015) results since fixation of sperm can cause membrane permeabilization. In the present study, however, acrosome status and CD9 were evaluated in separate assays. It was observed that one low-fertility bull (bull E) had elevated concentrations of CD9 compared with other bulls among the dead sperm population; however, no differences were observed in the viable population. The fluorescence intensity of CD9 on dead sperm decreased over time, which might be related to the release of this protein. Interestingly, viable sperm CD9 concentration greatly decreased when sperm was diluted with CM and slowly increased with incubation. Antalíková et al. (2015) reported a decrease of in vitro fertilization rates when sperm were treated with anti-CD9 antibodies compared with untreated sperm (64.4% vs. 89.4%, respectively). Interestingly, low-fertility bulls had a greater proportion of dead CD9+ sperm than high- and intermediate-fertility bulls. Thus, CD9 protein assay, more specifically dead CD9+, could be a negative marker of fertility.
In conclusion, multiple analyses over time in capacitation medium of viability, zinc signature 2, zinc signature 1+2, and dead CD9+ were associated with the field fertility of bulls. In addition, TMOT at pre-wash, viability at h0, and zinc signature 1 2 at h0 CM could be used to estimate fertility differences between bulls. The inclusion of viability, a zinc signature, or a CD9 protein assay in quality control measurements may have the potential to better predict bull fertility; however, a larger number of bulls with known fertility and different breeds need to be evaluated to validate these results.
The original contributions presented in the study are included in the article/Supplementary Material. Further inquiries can be directed to the corresponding author.
The study was conducted on straws of semen that were collected from a commercial bull stud. These samples were provided by the bull stud; thus, no actual animals were used in this study, only the straws of semen from the bulls.
SZ, TG, JD, and GP: experimental design and conceptualization. SZ, TG, and AZ: data collection. SZ: data management. SZ, RC, and GP: statistical analyses. SZ, JD, BH, MU, and GP: provided original samples used for research. TG, JW, and GP: funding acquisition. SZ: wrote the original draft of the manuscript. All authors contributed to the article and approved the submitted version.
This research was partially funded by Multistate Hatch (project 9835). This research was supported in part by the U.S. Department of Agriculture, Agricultural Research Service. Mention of trade names or commercial products in this publication is solely for the purpose of providing specific information and does not imply recommendation or endorsement by the U.S. Department of Agriculture. The USDA is an equal opportunity provider and employer.
Authors BH and MU were employed by the company Select Sires, Inc., which provided samples for the project.
The remaining authors declare that the research was conducted in the absence of any commercial or financial relationships that could be construed as a potential conflict of interest.
All claims expressed in this article are solely those of the authors and do not necessarily represent those of their affiliated organizations, or those of the publisher, the editors and the reviewers. Any product that may be evaluated in this article, or claim that may be made by its manufacturer, is not guaranteed or endorsed by the publisher.
The Supplementary Material for this article can be found online at: https://www.frontiersin.org/articles/10.3389/fanim.2023.1180975/full#supplementary-material
Alm K., Taponen J., Dahlbom M., Tuunainen E., Koskinen E., Andersson M. (2001). A novel automated fluorometric assay to evaluate sperm viability and fertility in dairy bulls. Theriogenology 56 (4), 677–684. doi: 10.1016/S0093-691X(01)00599-4
Amann R., Hammerstedt R. (1993). In vitro Evaluation of sperm quality: an opinion. J. Androl. 14 (6), 397–406. doi: 10.1002/j.1939-4640.1993.tb03247.x
Andrews J. C., Nolan J. P., Hammerstedt R. H., Bavister B. D. (1994). Role of zinc during hamster sperm capacitation. Biol. Reprod. 51 (6), 1238–1247. doi: 10.1095/biolreprod51.6.1238
Antalíková J., Jankovičová J., Simon M., Cupperová P., Michalková K., Horovská Ľ. (2015). Localization of CD 9 molecule on bull spermatozoa: its involvement in the sperm–egg interaction. Reprod. Domest. Anim. 50 (3), 423–430. doi: 10.1111/rda.12508
Anzar M., He L., Buhr M. M., Kroetsch T. G., Pauls K. P. (2002). Sperm apoptosis in fresh and cryopreserved bull semen detected by flow cytometry and its relationship with fertility. Biol. Reprod. 66 (2), 354–360. doi: 10.1095/biolreprod66.2.354
Austin C. (1951). Observations on the penetration of the sperm into the mammalian egg. Aust. J. Biol. Sci. 4 (4), 581–596. doi: 10.1071/BI9510581
Barraud-Lange V., Chalas Boissonnas C., Serres C., Auer J., Schmitt A., Lefvre B., et al. (2012). Membrane transfer from oocyte to sperm occurs in two CD9-independent ways that do not supply the fertilising ability of Cd9-deleted oocytes. Reproduction 144 (1), 53. doi: 10.1530/REP-12-0040
Barraud-Lange V., Naud-Barriant N., Bomsel M., Wolf J. P., Ziyyat A. (2007). Transfer of oocyte membrane fragments to fertilizing spermatozoa. FASEB J. 21 (13), 3446–3449. doi: 10.1096/fj.06-8035hyp
Barth A. (2018). The use of bull breeding soundness evaluation to identify subfertile and infertile bulls. Animal 12 (s1), s158–s164. doi: 10.1017/S1751731118000538
Bernecic N. C., Donnellan E., O'Callaghan E., Kupisiewicz K., O'Meara C., Weldon K., et al. (2021). Comprehensive functional analysis reveals that acrosome integrity and viability are key variables distinguishing artificial insemination bulls of varying fertility. J. Dairy Sci. 104 (10), 11226–11241. doi: 10.3168/jds.2021-20319
Bianchi E., Doe B., Goulding D., Wright G. J. (2014). Juno Is the egg izumo receptor and is essential for mammalian fertilization. Nature 508 (7497), 483. doi: 10.1038/nature13203
Chang M. (1951). Fertilizing capacity of spermatozoa deposited into the fallopian tubes. Nature 168 (4277), 697–698. doi: 10.1038/168697b0
Christensen P., Boelling D., Pedersen K. M., Korsgaard I. R., Jensen J. (2005). Relationship between sperm viability as determined by flow cytometry and nonreturn rate of dairy bulls. J. Androl. 26 (1), 98–106. doi: 10.1002/j.1939-4640.2005.tb02878.x
Clay J., McDaniel B. (2001). Computing mating bull fertility from DHI nonreturn data. J. Dairy Sci. 84 (5), 1238–1245. doi: 10.3168/jds.S0022-0302(01)74585-7
Cushman R., Kill L., Funston R. N., Mousel E., Perry G. (2013). Heifer calving date positively influences calf weaning weights through six parturitions. J. Anim. Sci. 91 (9), 4486–4491. doi: 10.2527/jas.2013-6465
DeJarnette J. M. (2005). The effect of semen quality on reproductive efficiency. Vet. Clinics: Food Anim. Pract. 21 (2), 409–418. doi: 10.1016/j.cvfa.2005.02.011
DeJarnette J., Harstine B., McDonald K., Marshall C. (2021). Commercial application of flow cytometry for evaluating bull sperm. Anim. Reprod. Sci. 246, 106838. doi: 10.1016/j.anireprosci.2021.106838
Farrell P., Presicce G., Brockett C., Foote R. (1998). Quantification of bull sperm characteristics measured by computer-assisted sperm analysis (CASA) and the relationship to fertility. Theriogenology 49 (4), 871–879. doi: 10.1016/S0093-691X(98)00036-3
Fukuda M., Sakase M., Fukushima M., Harayama H. (2016). Changes of IZUMO1 in bull spermatozoa during the maturation, acrosome reaction, and cryopreservation. Theriogenology 86 (9), 2179–2188.e2173. doi: 10.1016/j.theriogenology.2016.07.010
Garner D. (2014). “Use of flow cytometry for semen evaluation,” in 25th Technical Conference on Artificial Insemination and Reproduction: National Association of Animal Breeders. (Green Bay, Wisconsin: National Association of Animal Breeders) 114–121.
Garner D., Johnson L., Yue S., Roth B., Haugland R. (1994). Dual DNA staining assessment of bovine sperm viability using SYBR-14 and propidium iodide. J. Androl. 15 (6), 620–629. doi: 10.1002/j.1939-4640.1994.tb00510.x
Garner D. L., Thomas C. A., Joerg H. W., DeJarnette J. M., Marshall C. E. (1997). Fluorometric assessments of mitochondrial function and viability in cryopreserved bovine spermatozoa. Biol. Reprod. 57 (6), 1401–1406. doi: 10.1095/biolreprod57.6.1401
Gillan L., Evans G., Maxwell W. (2005). Flow cytometric evaluation of sperm parameters in relation to fertility potential. Theriogenology 63 (2), 445–457. doi: 10.1016/j.theriogenology.2004.09.024
Guthrie H. D., Welch G. R. (2008). “Determination of high mitochondrial membrane potential in spermatozoa loaded with the mitochondrial probe 5,5′,6,6′-Tetrachloro-1,1′,3,3′-Tetraethylbenzimidazolyl-Carbocyanine iodide (JC-1) by using fluorescence-activated flow cytometry,” in Advanced protocols in oxidative stress I. Ed. Armstrong D. (Totowa, NJ: Humana Press), 89–97. doi: 10.1007/978-1-60327-517-0_8
Inoue N., Ikawa M., Isotani A., Okabe M. (2005). The immunoglobulin superfamily protein izumo is required for sperm to fuse with eggs. Nature 434 (7030), 234. doi: 10.1038/nature03362
Ito C., Yamatoya K., Yoshida K., Maekawa M., Miyado K., Toshimori K. (2010). Tetraspanin family protein CD9 in the mouse sperm: unique localization, appearance, behavior and fate during fertilization. Cell Tissue Res. 340 (3), 583–594. doi: 10.1007/s00441-010-0967-7
Januskauskas A., Johannisson A., Rodriguez-Martinez H. (2001). Assessment of sperm quality through fluorometry and sperm chromatin structure assay in relation to field fertility of frozen-thawed semen from Swedish AI bulls. Theriogenology 55 (4), 947–961. doi: 10.1016/S0093-691X(01)00456-3
Januskauskas A., Johannisson A., Rodriguez-Martinez H. (2003). Subtle membrane changes in cryopreserved bull semen in relation with sperm viability, chromatin structure, and field fertility. Theriogenology 60 (4), 743–758. doi: 10.1016/S0093-691X(03)00050-5
Kaewmala K., Uddin M. J., Cinar M. U., Große-Brinkhaus C., Jonas E., Tesfaye D., et al. (2011). Association study and expression analysis of CD9 as candidate gene for boar sperm quality and fertility traits. Anim. Reprod. Sci. 125 (1-4), 170–179. doi: 10.1016/j.anireprosci.2011.02.017
Kaji K., Oda S., Shikano T., Ohnuki T., Uematsu Y., Sakagami J., et al. (2000). The gamete fusion process is defective in eggs of Cd9-deficient mice. Nat. Genet. 24 (3), 279. doi: 10.1038/73502
Kerns K., Sharif M., Zigo M., Xu W., Hamilton L. E., Sutovsky M., et al. (2020). Sperm cohort-specific zinc signature acquisition and capacitation-induced zinc flux regulate sperm-oviduct and sperm-zona pellucida interactions. Int. J. Mol. Sci. 21 (6), 2121. doi: 10.3390/ijms21062121
Kerns K., Zigo M., Drobnis E. Z., Sutovsky M., Sutovsky P. (2018). Zinc ion flux during mammalian sperm capacitation. Nat. Commun. 9 (1), 1–10. doi: 10.1038/s41467-018-04523-y
Koziol J. H., Armstrong C. L. (2018). Manual for Breeding Soundness Examination of Bulls. Soc. Theriogenol. p. 1–147.
Kumaresan A., Johannisson A., Al-Essawe E. M., Morrell J. M. (2017). Sperm viability, reactive oxygen species, and DNA fragmentation index combined can discriminate between above-and below-average fertility bulls. J. Dairy Sci. 100 (7), 5824–5836. doi: 10.3168/jds.2016-12484
Le Naour F., Rubinstein E., Jasmin C., Prenant M., Boucheix C. (2000). Severely reduced female fertility in CD9-deficient mice. Science 287 (5451), 319–321. doi: 10.1126/science.287.5451.319
Manandhar G., Toshimori K. (2001). Exposure of sperm head equatorin after acrosome reaction and its fate after fertilization in mice. Biol. Reprod. 65 (5), 1425–1436. doi: 10.1095/biolreprod65.5.1425
Michailov Y., Ickowicz D., Breitbart H. (2014). Zn2+-stimulation of sperm capacitation and of the acrosome reaction is mediated by EGFR activation. Dev. Biol. 396 (2), 246–255. doi: 10.1016/j.ydbio.2014.10.009
Miyado K., Yamada G., Yamada S., Hasuwa H., Nakamura Y., Ryu F., et al. (2000). Requirement of CD9 on the egg plasma membrane for fertilization. Science 287 (5451), 321–324. doi: 10.1126/science.287.5451.321
Oliveira B. M., Arruda R. P., Thomé H. E., Maturana Filho M., Oliveira G., Guimarães C., et al. (2014). Fertility and uterine hemodynamic in cows after artificial insemination with semen assessed by fluorescent probes. Theriogenology 82 (5), 767–772. doi: 10.1016/j.theriogenology.2014.06.007
Parrish J., Susko-Parrish J., Leibfried-Rutledge M., Critser E., Eyestone W., First N. (1986). Bovine in vitro fertilization with frozen-thawed semen. Theriogenology 25 (4), 591–600. doi: 10.1016/0093-691X(86)90143-3
Parrish J., Susko-Parrish J., Winer M., First N. (1988). Capacitation of bovine sperm by heparin. Biol. Reprod. 38 (5), 1171–1180. doi: 10.1095/biolreprod38.5.1171
Purvis K., Rui H., Schølberg A., Hesla S., Clausen O. P. F. (1990). Application of flow cytometry to studies on the human acrosome. J. Androl. 11 (4), 361–366. doi: 10.1002/j.1939-4640.1990.tb00157.x
Richardson B. N., Larimore E. L., Walker J. A., Utt M. D., DeJarnette J. M., Perry G. A. (2017). Comparison of fertility of liquid or frozen semen when varying the interval from CIDR removal to insemination. Anim. Reprod. Sci. 178, 61–66. doi: 10.1016/j.anireprosci.2017.01.010
Rodriguez-Martinez H. (2003). Laboratory semen assessment and prediction of fertility: still utopia? Reprod. Domest. Anim. 38 (4), 312–318. doi: 10.1046/j.1439-0531.2003.00436.x
Rubinstein E., Ziyyat A., Prenant M., Wrobel E., Wolf J.-P., Levy S., et al. (2006). Reduced fertility of female mice lacking CD81. Dev. Biol. 290 (2), 351–358. doi: 10.1016/j.ydbio.2005.11.031
Saacke R. (2008). Sperm morphology: its relevance to compensable and uncompensable traits in semen. Theriogenology 70 (3), 473–478. doi: 10.1016/j.theriogenology.2008.04.012
Saacke R., Nadir S., Nebel R. (1994). Relationship of semen quality to sperm transport, fertilization, and embryo quality in ruminants. Theriogenology 41 (1), 45–50. doi: 10.1016/S0093-691X(05)80047-0
Satouh Y., Inoue N., Ikawa M., Okabe M. (2012). Visualization of the moment of mouse sperm–egg fusion and dynamic localization of IZUMO1. J. Cell Sci. 125 (21), 4985–4990. doi: 10.1242/jcs.100867
Sutovsky P. (2009). Sperm-egg adhesion and fusion in mammals. Expert Rev. Mol. Med. 11, e11. doi: 10.1017/s1462399409001045
Tao J., Critser E. S., Critser J. K. (1993). Evaluation of mouse sperm acrosomal status and viability by flow cytometry. Mol. Reprod. Dev. 36 (2), 183–194. doi: 10.1002/mrd.1080360209
Toshimori K., Saxena D., Tanii I., Yoshinaga K. (1998). An MN9 antigenic molecule, equatorin, is required for successful sperm-oocyte fusion in mice. Biol. Reprod. 59 (1), 22–29. doi: 10.1095/biolreprod59.1.22
Vincent P., Underwood S. L., Dolbec C., Bouchard N., Kroetsch T., Blondin P. (2012). Bovine semen quality control in artificial insemination centers. Anim. Reprod. 9 (3), 153–165. Available at: https://www.animal-reproduction.org/article/5b5a6055f7783717068b46d8.
Zhao X. M., Wang N., Hao H. S., Li C. Y., Zhao Y. H., Yan C. L., et al. (2018). Melatonin improves the fertilization capacity and developmental ability of bovine oocytes by regulating cytoplasmic maturation events. J. Pineal. Res. 64 (1), e12445. doi: 10.1111/jpi.12445
Zhou G.-B., Liu G.-S., Meng Q.-G., Liu Y., Hou Y.-P., Wang X.-X., et al. (2009). Tetraspanin CD9 in bovine oocytes and its role in fertilization. J. Reprod. Dev. 55 (3), 305–308. doi: 10.1262/jrd.20099
Zoca S. M., Northrop-Albrecht E. J., Walker J. A., Cushman R. A., Perry G. A. (2022a). Proteomic analyses identify differences between bovine epididymal and ejaculated spermatozoa that contribute to longevity. Theriogenology 184, 51–60. doi: 10.1016/j.theriogenology.2022.02.021
Zoca S. M., Northrop-Albrecht E. J., Walker J. A., Cushman R. A., Perry G. A. (2022b). Proteomics dataset of epididymal fluid, seminal plasma, and proteins loosely attached to epididymal and ejaculated sperm from Angus bulls. Data Brief 42, 108150. doi: 10.1016/j.dib.2022.108150
Keywords: bull fertility, capacitation, CD9 protein, flow cytometry, sperm, zinc signature
Citation: Zoca SM, Geary TW, Zezeski AL, Kerns KC, Dalton JC, Harstine BR, Utt MD, Cushman RA, Walker JA and Perry GA (2023) Bull field fertility differences can be estimated with in vitro sperm capacitation and flow cytometry. Front. Anim. Sci. 4:1180975. doi: 10.3389/fanim.2023.1180975
Received: 06 March 2023; Accepted: 14 April 2023;
Published: 02 May 2023.
Edited by:
Zach McFarlane, California Polytechnic State University, United StatesReviewed by:
Craig Gifford, New Mexico State University, United StatesCopyright © 2023 Zoca, Geary, Zezeski, Kerns, Dalton, Harstine, Utt, Cushman, Walker and Perry. This is an open-access article distributed under the terms of the Creative Commons Attribution License (CC BY). The use, distribution or reproduction in other forums is permitted, provided the original author(s) and the copyright owner(s) are credited and that the original publication in this journal is cited, in accordance with accepted academic practice. No use, distribution or reproduction is permitted which does not comply with these terms.
*Correspondence: George A. Perry, R2VvcmdlLnBlcnJ5QGFnLnRhbXUuZWR1
Disclaimer: All claims expressed in this article are solely those of the authors and do not necessarily represent those of their affiliated organizations, or those of the publisher, the editors and the reviewers. Any product that may be evaluated in this article or claim that may be made by its manufacturer is not guaranteed or endorsed by the publisher.
Research integrity at Frontiers

Learn more about the work of our research integrity team to safeguard the quality of each article we publish.