- Institute of Genetics and Biometry, Research Institute for Farm Animal Biology (FBN), Dummerstorf, Germany
Well-defined and accurate climatic indicators are important for evaluating heat stress in dairy cattle. This is imperative for sound management decisions for mitigating production losses. The most popular indicator for heat stress is the temperature humidity index (THI). Other heat stress indicators have been developed but remain largely unexploited. There is, therefore, possibly room to improve the THI and explore new indicators suitable for predicting production losses due to heat stress in dairy cattle. In this study, we apply the degree-day concept to develop temperature humidity index-day (THI-day). We defined the cooling THI-day as the hourly cumulative THI units above the heat stress threshold for milk production traits over the entire day. We then modeled reaction norms for cooling THI-day to analyze the effect of cumulative heat load expressed by THI-day on milk production traits. Milk performance records were from 16,216,145 monthly test-day records for the Fleckvieh breed for the period 2010 to 2019 in southern Bavaria, Germany. Individual cow records were averaged by herd and test-day resulting in 797,455 herd test-day records from 9,726 herds. Weather data for the same period were provided by the German Meteorological Service. Results indicated that cooling THI-day provided significant (p < 0.001) additional information to the conventional THI models. We found out that reaction norm models of average herd milk yield that do not account for the cumulative heat load tend to underestimate the effects of heat stress on milk production traits. Reaction norms modeled with cooling THI-day were more plausible for milk production traits that have a defined heat stress threshold including milk yield, protein yield, and milk urea.
Introduction
Heat stress in livestock is evaluated by use of different environmental variables, either individually or combined into an index. The temperature humidity index (THI) combines the effect of air temperature and relative humidity and remains the commonly applied indicator for thermal stress in livestock (Bohmanova et al., 2007). There are many other climatic indices developed to evaluate heat stress in cattle, including adjusted temperature humidity index, heat load index, index of thermal stress for cows, equivalent temperature index for cattle, and dairy heat load index (Gaughan et al., 2008; Mader et al., 2010; Da Silva et al., 2015; Lees et al., 2018; Wang et al., 2018b). However, these and many other indices defined in literature have not been widely applied in genetic evaluation studies, and THI remains the commonly used index (see reviews by Wang et al., 2018a; Mbuthia et al., 2022b). The THI is often divided into classes that reflect the severity of heat stress. In dairy cattle for example, Armstrong (1994) defined THI < 72 as comfort zone, 72 > THI < 79 as mild stress, 80 > THI < 89 as moderate stress, and >90 as severe stress. However, different thresholds for the comfort zone have been reported depending on region, production system, and model specifications. For milk yield, a THI threshold of 72 has been extensively used (Ravagnolo et al., 2000; Bohmanova et al., 2007; Aguilar et al., 2010). Other THI thresholds have been reported including 69 for a Mediterranean climate (Bouraoui et al., 2002), 74 in semi-arid and 78 in subtropical environments in USA (Bohmanova et al., 2007), 62 in temperate Luxembourg (Hammami et al., 2013), and 69 for a tropical environment (Mbuthia et al., 2021). In Germany, a THI of 60 has been identified as the threshold above which milk yield starts to decline (Brügemann et al., 2012; Mbuthia et al., 2022a). Heat stress thresholds for some milk composition traits including protein and fat contents have not been identified (Brügemann et al., 2012), while for other traits, the thresholds have been inconsistent. The focus of most heat stress studies has been the rate of decline per unit increase in THI after the threshold. To our knowledge, the effect of the cumulative heat load above the threshold has not been modeled so far in farm livestock including dairy cattle.
For long, degree-days have been widely used as an indicator for energy consumption for cooling and heating buildings (CIBSE, 2006). Cooling degree-days (CDD) and heating degree-days (HDD) are computed based on the cumulated daily deviations above (CDD) or below (HDD) a given temperature threshold (Spinoni et al., 2018). Cooling degree-day refers to the amount of energy required for a given day or period, to cool the building in a hot climate to a specified base temperature, and the alternative reflects the HDD (Matzarakis and Thomsen, 2009; Spinoni et al., 2018). Another application of degree-days is in crop phenology where the accumulated heat, commonly referred to as growing degree-days, is used to predict the development and harvest of a variety of crops (McMaster and Wilhelm, 1997). In entomology, degree-day accumulation has been used to model the life-cycle development of insects (Chen et al., 2015). The concept of degree-day has been applied to monitor and predict fish growth and development (Neuheimer and Taggart, 2007; Chezik et al., 2014). However, its application in endotherms is lacking.
Applying the concept of temperature degree-days, we calculated temperature humidity index-days (THI-days). We calculated cooling THI-days as the hourly cumulative THI units above the heat stress threshold for milk production traits over the entire day. We then developed statistical models to predict conventional THI reaction norms including or excluding cooling THI-day to analyze the effect of cumulative heat load on herd-average milk production traits. From these models, we tested the null hypothesis that cooling THI-day does not explain additional variation to the conventional THI models. The main objective of this study was to determine the variability of reaction norms of milk production traits to heat stress with or without cooling THI-days.
Materials and methods
Study location and data
This study builds up on our earlier study where information on milk performance records and weather is described in detail (Mbuthia et al., 2022a). In summary, the study location was the Swabia and Upper Bavaria administrative districts (Regierungsbezirke) in the south of the German federal state of Bavaria. Milk performance records were provided by the Bavarian dairy recording organization—Landeskuratorium der Erzeugerringe für tierische Veredelung in Bayern e.V. (LKV Bayern) for the period 2010 to 2019. The records were for the Fleckvieh breed, which is a dual-purpose breed of cattle. A total of 16,216,145 individual cow records were averaged by herd and test-day. This resulted to 797,455 herd test-day (HTD) records from 9,726 herds.
Weather data were provided by the German Meteorological Service (Deutscher Wetterdienst, DWD). Weather station data for hourly observation 2-m air temperature (°C) and 2-m relative humidity (%) were obtained from DWD for the period 2010–2019 (August) (Climate Data Center 2018, https://opendata.dwd.de/climate_environment/CDC/observations_germany/). For this analysis, we used data from 53 weather stations within the study area.
The temperature humidity index (THI) was calculated using the equation of NRC (1971):
where T is the average temperature in °C and RH is average relative humidity in %. Hourly THI was calculated from hourly T and RH and averaged for the day.
THI-day
The temperature humidity index-day (THI-day) was calculated using the Hourly Average Integration method (Fraisse et al., 2007). The hourly THI above the threshold was summed up over the day to give the daily cooling THI-day.
where THIa,i is the mean hourly THI, THIb is the THI threshold, and t is the number of hours THI was above the base threshold.
The THI threshold (base THI) was set at 60 THI units. This is the threshold obtained from our previous study above which milk yield in cattle is affected by heat stress in the study region (Mbuthia et al., 2022a). An average THI of 60 on a given test day could be realized from different combinations of daily average temperature and daily average relative humidity. This could be obtained from an average temperature of 16.1°C at 73.8 relative humidity or, alternatively, at low temperatures of 15.6°C combined with 97.1 relative humidity and at high temperatures of 17.5°C combined with 44.1 relative humidity. Different formulas have been used to calculate the THI applied to estimate the effect of thermal stress experienced by dairy cows (Bohmanova et al., 2007; Dikmen and Hansen, 2009). The threshold differs among indices and between regions (Bohmanova et al., 2007).
Statistical models
To determine the effects of daily average THI and cumulative heat load expressed by cooling THI-day on milk production traits, we fitted three models, i.e., a full model fitting reaction norms for THI and cooling THI-day (model 1), a reduced model fitting THI only (model 2), and a reduced model fitting cooling THI-day only (model 3). We implemented model 1 to test the significance of cooling THI-day in a standard THI model. We tested the null hypothesis that cooling THI-day does not explain additional variation to THI.
Model 1 was a combined model fitting quartic Legendre polynomial functions to THI and cooling THI-day. The model was as follows:
where Yijklmnoprsu is the herd test day record for milk yield, protein yield, fat yield, protein content, fat content, milk urea, or SCS. Hi is the herd effect. Pj is the multiple regression of % cows in different parities (parity 1, 2, and 3) at each herd and test day. PLSjk is the lactation stage by parity effect, which is a multiple regression on % of cows in different lactation stages (LS1–LS10) by parity interaction at each herd and test day. CTl is the multiple regression of % cows in a given calving type (single or twins) at each herd and test day. CEm is the multiple regression of % cows in a given calving ease category (6 calving ease classes; 0—easy without assistant to 5—surgical delivery/fetotomy). monn is the month effect. yro is the year effect. yrsop is the year by season interaction effect. Seasons were defined as follows: winter (December to February), spring (March to May), summer (June to August), and autumn (September to November). αq are regression coefficients for THI, Zq are the covariates of the qth Legendre polynomial evaluated at THI point (t). βr are regression coefficients for cooling THI-day, and Zr are the covariates of the sth Legendre polynomial evaluated at cooling THI-day point (d). htdis is the random short-term test-day effect auto-correlated (AR1) within herd. eijklmnopqrsu is the residual.
To determine the reaction of milk production traits to increasing THI, we fitted Model 2 as:
The model terms are as previously defined.
We also modeled the reaction norm of the cooling THI-day as the only heat load indicator by fitting model 3 as:
The model terms are as previously defined.
Milk performance records were processed in SAS version 9.4 (SAS Institute Inc., 2013). Mixed models were used to fit the data with variance components estimated by restricted maximum likelihood in the ASReml 4.1 program (Gilmour et al., 2015). Test for significant differences of the fixed effects was by Wald F-Test as implemented in ASReml. Weather data handling and figure plots were carried out in R software (R Core Team, 2020).
Results and discussion
THI and cooling THI-day
The daily average temperature humidity index (THI) was 48.3 with a range of −1.8 to 75.9. Above the THI threshold of 60 units, the cooling THI-day ranged from 0 to 15.8 units. The distribution of cooling THI-days calculated with a THI threshold of 60 for the study period are presented in Figure 1.
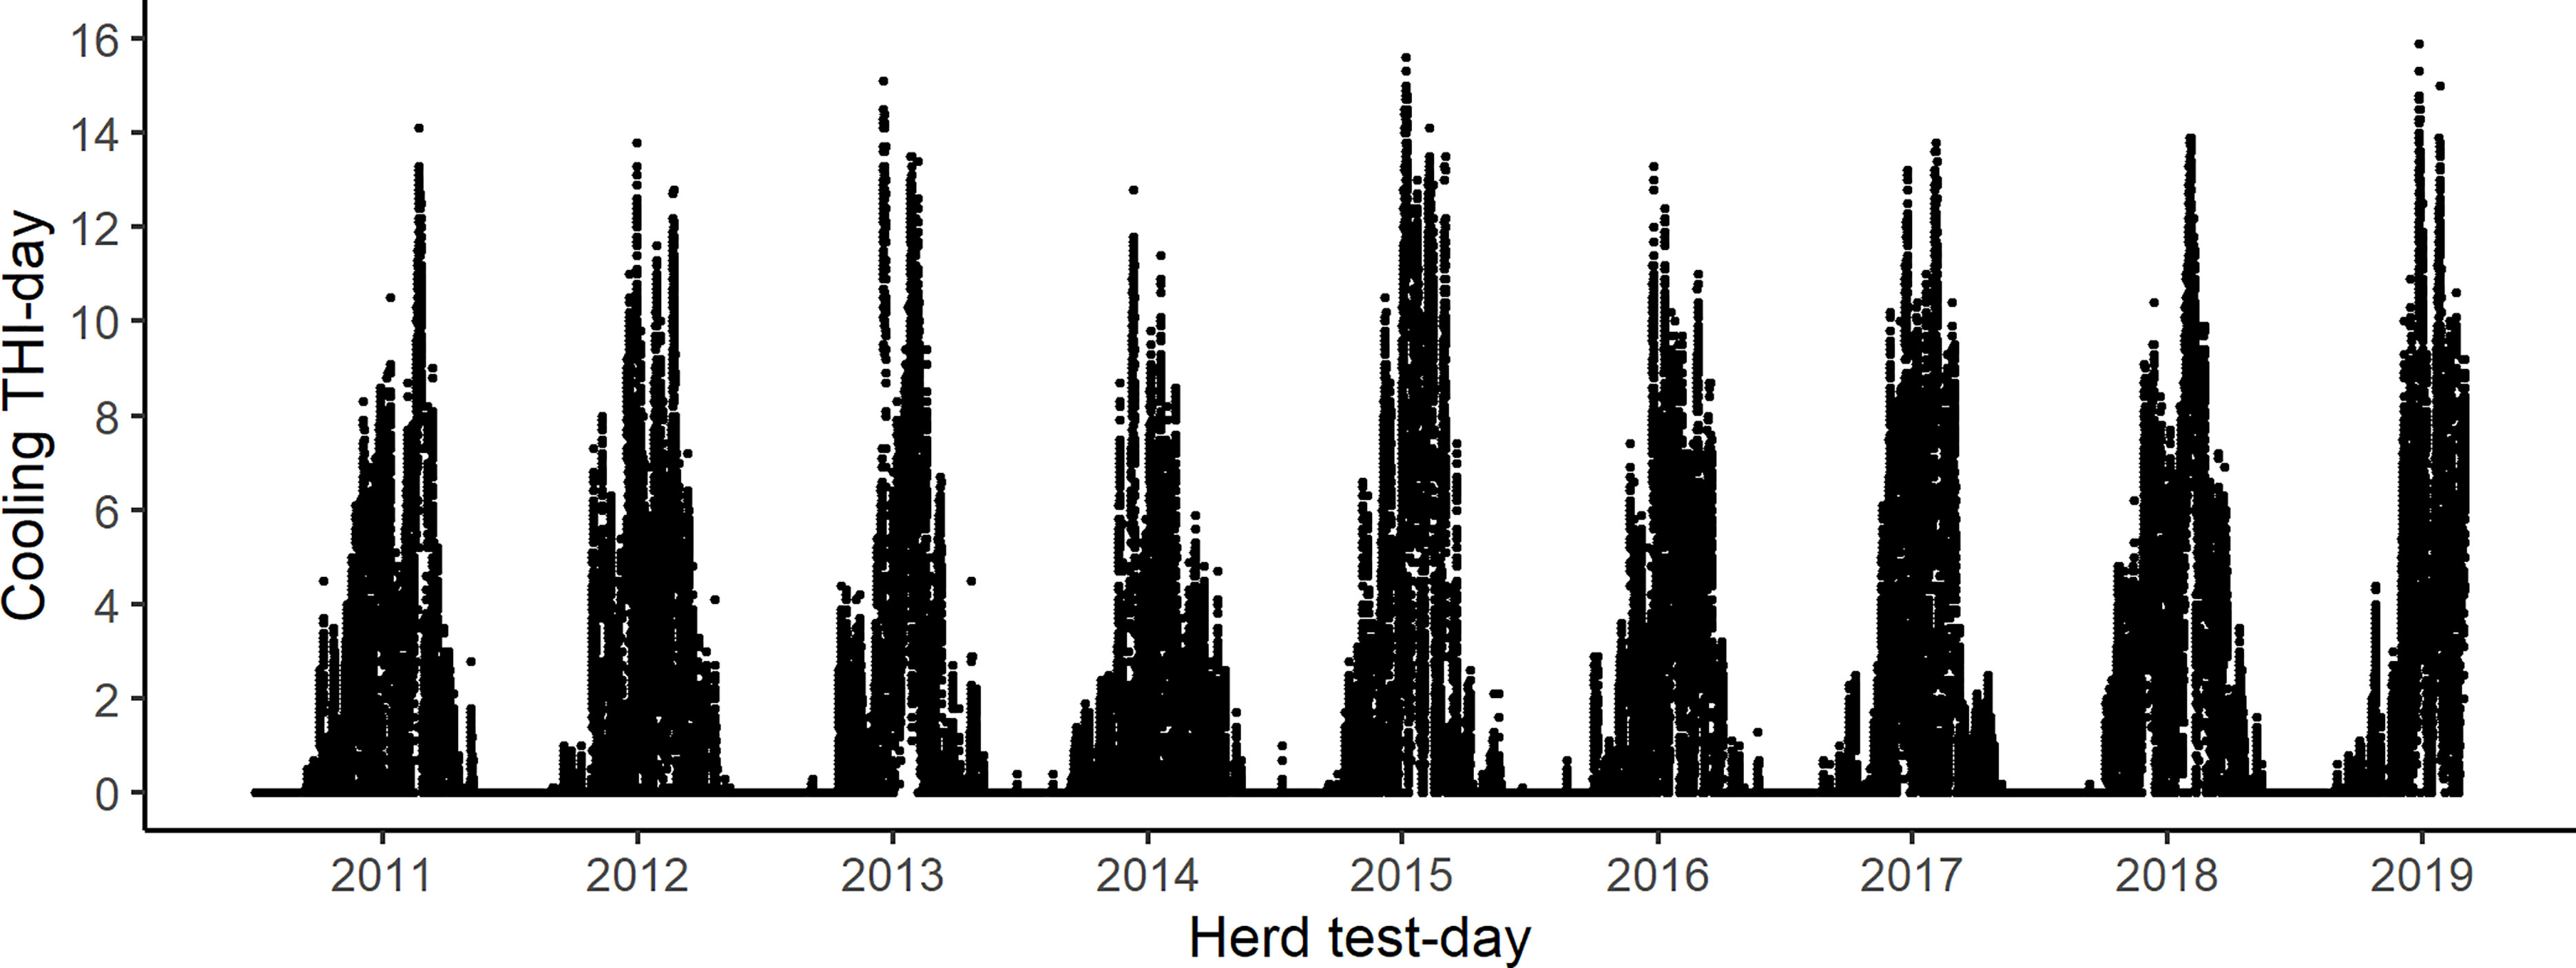
Figure 1 Cooling THI-days calculated with a THI threshold of 60. Each data point presents the daily value corresponding to a herd test-day in southern Bavaria.
A scatter plot of cooling THI-day units against daily average THI is presented in Figure 2. Non-linear relationships were observed with no cooling THI-days at lower THI and more cooling THI-days at higher THI.
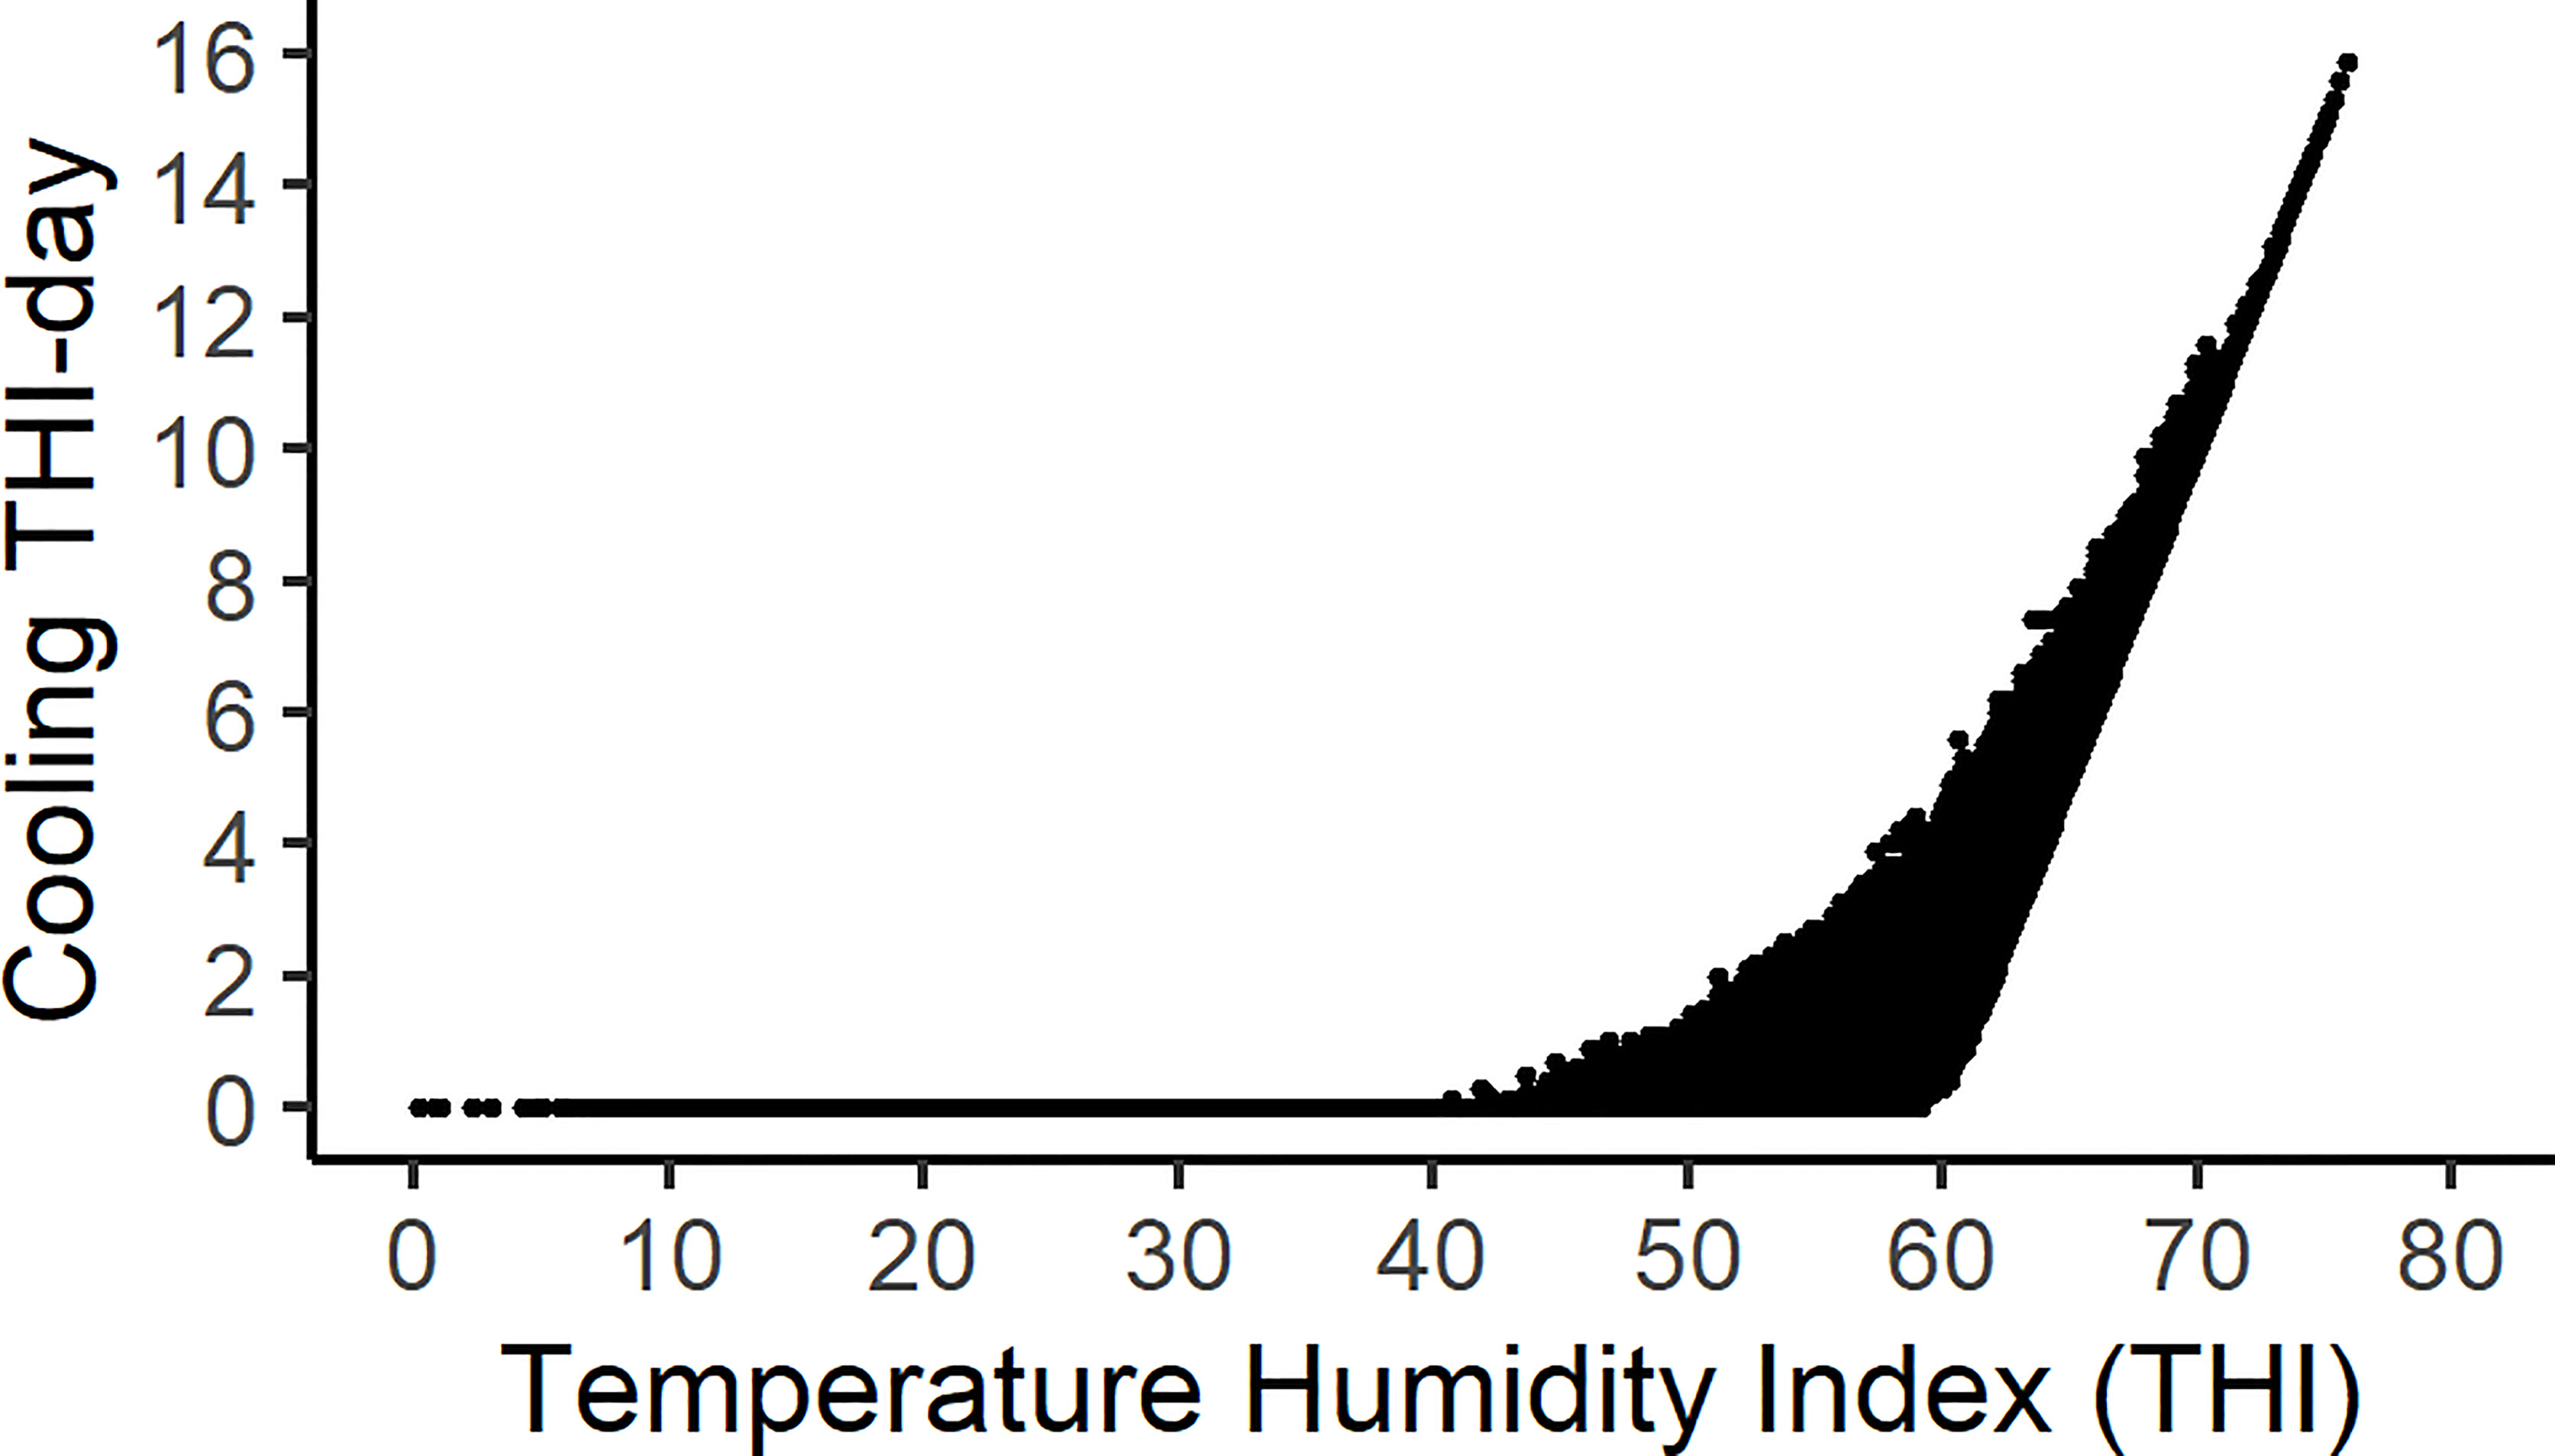
Figure 2 A scatter plot of daily cooling THI-day units against average daily THI. Each data point presents the daily value corresponding to a herd test-day in southern Bavaria.
The cooling THI-day duration, i.e., the number of hours used to calculate the cooling THI-day, ranged from 0 on days whereby THI was below the THI threshold throughout the day to 24 whereby all the hours had a THI above the heat stress threshold. The cooling THI-day duration was 12.7, 16.3, and 15.6 h in the summer months of June, July, and August, respectively.
Statistical models
All the fixed effects fitted in the models were statistically significant (p < 0.001). The reaction norms for THI and cooling THI-day were significantly different (p < 0.001) for all models. The conditional F-statistics indicated that cooling THI-day provided additional significant information to the THI model.
Reaction norms of milk traits to thermal load
The reaction of milk yield, protein yield, and fat yield to increasing heat load estimated from the THI and cooling THI-day full model (model 1), THI only model (model 2), and cooling THI-day only model (model 3) is presented in Figure 3. For milk yield, a THI threshold of 60 was identified as the breakpoint above which milk yield started to decline due to heat stress as indicated in model 2. Model 1 clearly indicated that the cumulative heat load above the heat stress threshold caused a further milk yield loss. A loss of −0.34 kg per cow per day was recorded at the maximum cooling THI-day above the THI threshold. Model 2 demonstrated its capability to model both cold and heat stress. Model 3 indicated a milk yield loss of −1.2 kg per cow per day. This was slightly above what was estimated from model 2 (0.80 kg per cow per day). Studies that apply model 2, therefore, underestimate the milk yield loss by failing to account for the cumulative heat load. In summary, model 1 was the most efficient for all thermal stress conditions, i.e., cold and heat stress, and model 3 was the most suitable for modeling heat stress if cold stress is not significant and the threshold for heat stress has been established.
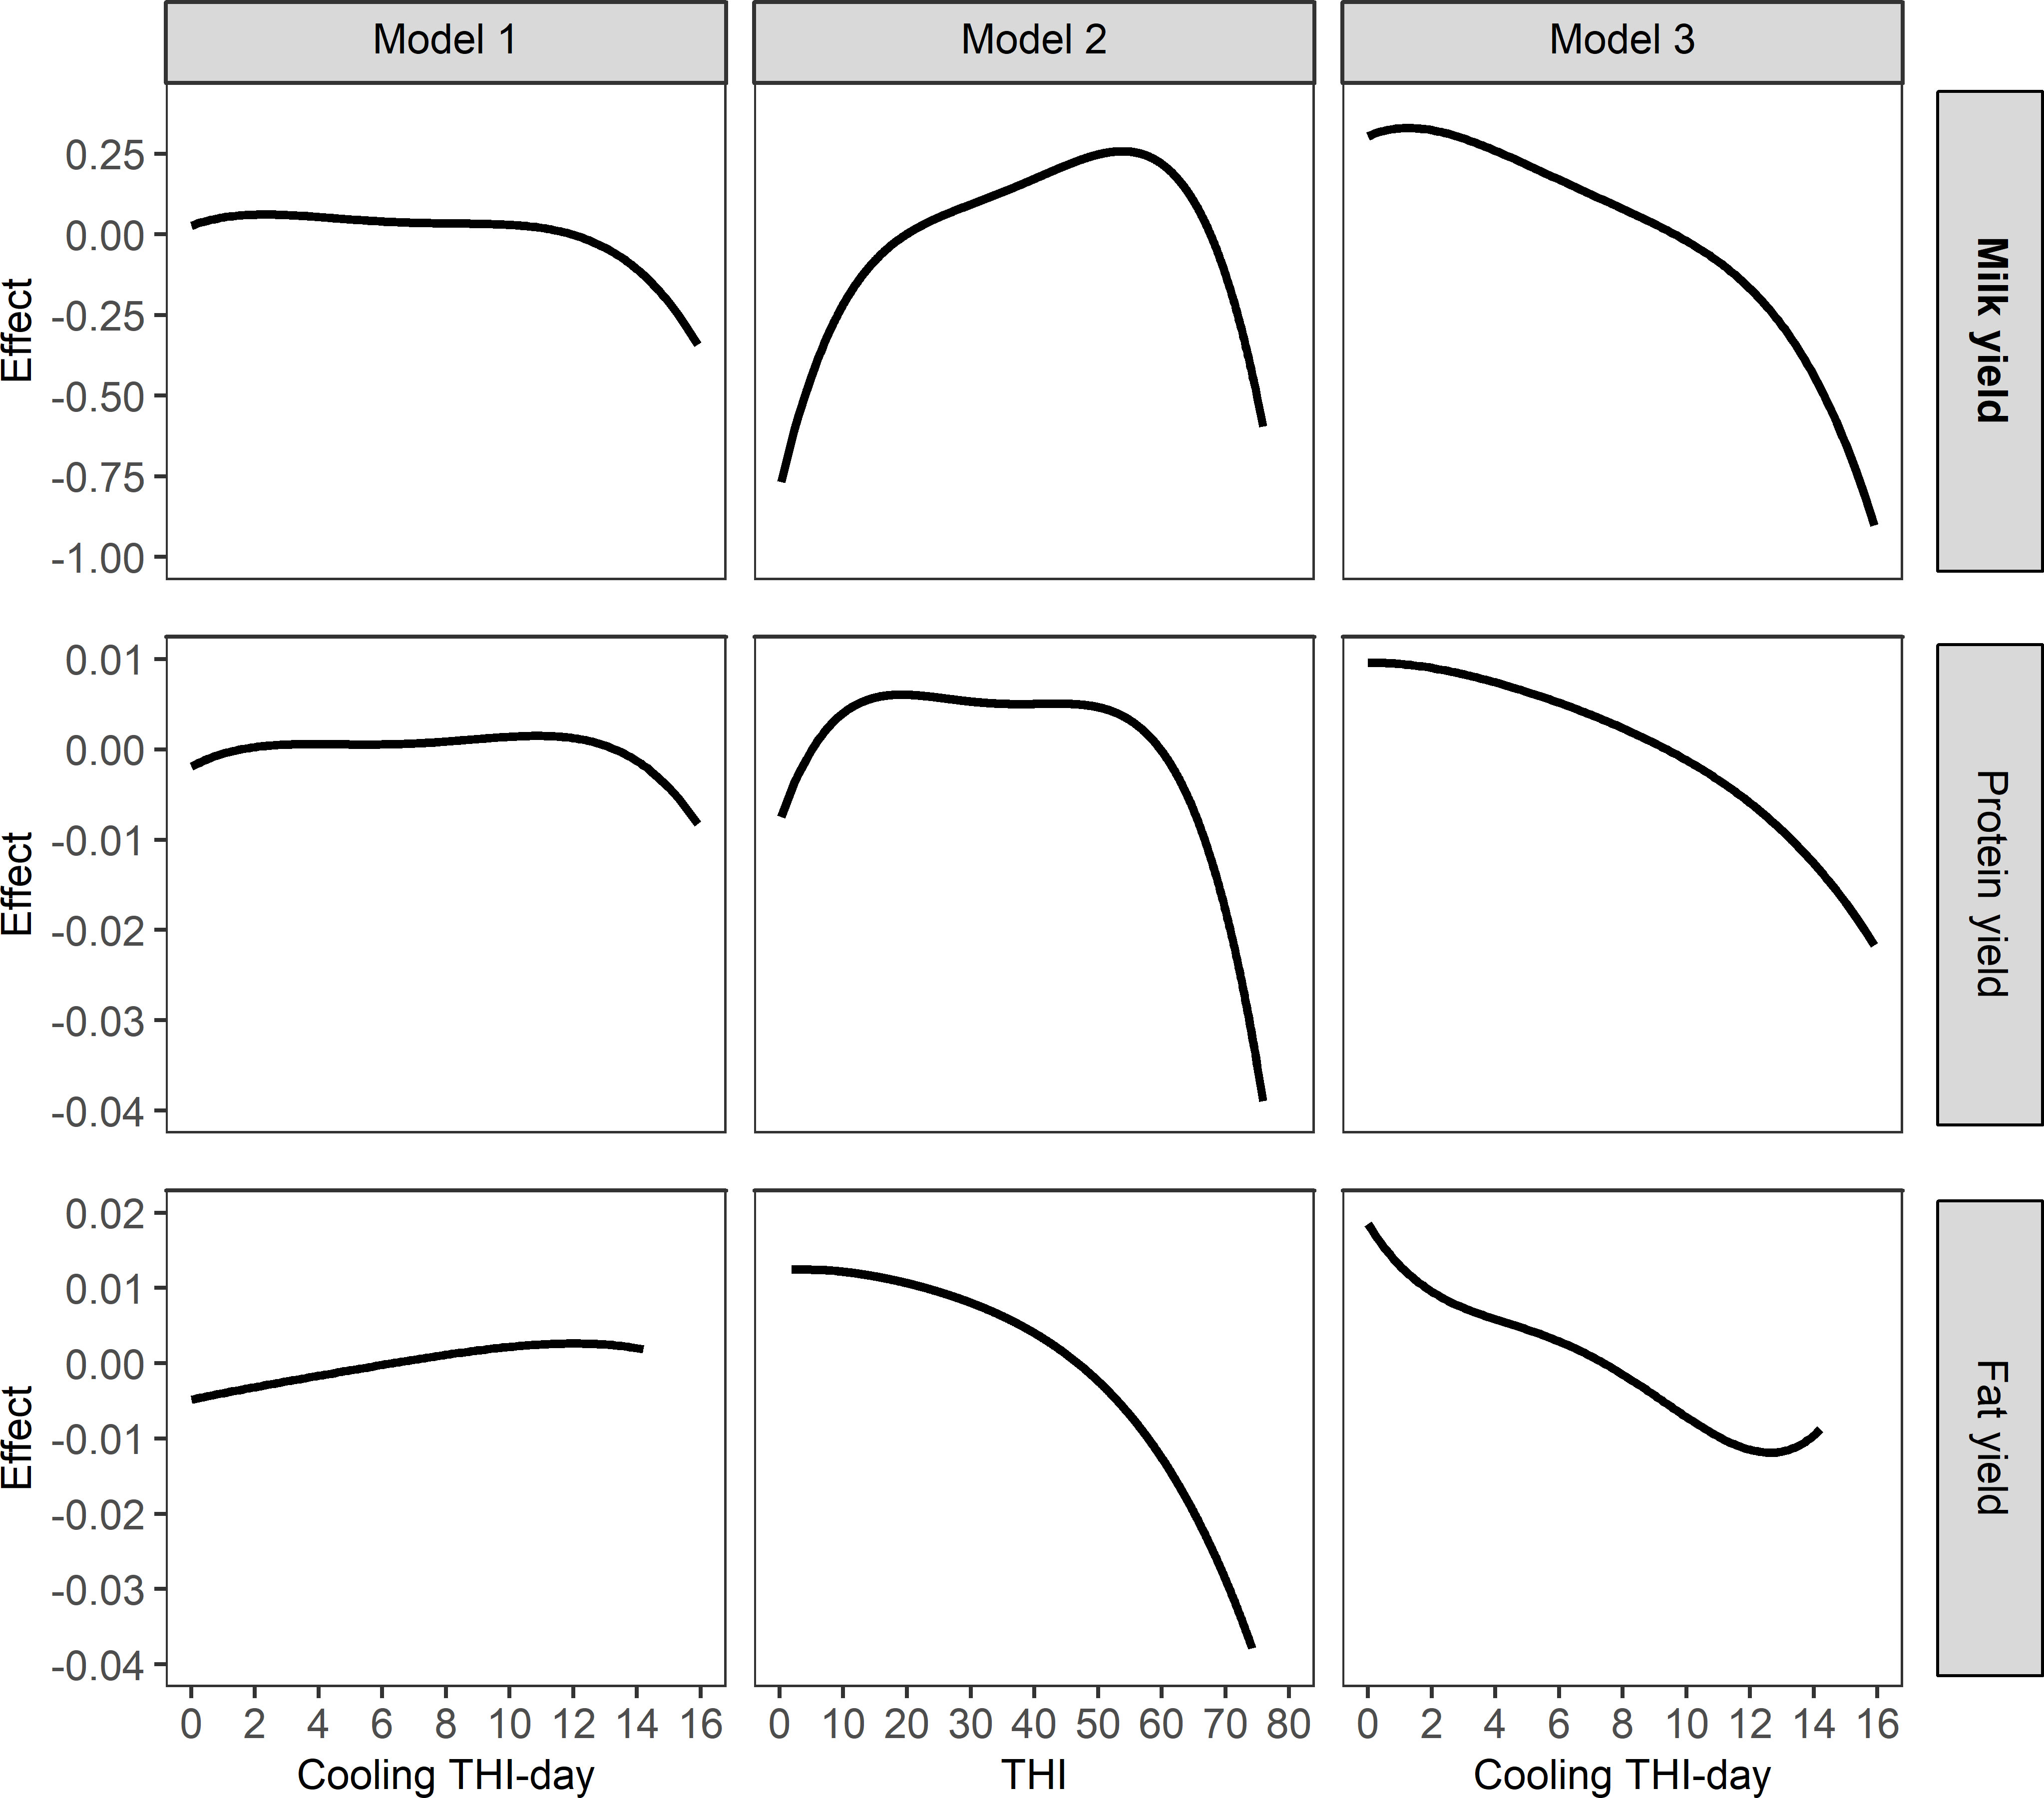
Figure 3 Reaction of average milk yield (top), protein yield (middle), and fat yield (bottom) to THI and cooling THI-day full model (left; plot is for cooling THI-day), THI (middle), and cooling THI-day (right).
The effects of THI and cooling THI-day above the THI threshold for protein yield were about −0.038 and −0.01 kg, respectively. From model 2, the protein yield loss above the THI threshold was about −0.038 kg. The loss estimated from model 3 was −0.031 kg per cow per day. The cumulative heat load above the heat stress threshold caused a further protein yield loss.
Fat yield did not have a clearly defined threshold as depicted from model 2. The cumulative heat load in model 1 depicted both an increasing and decreasing trend for fat yield with no clear net effect. The general trend from model 3 was a decrease in fat yield with increasing heat load. The cooling THI-day model depicted less decline than the THI model. This is because there was substantial loss before the defined THI threshold. This fat yield loss before the THI threshold was not accounted for in model 3. The implication is that a cooling THI-day model with the same base THI for different traits would underestimate the effect of heat stress for traits that have a lower or no clearly defined threshold.
The reaction of protein and fat contents to increasing THI and cooling THI-day is presented in Figure 4. Results from model 2 indicated that protein content decreases with increasing heat stress with no THI breakpoint. From model 1, a slight increase was observed due to cooling THI-day above a threshold of 60 THI units. However, it was clear from model 3 that protein content continuously declines with increasing heat load.
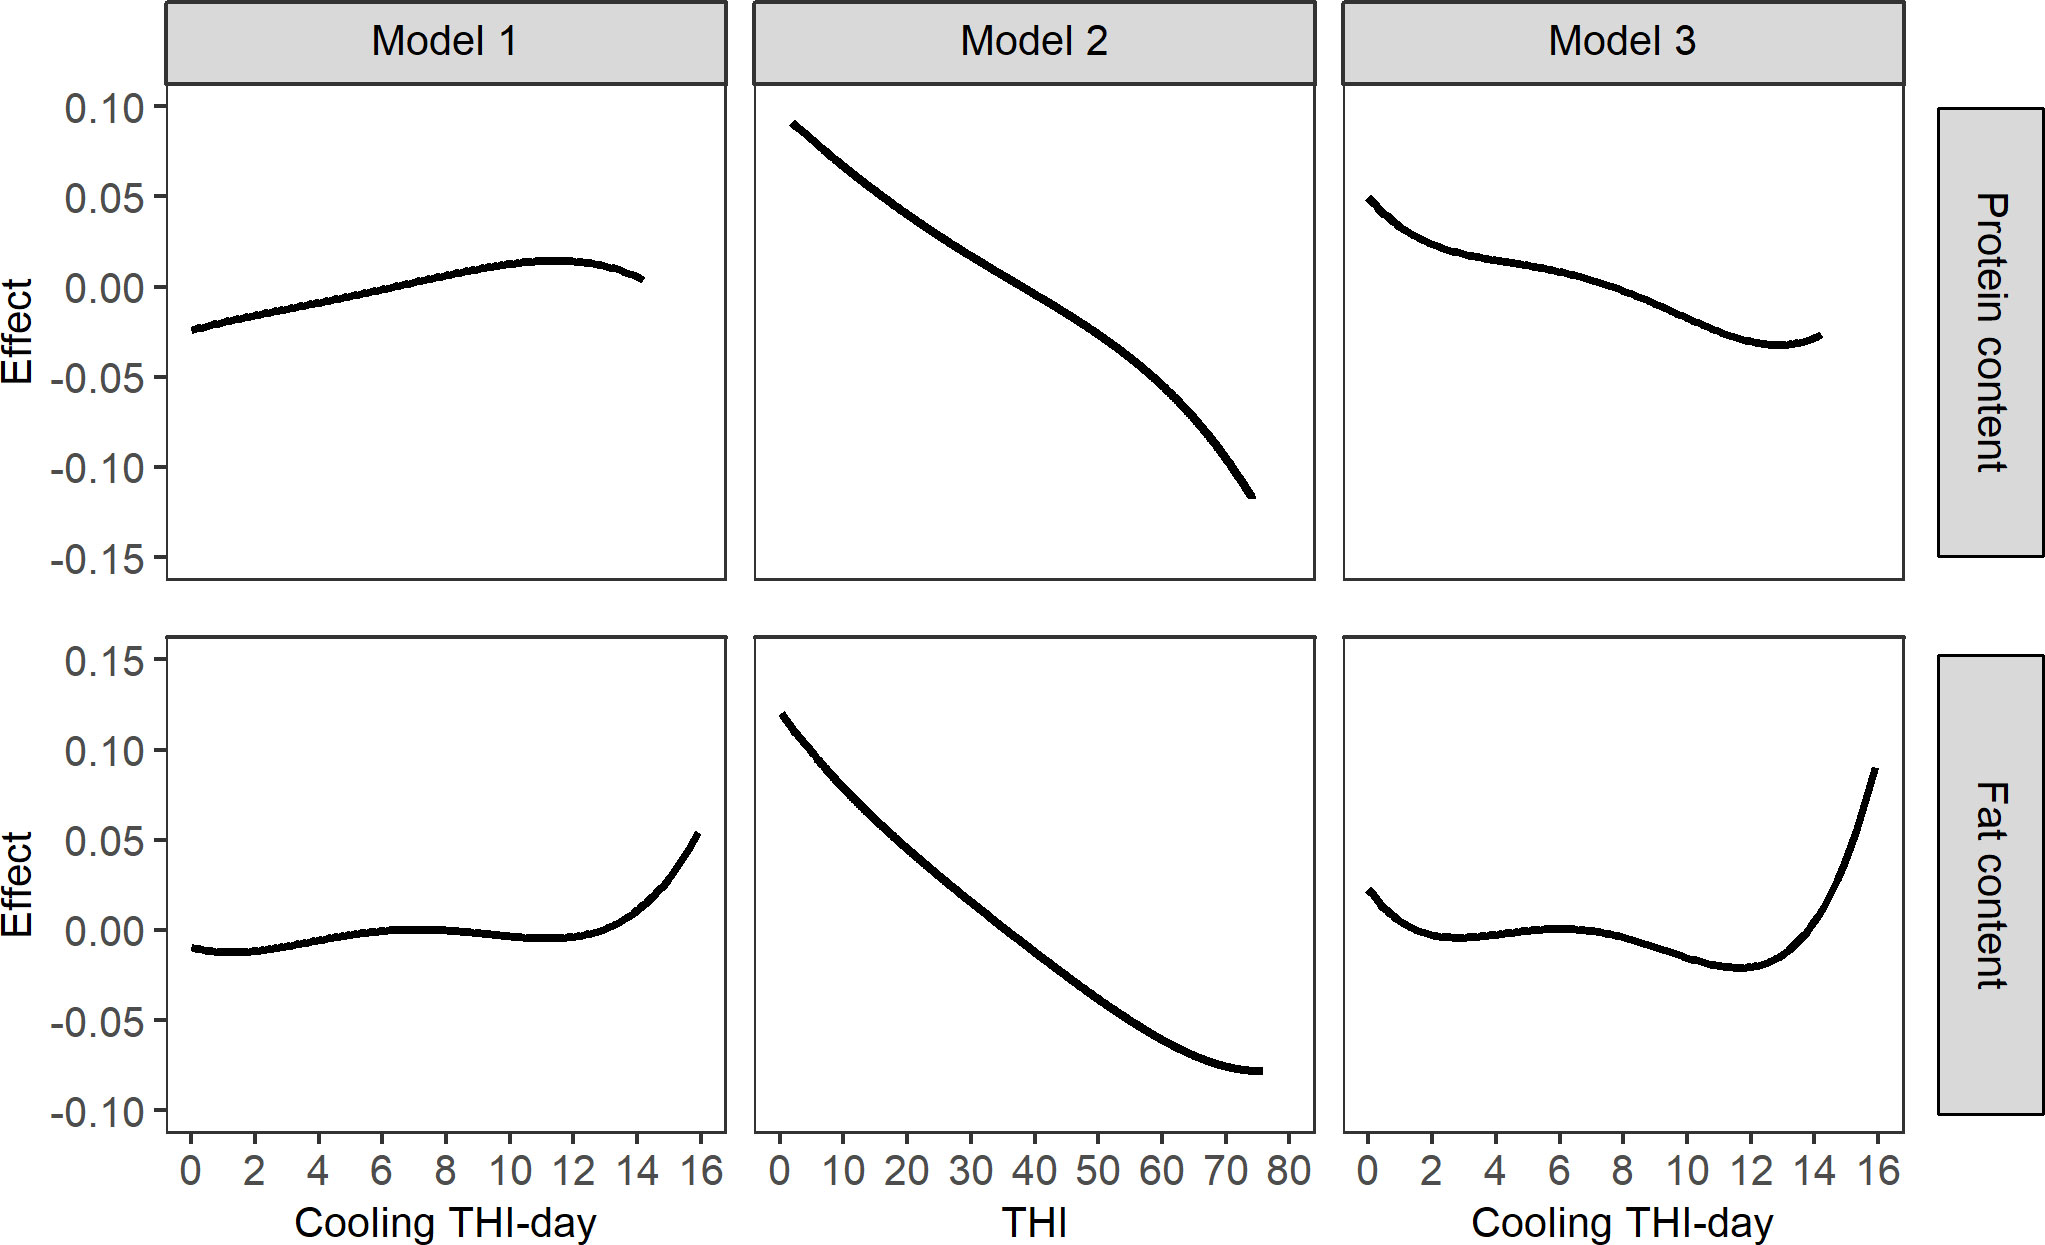
Figure 4 Reaction of protein content (top) and fat content (bottom) to THI and cooling THI-day full model (left; plot is for cooling THI-day), THI (middle), and cooling THI-day (right).
Although fat content declined with no THI threshold when model 2 was applied, cumulative heat stress led to a slight increase. Results from model 3 indicate that cooling THI-day above 12 units would cause the fat content to increase by 0.027 kg/cow per day. Although the THI model indicated decreasing fat content with increasing THI, the cooling THI-day indicated that cumulative heat load causes a counter effect and eventually causes an increase.
Figure 5 presents the reaction of milk urea and SCS to increasing thermal load from different models. Milk urea followed an increasing trend with increasing THI when estimated from models 1 and 2. Cumulative heat load in model 3 did not depict a clear trend of response. An increasing trend was followed by a decreasing trend resulting in an unclear net effect. Increasing THI caused a decrease in SCS when estimated from model 2. Increasing THI above the threshold caused an unexpected decrease of −0.15 units. However, models 1 and 3 indicated that when cooling THI-day was above 12 units, SCS started to increase. This feature was not captured by the conventional THI model 2.
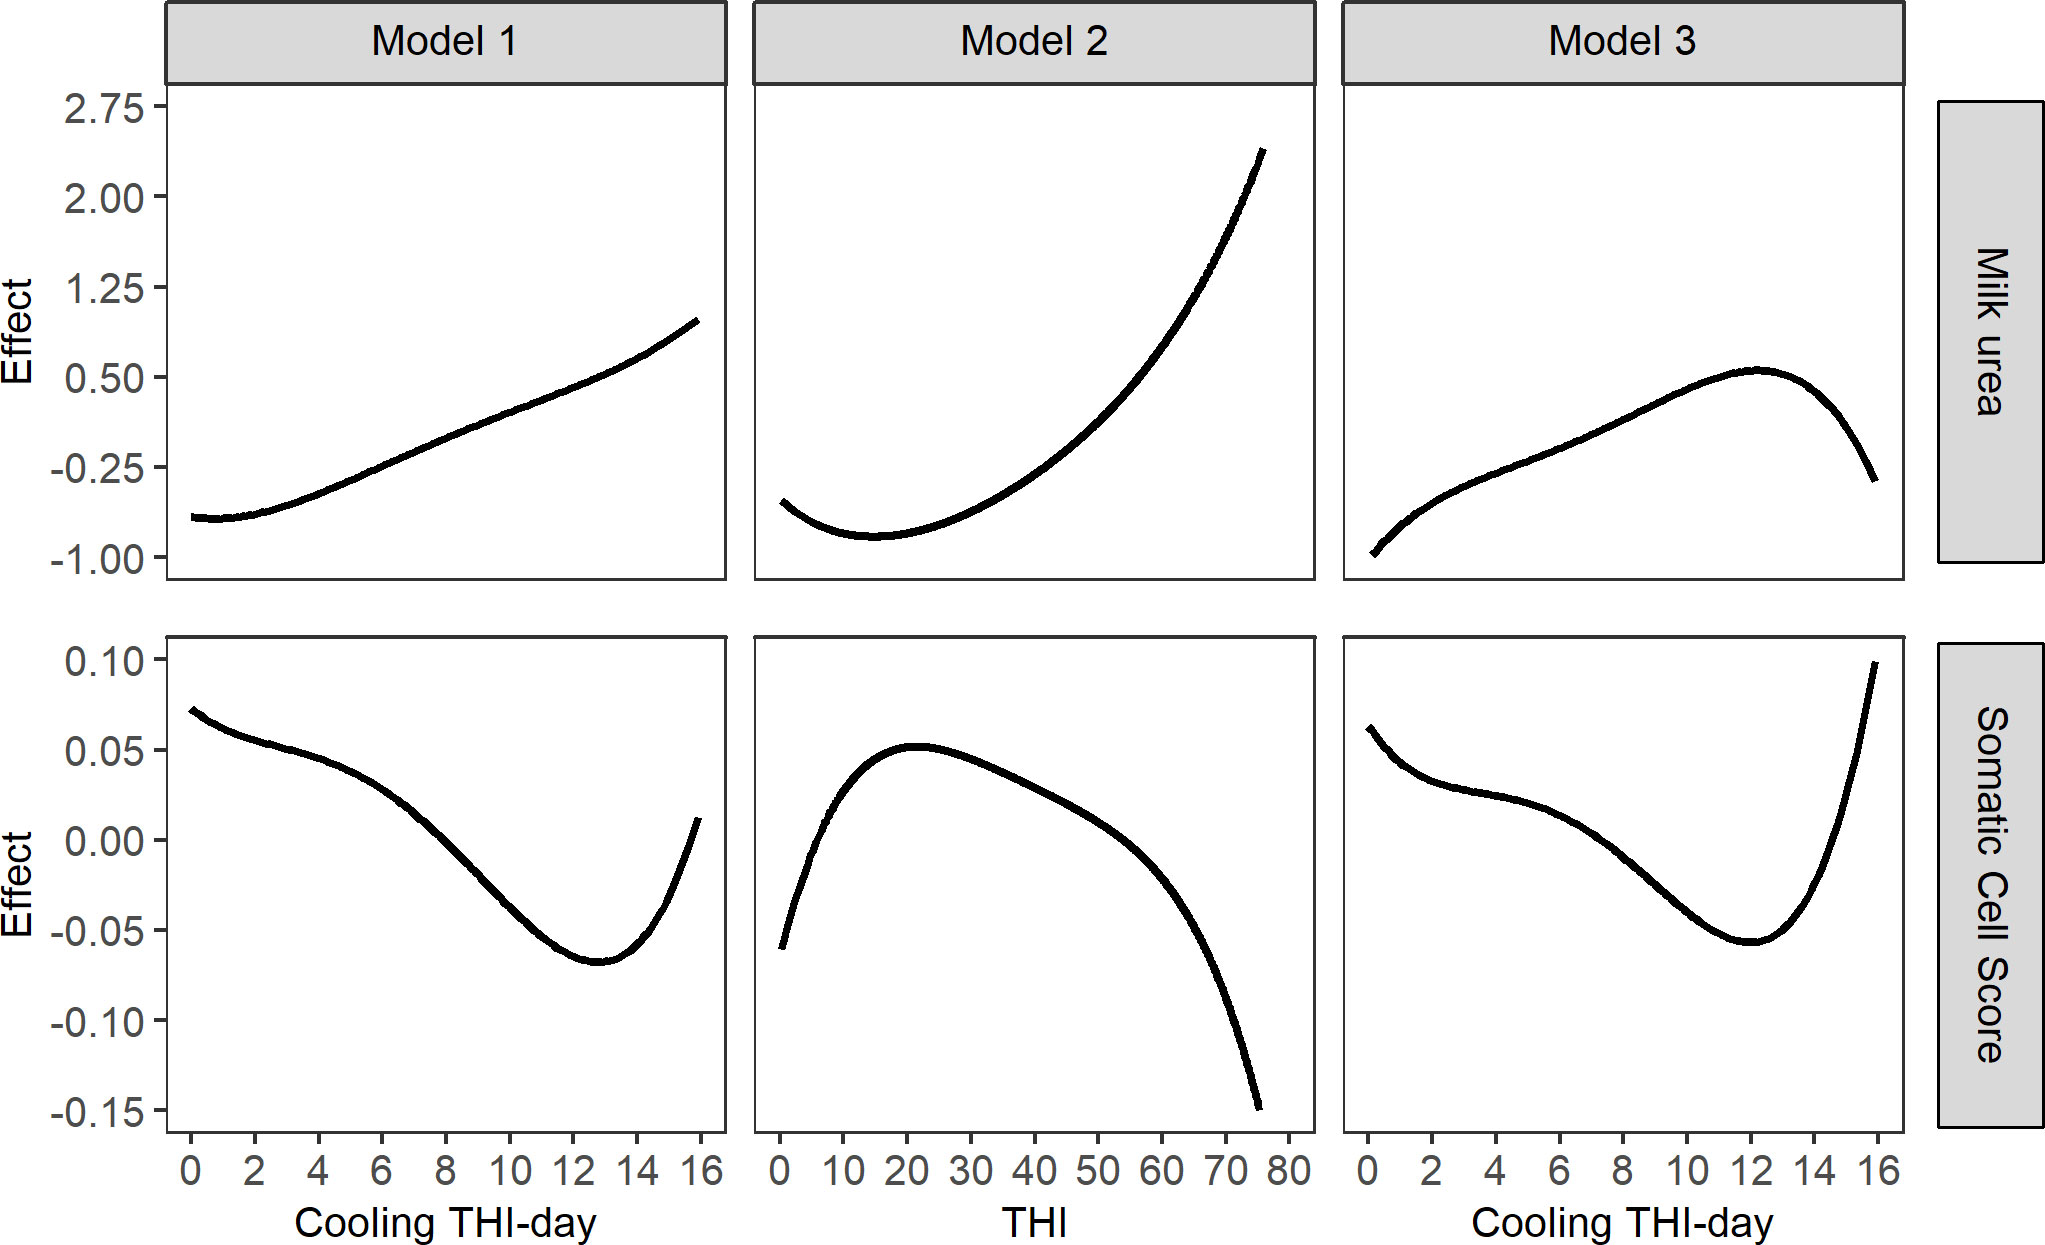
Figure 5 Reaction of milk urea (top) and somatic cell score (SCS, bottom) to THI and cooling THI-day full model (left; plot is for cooling THI-day), THI (middle), and cooling THI-day (right).
Cooling THI-day models were able to detect significant changes in fat content and SCS that THI models did not. A cooling THI-day of about 12 units appeared to be a significant breakpoint for most traits. This is the equivalent of a daily average THI of 72 units. Below this point, the cumulative THI-day did not seem to significantly affect the reaction norm slope.
The heat load is determined by the area under the curve of diurnal THI range and above the base THI. This implies that the choice of base THI is a critical pre-requisite. Furthermore, for traits that do not have a clearly defined threshold, this area under the curve would be underestimated, consequently the effect of heat stress.
Individual animal differences and trait response to heat stress are expected due to animal-level factors such as breed and physiological differences including age, production level, feed intake, and behavior of the animal (Thornton et al., 2021). Feed intake during heat stress is expected to be altered and consequently affect the milk production trait quality and quantity. Feed intake was not directly accounted for in the models; however, any variation due to feeding effects was expected to be captured by the fixed herd effect and within herd variations by the random herd test-day (HTD) effects, which accounts for variation not related to heat stress.
The use of THI-day requires high temporal resolution weather data at hourly interval as opposed to daily averages. Observational data are readily available from public weather stations and grid reanalysis datasets may be readily compiled if relevant weather variables are accessible. For instance, Mistry (2019) derived high spatial resolution grid-interpolated degree-days using meteorological variables incorporating satellite and ground-based observations. The spatial extent of such gridded datasets and possibility for regional reanalysis and their free availability to public make them valuable resources for researchers.
This being a novel study applying cooling THI-day on heat stress analysis in cattle, we recommend further studies to validate it in different production environments. This will contribute to improved animal management during periods of heat stress.
Conclusion
Accounting for cooling THI-days in conventional THI reaction norms provided some significant improvement because it was able to capture some addition variation. Reaction norm models that do not account for the cumulative heat load above the threshold tend to underestimate the effects on milk production traits. The application of cooling THI-days is not equally important for all milk production traits. In our study, it was not efficient for traits with no definite heat stress thresholds, e.g., protein content, fat content, and fat yield. This is because a THI threshold is a pre-requisite for cooling THI-day calculation. Calculation of THI-day requires high temporal resolution weather data such as hourly interval as opposed to daily averages.
We recommend further studies with cooling THI-day as a heat stress indicator. This includes genetic studies where it is expected that cooling THI-day would explain more genetic variation and probably improve the heritability estimates.
Data availability statement
The data analyzed in this study is subject to the following licenses/restrictions: Milk performance data were provided by the local milk recording organization (LKV Bayern) and is the farmers property. Weather data are available from public databases of the Deutscher Wetterdienst (DWD). Requests to access these datasets should be directed to https://www.dwd.de/DE/klimaumwelt/cdc/cdc_node.html.
Ethics statement
Ethical review and approval was not required for the animal study because milk recording is done on routine basis on dairy farms for management purposes.
Author contributions
JM: conceptualization, data analysis, and writing—original draft preparation. AE: weather data curation and writing—review and editing. NR: conceptualization, methodology, funding acquisition and project administration, supervision, and writing—review and editing. All authors have read and approved the final version of the manuscript. All authors contributed to the article and approved the submitted version.
Funding
This work was financially supported by the German Federal Ministry of Food and Agriculture (BMEL) through the Federal Office for Agriculture and Food (BLE) project no. FKZ 2815DOKP06 and by the core budget of the Research Institute for Farm Animal Biology (FBN). The authors also gratefully acknowledge financial support from the H. Wilhelm Schaumann-Stiftung, Hamburg.
Acknowledgments
The authors acknowledge Landeskuratorium der Erzeugerringe für tierische Veredelung in Bayern e.V. (LKV Bayern) for providing the milk performance records and the Deutscher Wetterdienst (DWD) for the weather data.
Conflict of interest
The authors declare that the research was conducted in the absence of any commercial or financial relationships that could be construed as a potential conflict of interest.
Publisher’s note
All claims expressed in this article are solely those of the authors and do not necessarily represent those of their affiliated organizations, or those of the publisher, the editors and the reviewers. Any product that may be evaluated in this article, or claim that may be made by its manufacturer, is not guaranteed or endorsed by the publisher.
References
Aguilar I., Misztal I., Tsuruta S. (2010). Short communication: genetic trends of milk yield under heat stress for US holsteins. J. Dair. Sci. 93, 1754–1758. doi: 10.3168/jds.2009-2756
Armstrong D. V. (1994). Heat stress interaction with shade and cooling. J. Dair. Sci. 77, 2044–2050. doi: 10.3168/jds.S0022-0302(94)77149-6
Bohmanova J., Misztal I., Cole J. B. (2007). Temperature-humidity indices as indicators of milk production losses due to heat stress. J. Dair. Sci. 90, 1947–1956. doi: 10.3168/jds.2006-513
Bouraoui R., Lahmar M., Majdoub A., Djemali M., Belyea R. (2002). The relationship of temperature-humidity index with milk production of dairy cows in a Mediterranean climate. Anim. Res. 51, 479–491. doi: 10.1051/animres:2002036
Brügemann K., Gernand E., König Von Borstel U., König S. (2012). Defining and evaluating heat stress thresholds in different dairy cow production systems. Arch. Anim. Breed. 55, 13–24. doi: 10.5194/aab-55-13-2012
Chen S., Fleischer S. J., Saunders M. C., Thomas M. B. (2015). The influence of diurnal temperature variation on degree-day accumulation and insect life history. PloS One 10, e0120772. doi: 10.1371/journal.pone.0120772
Chezik K. A., Lester N. P., Venturelli P. A. (2014). Fish growth and degree-days I: selecting a base temperature for a within-population study. Can. J. Fish. Aquat. Sci. 71, 47–55. doi: 10.1139/cjfas-2013-0295
CIBSE (2006). “Degree-days: theory and application Technical manual 41(London, UK:The chartered institution of building services engineers), 106p..
Da Silva R. G., Maia A. S., De Macedo Costa L. L. (2015). Index of thermal stress for cows (ITSC) under high solar radiation in tropical environments. Int. J. Biometeorol. 59, 551–559. doi: 10.1007/s00484-014-0868-7
Dikmen S., Hansen P. (2009). Is the temperature-humidity index the best indicator of heat stress in lactating dairy cows in a subtropical environment? J. Dair. Sci. 92, 109–116. doi: 10.3168/jds.2008-1370
Fraisse C. W., Bellow J., Brown C. (2007). Degree days: Heating, cooling, and growing: ABE 381/AE428, 10/2007. EDIS 2007(20), 1–7. doi: 10.32473/edis-ae428-2007
Gaughan J. B., Mader T. L., Holt S. M., Lisle A. (2008). A new heat load index for feedlot cattle. J. Anim. Sci. 86, 226–234. doi: 10.2527/jas.2007-0305
Gilmour A., Gogel B., Cullis B., Welham S., Thompson R. (2015). ASReml user guide release 4.1 structural specification. VSN international ltd, Hemel hempstead. HP1 1ES:UK. 364 p
Hammami H., Bormann J., M'hamdi N., Montaldo H. H., Gengler N. (2013). Evaluation of heat stress effects on production traits and somatic cell score of holsteins in a temperate environment. J. Dair. Sci. 96, 1844–1855. doi: 10.3168/jds.2012-5947
Lees J. C., Lees A. M., Gaughan J. B. (2018). Developing a heat load index for lactating dairy cows. Anim. Prod. Sci. 58, 1387–1391. doi: 10.1071/AN17776
Mader T. L., Johnson L. J., Gaughan J. B. (2010). A comprehensive index for assessing environmental stress in animals. J. Anim. Sci. 88, 2153–2165. doi: 10.2527/jas.2009-2586
Matzarakis A., Thomsen F. (2009). Heating and cooling degree days as an indicator of climate change in freiburg. 89th AMS annual meeting. (Phoenix, Arizona:Fourth symposium on policy and socio-economic research), 8p.
Mbuthia J. M., Eggert A., Reinsch N. (2022a). Comparison of high resolution observational and grid-interpolated weather data and application to thermal stress on herd average milk production traits in a temperate environment. Agric. For. Meteorol. 322, 108923. doi: 10.1016/j.agrformet.2022.108923
Mbuthia J. M., Mayer M., Reinsch N. (2021). Modeling heat stress effects on dairy cattle milk production in a tropical environment using test-day records and random regression models. Animal 15, 100222. doi: 10.1016/j.animal.2021.100222
Mbuthia J. M., Mayer M., Reinsch N. (2022b). A review of methods for improving resolution of milk production data and weather information for measuring heat stress in dairy cattle. Livest. Sci. 255, 104794. doi: 10.1016/j.livsci.2021.104794
McMaster G. S., Wilhelm W. (1997). Growing degree-days: one equation, two interpretations. Agric. For. Meteorol. 87, 291–300. doi: 10.1016/S0168-1923(97)00027-0
Mistry M. N. (2019). Historical global gridded degree-days: A high-spatial resolution database of CDD and HDD. Geosci. Data J. 6, 214–221. doi: 10.1002/gdj3.83
Neuheimer A. B., Taggart C. T. (2007). The growing degree-day and fish size-at-age: the overlooked metric. Can. J. Fish. Aquat. Sci. 64, 375–385. doi: 10.1139/f07-003
NRC (1971). A guide to environmental research on animals (Washington, DC: National Academy of Sciences).
Ravagnolo O., Misztal I., Hoogenboom G. (2000). Genetic component of heat stress in dairy cattle, development of heat index function. J. Dair. Sci. 83, 2120–2125. doi: 10.3168/jds.S0022-0302(00)75094-6
R Core Team (2020). R: A language and environment for statistical computing (Vienna, Austria: R Foundation for Statistical Computing). Available at: https://www.R-project.org/.
Spinoni J., Vogt J. V., Barbosa P., Dosio A., Mccormick N., Bigano A., et al. (2018). Changes of heating and cooling degree-days in Europe from 1981 to 2100. Int. J. Clim. 38, e191–e208. doi: 10.1002/joc.5362
Thornton P., Nelson G., Mayberry D., Herrero M. (2021). Increases in extreme heat stress in domesticated livestock species during the twenty-first century. Global Change Biol. 27, 5762–5772. doi: 10.1111/gcb.15825
Wang X., Bjerg B. S., Choi C. Y., Zong C., Zhang G. (2018a). A review and quantitative assessment of cattle-related thermal indices. J. Therm. Biol. 77, 24–37. doi: 10.1016/j.jtherbio.2018.08.005
Keywords: cooling THI-day, cumulative heat load, heat stress indicator, hourly average integration, THI threshold, milk traits
Citation: Mbuthia JM, Eggert A and Reinsch N (2022) Cooling temperature humidity index-days as a heat load indicator for milk production traits. Front. Anim. Sci. 3:946592. doi: 10.3389/fanim.2022.946592
Received: 17 May 2022; Accepted: 30 June 2022;
Published: 25 July 2022.
Edited by:
Vishwajit S. Chowdhury, Kyushu University, JapanReviewed by:
Halima Sultana, University of Florida, United StatesHatem Eltahan, Agricultural Research Center, Egypt
Copyright © 2022 Mbuthia, Eggert and Reinsch. This is an open-access article distributed under the terms of the Creative Commons Attribution License (CC BY). The use, distribution or reproduction in other forums is permitted, provided the original author(s) and the copyright owner(s) are credited and that the original publication in this journal is cited, in accordance with accepted academic practice. No use, distribution or reproduction is permitted which does not comply with these terms.
*Correspondence: Norbert Reinsch, cmVpbnNjaEBmYm4tZHVtbWVyc3RvcmYuZGU=
 Jackson M. Mbuthia
 Anja Eggert
 Norbert Reinsch