
94% of researchers rate our articles as excellent or good
Learn more about the work of our research integrity team to safeguard the quality of each article we publish.
Find out more
ORIGINAL RESEARCH article
Front. Anim. Sci., 04 May 2022
Sec. Product Quality
Volume 3 - 2022 | https://doi.org/10.3389/fanim.2022.889797
This article is part of the Research TopicGenetic Factors affecting the Nutritional and Processing Quality of MilkView all 5 articles
 Giustino Gaspa1*†
 Fabio Correddu2†Alberto Cesarani2,3Michele Congiu2Corrado Dimauro2
 Alfredo Pauciullo1
 Nicolò Pietro Paolo Macciotta2
Milk coagulation ability is crucial for the dairy sheep industry since the whole amount of milk is processed into cheese. Non-coagulating milk (NCM) is defined as milk not forming a curd within the testing time. In sheep milk, it has been reported in literature that up to 20% of milk is NCM. Although the clotting properties of individual milk have been widely studied, little attention has been given to NCM and genomic dissection of this trait. Mid-infrared (MIR) spectra can be exploited both to predict cheese-making aptitude and to discriminate between coagulating milk and NCM. The main goals of this work were (i) to assess the predictivity of MIR spectra for NCM classification and (ii) to conduct a genome-wide association study on coagulation ability. Milk samples from 949 Sarda ewes genotyped and phenotyped for milk coagulation properties (MCPs) served as the training dataset. The validation dataset included 662 ewes. Three classical MCPs were measured: rennet coagulation time (RCT), curd firmness (a30), and curd firming time (k20). Moreover, MIR spectra were acquired and stored in the region between 925.92 and 5,011.54 cm−1. The probability of a sample to be NCM was modeled by step-wise logistic regression on milk spectral information (LR-W), logistic regression on principal component (LR-PC), and canonical discriminant analysis of spectral wave number (DA-W). About 9% of the samples did not coagulate at 30 min. The use of LR-W gave a poorer classification of NCM. The use of LR-PC improved the percentage of correct assignment (45 ± 9%). The DA-W method allows us to reach 75.1 ± 10.3 and 76.5 ± 18.4% of correct assignments of the inner and external validation datasets, respectively. As far as GWA of NCM, 458 SNP associations and 45 candidate genes were detected. The genes retrieved from public databases were mostly linked to mammary gland metabolism, udder health status, and a milk compound also known to affect the ability of milk to coagulate. In particular, the potential involvement of CAPNs deserves further investigation.
Sheep milk production globally amounts to 10 Mt (1.3% of total milk production), with 250 M sheep farmed for dairy purposes worldwide (FAO, 2011). Sheep farming plays a very important role in the agro-economy of the Mediterranean area, countries in Asia, and developing countries. For instance, in the European Union (UE), four countries (France, Greece, Spain, and Italy) accounted for about 15 M dairy ewes and contribute to 12.9% of the world's sheep milk (Pulina et al., 2018). In Italy, the autochthonous Sarda sheep is meanly reared for milk production (2.8 M heads and 330 M kg/y). Nearly the whole amount of sheep milk is sold to milk plants where it is processed into cheese (Carta et al., 2009). Yearly, protected denomination of origin cheeses are produced from sheep milk for the EU market or are exported overseas (Pulina et al., 2018, 2021). The presence of non-coagulating milk impairs achievable cheese yield and profit.
In laboratories, milk coagulation properties (MCPs) are often assessed by individual measurements such as rennet coagulation time (RCT) and curd firmness (A30). The former is the time between the addition of rennet to milk and the beginning of the clotting process, and the latter measures the consistency of laboratory curd after 30 min; both are assessed by means of lacto-dynamometers (e.g., Formagraph or Optigraph instruments; Bittante et al., 2012). Reduced RCT and high A30 are associated with higher cheese yields (De Marchi et al., 2008). Conversely, milk may show large RCT to the extent that curd formation is neglected. As far as the latter aspect is concerned, its association with fat and protein contents in the literature is controversial (Nilsson et al., 2019; Vacca et al., 2019; Figueroa et al., 2020), whereas genotypes of casein cluster, milk acidity, lactose, and udder health are well-known factors impacting on MCP (Bittante et al., 2012). Effects of ruminant species and breeds on milk coagulation ability have also been studied (De Marchi et al., 2008; Bittante et al., 2012). As far as sheep breeds are concerned, physiological and environmental factors such as lactation stage, lambing season, flock, and nutrition management explain a large part of MCP variability (Pazzola et al., 2014; Manca et al., 2016). Moreover, ewes' milk composition has been reported to be significantly different between non-coagulating milk (NCM) and coagulating milk (CM) samples in previous studies (Figueroa et al., 2020; Correddu and Macciotta, 2021).
Genetic selection for MCPs is possible because of a moderate additive genetic variation that explains part of the individual differences. For instance, in the Sarda Breed, heritability of 0.08–0.14 and 0.18–0.23 were estimated for a30 and RCT, respectively (Bittante et al., 2017; Puledda et al., 2017). Pelayo et al. (2021) found a value of similar magnitude (0.16 for a30 and 0.22 for RCT) in Spanish Churra sheep. Although using MCPs in breeding programs is feasible (Cecchinato et al., 2009), it requires the availability of mid-infrared (IR)-predicted MCPs at the population level. Mid-IR spectra are routinely collected for quantifying milk composition (De Marchi et al., 2014), and they have also been proposed as effective tools to predict complex and costly traits in many livestock species (Bell and Tzimiropoulos, 2018; Bresolin and Dorea, 2020). However, calibration of prediction equations requires estimation of coefficients through multivariate regression of observed traits in mid-IR spectra: Partials least square (PLS) regression or more advanced Bayesian regressions techniques are used (Cecchinato et al., 2009; De Marchi et al., 2014; Ferragina et al., 2015). Mid-IR-predicted MCPs are found reliable sources to be used as selection objectives (Sanchez et al., 2018). However, before obtaining these predictions, NCM samples are usually removed. The prediction of NCM from mid-IR milk spectra or the inclusion of NCM in genetic analysis has been considered (Cecchinato and Carnier, 2011; Manuelian et al., 2020; Correddu and Macciotta, 2021). A genetic negative correlation has been estimated between NCM prevalence and protein contents in dairy cattle (Gustavsson et al., 2014b). Although the influence of milk protein genotypes is known (e.g., casein cluster genes; Bittante et al., 2012), many other genetic variants are yet to be discovered and could be associated with the higher prevalence of NCM in ruminant milk. Despite the moderate heritability of MCPs in dairy cattle and sheep (0.2–0.45; Bittante et al., 2012; Gustavsson et al., 2014b; Puledda et al., 2017), the genetic background of these complex traits is still far from being elucidated. Powerful techniques are now available to perform genome-wide association studies using single nucleotide polymorphisms (SNPs) derived from commercial panels or next-generation whole-genome sequencing. Recently, a genome-wide association (GWA) study suggested a QTL on BTA18 for NCM segregating in the Swedish Red Cattle population (Duchemin et al., 2016), and other GWA studies have been performed on MCPs in dairy cattle (Dadousis et al., 2016; Sanchez et al., 2019). Very few reports are available for GWA studies on ovine coagulation traits (Marina et al., 2020, 2021).
Few studies have dealt with the prediction of individual sheep NCM, and no genomic analysis for the same binary trait has been performed yet. This research aims to bridge this gap of knowledge. Here, the use of mid-IR data is proposed to discriminate between CM and NCM samples. Regression, classification techniques, and validation procedures were tested on two large samples of Sarda ewes with both phenotypes for coagulation and genotypes. In summary, the main goals of this study are (i) to predict NCM samples using mid-IR spectra by modeling the probability of an individual observation of being classified as NCM and (ii) to conduct a GWA under the single-step GBLUP (ssGBLUP) animal models searching for genomic regions associated with the NCM phenotype.
The three classical MCPs were determined with a Formagraph instrument (Foss Electric A/S, Hillerød, Denmark) for a large sample of Sarda ewes. Two datasets were used for this study. The first included 1,018 ewes from 47 flocks located in Sardinia (Italy), and it was used for the training-validation procedure (data I). The dataset (data I) was derived from a project involving the Sarda sheep breed: details of the laboratory analysis are provided in Manca et al. (2016). A second unpublished dataset (data II) with the same variables served as the validation dataset. Data II included MCPs from 662 ewes from the same flocks but sampled 1 year later for a total of 2,710 records. Based on RCT variables, individual milk samples were classified into milk that coagulated within 30 min (CM) and milk that did not (NCM). The animal and flock variables (e.g., parity, days in milk, lactation length, etc.), milk composition (e.g., fat, protein, lactose, urea, SCC, chloride, pH, etc.), and clotting properties (RCT, a30, K20, and laboratory cheese yield) have been previously described (Manca et al., 2016; Puledda et al., 2017). A brief summary of MCP and flock variables for data I and data II is provided in Supplementary Table 1.
The individual milk samples of both datasets were analyzed using Spectrometer MilkoScanTM (Foss Electric, Hillerød, Denmark), and Fourier Transform-IR (FTIR) spectra in the region between 925.92 and 5,011.54 cm−1 were stored (1,060 data points) for each animal. After data editing, 949 and 2,704 records were available for analysis (Table 1). Following the description of milk spectra given by Bittante and Cecchinato (2013), five different wave regions were used to tag milk spectra (Supplementary Table 2).
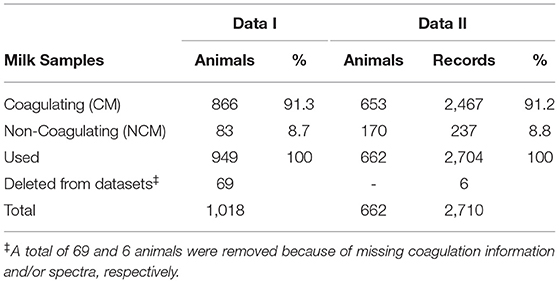
Table 1. Data summary for coagulating and non-coagulating milk samples in the two analyzed datasets.
The animals of data I were genotyped with Infinium Ovine SNP50 v1 BeadChip (Illumina Inc., San Diego, CA, United States). The genotypes at 54 k SNP loci were available for 769 out of the 1,018 animals. Quality control on SNP was carried out according to the following protocol: SNP with call rate>0.95 on individual and >0.975 on SNP were retained. Moreover, SNPs with minor allele frequency (MAF) lower than 0.01, deviated significantly from the Hardy Weinberg Equilibrium (P < 0.01), or did not map on any assembled OAR chromosomes (version OAR 4.0) were discarded. After quality control, all genotyped ewes had 44,619 SNPs on 27 chromosomes. A pedigree with 633,317 animals was also available. Further details are available in Cesarani et al. (2019a).
Descriptive statistics of spectral data for the two classes of coagulation were computed: spectral-wide average within the coagulation class and mean absorbance differences between the NCM and CM samples. Data management and visualization were carried out using the R software (R Core Team, 2021, Vienna Austria). To predict coagulation ability, a binary trait was created according to the RCT values (y = 0 for NCM and y = 1 for CM). Different statistical techniques were applied for modeling the probability of a sample being NCM. The procedures used involved stepwise variable selection, multiple logistic regression, multivariate statistical analysis and the validation procedures implemented in SAS (v.9.14, SAS Institute Inc., Cary NC, United States) and described in next subparagraphs and in the paragraph Assessment of FTIR Predictions and Validation Procedures.
The probability of observing NCM, pi (yi = 0), was modeled by multiple logistic regression of the logit(pi)on the whole spectra (PROC LOGISTIC of SAS):
where n is the wave number (1,060 data points), and β0 and βi are, respectively, the intercept and the regression coefficients of the i-th wave number effect (Xi) in the log odds scale. A stepwise procedure of variable selection was carried out to pick relevant wave numbers in order to overcome the multi-collinearity issue. Two thresholds for a variable to enter and to stay in the final model were used (more stringent at α = 0.01 and less stringent at α = 0.05). A total of two settings were analyzed, namely, LR-W01 and LR-W05.
The model [1] was applied by replacing in Xi the i-th wave numbers by the principal component (PCi) extracted from the whole spectra and explaining 95% of the variance. The stepwise procedure of variable selection was carried out also for PC logistic regression defining in this way two more settings: LR-PC01 and LR-PC05. Selection of wave numbers was also carried out excluding, prior to computing PC, the noisy part of the spectra associated with water absorbance (Figure 2). Hence, two more scenarios were evaluated after removing: a) wave number in the range 5,000–3,048 cm−1 (i.e., SWIR and SWIR-MWIR regions, see Supplementary Table 2) and b) wave number 1,701–1,582 (MWIR-2); namely LR-PCW1 and LR-PCW1,2, respectively.
The prediction of the probability of being classified as NCM for a generic i-th milk sample was obtained by applying,
where the terms of Equation 2 were previously defined and p(p<<n) is the wave numbers or PCs selected by the stepwise procedure. If for a sample the predicted probability resulted >0.5, then that sample is classified as NCM, otherwise, it is predicted as CM.
A multivariate canonical discriminant analysis (DA) was conducted on the milk coagulation datasets. First, the stepwise variable selection was carried out. Two settings based on the p-values for each absorbance to enter/stay in the final model were implemented with the slentry and slstey options of the STEPDISC procedure of SAS (DA-W01 and DA-W05 for p < 0.01 and p < 0.05, respectively). Next, the CANDISC procedure was run on the selected variables for each setting. Finally, the DISCRIMINANT procedure of the SAS software was used to predict coagulation outcomes for new data. This algorithmic sequence has been previously demonstrated to be suitable for classification problems in high multidimensional genomic data (Dimauro et al., 2013). A description of theoretical bases is provided below, whereas the details of the algorithmic sequence are reported in Manca et al. (2021). Briefly, the correlation structure among milk spectra absorbance of data I was used to derive new variables, namely, canonical discriminant function (CAN), which can maximize the separation between the predefined groups. If W is the m × n matrix of the n wave numbers measured in m milk samples belonging to k groups (two in our case: NCM and CM) the CAN functions may be obtained for a generic sample:
where w1 … wn are the centered absorbances for n data points (as deviation from the column means) and cin are the elements of the c vector containing the raw canonical coefficients for the i-th CAN (i.e., the weights of each wave absorbance in the discriminant function). The vector c is obtained with a procedure that involves the eigendecomposition of the linear transformations of between- and within-group absorbance (co) variance matrices. The degree of separation among centroids was evaluated by Malhanobis distances and Hotelling's T2. Wilks's lambda was used as an equivalent F-measure in the multivariate analysis of variance (MANOVA). Once the discriminant functions have been set up, the c coefficients were used to predict the coagulation status that was masked for a proportion of individuals (10%, in data I) for the inner validation or in an external dataset as described in the following paragraph (data II).
The number of animals and the details of the validation procedures adopted and datasets are described in Table 1 and Figure 1. Two procedures of validation were carried out: inner validation (A) and external validation (B). The predictive ability of the models tested in subparagraphs Stepwise Multiple Logistic Regression on IR Spectra (LR-W) or Principal Components of IR Spectra (LR-PC) and Canonical Discriminant Analysis (DA) on Step-Wise Selected Wave Number was evaluated through % of the correct assignments of predicted NCM and CM samples. Using the nomenclature of the confusion matrix, it was evaluated the percentage of the true positive (corresponding to NCM) and true negative samples (CM); precision and accuracy were also evaluated (Fawcett, 2006). Given the large disproportion between the NCM and CM samples, all the procedures involving random sampling were stratified within the CM and NCM groups in order to ensure an equal proportion of NCM in the validation datasets. Three scenarios with different sub-settings of data I (A1, A2, and A3) and one scenario for data II (B) were evaluated (Figure 1):
A1) the training and validation sets had repectively 90% and 10% of randomly chosen data;
A2) training and validation sets had the same proportion as in A1 but the validation samples derived from 3 flocks that were excluded from the training data;
A3) the procedure A1 was repeated 100 times, and the proportion of correct assignments was averaged across replicates for CM and NCM predictions;
B) in this last case, the whole data I and data II serve as training and validation datasets, respectively.
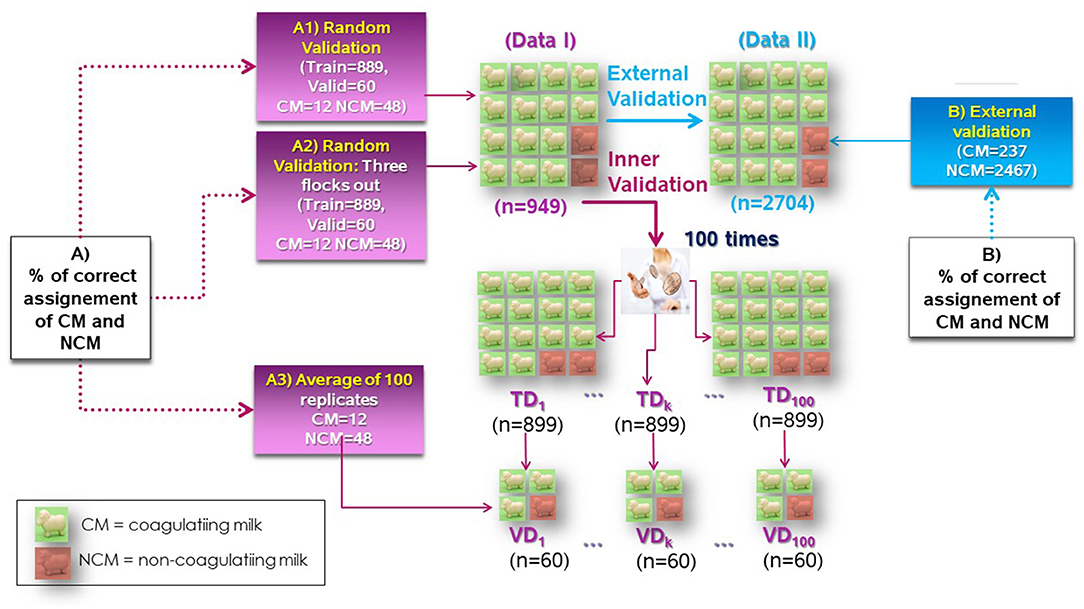
Figure 1. Scheme of four scenarios (A1, A2, A3, and B) for building the training dataset (TD) and the validation dataset (VD) for data I and data II.
To perform the genome-wide association study, a mixed linear animal model was fitted to a coagulation status (y) under the ssGBLUP approach (Legarra et al., 2009) according to:
The terms X, V, and Z are the incidence matrices relating phenotypic records to fixed (b) and uncorrelated random effects (f and u) where:
• b is the vector of fixed effects including the month of lambing (four levels), days in milk (five classes), and parity (eight levels);
• f is the vector of the random effect of the combination flock-test day of sampling (69 levels) ;
• u is the vector of the genomic breeding values (GEBV)
• e is the random term ;.
The variance components were estimated for the flock-test day (), additive genetic (), and residual () random variates under a BLUP animal model and pedigree-based relationship matrix (A). Whereas, the GWA was performed using the inverse of the H matrix (Aguilar et al., 2010):
where G−1 is the inverse of the genomic relationship matrix (769 × 769 animals), A−1 is the inverse of the pedigree relationship matrix (tracking back three generations and 5,031 animals), and is the inverse A for genotyped animals. The genomic relationship matrix was created according to Vanraden (2008), and to avoid singularity, G−1 was blended with 5% of (Vanraden, 2008). According to Wang et al. (2012), the GEBV were back-solved into SNP effects, and the additive genetic variance explained by each SNP was estimated, as also described by Cesarani et al. (2021). Mixed model solutions for GEBV and SNP were obtained using the BLUPF90 software and the post GSF90 software, respectively (Misztal et al., 2014). We decided to retain as suggestive of SNP-trait association signals exceeding the 99.9th percentile of ordered additive variance. There is neither a theoretical threshold for SNP-additive variance nor a guideline for the window size of adjacent SNPs (Aguilar et al., 2019). The proportion of additive variance, even if scarcely used, is well-suited to describe SNP-trait association (Aguilar et al., 2019), and to avoid any confusion with a well-known GWAS terminology, we used the term “suggestive,” which was preferred to “significant,” to declare the association.
QTLdb (https://www.animalgenome.org/cgi-bin/QTLdb/index) and genome browser (https://genome.ucsc.edu/) were used, respectively, for QTL and gene search. Genes in the neighbor of suggestive SNP (250 kb upstream and downstream from Peak SNPs) were retrieved. Then, Cytoscapever 3.9, integrated with the GeneMania tool, was used for gene network analysis (Warde-Farley et al., 2010) using humans as reference species also for downstream analysis. Gene Ontology (GO) weighting was set up as a biological process base. Functional enrichment analysis was carried out to determine GO categories that were displayed up to a Q-value cutoff of 0.1 based on the GeneMania network. Q-values were estimated using the Benjamini-Hochberg procedure from an FDR-corrected hypergeometric test for enrichment. The Kyoto Encyclopedia of Genes and Genomes (KEGG) database (http://www.genome.jp/kegg/pathway.html) was taken as a reference for pathway analysis. Most promising genes were discussed and compared with the finding on milk-trait association in the literature.
The percentage of NCM was nearly the same in data I and data II; about 9% of the individual milk samples failed to coagulate within 30 min after rennet addition (Table 1). The average profile of the milk spectra for CM and NCM is presented in Figure 2. A qualitative analysis of these differences highlighted the larger ones between 1,600 and 1,700 cm−1 (MWIR-2, max value at 1,643 cm−1) and between 3,070 and 3,450 cm−1 (SWIR-MWIR, max value at 3,246, 3,308, 3,358, and 3,416 cm−1). Moreover, in the region 1,000–1,200 cm−1, larger difference values at 1,034, 1,111, and 1,157 cm−1 were observed (Figure 2). Negative peak differences between NCM and CM were also observed at 1,480–1,608 cm−1 (maximum value at 1,546 cm−1) and at 1,743 cm−1. Constantly higher values for the CM than for the NMC samples (even if of lower magnitude) were observed from 1,778 to 2,800 cm−1, where milk spectra do not exhibit any peak. Finally, large negative values of difference between CM and NCM can be observed at 2,857 and 2,926 cm−1 (Figure 2).
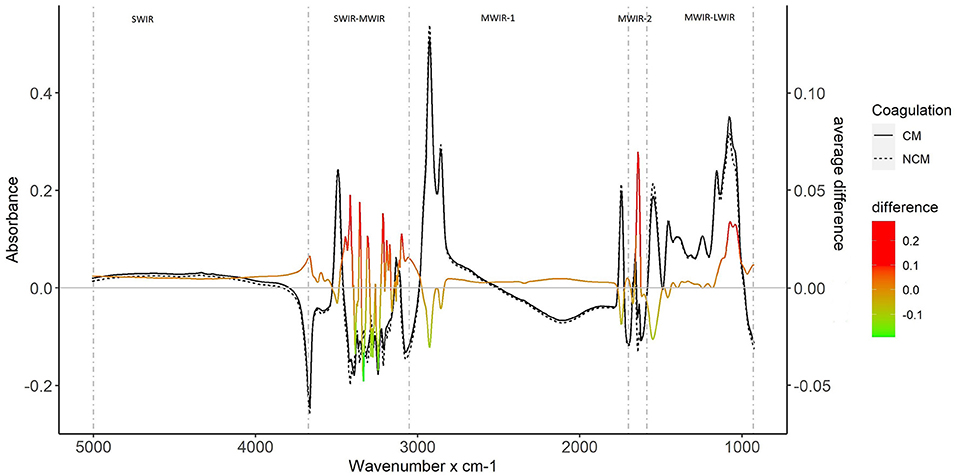
Figure 2. Average absorbance for coagulating milk (CM, solid line) and non-coagulating milk (NCM, dashed line) and average difference CM-NCM (green-red gradient line).
Two different prediction methods (LR and DA) and three validation scenarios were assessed for data I (A1, A2, and A3). In the training datasets, A1 and A2 yielded 47–90% and 98.7–99.9% of correctly assigned NCM and CM samples, respectively, across the prediction methods (Supplementary Table 3). Regardless of the validation scenarios considered, the predictive ability of logistic regression or canonical discriminant analysis was always assessed on 60 individuals: 12 NCM and 48 CM. The use of LR on raw spectral data (LR-W05 and LR-W01) gave poorer results for NCM (from 25 to 66.7% of true NCM correctly assigned; Figure 3 and Supplementary Table 4). The principal component analysis on milk spectra resulted in a total of 864 PCs. The first 200 PCs were used for explaining a large proportion of spectral variability (Supplementary Figure 1). The combination of LR and PC analysis (LR-PC05 and LR-PC01 settings) increased the classification power for detecting NCM samples (50–83.3% of correct assignments; Figure 3). The use of canonical DA (DA-W05 and DA-W01 settings) outperformed the logistic regression in both the A1 (67% of NCM correct assignment) and A2 scenarios (83%) with the exception of LR-PC01, which showed similar performance.
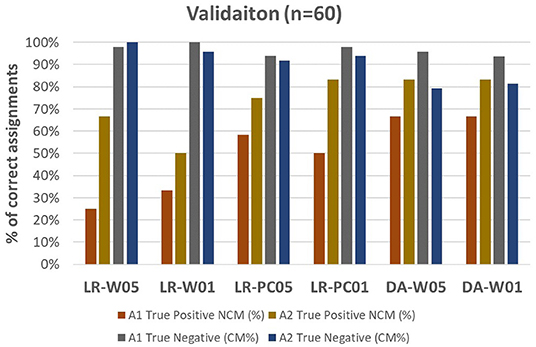
Figure 3. Correct assignment (on y-axis) of non-coagulating milk (NCM, %) and coagulating milk (CM, %) under the validation scenarios A1 (random) and A2 (random-3 flock out). On x-axis statistical methods: logistic regression of coagulation status on the step-wise selected (p-values 0.05 or 0.01), wave number (LR-W05, LR-W01), principal components (LR-PC05, LR-PC01), or canonical discriminant analysis (DA-W05, DAW01) of selected wave numbers.
The scenario A2 (3 flocks out for validation) always produced higher correct assignments of NCM. Large differences between A1 and A2 were observed (up to 41% in LW-W05) across the different statistical methods. These gaps were much smaller for the CM assignments. For these reasons, the most promising techniques, namely LR-PC05 and DA-W05, were the target in the A3 scenario where a cross-validation-like approach was adopted (Table 2). In the 100 simulated datasets, LR-PC05 reached 57 ± 3.8 and 45 ± 9.9% of correct NCM prediction in the training and validation datasets, respectively. The exclusion of the wave numbers associated with water absorbance (LR-PC05W1, LR-PC05W1, 2) worsened these performances. DA-W05 allowed to correctly predict 79.6 ± 2.6 and 75.1 ± 10.3% of NCM individual samples in training and validation, respectively, outperforming LR-PC05. Moreover, the use of DA narrowed the number of false negatives (i.e., milk samples erroneously assigned to be NCM) in the validation sets (5.6% vs. ~9–10% of LR-PC05; Table 2). The average number of selected predictors for the classification of NCM varied across methods and assessed scenarios (Table 3). However, a huge reduction in the number of predictors was produced by both the stepwise procedures (LR and DA).
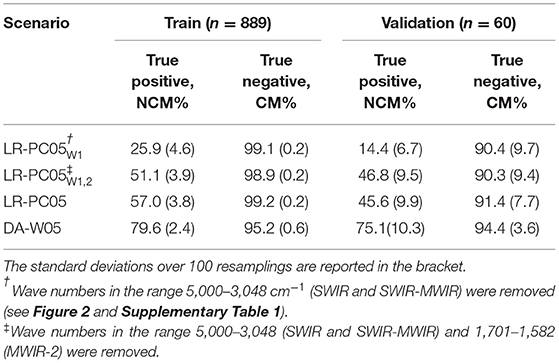
Table 2. Average % of correct assignment in data I (scenario A3) for non-coagulating milk (NCM, true positive) and coagulating milk (CM, true negative) samples.
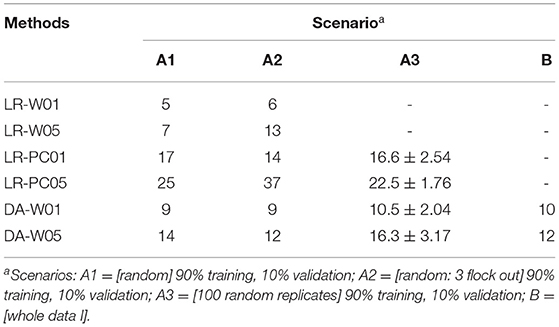
Table 3. The number of wave numbers or principal components selected for coagulation-status prediction for the 4 evaluated scenarios.
The inner validation procedure pointed out DA-W05 as the best-suited method for the classification of NCM. The stepwise discriminant procedure using data I selected 12 variables with the greatest discriminant power. The canonical DA derived one canonical variable (Can1) explaining 77% of the between- and within-group milk spectra absorbance (co)variance. The MANOVA showed highly significant F values (Wilks' lambda p < 0.001). The average values of Can1 were 2.48 and −0.27 for NCM and CM, respectively. The Malanohobis distance between the centroid of NCM and CM exhibited a value of 9.69 (p-value < 0.001). The Can1 scores clearly indicate a centroid separation for the two groups of coagulation (Figure 4). The raw coefficients derived from whole data I (Table 4) were used as weights in the discriminant function when data II spectral data were used as validation dataset. The results of the validation procedure (scenario B) are presented in Table 5. The validation was carried out by splitting data II into eight subsets (one for each DIM class of 30 d) with a nearly equal proportion of NCM across DIM. On average, 76.5 ± 18.5% of the samples were correctly assigned to the NCM class of coagulation (from 47 to 95%) with increasing prediction accuracy for higher DIM classes. In the scenario B compared to A3, an equivalent classification power was recorded for NCM, whereas a slight reduction in correctly assigned CM (91.7 vs. 94.4%) was observed.
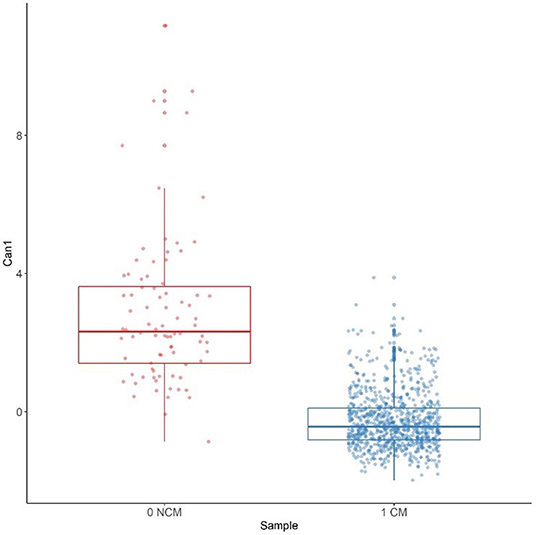
Figure 4. Box plots of canonical discriminant (Can1) scores for non-coagulating milk (NCM) and coagulating Milk (CM) in data I.
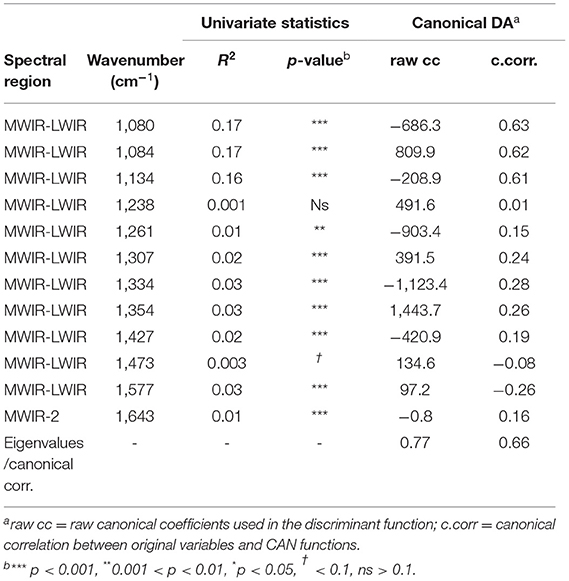
Table 4. Selected wave numbers by stepwise discriminant analysis (DA) in data I.
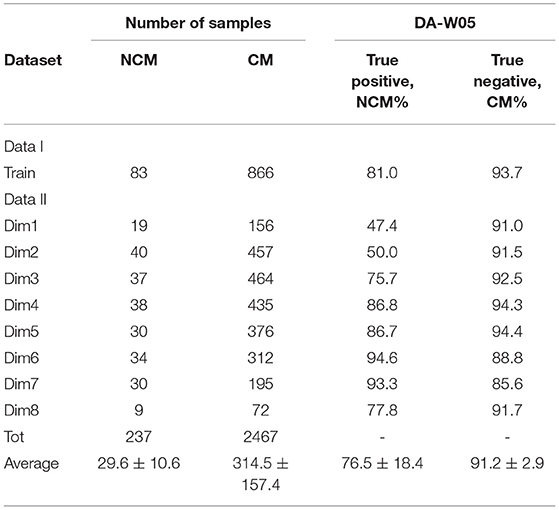
Table 5. Percentage (%) of correct assignments for NCM (true positive) and CM (true negative) samples by DA on data I as training data and data II as validation data (scenario B).
The Manhattan plot of additive variance associated with each SNP is presented in Figure 5. The GWA study on non-coagulation traits highlighted a total of 458 SNPs overcoming the 99.9th percentile of ordered additive SNP variances (Supplementary Table 5), and only 2 SNPs overcome the Bonferroni-corrected p-values: OAR3_170661659.1 (p = 4.48e-6) and s50822.1 (p = 9.69e-07) (Supplementary Figure 2). The 458 SNPs defined 40 genomic regions in 18/30 chromosomes. The signals of association trait-genotypes for failure-to-coagulate phenotypes were found in chromosomes 1, 2, 3, 4, 5, 6, 7, 8, 9, 10, 11, 14, 20, 21, 22, 23, 26, and X (Table 6). The five strongest signals were observed on OAR2 (s46218.1, .38% of additive variance), OAR14 (OAR14_48226980.1; .35%), OAR21 (s23338.1; .33%), OARX (s05480.1; .33%), and OAR2 (OAR2_122611468.1; .33%). In the genomic regions identified by tag markers, 260 genes were retrieved from a public database (Supplementary Table 6, https://genome.ucsc.edu/). In 17 genomic regions out of the 40 detected (SNP in italics in Table 6) were found 45 genes (Supplementary Table 7) involved in cellular function associated to dairy traits in ruminant species (e.g., milk ability, milk production and composition, udder health, and heat stress resistance) such as CHKA, CAPNS1, TCIRG1, PPIL3, ALKBH6, SPCS3, and LRRC41,CMPK1,SLC35A2. The analysis of gene networks based on the biological process function of the 45 detected genes showed over 77% of physical gene product interactions, 8% of gene co-expressions, and additional networks with lower relevant impact such as co-localization and shared protein domains; whereas, three genes (PPIL3, ZBTB7C, and NKAIN1) did not match with any of the network (Figure 6).
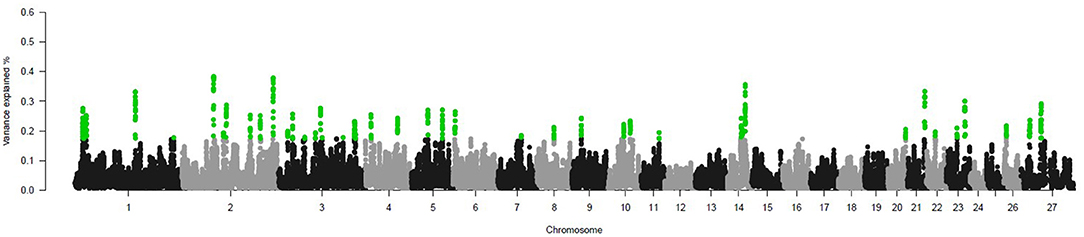
Figure 5. Single nucleotide polymorphism (SNP) variances in trait-genotype association in the 27 OAR chromosomes. Green dots are SNPs that exceeded the threshold of 99.9th percentile of ordered SNP additive variances.
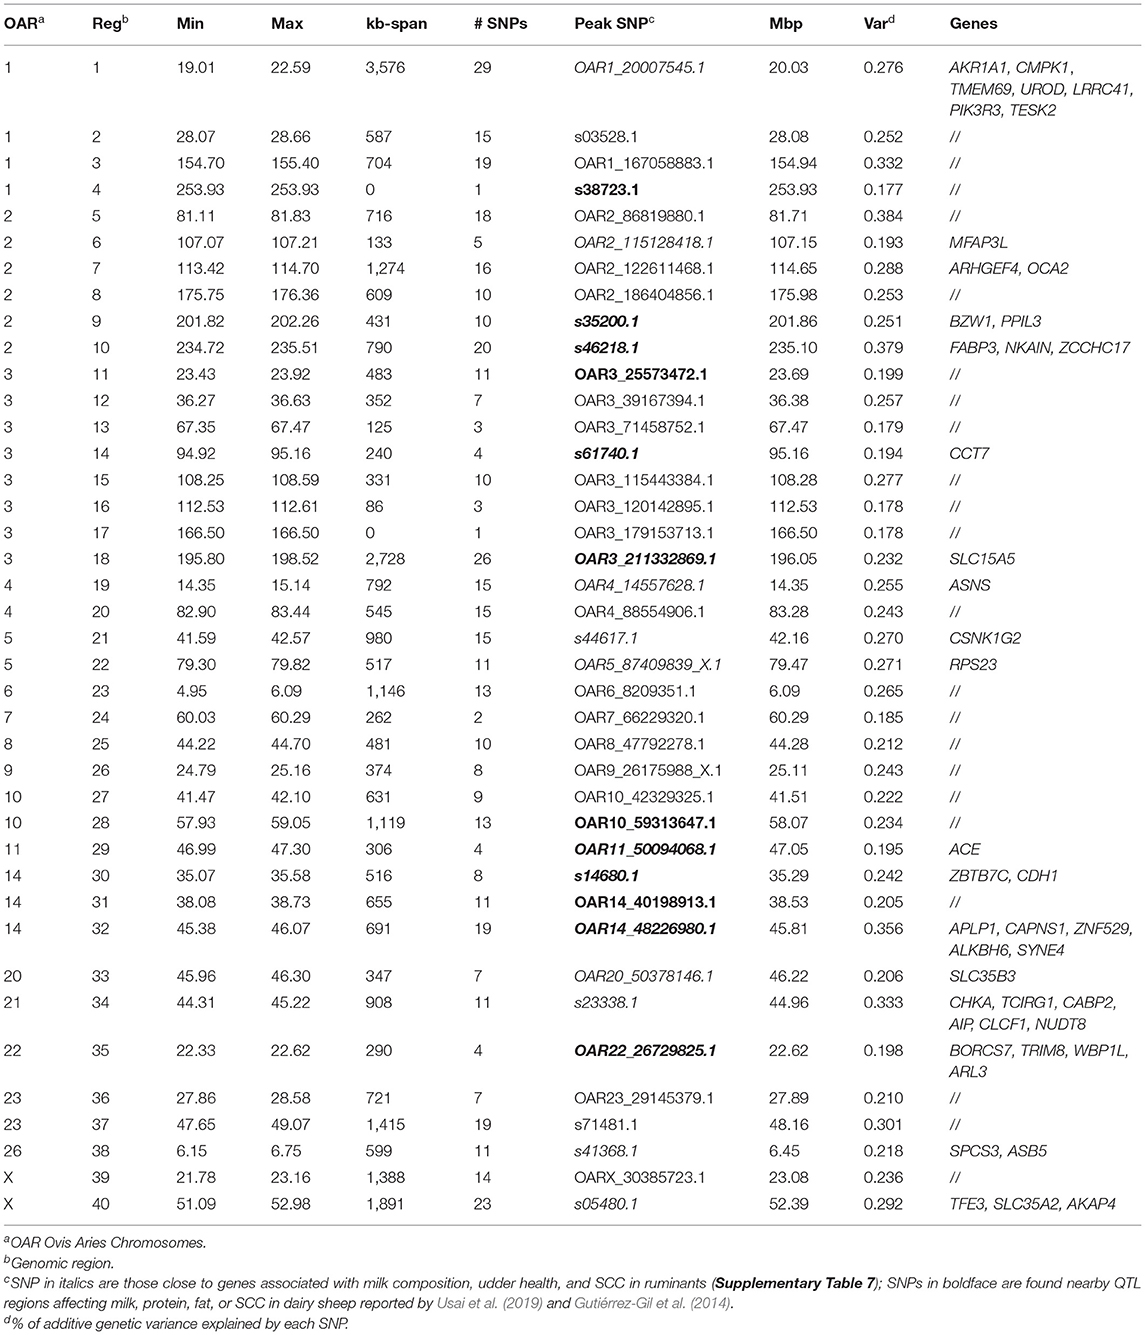
Table 6. Detail of the genome-wide association (GWA) study for NCM and retrieved genes.
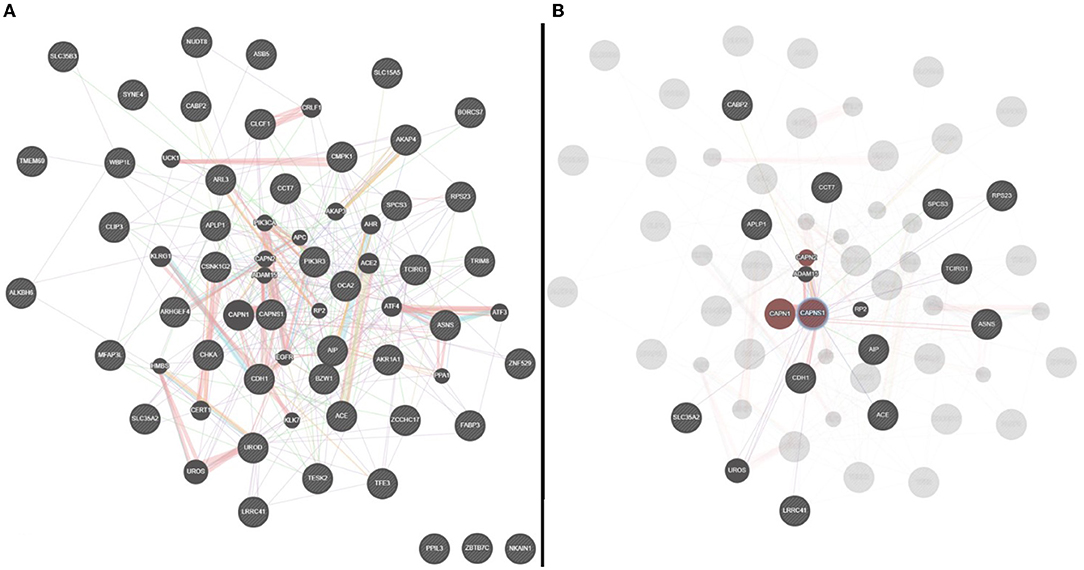
Figure 6. (A) Network analysis of genes with significant associations with milk coagulation properties of sheep milk; (B) detail of direct (dark red) and indirect (dark gray) CAPNS1 networks.
The presence of NCM has been reported in the literature for individual milk of the main ruminant species (Cecchinato et al., 2011; Gustavsson et al., 2014a; Manuelian et al., 2017; Figueroa et al., 2020). As far as sheep milk is concerned, 0.4–8.9% and 3.8% of NCM were detected in the Sarda and Alpine sheep breeds, respectively (Bittante et al., 2014; Pazzola et al., 2014; Manca et al., 2016), whereas a larger prevalence of NCM (17.7–19.4%) was observed in the Manchega sheep (Caballero-Villalobos et al., 2018; Garzon et al., 2021).
Most of the spectral regions with major CM-NCM differences have been related to milk compounds potentially affecting the coagulation process. Two spectral regions (from 1,600 to 1,700 cm−1 and from 3,070 to 3,450 cm−1) are characterized by high noise levels due to the absorption of water, and they are usually removed from the spectra when they are used for prediction purposes. The other CM-NCM differences were found in regions associated with the absorbance of chemical bonds of functional groups, which can be attributed to major milk compounds. One is the region from 1,000 to 1,200 cm−1 (Figure 2): absorptions at these wave numbers, in particular from 1,028 to 1,068 cm−1, were useful to predict lactose content in milk (Kaylegian et al., 2009). Indeed, signals at these wave numbers are often associated with absorption of the C–O bond of alcohols, ethers, and esters; specifically, signals near 1,160 cm−1 can be mainly attributable to the C–O bond of carbohydrate and ether groups (Coates, 2000). Another is the region from 1,480 to 1,608 cm−1. Wave numbers ranging from 1,480 to 1,613 cm−1 are used for the prediction of milk protein content (Etzion et al., 2004; Kaylegian et al., 2009), with signals between 1,500 and 1,700 cm−1 being usually associated with N–H bending of 1° and 2° amines and amides. Indeed, consistently, the difference observed at 1,546 cm−1, mirroring the peak observed at the same wave number in the milk spectra, could be related to the amidic (II°) N–H bond of proteins. The large negative difference observed at 1,743 cm−1 (Figure 2) can be associated with milk fat content. Indeed, the spectral region spanning from 1,650 to 1,800 cm−1 is characterized by stretching vibration of the carbonyl group C=O (in milk, C=O bond of the ester bond of triglycerides). Absorbances from 1,725 to 1,786 cm−1 or from 1,736 to 1,764 cm−1 (named Fat A) are used by MIR filter-based instruments to quantify milk fat content (Lynch et al., 2006; Kaylegian et al., 2009). Moreover, signals recorded in these spectral regions were associated with the absorption of calcium salts (Miliani et al., 2012; Monico et al., 2013), which play a relevant role in the milk calculation process (Stocco et al., 2021). The differences between CM and NCM observed at 2,857 and 2,926 cm−1 (negative values) can be associated with differences in fat concentration of the two groups of milk. Indeed, the intervals 2,778–2,870 cm−1 and 2,825–2,877 cm−1 (named Fat B) are used by MIR filter-based instruments to quantify milk fat content (Lynch et al., 2006; Kaylegian et al., 2009), with the two peaks at 2,853 and 2,922 cm−1 being related to asymmetric and symmetric stretching of methylenic C–H bonds, respectively.
Interestingly, the abovementioned spectral regions (except the two regions of water absorption, MWIR-2, and SWIR-MWIR) enclose the wave numbers selected by the stepwise DA (Table 4). These wave numbers were within the area MWIR-LWIR, which is known as the milk fingerprint because of the relevant information that it can provide on the chemical structure of the considered matter (Karoui et al., 2010). Some wave numbers correspond to those showing the largest differences CM-NCM, and were associated with the milk content of lactose and proteins (1,080–1,084, and 1,577, Supplementary Figure 3), confirming the importance of these milk components in the definition of milk coagulability (Joudu et al., 2008; Vacca et al., 2019). Others correspond to wave numbers showing no large differences CM-NCM, and have been associated with absorptions of different bonds, mainly, C–H, aromatic C=C, C–O, and N–O bonds (Karoui et al., 2010; Bittante and Cecchinato, 2013).
In our study, the utility of milk spectra as a proxy for detecting non-coagulating milk was greatly affected by the statistical methods and validation procedures adopted. Regardless of the statistical methods, large variability of results emerged between validation scenarios. The sampling effect for the two different validation scenarios (A1 and A2) was not negligible; hence, their application should be carefully evaluated. The use of the resampling approach (A3) to cross-validate the percentage of correctly imputed NCM was effective in deriving prediction probability for the NCM and CM samples in these studies as well as for validating the prediction equation for MCP (Cellesi et al., 2019). The use of spectral data I to train the equation to predict the coagulation records in data II (scenario B) confirmed the NCM (CM) assignments of scenario A3. This indicated that, although on average 25% of the samples were misclassified among the true NCM (and 10% among the true CM), there is room for improvements (from 47 to 94% according to DIM classes, Table 5). The application of different statistical techniques, such as PLS-DA, did not outperform the methods tested here, at least on sheep bulk milk (Manuelian et al., 2019). This could be explained by the fact that coagulation groups may not be linearly separable by means of spectral data. If this should be the case, an advanced machine learning approach could possibly address this issue (Chen et al., 2007).
Looking at deepening the statistical models, the use of logistic regression on selected spectral absorbances (LR-W settings) produced very poor predictions. This result was quite expected because of the multidimensional features of spectral data (De Marchi et al., 2014) and the complex relationship among milk compounds, environment, and MCP (Bittante et al., 2012). The stepwise variable selection adopted here was not able to correctly forecast the NCM samples, whereas the ability of the same technique to correctly identify CM was extremely good (>99 and >97% in training and validation datasets, respectively, see Supplementary Tables 3, 4). Specificity values much larger than the sensitivity ones (i.e., in our case the greater ability to assign CM rather NCM samples to the correct class) were also observed, addressing the same prediction problem on bulk milk of sheep (Manuelian et al., 2019) and individual buffalo milk (Manuelian et al., 2017). This bias can be due to the combination of the low prevalence of NC samples and the complexity of the trait to be forecasted by mid-IR spectra information.
The combination of logistic regression and PC analysis of spectral data (LR-PC settings) increased the classification power for NCM when compared to LR-W settings (up to 83% of correct assignments). In the literature, the use of PC of metabolomics profiles is demonstrated as a useful tool to discriminate between well and poor coagulating samples of cow milk even if the mass spectrometry output did not allow to detect specific metabolites associated with the coagulation process (Harzia et al., 2012). Regression techniques, such as PLS, are routinely used to predict milk components but, applied to RCT, showed moderate prediction performances in cow milk (r2 in validation of 57%; Ferragina et al., 2017) and sheep milk (r2 = 59%; Cellesi et al., 2019). More advanced non-linear-Bayesian regression methods reached higher precision for predicting RCT (r2 = 82%; Ferragina et al., 2015). In our research, the trait analyzed was based on RCT values but on a binary scale. Even though direct comparison of binary outcome vs. RCT is to be carefully evaluated, the range of prediction performances is compatible in terms of magnitude. Unexpectedly, the exclusion of wave numbers 5,000–3,048 cm−1 and 1,701–1,582 cm−1 worsened the percentage of correct assignments of NCM. This was probably due to the difference in absorbance observed between the two groups of milk exactly in the regions that we kept but should have been removed (Figure 2).
The application of DA-W outperformed the LR-PC method as far as the number of correct NCM samples is concerned. In the literature, the use of DA to forecast NCM individual samples of Manchega sheep produced true positives of similar magnitude to ours: higher assignations (71.7%) were obtained using classical milk composition traits (milk solids, pH, and SCS) and lower ones when based on colorimetry data (65.5%; Figueroa et al., 2020). Moreover, the application of PLS-DA on milk spectra for predicting three classes of coagulation bulk milk (early, mid, and late) reached a specificity of 30 and 20% for early and late coagulating milk, respectively, whereas a very good performance was obtained for the mid coagulating sample (91.5%; Manuelian et al., 2019). The differences observed between theirs and our results could be ascribed to the use of bulk milk instead of individual samples, different training to validation ratios, exclusion of some wave numbers, and statistical methods used.
The use of DA clearly indicates a centroid separation for the two groups of coagulation. However, a “gray” zone of overlapping coefficients could be observed (Figure 4). The most discriminant wave numbers were those mentioned in Section Coagulating, Non-Coagulating Milk, and Spectral Data Interpretation. The discriminant power of milk spectra for coagulation time was assessed on individual buffalo milk samples through canonical DA, reaching the conclusion that sole FTIR spectra do not provide accurate prediction, especially for late coagulating milk (Manuelian et al., 2019). Despite the percentage of correctly imputed NCM being higher than that in the cited study, the usefulness of our prediction is still limited. Moreover, across DIM, variation of correct NCM assignments has been observed in this study. The effect of the lactation stage on MCP was assessed in the literature on dairy cattle (Tyriseva et al., 2004; Macciotta et al., 2012) and sheep (Manca et al., 2016; Garzon et al., 2021) even if with different signs. The effect of DIM on milk FTIR spectra is detectable for some previously discussed wave numbers (Supplementary Figure 4).
The GWA study on the binary trait of NCM highlighted a large number of SNPs potentially involved in the failure of the coagulation process. No GWA reports for NCM were found in the literature for dairy sheep for comparison purposes. Recently, Duchemin et al. (2016) conducted a GWAS on NCM in Swedish Red cattle by genomics mixed model analysis. These authors found 14 strong signals on bovine chromosome 18, and after imputation at the sequence level, they suggested six candidate genes associated with NCM. However, none of these variants were detected in this study.
Among the 40 genomic regions (Table 6 and Supplementary Table 5), none overlapped those detected by GWAS on MCPs and milk traits in the Assaf and Churra sheep breeds (Marina et al., 2021). Possible reasons for the different results can be due to different trait definitions, within-breed linkage disequilibrium, and differences in allele frequency among breeds (Cesarani et al., 2019b; Marina et al., 2021). Indeed, the same authors were not able to find associated SNPs common between the two Spanish breeds, but possible pleiotropic effects were hypothesized as a plausible explanation (Marina et al., 2021). Regarding possible pleiotropic effects, it is interesting to signal that several SNPs found in this research are compatible with the confidence interval of QTL regions previously associated to milk composition traits in the Sarda breed (Usai et al., 2019). In detail, markers in boldface in Table 6, s38723.1 (OAR1), OAR3-25573472.1, s61740.1, OAR3-211332869.1 (OAR3), OAR11-50094068.1 (OAR11), and OAR22_26729825.1 (OAR22) fall in the confidence interval of the significant association for protein contents; s14680.1, OAR14-40198913.1, and OAR14-48226980.1 (OAR14) were related to fat content and OAR10-59313647.1 (OAR10) to milk, fat, and protein yield and contents (Usai et al., 2019). Furthermore, three markers (s35200.1, s46218.1, and s61740.1) fall in the confidence regions of the three outlier signals in a genome-wide differentiation study based on Ovine HapMap Projets datasets. These genomic regions included QTLs affecting milk lactose and somatic cell count also in the cattle genome (Gutiérrez-Gil et al., 2014).
The gene discovery on GWAS results allowed to prioritize a set of genes previously associated with milk- or cheese-related traits in dairy ruminants, such as those affecting somatic cell count (CHKA, TCIRG1, PPIL3 and SYNE4), mastitis (ALKBH6, SPCS3, and LRRC41), either overexpressed in the mammary gland in different lactation stage (CMPK1) or in different milk ability groups (ZCCHC17) and involved in lactose synthesis (SLC35A2; Bonnefont et al., 2011; Dhorne-Pollet et al., 2012; Capoferri et al., 2021; Ghahramani et al., 2021; Michailidou et al., 2021; Sadovnikova et al., 2021). Many other retrieved genes, e.g., CAPNS1, FABP3, and BORCS7, have been previously associated with milk fat and/or composition in sheep milk (Calvo et al., 2004; Palombo et al., 2018; Di Gerlando et al., 2019) (Supplementary Table 7).
The functional enrichment analysis identified 10 categories, among which only calcium-dependent cysteine-type endopeptidase activity (GO:0004198) denoted a biological meaning for this study. Limiting the network analysis to this category, we found CAPNS1 (significant association on OAR 14) and two strictly related genes (CAPN1 and CAPN2) of the same calpain small subunit family (Figure 6A). In particular, three genes (CAPNS1, CAPN1, and CAPN2) encode calcium-dependent cysteine proteinases, which are widely distributed in mammalian cells and are implicated in various biological processes, including cell migration, cell cycle control, and apoptosis (Franco and Huttenlocher, 2005). More than 100 proteins have been shown to be CAPN targets in vitro. Regardless of the wide spectrum of substrates, CAPN-mediated protein cleavage is rather specific and occurs at a limited number of sites (Franco and Huttenlocher, 2005). Therefore, under physiological conditions, CAPNs most probably regulate proteins' biological functions rather than protein degradation per se (Tompa et al., 2004). For instance, in the udder, calpains mediate post-lactation size reduction when a decrease in milk macronutrient synthesis, loss of secretory epithelial cells, and collapse of alveolar structures happen and extensive tissue remodeling (Arnandis et al., 2012). However, cysteine proteinases are also involved in milk clotting. In fact, although no studies have been reported so far on the direct physiological role of mammalian cysteine proteinases in milk coagulation, those of plant origin (for instance papain, bromelain, ficin, calotropins, etc.) have been widely used in dairy processing instead of the conventional chymosin (Uniacke-Lowe and Fox, 2017). Therefore, the potential involvement of CAPNs could not be excluded when milk pH, calcium concentration, and titratable acid allow for their coagulation action. In addition, recently, the CNV region involving CAPNS1 has been associated with dairy traits in Valle del Belice sheep (Di Gerlando et al., 2019), thus consolidating our findings.
Further analysis of the first indirect network (Figure 6B) highlighted 12 other genes with significant associations (ASNS, CDH1, AIP, CABP2, LRRC41, ACE, TCIRG1, SPCS3, CCT7, APLP1, RPS23, and SLC35A2). TCIRG1 and APLP1 resulted to be particularly relevant. The first was already found in significant KEGG pathways for protein yield in Polish Holstein dairy cattle (Suchocki et al., 2016), and indicated in the lysosome pathway of a differential gene expressed between resistant and susceptible sheep to mastitis (Bonnefont et al., 2011). The latter belongs to the same CNV region of CAPNS in Valle del Belice sheep, and it has been associated with fat yield (Di Gerlando et al., 2019).
In conclusion, this study confirms the non-negligible prevalence of NCM in Sarda sheep milk. The spectral profile comparison (NCM vs. CM) allows the detection of major differences related to the absorbance of milk compounds potentially involved in the coagulation process. Interestingly, the abovementioned spectral regions enclose the wave numbers selected by the stepwise DA corresponding to the milk contents of lactose and proteins. In this study, the predictivity of milk spectra for detecting NCM was partially satisfactory and greatly affected by the statistical methods and validation procedures. The application of the canonical DA analysis outperformed the logistic regression methods. In the best-case scenario, on average, 25% of wrong NCM assignments were still recorded. Finally, the GWAS on the binary response variable (coagulation vs. non-coagulation) highlighted 458 SNPs and 45 genes potentially associated with this trait. The genes retrieved from public databases were mostly linked to mammary gland metabolism, udder health status, and milk compound known also to affect the ability of milk to coagulate. In particular, the potential involvement of CAPNs could not be excluded.
The original contributions presented in the study are included in the article/Supplementary Material, further inquiries can be directed to the corresponding author.
Ethical review and approval was not required for the animal study because this study did not require an ethical approval since milk samples were collected from ewes during the routinely milk recordings performed by breeder association personnel. Written informed consent for participation was not obtained from the owners because milk samples were collected from ewes during the routinely milk recordings performed by breeder association personnel.
GG and FC: conceptualization and first drafting. FC: laboratory analysis. FC, GG, and AC: data curation. GG, AC, MC, and AP: statistical and bioinformatics analyses. GG, FC, AC, CD, AP, and NM: text review and editing. GG and NM: supervision. NM: funding acquisition. All authors have read and agreed to the final version of the manuscript.
This research was supported by the Regional Government of Sardinia (Grant No: CRP 61608 Il latte OvinodellaSardegna). GG received financial support from MIUR ex60% (GAS_RILO_19_01) of the University of Torino, Italy.
The authors declare that the research was conducted in the absence of any commercial or financial relationships that could be construed as a potential conflict of interest.
All claims expressed in this article are solely those of the authors and do not necessarily represent those of their affiliated organizations, or those of the publisher, the editors and the reviewers. Any product that may be evaluated in this article, or claim that may be made by its manufacturer, is not guaranteed or endorsed by the publisher.
The authors thank the Italian Associations of Animal Breeders (AIA) and of Sheep Breeders (ASSONAPA) for providing pedigree information.
The Supplementary Material for this article can be found online at: https://www.frontiersin.org/articles/10.3389/fanim.2022.889797/full#supplementary-material
Aguilar, I., Legarra, A., Cardoso, F., Masuda, Y., Lourenco, D., and Misztal, I. (2019). Frequentist p-values for large-scale-single step genome-wide association, with an application to birth weight in American Angus cattle. Genet. Select. Evol. 51:3. doi: 10.1186/s12711-019-0469-3
Aguilar, I., Misztal, I., Johnson, D. L., Legarra, A., Tsuruta, S., and Lawlor, T. J. (2010). Hot topic: a unified approach to utilize phenotypic, full pedigree, and genomic information for genetic evaluation of Holstein final score. J. Dairy Sci. 93, 743–752. doi: 10.3168/jds.2009-2730
Arnandis, T., Ferrer-Vicens, I., Garcia-Trevijano, E. R., Miralles, V. J., Garcia, C., Torres, L., et al. (2012). Calpains mediate epithelial-cell death during mammary gland involution: mitochondria and lysosomal destabilization. Cell Death Differ. 19, 1536–1548. doi: 10.1038/cdd.2012.46
Bell, M. J., and Tzimiropoulos, G. (2018). Novel monitoring systems to obtain dairy cattle phenotypes associated with sustainable production. Front. Sustain. Food Syst. 2:31. doi: 10.3389/fsufs.2018.00031
Bittante, G., and Cecchinato, A. (2013). Genetic analysis of the Fourier-transform infrared spectra of bovine milk with emphasis on individual wavelengths related to specific chemical bonds. J. Dairy Sci. 96, 5991–6006. doi: 10.3168/jds.2013-6583
Bittante, G., Cipolat-Gotet, C., Pazzola, M., Dettori, M. L., Vacca, G. M., and Cecchinato, A. (2017). Genetic analysis of coagulation properties, curd firming modeling, milk yield, composition, and acidity in Sarda dairy sheep. J. Dairy Sci. 100, 385–394. doi: 10.3168/jds.2016-11212
Bittante, G., Pellattiero, E., Malchiodi, F., Cipolat-Gotet, C., Pazzola, M., Vacca, G. M., et al. (2014). Quality traits and modeling of coagulation, curd firming, and syneresis of sheep milk of Alpine breeds fed diets supplemented with rumen-protected conjugated fatty acid. J. Dairy Sci. 97, 4018–4028. doi: 10.3168/jds.2013-7345
Bittante, G., Penasa, M., and Cecchinato, A. (2012). Invited review: genetics and modeling of milk coagulation properties. J. Dairy Sci. 95, 6843–6870. doi: 10.3168/jds.2012-5507
Bonnefont, C. M., Toufeer, M., Caubet, C., Foulon, E., Tasca, C., Aurel, M. R., et al. (2011). Transcriptomic analysis of milk somatic cells in mastitis resistant and susceptible sheep upon challenge with Staphylococcus epidermidis and Staphylococcus aureus. BMC Genom. 12:208. doi: 10.1186/1471-2164-12-208
Bresolin, T., and Dorea, J. R. R. (2020). Infrared spectrometry as a high-throughput phenotyping technology to predict complex traits in livestock systems. Front. Genet. 11:923. doi: 10.3389/fgene.2020.00923
Caballero-Villalobos, J., Perea, J. M., Angon, E., Arias, R., and Garzon, A. (2018). Coagulation efficiency and its determinant factors: a case study for Manchega ewe milk in the region of Castilla-La Mancha, Spain. J. Dairy Sci. 101, 3878–3886. doi: 10.3168/jds.2017-13816
Calvo, J. H., Marcos, S., Jurado, J. J., and Serrano, M. (2004). Association of the heart fatty acid-binding protein (FABP3) gene with milk traits in Manchega breed sheep. Anim. Genet. 35, 347–349. doi: 10.1111/j.1365-2052.2004.01169.x
Capoferri, R., Cremonesi, P., Castiglioni, B., Pisoni, G., Roccabianca, P., Riva, F., et al. (2021). Comparison of the response of mammary gland tissue from two divergent lines of goat with high and low milk somatic cell scores to an experimental Staphylococcus aureus infection. Vet. Immunol. Immunopathol. 234:110208. doi: 10.1016/j.vetimm.2021.110208
Carta, A., Casu, S., and Salaris, S. (2009). Invited review: current state of genetic improvement in dairy sheep. J. Dairy Sci. 92, 5814–5833. doi: 10.3168/jds.2009-2479
Cecchinato, A., and Carnier, P. (2011). Short communication: statistical models for the analysis of coagulation traits using coagulating and noncoagulating milk information. J. Dairy Sci. 94, 4214–4219. doi: 10.3168/jds.2010-3911
Cecchinato, A., De Marchi, M., Gallo, L., Bittante, G., and Carnier, P. (2009). Mid-infrared spectroscopy predictions as indicator traits in breeding programs for enhanced coagulation properties of milk. J. Dairy Sci. 92, 5304–5313. doi: 10.3168/jds.2009-2246
Cecchinato, A., Penasa, M., De Marchi, M., Gallo, L., Bittante, G., and Carnier, P. (2011). Genetic parameters of coagulation properties, milk yield, quality, and acidity estimated using coagulating and noncoagulating milk information in Brown Swiss and Holstein-Friesian cows. J. Dairy Sci. 94, 4205–4213. doi: 10.3168/jds.2010-3913
Cellesi, M., Correddu, F., Manca, M. G., Serdino, J., Gaspa, G., Dimauro, C., et al. (2019). Prediction of milk coagulation properties and individual cheese yield in sheep using partial least squares regression. Animals 9:90663. doi: 10.3390/ani9090663
Cesarani, A., Garcia, A., Hidalgo, J., Degano, L., Vicario, D., Macciotta, N. P. P., et al. (2021). Genomic information allows for more accurate breeding values for milkability in dual-purpose Italian Simmental cattle. J. Dairy Sci. 104, 5719–5727. doi: 10.3168/jds.2020-19838
Cesarani, A., Gaspa, G., Correddu, F., Cellesi, M., Dimauro, C., and Macciotta, N. P. P. (2019a). Genomic selection of milk fatty acid composition in Sarda dairy sheep: effect of different phenotypes and relationship matrices on heritability and breeding value accuracy. J. Dairy Sci. 102, 3189–3203. doi: 10.3168/jds.2018-15333
Cesarani, A., Sechi, T., Gaspa, G., Usai, M. G., Sorbolini, S., Macciotta, N. P. P., et al. (2019b). Investigation of genetic diversity and selection signatures between Sarda and Sardinian Ancestral black, two related sheep breeds with evident morphological differences. Small Ruminant Res. 177, 68–75. doi: 10.1016/j.smallrumres.2019.06.014
Chen, Q. S., Zhao, J. W., Fang, C. H., and Wang, D. M. (2007). Feasibility study on identification of green, black and Oolong teas using near-infrared reflectance spectroscopy based on support vector machine (SVM). Spectrochimica Acta A 66, 568–574. doi: 10.1016/j.saa.2006.03.038
Coates, J. (2000). “Interpretation of infrared spectra, a practical approach,” in Encyclopedia of Analytical Chemistry, ed R. A. Meyers (Chichester: John Wiley and Sons Ltd.).
Correddu, F. G., and Macciotta, G. (2021). “Noncoagulating sheep milk characterization through fourier-transform ir spectroscopy,” in ASPA 24th Congress Book of Abstract, Italian Journal of Animal Science (Padova), 20. doi: 10.1080/1828051X.2021.1968170
Dadousis, C., Biffani, S., Cipolat-Gotet, C., Nicolazzi, E. L., Rossoni, A., Santus, E., et al. (2016). Genome-wide association of coagulation properties, curd firmness modeling, protein percentage, and acidity in milk from Brown Swiss cows. J. Dairy Sci. 99, 3654–3666. doi: 10.3168/jds.2015-10078
De Marchi, M., Bittante, G., Dal Zotto, R., Dalvit, C., and Cassandro, M. (2008). Effect of Holstein Friesian and Brown Swiss breeds on quality of milk and cheese. J. Dairy Sci. 91, 4092–4102. doi: 10.3168/jds.2007-0788
De Marchi, M., Toffanin, V., Cassandro, M., and Penasa, M. (2014). Invited review: mid-infrared spectroscopy as phenotyping tool for milk traits. J. Dairy Sci. 97, 1171–1186. doi: 10.3168/jds.2013-6799
Dhorne-Pollet, S., Robert-Granie, C., Aurel, M. R., and Marie-Etancelin, C. (2012). A functional genomic approach to the study of the milking ability in dairy sheep. Anim. Genet. 43, 199–209. doi: 10.1111/j.1365-2052.2011.02237.x
Di Gerlando, R., Sutera, A. M., Mastrangelo, S., Tolone, M., Portolano, B., Sottile, G., et al. (2019). Genome-wide association study between CNVs and milk production traits in Valle del Belice sheep. PLoS ONE 14:215204. doi: 10.1371/journal.pone.0215204
Dimauro, C., Cellesi, M., Gaspa, G., Ajmone-Marsan, P., Steri, R., Marras, G., et al. (2013). Use of partial least squares regression to impute SNP genotypes in Italian Cattle breeds. Genet. Select. Evol. 45:15. doi: 10.1186/1297-9686-45-15
Duchemin, S. I., Glantz, M., De Koning, D. J., Paulsson, M., and Fikse, W. F. (2016). Identification of QTL on chromosome 18 associated with non-coagulating milk in Swedish Red Cows. Front. Genet. 7:57. doi: 10.3389/fgene.2016.00057
Etzion, Y., Linker, R., Cogan, U., and Shmulevich, I. (2004). Determination of protein concentration in raw milk by mid-infrared Fourier transform infrared/attenuated total reflectance spectroscopy. J. Dairy Sci. 87, 2779–2788. doi: 10.3168/jds.S0022-0302(04)73405-0
Fawcett, T. (2006). An introduction to ROC analysis. Pattern Recogn. Lett. 27, 861–874. doi: 10.1016/j.patrec.2005.10.010
Ferragina, A., Cipolat-Gotet, C., Cecchinato, A., Pazzola, M., Dettori, M. L., Vacca, G. M., et al. (2017). Prediction and repeatability of milk coagulation properties and curd-firming modeling parameters of ovine milk using Fourier-transform infrared spectroscopy and Bayesian models. J. Dairy Sci. 100, 3526–3538. doi: 10.3168/jds.2016-12226
Ferragina, A., De Los Campos, G., Vazquez, A. I., Cecchinato, A., and Bittante, G. (2015). Bayesian regression models outperform partial least squares methods for predicting milk components and technological properties using infrared spectral data. J. Dairy Sci. 98, 8133–8151. doi: 10.3168/jds.2014-9143
Figueroa, A., Caballero-Villalobos, J., Angon, E., Arias, R., Garzon, A., and Perea, J. M. (2020). Using multivariate analysis to explore the relationships between color, composition, hygienic quality, and coagulation of milk from Manchega sheep. J. Dairy Sci. 103, 4951–4957. doi: 10.3168/jds.2019-17201
Franco, S. J., and Huttenlocher, A. (2005). Regulating cell migration: calpains make the cut. J. Cell Sci. 118, 3829–3838. doi: 10.1242/jcs.02562
Garzon, A., Figueroa, A., Caballero-Villalobos, J., Angon, E., Arias, R., and Perea, J. M. (2021). Derivation of multivariate indices of milk composition, coagulation properties, and curd yield in Manchega dairy sheep. J. Dairy Sci. 104, 8618–8629. doi: 10.3168/jds.2021-20303
Ghahramani, N., Shodja, J., Rafat, S. A., Panahi, B., and Hasanpur, K. (2021). Integrative systems biology analysis elucidates mastitis disease underlying functional modules in dairy cattle. Front. Genet. 12:712306. doi: 10.3389/fgene.2021.712306
Gustavsson, F., Buitenhuis, A. J., Johansson, M., Bertelsen, H. P., Glantz, M., Poulsen, N. A., et al. (2014a). Effects of breed and casein genetic variants on protein profile in milk from Swedish Red, Danish Holstein, and Danish Jersey cows. J. Dairy Sci. 97, 3866–3877. doi: 10.3168/jds.2013-7312
Gustavsson, F., Glantz, M., Poulsen, N. A., Wadso, L., Stalhammar, H., Andren, A., et al. (2014b). Genetic parameters for rennet- and acid-induced coagulation properties in milk from Swedish Red dairy cows. J. Dairy Sci. 97, 5219–5229. doi: 10.3168/jds.2014-7996
Gutiérrez-Gil, B., Arranz, J. J., Pong-Wong, R., García-Gámez, E., Kijas, J., and Wiener, P. (2014). Application of selection mapping to identify genomic regions associated with dairy production in sheep. PLoS ONE 9:e94623. doi: 10.1371/journal.pone.0094623
Harzia, H., Kilk, K., Joudu, I., Henno, M., Kart, O., and Soomets, U. (2012). Comparison of the metabolic profiles of noncoagulating and coagulating bovine milk. J. Dairy Sci. 95, 533–540. doi: 10.3168/jds.2011-4468
Joudu, I., Henno, M., Kaart, T., Pussa, T., and Kart, O. (2008). The effect of milk protein contents on the rennet coagulation properties of milk from individual dairy cows. Int. Dairy J. 18, 964–967. doi: 10.1016/j.idairyj.2008.02.002
Karoui, R., Downey, G., and Blecker, C. (2010). Mid-infrared spectroscopy coupled with chemometrics: a tool for the analysis of intact food systems and the exploration of their molecular structure-quality relationships - a review. Chem. Rev. 110, 6144–6168. doi: 10.1021/cr100090k
Kaylegian, K. E., Lynch, J. M., Fleming, J. R., and Barbano, D. M. (2009). Influence of fatty acid chain length and unsaturation on mid-infrared milk analysis. J. Dairy Sci. 92, 2485–2501. doi: 10.3168/jds.2008-1910
Legarra, A., Aguilar, I., and Misztal, I. (2009). A relationship matrix including full pedigree and genomic information. J. Dairy Sci. 92, 4656–4663. doi: 10.3168/jds.2009-2061
Lynch, J. M., Barbano, D. M., Schweisthal, M., and Fleming, J. R. (2006). Precalibration evaluation procedures for mid-infrared milk analyzers. J. Dairy Sci. 89, 2761–2774. doi: 10.3168/jds.S0022-0302(06)72353-0
Macciotta, N. P. P., Cecchinato, A., Mele, M., and Bittante, G. (2012). Use of multivariate factor analysis to define new indicator variables for milk composition and coagulation properties in Brown Swiss cows. J. Dairy Sci. 95, 7346–7354. doi: 10.3168/jds.2012-5546
Manca, E., Cesarani, A., Falchi, L., Atzori, A. S., Gaspa, G., Rossoni, A., et al. (2021). Genome-wide association study for residual concentrate intake using different approaches in Italian Brown Swiss. Ital. J. Anim. Sci. 20, 1957–1967. doi: 10.1080/1828051X.2021.1963864
Manca, M. G., Serdino, J., Gaspa, G., Urgeghe, P., Ibba, I., Contu, M., et al. (2016). Derivation of multivariate indices of milk composition, coagulation properties, and individual cheese yield in dairy sheep. J. Dairy Sci. 99, 4547–4557. doi: 10.3168/jds.2015-10589
Manuelian, C. L., Boselli, C., Vigolo, V., Giangolini, G., and De Marchi, M. (2020). Effects of animal vs. vegetal rennet on milk coagulation traits in Mediterranean buffalo bulk milk. J. Dairy Sci. 103, 4958–4964. doi: 10.3168/jds.2019-17208
Manuelian, C. L., Penasa, M., Giangolini, G., Boselli, C., Curro, S., and De Marchi, M. (2019). Short communication: Fourier-transform mid-infrared spectroscopy to predict coagulation and acidity traits of sheep bulk milk. J. Dairy Sci. 102, 1927–1932. doi: 10.3168/jds.2018-15259
Manuelian, C. L., Visentin, G., Boselli, C., Giangolini, G., Cassandro, M., and De Marchi, M. (2017). Short communication: prediction of milk coagulation and acidity traits in Mediterranean buffalo milk using Fourier-transform mid-infrared spectroscopy. J. Dairy Sci. 100, 7083–7087. doi: 10.3168/jds.2017-12707
Marina, H., Pelayo, R., Suarez-Vega, A., Gutierrez-Gil, B., Esteban-Blanco, C., and Arranz, J. J. (2021). Genome-wide association studies (GWAS) and post-GWAS analyses for technological traits in Assaf and Churra dairy breeds. J. Dairy Sci. 104, 11850–11866. doi: 10.3168/jds.2021-20510
Marina, H., Reverter, A., Gutiérrez-Gil, B., Alexandre, P. A., Porto-Neto, L. R., Suárez-Vega, A., et al. (2020). Gene networks driving genetic variation in milk and cheese-making traits of Spanish Assaf sheep. Genes 11:715. doi: 10.3390/genes11070715
Michailidou, S., Gelasakis, A., Banos, G., Arsenos, G., and Argiriou, A. (2021). Comparative transcriptome analysis of milk somatic cells during lactation between two intensively reared dairy sheep breeds. Front. Genet. 12:700489. doi: 10.3389/fgene.2021.700489
Miliani, C., Rosi, F., Daveri, A., and Brunetti, B. G. (2012). Reflection infrared spectroscopy for the non-invasive in situ study of artists' pigments. Appl. Phys. 106, 295–307. doi: 10.1007/s00339-011-6708-2
Misztal, I., Tsuruta, S., Lourenco, D. A. L., Masuda, Y., Aguilar, I., Legarra, A., et al. (2014). Manual for BLUPF90 family of programs. University of Georgia Edition, Athens, GA, United States.
Monico, L., Rosi, F., Miliani, C., Daveri, A., and Brunetti, B. G. (2013). Non-invasive identification of metal-oxalate complexes on polychrome artwork surfaces by reflection mid-infrared spectroscopy. Spectrochim. Acta A 116, 270–280. doi: 10.1016/j.saa.2013.06.084
Nilsson, K., Stalhammar, H., Hansen, M. S., Lindmark-Mansson, H., Duchemin, S., Fikse, F., et al. (2019). Characterisation of non-coagulating milk and effects of milk composition and physical properties on rennet-induced coagulation in Swedish Red Dairy Cattle. Int. Dairy J. 95, 50–57. doi: 10.1016/j.idairyj.2019.03.006
Palombo, V., Milanesi, M., Sgorlon, S., Capomaccio, S., Mele, M., Nicolazzi, E., et al. (2018). Genome-wide association study of milk fatty acid composition in Italian Simmental and Italian Holstein cows using single nucleotide polymorphism arrays. J. Dairy Sci. 101, 11004–11019. doi: 10.3168/jds.2018-14413
Pazzola, M., Dettori, M. L., Cipolat-Gotet, C., Cecchinato, A., Bittante, G., and Vacca, G. M. (2014). Phenotypic factors affecting coagulation properties of milk from Sarda ewes. J. Dairy Sci. 97, 7247–7257. doi: 10.3168/jds.2014-8138
Pelayo, R., Gutierrez-Gil, B., Garzon, A., Esteban-Blanco, C., Marina, H., and Arranz, J. J. (2021). Estimation of genetic parameters for cheese-making traits in Spanish Churra sheep. J. Dairy Sci. 104, 3250–3260. doi: 10.3168/jds.2020-19387
Puledda, A., Gaspa, G., Manca, M. G., Serdino, J., Urgeghe, P. P., Dimauro, C., et al. (2017). Estimates of heritability and genetic correlations for milk coagulation properties and individual laboratory cheese yield in Sarda ewes. Animal 11, 920–928. doi: 10.1017/S1751731116002147
Pulina, G., Atzori, A. S., Dimauro, C., Ibba, I., Gaias, G. F., Correddu, F., et al. (2021). The milk fingerprint of Sardinian dairy sheep: quality and yield of milk used for Pecorino Romano PDO cheese production on population-based 5-year survey. Ital. J. Anim. Sci. 20, 171–180. doi: 10.1080/1828051X.2021.1875896
Pulina, G., Milan, M. J., Lavin, M. P., Theodoridis, A., Morin, E., Capote, J., et al. (2018). Invited review: current production trends, farm structures, and economics of the dairy sheep and goat sectors. J. Dairy Sci. 101, 6715–6729. doi: 10.3168/jds.2017-14015
R Core Team (2021). R: A Language and Environment for Statistical Computing. Vienna: R Foundation for Statistical Computing. Available online at: https://www.R-project.org/
Sadovnikova, A., Garcia, S. C., and Hovey, R. C. (2021). A comparative review of the cell biology, biochemistry, and genetics of lactose synthesis. J. Mammary Gland Biol. Neoplasia 26, 181–196. doi: 10.1007/s10911-021-09490-7
Sanchez, M. P., Ramayo-Caldas, Y., Wolf, V., Laithier, C., El Jabri, M., Michenet, A., et al. (2019). Sequence-based GWAS, network and pathway analyses reveal genes co-associated with milk cheese-making properties and milk composition in Montbeliarde cows. Genet. Sel. Evol. 51:34. doi: 10.1186/s12711-019-0473-7
Sanchez, M. P., Wolf, V., El Jabri, M., Beuvier, E., Rolet-Repecaud, O., Gauzere, Y., et al. (2018). Short communication: confirmation of candidate causative variants on milk composition and cheesemaking properties in Montbeliarde cows. J. Dairy Sci. 101, 10076–10081. doi: 10.3168/jds.2018-14986
Stocco, G., Summer, A., Cipolat-Gotet, C., Malacarne, M., Cecchinato, A., Amalfitano, N., et al. (2021). The mineral profile affects the coagulation pattern and cheese-making efficiency of bovine milk. J. Dairy Sci. 104, 8439–8453. doi: 10.3168/jds.2021-20233
Suchocki, T., Wojdak-Maksymiec, K., and Szyda, J. (2016). Using gene networks to identify genes and pathways involved in milk production traits in Polish Holstein dairy cattle. Czech J. Anim. Sci. 61, 526–538. doi: 10.17221/43/2015-CJAS
Tompa, P., Buzder-Lantos, P., Tantos, A., Farkas, A., Szilagyi, A., Banoczi, Z., et al. (2004). On the sequential determinants of calpain cleavage. J. Biol. Chem. 279, 20775–20785. doi: 10.1074/jbc.M313873200
Tyriseva, A. M., Vahlsten, T., Ruottinen, O., and Ojala, M. (2004). Noncoagulation of milk in Finnish Ayrshire and Holstein-Friesian cows and effect of herds on milk coagulation ability. J. Dairy Sci. 87, 3958–3966. doi: 10.3168/jds.S0022-0302(04)73536-5
Uniacke-Lowe, T., and Fox, P. F. (2017). Chymosin, pepsins and other aspartyl proteinases: Structures, functions, catalytic mechanism and milk-clotting properties. Cheese 69–113. doi: 10.1016/B978-0-12-417012-4.00004-1
Usai, M. G., Casu, S., Sechi, T., Salaris, S. L., Miari, S., Sechi, S., et al. (2019). Mapping genomic regions affecting milk traits in Sarda sheep by using the OvineSNP50 Beadchip and principal components to perform combined linkage and linkage disequilibrium analysis. Genet. Select. Evol. 51:508. doi: 10.1186/s12711-019-0508-0
Vacca, G. M., Cipolat-Gotet, C., Paschino, P., Casu, S., Usai, M. G., Bittante, G., et al. (2019). Variation of milk technological properties in sheep milk: relationships among composition, coagulation and cheese-making traits. Int. Dairy J. 97, 5–14. doi: 10.1016/j.idairyj.2019.05.002
Vanraden, P. M. (2008). Efficient methods to compute genomic predictions. J. Dairy Sci. 91, 4414–4423. doi: 10.3168/jds.2007-0980
Wang, H., Misztal, I., Aguilar, I., Legarra, A., and Muir, W. M. (2012). Genome-wide association mapping including phenotypes from relatives without genotypes. Genet. Res. 94, 73–83. doi: 10.1017/S0016672312000274
Keywords: Fourier Transform Infra Red (FTIR), spectroscopy, dairy sheep, SNP, clotting properties
Citation: Gaspa G, Correddu F, Cesarani A, Congiu M, Dimauro C, Pauciullo A and Macciotta NPP (2022) Multivariate and Genome-Wide Analysis of Mid-Infrared Spectra of Non-Coagulating Milk of Sarda Sheep Breed. Front. Anim. Sci. 3:889797. doi: 10.3389/fanim.2022.889797
Received: 04 March 2022; Accepted: 01 April 2022;
Published: 04 May 2022.
Edited by:
Massimo Malacarne, University of Parma, ItalyReviewed by:
Bianca Castiglioni, National Research Council (CNR), ItalyCopyright © 2022 Gaspa, Correddu, Cesarani, Congiu, Dimauro, Pauciullo and Macciotta. This is an open-access article distributed under the terms of the Creative Commons Attribution License (CC BY). The use, distribution or reproduction in other forums is permitted, provided the original author(s) and the copyright owner(s) are credited and that the original publication in this journal is cited, in accordance with accepted academic practice. No use, distribution or reproduction is permitted which does not comply with these terms.
*Correspondence: Giustino Gaspa, Z2l1c3Rpbm8uZ2FzcGFAdW5pdG8uaXQ=
†These authors have contributed equally to this work and share first authorship
Disclaimer: All claims expressed in this article are solely those of the authors and do not necessarily represent those of their affiliated organizations, or those of the publisher, the editors and the reviewers. Any product that may be evaluated in this article or claim that may be made by its manufacturer is not guaranteed or endorsed by the publisher.
Research integrity at Frontiers
Learn more about the work of our research integrity team to safeguard the quality of each article we publish.