- 1Department of Animal and Food Sciences, Texas Tech University, Lubbock, TX, United States
- 2Milk Specialties, Eden Prairie, MN, United States
The objectives of this study were to determine the impacts of supplementing various nutraceuticals in milk replacers, including a blend of probiotics, β-glucan extract, mannanoligosaccharide extract, or a non-immunoglobulin rich extract, from colostrum on the performance and health of high-risk calves and to determine carry-over effects into the immediate post-weaned period. One hundred bull calves were acquired from a local calf ranch within 24 h of birth and randomly assigned to one of five dietary treatments added to milk replacer only: (1) Control (CON), no additive; (2) Immu-PRIME (ImmPr), 1.5 g/d ImmPr first 3 d only (Sterling Technology, Brookings, SD, USA); (3) Beta glucan (BG), 1 g/d BG extract (ImmuOligo, Irvine, CA, USA); (4) Mannanoligosaccharide + Bacillus subtilis (MOS+Bs), 3 g/d CEREVIDA EXCELL-M + 4 x 10⁹ CFU/d Bacillus subtilis (MB Nutritional Sciences, Lubbock, TX, USA); and (5) PROVIDA CALF (PRO), proprietary blend of 2 x 10⁹ CFU/d of a Lactobacillus casei and an Enterococcus faecium + 2 x 10⁹ CFU/d Saccharomyces cerevisiae (MB Nutritional Sciences, Lubbock, TX, USA). Calves were weaned at d 56, comingled, and treatment carry-over effects evaluated through d 84. Starter intake was measured daily and BW weekly. Peripheral blood samples were collected and analyzed for hematology and serum was analyzed for haptoglobin concentrations. Polymorphonuclear leukocyte (PMNL) function was assessed through surface L-selectin expression, phagocytic, and oxidative burst activities against Escherichia coli. Data were analyzed using Proc Mixed in SAS (SAS 9.4, Cary, NC). The BG calves consumed the most starter from d 1 to 28 and pre-weaned average daily gain was greater for both the PRO and BG when compared to the CON group. There was a tendency for BG, MOS+Bs, and PRO to have reduced serum haptoglobin throughout the study. Total leukocyte, neutrophil, and lymphocyte counts were reduced among MOS+Bs calves, whereas BG calves tended to have the greatest neutrophil:lymphocyte ratio. Oxidative burst function for PMNL was reduced among BG and PRO treatments, suggesting a decreased need for neutrophil function. Supplementing BG, MOS+Bs, and PRO all influenced the performance and health of high-risk calves, but mechanistically appear to be different.
Introduction
High-risk calves have an increased risk for morbidity and mortality due to failure of passive transfer (FPT), greater exposure to pathogens, or increased stressors such as heat/cold stress or transport in the first few days of life. High-risk calves require more intensive management to combat the disadvantages they face with health and performance. Because of the immature anatomy of the gastrointestinal tract (GIT) coupled with a naïve immune system, calves are especially susceptible to infection with bacteria and viruses (Meale et al., 2017). Of the myriad of pathogens that can cause early calfhood disease, diarrhea contributes to a 6.4% mortality rate for pre-weaned heifers on US dairy farms with at least 56.4% of those deaths being attributable to gastrointestinal disease (NAHMS, 2014). A current industry goal for decreasing pathogen exposure is reducing the use of antibiotics by alternative supplementation strategies, which include nutraceuticals.
Decreasing the pathogen exposure or improving GIT immune maturation of neonatal calves can decrease morbidity and mortality, and various nutraceuticals added to the liquid feed are an attractive approach because these compounds are delivered directly to the site of function as reviewed in more detail by Ballou et al. (2019). Probiotics and yeast cell wall fractions, β-glucans (BG), and mannanoligosaccharides (MOS) are common feed additives as data suggest similar health and performance results to feeding oral antibiotics (Heinrichs et al., 2003; Berge, 2016; Nargeskhani et al., 2010). Supplementing probiotics and MOS to calves increases performance and health including increased body weight (BW), average daily gain (ADG), and decreased fecal scores (Heinrichs et al., 2003; Ghosh and Mehla, 2012). Supplementing BG previously has increased pro-inflammatory cytokine production, increased leukocyte function, and moderated the impacts of inflammation during sepsis in multiple species (Novak and Vetvicka, 2009; Eicher et al., 2010; Chen, 2013). Supplementation of these compounds has shown equivocal results, and each supplement appears to have unique mechanisms of action.
The objectives of this study were to determine the impacts of supplementing a blend of probiotics containing Lactobacillus casei, Enterococcus faecium, and Saccharomyces cerevisiae, a purified mushroom β-glucan extract, a heat stable blend of Bacillus subtilis probiotic with a MOS extract, and a non-immunoglobulin extract from colostrum on the performance and health of high-risk Holstein calves and to determine if any treatment had carry-over effects into the immediately post-weaned period.
Materials and Methods
Study Design
All procedures in this study were approved by the Texas Tech University Institutional Animal Care and Use Committee (IACUC protocol #17005-01). The current study was a completely randomized design consisting of two 84-day periods with a total of 100 Holstein bull calves (n=50 per period). Treatments were completely randomized and included: (1) Control (CON), no additive; (2) Immu-PRIME (ImmPr), 1.5 g/d ImmPr first 3 d only (Sterling Technology, Brookings, SD, USA); (3) Beta glucan (BG), 1 g/d BG extract (ImmuOligo, Irvine, CA, USA); (4) Mannanoligosaccharide + Bacillus subtilis (MOS+Bs), 3 g/d CEREVIDA EXCELL-M + 4 x 10⁹ CFU/d Bacillus subtilis (MB Nutritional Sciences, Lubbock, TX, USA); and (5) PROVIDA CALF (PRO), proprietary blend of 2 x 10⁹ CFU/d of a Lactobacillus casei and an Enterococcus faecium + 2 x 10⁹ CFU/d Saccharomyces cerevisiae (MB Nutritional Sciences, Lubbock, TX, USA). This study was conducted from February 2017 through June 2017. When the calves in period 1 were weaned and commingled, the hutches were cleaned, sanitized, and allowed 1 week of rest prior to moving the calves in period 2 into the hutches. Upon arrival at approximately 1500h, all calves were weighed, randomly assigned to treatment, and administered a gelatin capsule of a full day’s respective treatment with a bolus gun. Control calves received a sham bolus at this time. Peripheral blood was drawn immediately to estimate passive immune status via total serum protein (TSP) analysis on a hand-held refractometer. On day 0 calves were given access to water ad libitum and 25 g texturized calf starter but no milk feeding.
Calf Feeding and Care
All calves for each period were picked up on the same day from a calf ranch in Eastern New Mexico and transported 150 km to the Texas Tech University Calf Research Facility. All calves were enrolled in the study within 24 h of birth. Calves were housed outdoors in individual calf hutches (2.13 x 1.09 m Agri-Plastics, Cortland, NY, USA) with an attached pen.
Nutrient analysis of both milk replacer and starter are reported in Table 1. Calves were fed 700 g of milk replacer powder mixed at 12% solids per day containing 22% crude protein (CP) and 20% fat (Milk Specialties, Eden Prairie, MN, USA) and texturized calf starter ad libitum at 22% CP (Purina Ampli Calf, Purina, St. Louis, MO, USA). Milk replacer was fed twice daily at 700h and 1600h. Water buckets were dumped and scrubbed with chlorine water weekly to limit pathogen growth and contamination while nipples, bottles, and the milk tank were all cleaned and sanitized immediately after each feeding with hot water and chlorine. Access to texturized calf starter and water was given ad libitum from d 0 until the end of the study on d 84. Measurements were taken daily for starter offered, starter refusal, water intake, milk replacer refusal, electrolyte consumption, and antibiotic administration. Health status was assessed daily through ear, eye, nose, cough, and fecal scores. Briefly, scores were collected by a single trained observer on a score between 0-3 on the severity of symptoms including nasal and ocular discharge, ear droop, coughing, and diarrhea. The scoring system was from the University of Wisconsin School of Veterinary Medicine (Clinical information: Calf health scoring chart). Calves with a fecal score consistency of liquid splatters were offered 2 L of an acidified oral electrolyte (ELECTROLIFE Renew; MB Nutritional Sciences LLC, Lubbock, TX, USA) in between milk feedings. Weather data were recorded daily. Period 1 median temperature was 15.1°C, with eight rain events averaging 1.3 cm of rain per event. Period 2 median temperature was 21.5°C, with 14 rain events averaging 1.2 cm of rain per event. During period 2 every calf was given 3 consecutive days of 1 mL penicillin orally per day beginning on d 8 due to a suspected Clostridium perfringens outbreak causing abomasal bloat. All calves were castrated by banding on d 23 after the morning feeding. All calves were vaccinated on d 28 with Bovi-Shield Gold 5 (Zoetis Inc, Parsippany-Troy Hills, NJ, USA). Calves were stepwise weaned starting d 53 and only fed 350 g milk powder in the morning until d 56 when they were moved into randomized group pens. Treatments were ceased at weaning and calves were co-mingled in groups of 10 to 12 calves per pen with treatments equally represented within each pen. Group pen starter intake and refusal were measured every morning until d 84 for descriptive purposes.
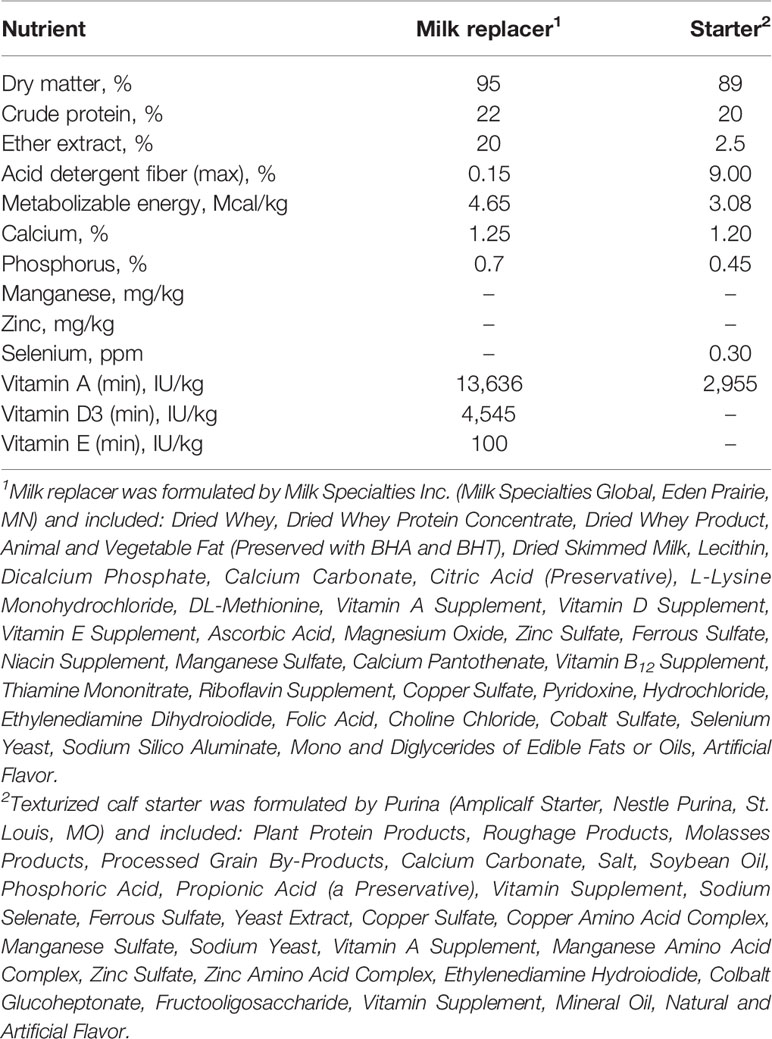
Table 1 The formulated nutrient content of the milk replacer and calf starter fed to pre-weaned Holstein calves.
Calf Evaluation and Sample Collection
A schematic of weekly sample collections can be found in Supplemental Images. Calf starter and water intakes were measured daily. Milk refusals were measured after each milk feeding and recorded. Measurements of BW were taken on d 0, 7, 14, 21, 28, 35, 42, 49, 56, 70, and 84. Rectal temperatures were assessed on d 1, 4, 8, 11, 15, 18, and 22 as well as fresh fecal samples directly collected from the rectum to determine dry matter percentage as an additional variable to assess GIT health. Length, height, and heart girth as measures of growth performance were taken on d 0, 28, 56, and 84 using a tailor’s tape. Length was defined as the measurement from the tip of the scapula to the tail bone when the back was flattened. Height was defined as the measurement from the bottom of the hoof to the scapula when the calf was standing straight. Heart girth was measured by the circumference around the ribs directly behind the scapula. On d 35 a baseline double skinfold thickness measurement was taken over the scapula and then each calf received an intradermal injection of 100 µL of a 1 mg/mL solution of phytohemagglutinin-P (PHA; Sigma Aldrich, St. Louis, MO, USA) in sterile saline. A follow-up double skinfold thickness measurement was recorded 72 h post-injection as an estimate of the delayed type-4 hypersensitivity reaction. All calves were vaccinated with 0.5 mg ovalbumin (Sigma Aldrich, St. Louis, MO, USA) + 0.5 mg of Quil-A (Brenntag Biosector, Denkark) adjuvant on d 28 with a booster vaccination occurring on d 42. Serum was collected to estimate a T-lymphocyte dependent Immunoglobulin G (IgG) response.
Hematology and Peripheral Blood Leukocyte Activity
Peripheral blood samples (3 mL K2 EDTA, 3 mL sodium heparin, and 10 mL no additive) were taken on d 1, 3, 7, 14, 21, 42, 56, and 84. The frequency of blood collection was greater early in the study because of the dynamic nature of many of the variables early in life (Cobb et al., 2014). Serum was collected and stored at -80°C from the no additive tube after it was allowed to clot at room temperature for 30 min and centrifuged for 15 min at 23°C and 1500 x g. The K2 EDTA tube was analyzed for hematology within 2 h on an IDEXX ProCyte analyzer (Idexx, Westbrook, ME). The sodium heparin tube was used to assess the functional capacities of various leukocytes including phagocytic and oxidative burst of PMNL, expression of CD62L on PMNL, whole blood lipopolysaccharide stimulated cultures to measure tumor necrosis factor-alpha (TNF-α) production, and whole blood PHA stimulated cultures to measure interferon-gamma (IFN-γ) production.
Blood samples were collected prior to milk feeding and before any other measurement (BW, length, height, heart girth) was taken to avoid stress and changing the outcome of the sample collected. Samples were collected in order of ID and within 3 min of entering a pen to minimize stress.
Sample Analysis
Serum was analyzed at all blood collection time points for glucose, urea nitrogen, and haptoglobin. Further, serum was analyzed for ovalbumin-specific IgG on d 28, 42, 56, and 84. Serum glucose and urea nitrogen were analyzed using a commercially available enzymatic assay (Stanbio Labs, Hampton, NH, USA). Serum haptoglobin concentrations were measured colorimetrically as outlined in Ballou (2011). Ovalbumin IgG was assessed via capture ELISA using the technique described in Ballou and DePeters (2008).
Stimulated whole blood cultures were conducted to determine the concentration of IFN-γ and TNF-α after PHA-P and LPS (Escherichia coli 0111:B4; Sigma Aldrich, St. Louis MO, USA) stimulated cultures, respectively. These cultures and cytokines were chosen because they represent major cytokines involved in cell-mediated immunity and the acute phase response. The PHA-P culture for IFN-γ was stimulated at a final concentration of 25 mg/mL in complete RPMI 1640 media containing 4 mM glutamine and 1% antibiotics and antimycotic. The LPS culture for TNF-α was stimulated at a final concentration of 1 mg/mL in the sample complete media as the PHA-P culture. The PHA-P and LPS cultures were incubated at 38.5°C in a 5% CO2 cell culture incubator for 72 and 24 h, respectively. After incubation, each plate was centrifuged for 15 min at 1200 x g and the cell culture supernatant was removed and stored at -80°C until subsequent cytokine analysis. The cell culture supernatant concentrations of IFN-γ and TNF-α were determined using commercially available sandwich ELISA (CAT #KBC1213 and CAT #EBTNF; Thermofisher Scientific, Waltham, MA, USA).
Expression of L-selectin on PMNL was measured via the method defined in Liang et al. (2018) using flow cytometry. L-selectin expression was determined on PMNL gated by forward and side scatter characteristics and then by mean fluorescence intensity (FL-1) measured on a BD Accuri flow cytometer (BD Biosciences, Franklin Lakes, NJ, USA). Polymorphonuclear leukocyte phagocytic and oxidative burst functionality were assessed using the method outlined in Ballou et al. (2015). Briefly, PMNL populations were gated via forward and side scatter characteristics and the percentage of positive cells for oxidative burst and phagocytosis was determined via the geometric mean fluorescence intensities of the FL-1 and FL-3 channels for rhodamine and propidium iodide expression, respectively.
Statistical Analysis
All continuous, repeatedly measured data were analyzed as a repeated measure using the Mixed Procedure in SAS (SAS 9.4, Cary, NC, USA). The model included fixed effects of treatment, time, and treatment x time. Initial BW and TSP were tested as covariates in the model and were retained in the final model if they were significant. Initial BW was a significant covariate for ADG and TSP for calf starter intake. Period was included as a random effect, and the subject of the repeated statement was calf nested within treatment . The calf starter intake and ADG data were summarized into the pre-weaned and post-weaned periods and then were Winsorized, bottom and top 10% of observations, from each treatment (Keselman, 2000). All appropriate covariance structures and variance structures were analyzed, and the most appropriate model was selected based on the lowest Bayesian information criterion. Differences of P ≤ 0.05 were considered significant and a tendency was reported when 0.05 < P ≤ 0.10. Significant treatment x time interactions were further evaluated by sliced treatment differences at each sample time using a Duncan adjustment to control the familywise error. All pairwise comparisons at each significant time were determined.
Results
Calf Mortality and Performance
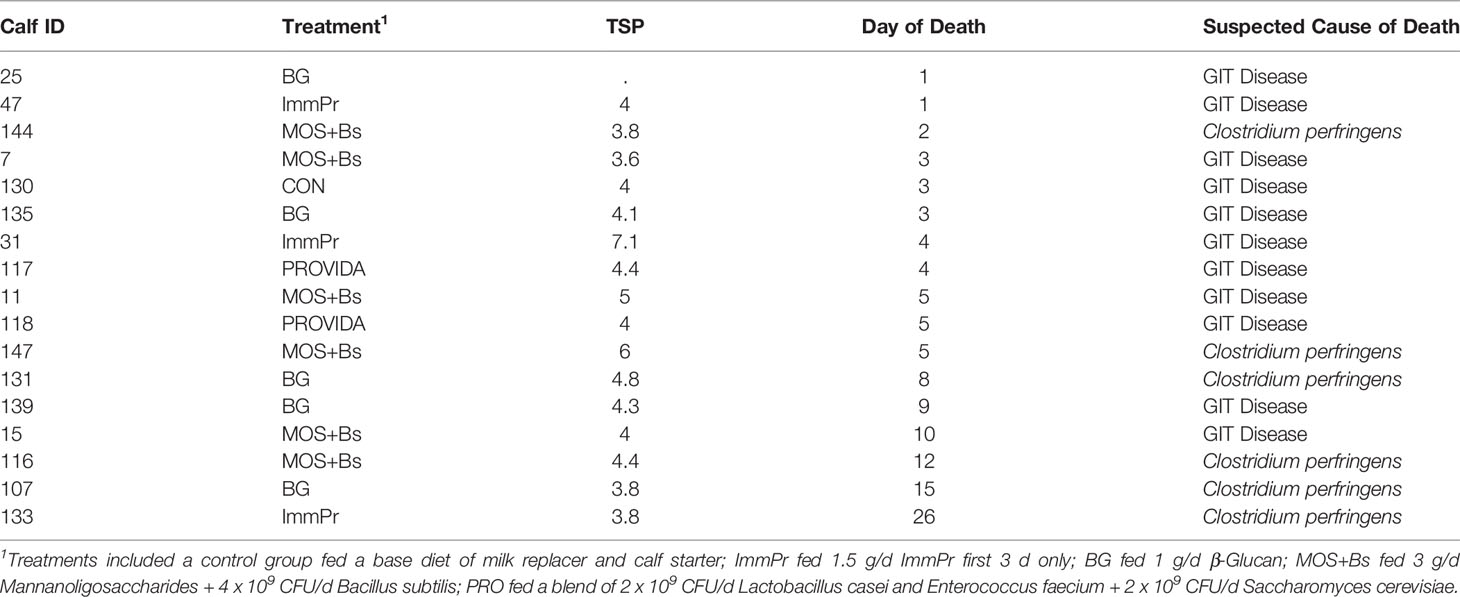
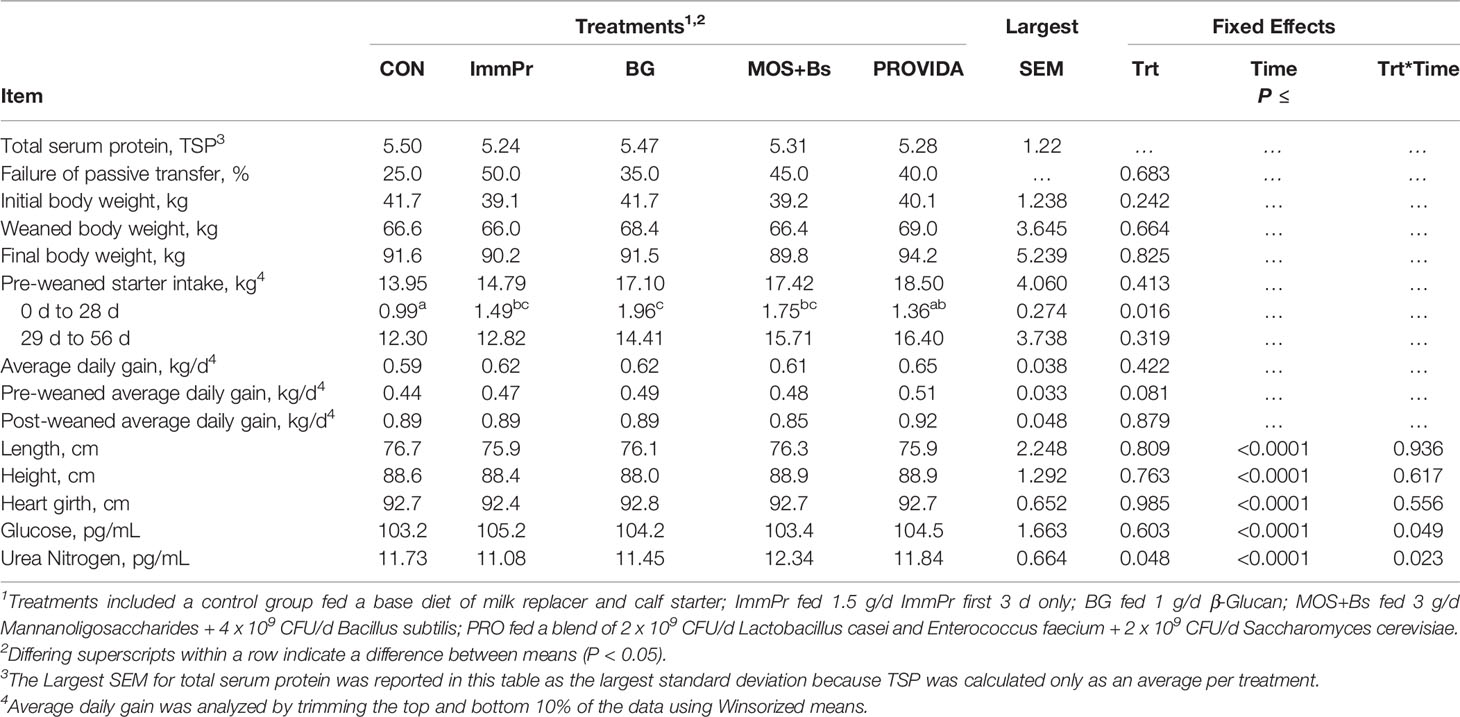
Calf mortality is reported in Table 2 and includes treatment, day of death, and suspected cause of death. There was a high rate of mortality in the current study that exceeded the expected rate but was consistent with the high-risk model. Performance variables including body weight, TSP, starter intake, ADG, body measures, and blood metabolites are reported in Table 3. Initial body weights did not differ among treatment groups (P=0.242). The TSP data were reported as average TSP per treatment and the percent of calves in each treatment with FPT (<5.2g/dL). The CON calves had the least amount of FPT at 25% while ImmPr had the greatest at 50% FPT. There was a treatment difference for pre-weaned starter intakes from d 0 to d 28 where CON calves had decreased starter intakes when compared to BG, MOS+Bs, and ImmPr calves (P=0.016). Overall and post-weaned ADG did not differ among groups but a tendency for difference was detected for pre-weaned ADG (P=0.081; Table 2). There was no treatment x time interaction or treatment difference for any of the body measurement data (P≥0.556).
There was a treatment x time interaction for serum glucose concentration (P=0.049). The treatment x time differences in serum glucose are reported in Figure 1. The CON had decreased serum glucose concentrations on d 3 (P=0.007) and d 7 (P=0.107) when compared to all other treatment groups. Serum urea nitrogen concentration differed with a treatment x time interaction (P=0.048). The serum urea nitrogen data reported in Figure 2 indicated the treatment differences occurred at d 14 where ImmPr calves had decreased serum urea nitrogen than CON, PRO, and MOS+Bs calves (P=0.071), and d 84 where MOS+Bs calves had greater serum urea nitrogen compared to CON, ImmPr, and PRO calves (P=0.001).
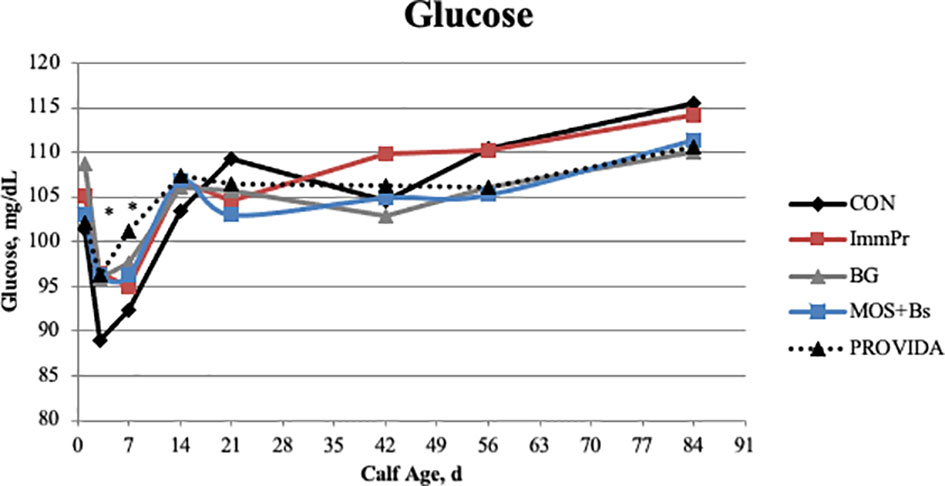
Figure 1 Serum glucose concentrations were measured on d 0, 3, 7, 14, 21, 42, 56, and 84. There was a treatment x time interaction (P = 0.049). The CON treatment had lower glucose concentrations than all other treatments on d 3 (P ≤ 0.006) and was reduced on d 7 when compared to PROVIDA (P =0.009). Largest SEM per time point are expressed as mg/dL and include 3.727, 2.271, 3.051, 2.571, 2.739, 3.131, 3.149, and 2.933 for d 1, 3, 7, 14, 21, 42, 56, and 84, respectively. An * indicates a treatment difference of (P ≤ 0.05) when treatments were sliced by time.
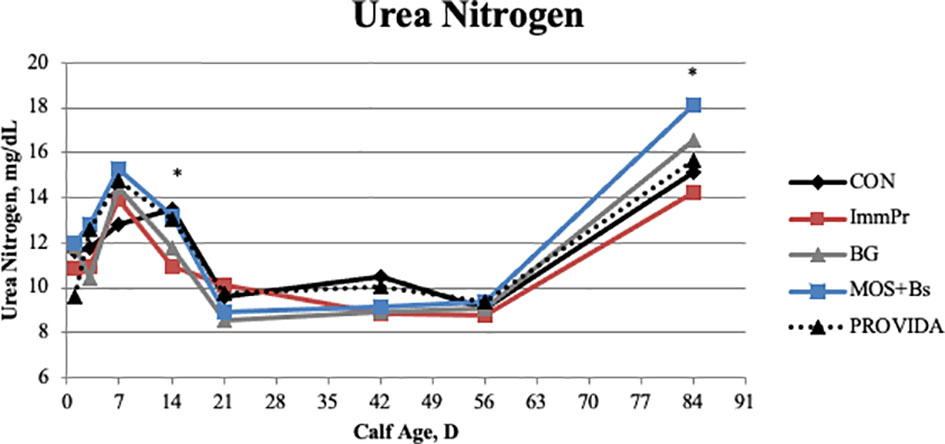
Figure 2 Serum urea nitrogen concentrations were measured on d 0, 3, 7, 14, 21, 42, 56, and 84. There was a treatment x time interaction (P ≤ 0.023). The ImmPr had a lower plasma urea nitrogen concentration on d 14 than CON, PROVIDA, and MOS+Bs (P ≤ 0.041). However, MOS+Bs had an elevated plasma urea nitrogen concentration on d 84 than CON, ImmPr, and PROVIDA (P ≤ 0.004). Lastly, plasma urea nitrogen concentration was greater on d 84 for BG when compared to ImmPr (P = 0.006). Largest SEM per time point are expressed as mg/dL and include 1.128, 1.334, 1.241, 0.997, 0.858, 0.855, 0.789, and 0.881 for d 1, 3, 7, 14, 21, 42, 56, and 84, respectively. An * indicates a treatment difference of (P ≤ 0.05) when treatments were sliced by time.
Calf Health
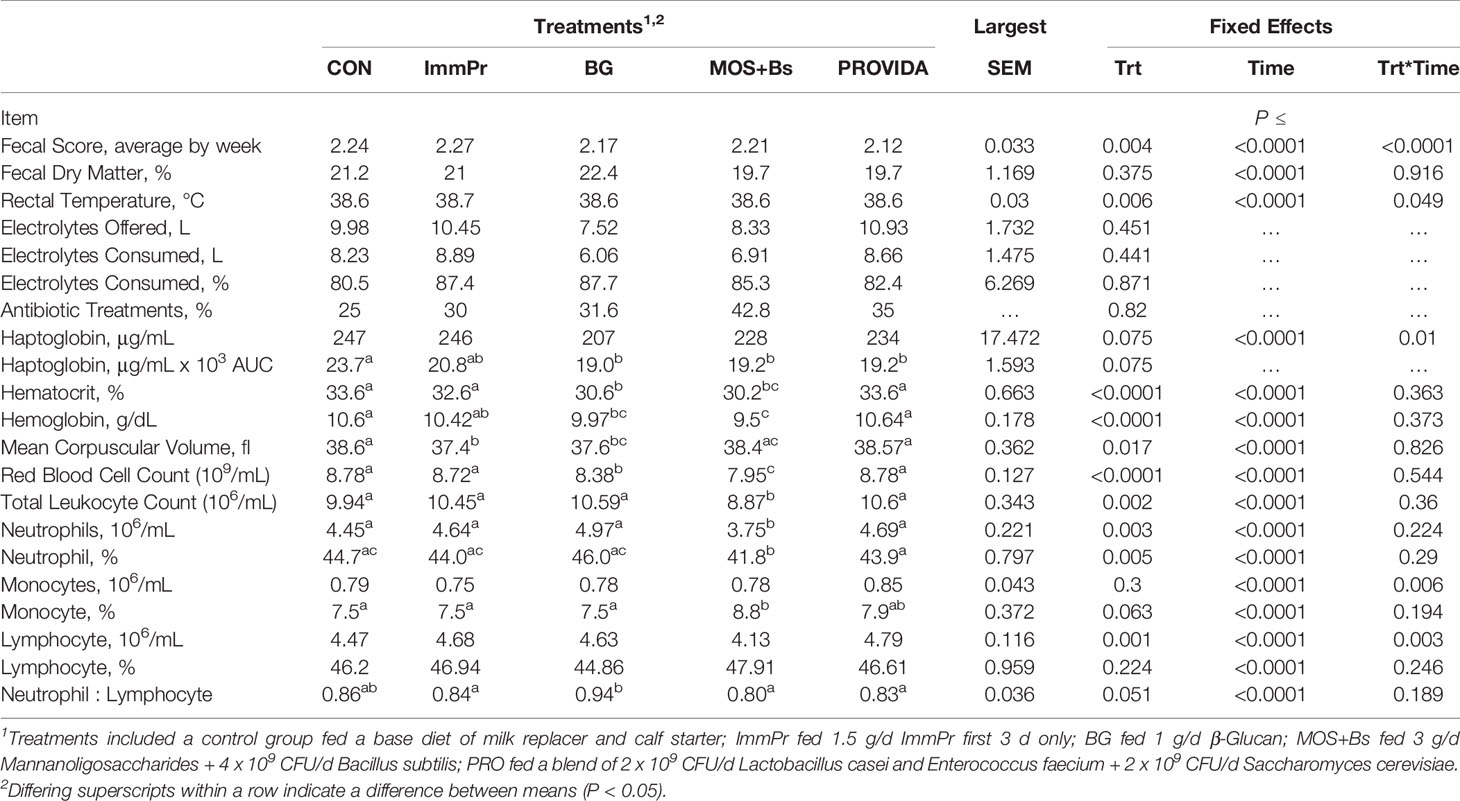
Fecal scores, fecal dry matter, rectal temperature, electrolyte consumption, antibiotic treatments, and hematology measures are all reported in Table 4. There was a treatment x time interaction among fecal scores (P<0.0001). Fecal score differences are indicated in Figure 3 at week 2 (P=0.036) where BG calves had decreased fecal scores compared to other treatments, week 5 (P=0.017), week 6 (P=0.001), week 7 (P=0.001), and week 8 (P=0.002) where PRO calves had decreased fecal scores compared to all treatments. There was a treatment x time interaction for rectal temperature (P=0.049). Rectal temperature differences are reported in Figure 4 and occurred at d 4 (P=0.010) and d 8 (P=0.006) with CON calves having decreased rectal temperatures at both time points when compared to BG, ImmPr, and MOS+Bs and the ImmPr calves had greater rectal temperatures at both time points when compared to the PRO calves.
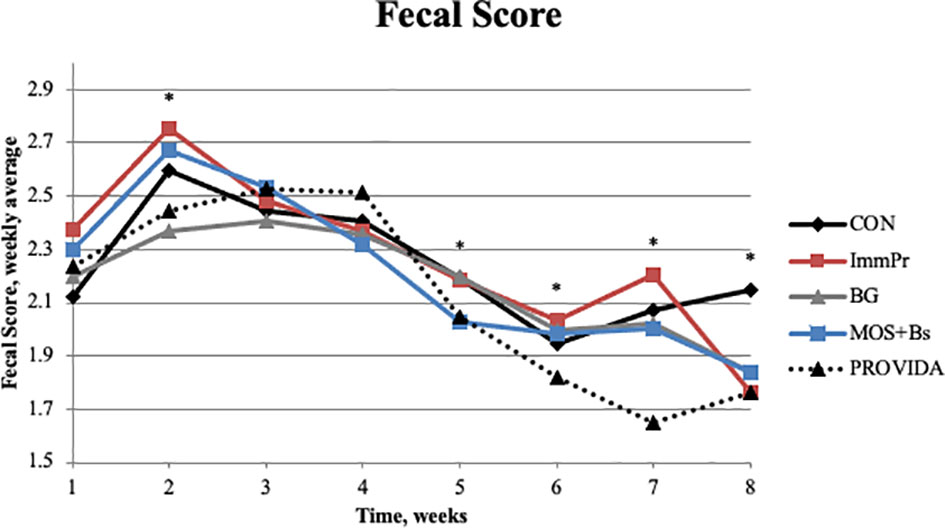
Figure 3 The fecal scores were averaged by week per treatment for weeks 1, 2, 3, 4, 5, 6, 7, and 8. There was a treatment x time interaction (P<0.0001). The BG calves had lower fecal scores during week 2 (P ≤ 0.087). The PROVIDA calves had decreased fecal scores when compared to other treatments during weeks 5, 6, 7, and 8 (P ≤ 0.027). Largest SEM per time point are expressed as fecal score weekly average and include 0.094, 0.104, 0.131, 0.108, 0.052, 0.046, 0.112, and 0.094 for d 0, 3, 7, 14, 21, 42, 56, and 84, respectively. An * indicates a treatment difference of (P ≤ 0.05) when treatments were sliced by time.
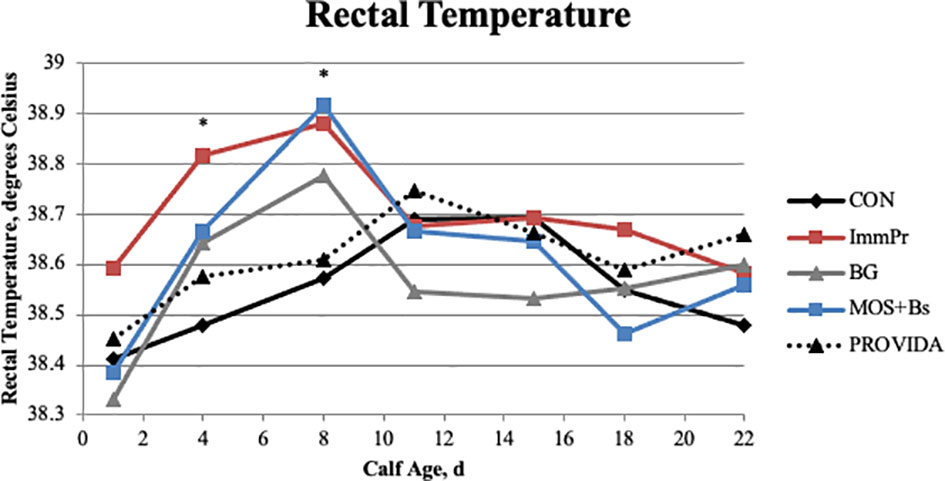
Figure 4 Rectal temperature was measured on d 1, 4, 8, 11, 15, 18, and 22. There was a treatment x time interaction (P ≤ 0.049). The CON treatment had decreased rectal temperatures when compared to other treatments; CON vs. BG (P ≤ 0.091) on d 4 and 8; CON vs. ImmPr (P ≤ 0.021) on d 4 and d 8; and CON vs. MOS+Bs (P ≤ 0.064) on d 4 and d 8. The ImmPr treatment had increased rectal temperatures when compared to other treatments; ImmPr vs. CON (P ≤ 0.021) on d 4 and d 8; ImmPr vs. BG (P =0.085) on d 4; and ImmPr vs. PROVIDA (P ≤ 0.012) on d 4 and d 8. Largest SEM per time point are expressed as degrees Celsius and include 0.096, 0.076, 0.080, 0.094, 0.072, 0.076, and 0.066 for d 1, 4, 8, 11, 15, 18, and 22, respectively. An * indicates a treatment difference of (P ≤ 0.05) when treatments were sliced by time.
Serum haptoglobin concentrations had a treatment x time interaction (P=0.010). Figure 5 shows the treatment interactions at d 7 (P=0.036) with ImmPr calves having greater haptoglobin concentrations compared to BG, MOS+Bs, and PRO calves, at d 14 (P=0.033) where BG calves had decreased haptoglobin compared with CON, ImmPr, and PRO calves, at d 42 (P=0.019) with CON calves having greater haptoglobin than ImmPr, BG, and PRO calves, and at d 56 (P=0.006) with ImmPr calves having greater haptoglobin concentrations compared to all other treatments. There was a tendency for a treatment interaction when haptoglobin concentration was assessed using an area under the curve (AUC) approach (P=0.075), whereas BG, MOS+Bs, and PRO all had reduced serum haptoglobin concentrations when compared to the CON, and with the ImmPr not differing from any other treatment.
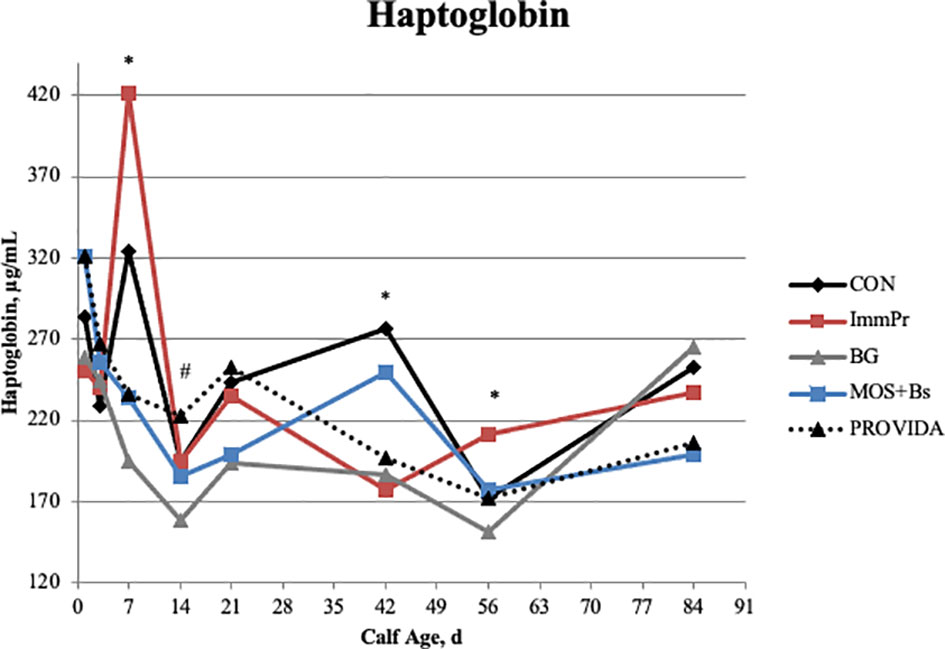
Figure 5 Serum haptoglobin concentration was measured on d 0, 3, 7, 14, 21, 42, 56, and 84. There was a treatment x time interaction (P ≤ 0.010). On d 7 ImmPr had greater haptoglobin concentrations than BG, MOS+Bs, and PROVIDA (P ≤ 0.015). On d 14, BG had decreased haptoglobin when compared to CON, ImmPr, and PROVIDA (P ≤ 0.068). The CON treatment had greater concentrations on d 42 than ImmPr, BG, and PROVIDA (P ≤ 0.016). On d 56 ImmPr had the greatest haptoglobin concentrations (P ≤ 0.035). Largest SEM per time point are expressed as μg/mL and include 31.202, 24.013, 61.286, 19.575, 29.605, 31.639, 16.917, and 45.241 for d 1, 3, 7, 14, 21, 42, 56, and 84, respectively. An * indicates a treatment difference of (P ≤ 0.05) when treatments were sliced by time. A # indicates a tendency for a treatment difference (0.05 < P ≤ 0.10) when treatments were sliced by time.
Hematology data are also reported in Table 4. There was no treatment x time interaction for hematocrit percentage (P=0.364), but there was a treatment difference (P<0.0001) where MOS+Bs and BG calves had decreased hematocrit percentages when compared with CON, ImmPr, and PRO calves. Similarly, there was no treatment x time interaction for hemoglobin (P=0.373); however, there was a treatment difference (P<0.0001) where CON and PRO calves had greater hemoglobin concentrations than BG and MOS+Bs calves. There was no treatment x time interaction for the mean corpuscular volume of red blood cells (P=0.826), but there was a treatment difference (P=0.017) where CON and MOS+Bs calves had greater MCV compared to ImmPr calves. No treatment x time interaction was determined for total red blood cell counts (P=0.544); however, there was a difference among treatments (P<0.001) where MOS+BS and BG calves had decreased RBC counts when compared to all other treatments. Total leukocyte count did not have a treatment x time interaction (P=0.360); however, there was a treatment difference (P<0.002) where MOS+Bs calves had decreased leukocyte count compared to all other treatments. There was no treatment x time interaction for polymorphonuclear neutrophil (PMNL) counts (P=0.224), but there was a treatment difference (P=0.003) where MOS+Bs calves had decreased PMNL counts compared to all other treatments. Additionally, there was no treatment x time interaction for PMNL percentage (P=0.290), but there was a treatment difference (P=0.005) where MOS+Bs and PRO calves had decreased PMNL percentage when compared to CON, ImmPr, and BG calves. There was a treatment x time interaction (P=0.006) for monocyte count. The monocyte count treatment x time interaction is shown in Figure 6 to differ at d 3 (P=0.083) where MOS+Bs calves had decreased monocyte count compared to ImmPr and PRO calves, at d 56 (P=0.007) where MOS+Bs calves had decreased monocyte count compared to ImmPr, CON and PRO calves, and at d 84 (P=0.005) where MOS+Bs calves had decreased monocyte count compared to ImmPr, BG and PRO calves. There was no treatment x time interaction for monocyte percentage (P=0.194), but there was a tendency for a treatment difference (P=0.063) where MOS+Bs calves tended to have increased monocyte percentage when compared to CON, ImmPr, and BG calves. Lymphocyte counts also differed with a treatment x time interaction (P=0.001). The differences in lymphocyte counts are illustrated in Figure 7 at d 3 (P=0.071), d 7 (P=0.043), d 14 (P=0.065), d 21 (P=0.054), d 42 (P=0.061), d 56 (P=0.003), and d 84 (P=0.010) where MOS+Bs calves had decreased lymphocyte counts when compared to other treatments at all time points. There was no treatment x time interaction in the ratio of PMNL to lymphocytes (P=0.189); however, the PMNL:lymphocyte had a strong tendency for a treatment difference (P=0.051), wherein the BG treatment had the greatest PMNL:lymphocyte.
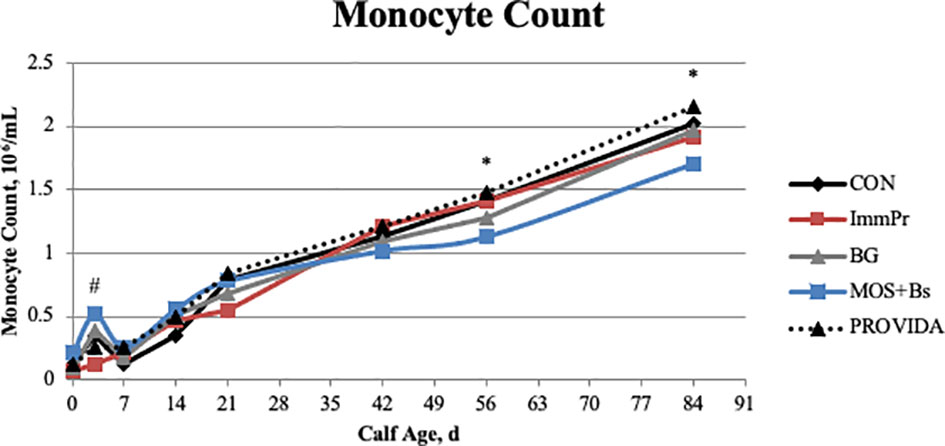
Figure 6 The monocyte count was measured on d 0, 3, 7, 14, 21, 42, 56, and 84. There was a treatment x time interaction (P ≤ 0.006). The MOS+Bs treatment had decreased monocytes when compared to other treatments; MOS+Bs vs. CON (P ≤ 0.007) on d 56, and 84; MOS+Bs vs. ImmPr (P ≤ 0.085) on d 3, 7, 56, and 84; MOS+Bs vs. BG (P =0.033) on d 84; MOS+Bs vs. PROVIDA (P ≤ 0.077) on d 3, 56, and 84. Largest SEM per time point are expressed as 106/mL and include 0.045, 0.109, 0.075, 0.129, 0.112, 0.066, 0.074, and 0.089 for d 0, 3, 7, 14, 21, 42, 56, and 84, respectively. An * indicates a treatment difference of (P ≤ 0.05) and a # indicates a tendency for a treatment difference (0.05< P ≤ 0.10) when treatments were sliced by time.
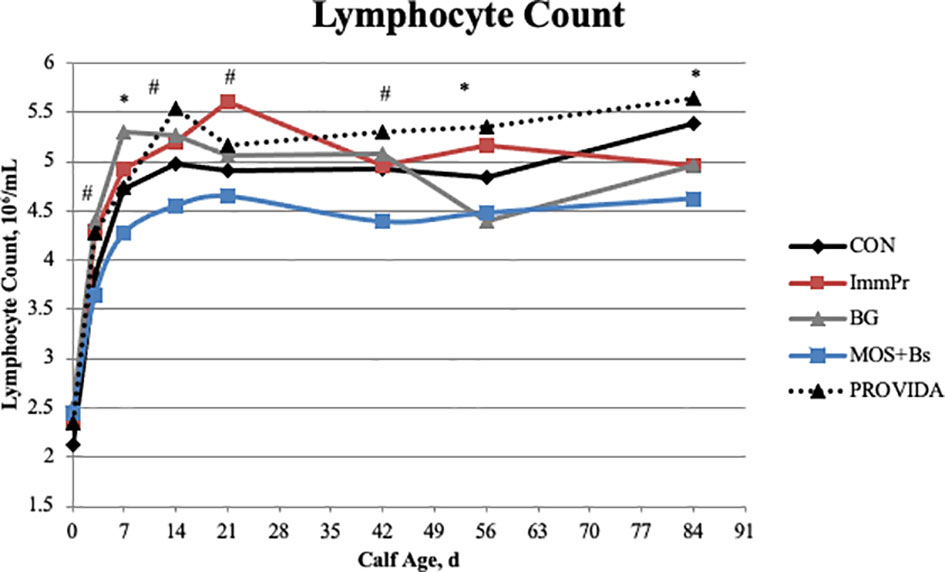
Figure 7 Lymphocyte count was measured on d 0, 3, 7, 14, 21, 42, 56, and 84. There was a treatment x time interaction (P ≤ 0.003). The MOS+Bs treatment had decreased lymphocytes when compared to other treatments; MOS+Bs vs. CON (P ≤ 0.079) on d 42, and 84; MOS+Bs vs. ImmPr (P ≤ 0.068) on d 3, 7, 14, 21, 42, and 56; MOS+Bs vs. BG (P ≤ 0.05) on d 3, 7, 14, and 42; MOS+Bs vs. PROVIDA (P ≤ 0.042) on d 3, 14, 42, 56, and 84. Largest SEM per time point are expressed as 106/mL and include 0.183, 0.229, 0.237, 0.263, 0.244, 0.230, 0.214, and 0.231 for d 0, 3, 7, 14, 21, 42, 56, and 84, respectively. An * indicates a treatment difference of (P ≤ 0.05) and a # indicates a tendency for a treatment difference (0.05< P ≤ 0.10) when treatments were sliced by time.
Calf Leukocyte and Cytokine Response
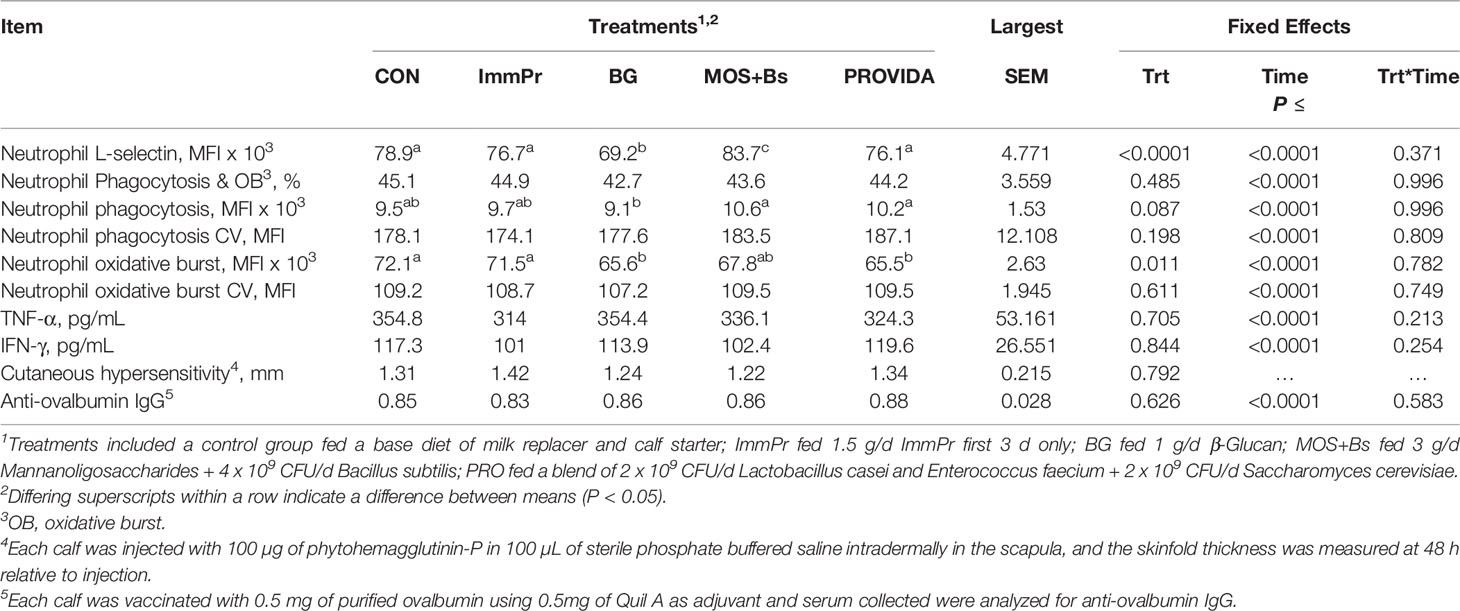
Neutrophil L-selectin expression, phagocytosis and oxidative burst capacity, stimulated whole blood cytokine culture data, cutaneous PHA hypersensitivity, and anti-ovalbumin IgG data are reported in Table 5. There was no treatment x time interaction for any data in this table (P≥0.371). The mean fluorescence intensity for PMNL phagocytosis had a tendency for a treatment difference (P=0.087) where BG calves had decreased phagocytosis capacity when compared to MOS+Bs and PRO calves. Additionally, the PMNL oxidative burst capacity had a treatment difference (P=0.011) where CON and ImmPr calves had increased oxidative burst capacity when compared to BG and PRO calves. Although the surface expression of L-selectin on PMNL had no treatment x time interaction (P=0.371), there was a treatment difference (P<0.0001) where MOS+Bs calves had increased L-selectin expression compared to all other treatments. Sliced treatment differences by time, illustrated in Figure 8, indicated that BG had decreased L-selectin expression on d 14 when compared to all other treatments (P≤0.078), whereas MOS+Bs were greater than BG and PRO calves on d 42, 56, and 84 (P≤0.027).
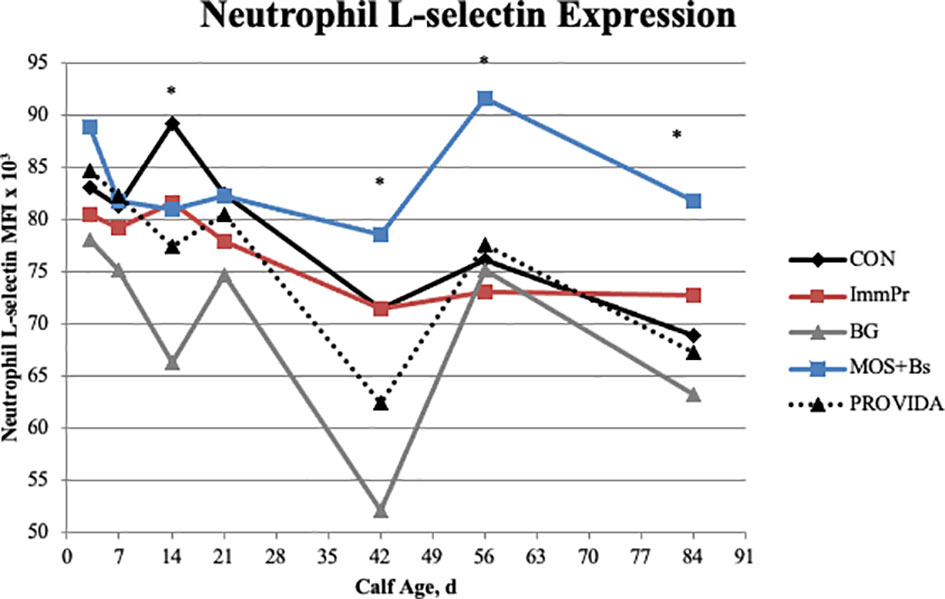
Figure 8 The surface expression of L-selectin on neutrophils was measured on d 3, 7, 14, 21, 42, 56, and 84. There was no treatment x time interaction, but there was a difference in the sliced effects. The MOS+Bs treatment had increased L-selectin when compared to other treatments; MOS+Bs vs. CON (P ≤ 0.032) on d 56 and 84; MOS+Bs vs. ImmPr (P =0.027) on d 56; MOS+Bs vs. BG (P ≤ 0.021) on d 14, 42, 56, and 84; MOS+Bs vs. PROVIDA (P ≤ 0.027) on d 42, 56, and 84. The BG treatment had decreased L-selectin expression when compared to other treatments; BG vs. CON (P ≤ 0.001) on d 14 and 42; BG vs. ImmPr (P ≤ 0.009) on d 14 and 42; BG vs. MOS+Bs (P ≤ 0.021) on d 14, 42, 56, and 84; BG vs. PROVIDA (P ≤ 0.078) on d 14 and 42. Largest SEM per time point are expressed as MFI x 103 and include 6.120, 6.235, 6.377, 6.360, 6.377, 6.385, and 6.409 for d 3, 7, 14, 21, 42, 56, and 84, respectively. An * indicates a treatment difference of (P ≤ 0.05) when treatments were sliced by time.
Discussion
This study investigated the impacts of four different nutraceutical supplement strategies on the health and performance of high-risk Holstein bull calves during the pre-weaned period as well as carry-over effects into the immediate post-weaned, comingled period. Data from the current study suggest that BG, MOS+Bs, and PRO influenced performance and some measures of health; however, the mechanisms of action for each appear to be different. The supplementation of BG may stimulate innate leukocytes and increase performance. The MOS+Bs appear to decrease leukocyte populations in blood and some PMNL functionality with an increase in pre-weaned performance. Finally, PRO improved performance with more modest impacts on leukocyte populations than the BG treatment.
The PRO and BG calves had increased ADG and body weight gain during the pre-weaned period compared to other treatments with a 3.92 and 2.80 kg improvement in pre-weaned BW gain, respectively. This is in agreement with data from multiple studies that supplemented similar probiotic bacterial species, specifically Lactobacillus casei and Enterococcus faecium, to young calves and observed increased ADG and BW (Abu-Tarboush et al., 1996; Mokhber-Dezfouli et al., 2007; Jatkauskas and Vrotniakiene, 2010). Increased ADG with probiotic supplementation may be due to a few mechanistic actions including, but not limited to, decreasing pathogen colonization and diarrhea, and increasing tight junction protein expression as well as the capability of the GIT to digest and absorb nutrients (Timmerman et al., 2005; Jatkauskas and Vrotniakiene, 2010); Williams, 2010; Liang et al., 2020). Supplementation of 12 Lactobacillus strains decreased colonization of three strains of E. coli in the GIT and up to five strains of Salmonella enterica spp. This is potentially due to the capacity of Lactobacillus species to adhere strongly to the small intestinal mucosa and epithelium and produce substances to decrease pathogenic growth (Jin et al., 2014). Other potential mechanisms of action include maintenance of host microbial communities and reducing inflammation. Increasing the integrity and general health of the mucosal surfaces in the GIT via probiotic bacteria supplementation can contribute to increased ADG and other performance measures (Isolauri et al., 2001; Gaggia et al., 2010). In contrast to the current study, supplementation of BG to calves and pigs reported no performance differences in ADG, DMI, or BW gain (Eicher et al., 2010; Ewaschuk et al., 2012). However, Dritz et al. (1995) supplemented a purified BG product to pigs and observed an increase in ADG and BW. The effect of feeding MOS to calves is equivocal with some studies reporting increased ADG, BW, and decreased fecal scores (Morrison et al., 2010; Ghosh and Mehla (2012); Berge, A., 2016) and other studies reporting no differences in ADG or final BW (Hill et al., 2008; Nargeskhani et al., 2010; Tóth et al., 2020). In agreement with the numerical increase in pre-weaned calf starter intake data in this study, MOS supplementation increased starter intake in the first 2 months of life without increasing final BW when compared to control calves (Heinrichs et al., 2003; Terre et al., 2007). Studies evaluating the efficacy of supplementing a Bacillus subtilis probiotic strain by itself in dairy calves reported greater ADG and BW in the probiotic groups when compared to a negative control (Jenny et al., 1991; Sun et al., 2010).
The health of calves likely impacts the performance outcomes of many nutraceutical supplements. Specifically, supplementing nutraceuticals in the absence of health risks or increased pathogen exposures, no differences in health are commonly reported (Gilliland et al., 1980; Riddell et al., 2008). The calves in the current study were high-risk bull calves from a commercial calf ranch, and despite intensive management of the calves, there was still an overall 17% mortality in the study.
Intensive calf management in the current study included daily evaluation of calf health, where calves were offered oral electrolytes as a health intervention if showing signs of dehydration or diarrhea. There was no difference in the quantity of electrolytes offered among treatments; however, it was numerically lowest for BG calves. In agreement, average fecal scores among all treatments were greatest during the 2nd week of life but were lowest for BG calves at that time. However, there were no differences in the dry matter (DM) content of fecal samples among treatments throughout the entire study. During the 2nd month of life, PRO calves had decreased fecal scores that coincided with the increase in pre-weaned starter intake. Probiotics have been shown to decrease fecal scores during both the pre- and post-weaned periods (Mokhber-Dezfouli et al., 2007; Meale et al., 2017). Fecal scores during week 8 were greatest for CON calves, which corresponded with the reduced pre-weaned starter intake among CON calves.
Rectal temperatures were taken during the first 3 weeks of life, with an increase in rectal temperature seen on d 4 and 8 in the ImmPr treatment, corresponding with the increased fecal scores for the ImmPr treatment within the first 3 weeks of life. This may also be related to the increased serum haptoglobin concentrations seen within the first week of life for ImmPr calves; multiple studies report a relationship between increased haptoglobin and increased fecal scores (Deignan et al., 2000; Richeson et al., 2013; and Murray et al., 2014).
Serum haptoglobin was assessed as a measure of systemic inflammation and analyzed as AUC as well as concentration over time. Increased haptoglobin AUC and concentration for both CON and ImmPr calves suggest there may have been a greater stress response or lack of microbial control in the GIT of those calves in the first week of life. Inflammation in the ImmPr calves may also be associated with the greater proportion of FPT calves in that group at enrollment. Exposure to pathogens and the inability to combat bacterial or viral infection of the GIT could increase haptoglobin levels as a general marker of inflammation. On the other hand, supplementation of BG, MOS+Bs, and PRO decreased haptoglobin concentrations. In agreement with the current study, Sandvik et al. (2007) that observed BG modulated inflammation in rats undergoing lipopolysaccharide-induced endotoxemia. A study where pigs were supplemented with BG reported decreased haptoglobin concentrations in the BG-supplemented pigs compared to a control group from d 7 through d 28 (Dritz et al., 1995). Additionally, Liang et al. (2020) reported decreased serum haptoglobin concentrations among high-risk Jersey calves after an oral Salmonella typhimurium challenge when supplemented with the same blend of probiotic bacteria used in the current study. Therefore, BG, MOS+Bs, and PRO may reduce the intensity of the systemic inflammatory response through some mechanism.
The exact mechanisms leading to the greater glucose concentrations in the CON and ImmPr calves at d 56 and 84 are unclear; however, these treatments had numerically lower calf starter intakes when compared to all other treatments. Therefore, the differences in serum glucose concentrations could be associated with nutrient availability or anatomical site of digestion. Similar to the current study, supplementing MOS or BG to calves does not impact glucose or blood urea nitrogen concentrations (Ma et al., 2020; Tóth et al., 2020).
The MOS+Bs calves had the lowest total leukocyte count, neutrophil count and percentage, and the lowest lymphocyte count at all time points. Neutrophil counts naturally decrease over time in the first 6 to 8 weeks of life in dairy calves, potentially reflecting maturation of the GIT, immune system, and/or reduced exposure to enteric pathogens (Kampen et al., 2006). The GIT of young calves is colonized by a wide variety of bacteria that represent diverse phyla, and this colonization is dynamic during the first few months of life. A primary putative mode of action of MOS is to bind gram-negative bacteria and promote the growth of strict anaerobic bacteria in the small intestine, which can ultimately decrease pathogen load within the neonate. However, some of the commensal microbes beginning to colonize the small intestine of neonatal calves are gram-negative. Many gram-negative bacteria express Type 1 Fimbriae, a type of adherence filament. Type 1 Fimbriae are mannose-specific filaments that induce agglutination and are expressed on many types of gram-negative bacteria, both pathogenic and commensal (Rendon et al., 2007; Lasaro et al., 2009). The high affinity of MOS for Type 1 Fimbriae may also cause binding of the commensal microbes in addition to the potentially opportunistic or pathogenic microbes. This may be contributing to the reduced leukocyte counts in the MOS+Bs group, as less stimulation by commensal microbiota in the GIT can result in decreased leukocyte responses (Yale and Balish, 1976). Supplementation of MOS to multiple species, including canines and broilers, decrease total leukocyte, lymphocyte, and neutrophil counts when compared to control groups (Swanson et al., 2002; Kim et al., 2010). Quezada et al. (2007) supplemented calves with a MOS extract and assessed the impacts on the mucosal immune system. Supplementing MOS decreased cell proliferation in jejunal Peyer’s patches, decreased B-cells in ileal Peyer’s patches, and increased T-cell populations in jejunal Peyer’s patches. These findings suggest MOS supplementation to calves alters mucosal immune cell proliferation and development. Future research is needed to determine the immediate and long-term impacts on GIT immune development when calves are fed MOS.
In contrast to the MOS+Bs treatment, the PRO-supplemented calves maintained the greatest lymphocyte counts throughout the entire study. The probiotic bacteria colonizing the GIT may be stimulating lymphocyte production similar to findings by Bai et al. (2004) on in vitro stimulation of intestinal epithelium by probiotics. More work is needed to determine the mechanism of interaction between the immune system and probiotics in the small intestine.
The BG calves had increased neutrophil counts and neutrophil to lymphocyte ratio in peripheral circulation. Whether BG stimulated granulopoiesis or reduced the marginating pool of neutrophils in circulation is unknown. However, the latter appears plausible because the BG-supplemented calves had the lowest L-selectin expression on the surface of peripheral blood PMNL. Reduction of L-selectin adhesion protein can increase the number of neutrophils measured in circulation because fewer neutrophils are loosely adhered to the vascular endothelium.
The exact reason for the attenuated PMNL responses in the BG-supplemented calves is unknown. In fact, the initial hypothesis was BG would stimulate many measures of PMNL function, as was reported by others (Wojcik et al., 2007; Malaczewska et al., 2010; Stier et al., 2014). Harris et al. (2017) supplemented calves with a yeast cell wall extract containing both MOS and BG, and there was an increase in L-selectin expression in supplemented calves. Moreover, Eicher et al. (2010) supplemented a purified BG extract where BG attenuated PMNL phagocytosis; however, there was no effect on PMNL oxidative burst or adhesion.
Supplementation of PRO probiotics also resulted in a decrease of PMNL oxidative burst capacity, contrary to other published literature (Indart et al., 2012). The CON and ImmPr calves had the greatest PMNL oxidative burst capacity, suggesting there may be a need for increased leukocyte function. A study comparing the immune responses of individually versus group-housed pre-weaned calves reported an increase in L-selectin expression and greater PMNL oxidative burst capacity in group-housed calves compared to individually housed calves (Cobb et al., 2014). These results suggest heightened PMNL function is necessary to combat the increased exposure to environmental pathogens encountered when calves are commingled. Increased pathogen load may lead to an increase in leukocyte activity.
Conclusion
Supplementing high-risk Holstein bull calves with BG, MOS+Bs, or PRO increased measures of performance and health, albeit by different mechanisms. Supplementing BG to high-risk calves likely decreases PMNL oxidative burst and L-selectin expression, potentially moderates some systemic inflammation, and simultaneously stimulates starter intake in the first month of life. Feeding PRO to high-risk calves increases starter intake and body weight gain, moderates a systemic inflammatory response, and stimulates lymphocytes. Supplementing MOS+Bs to high-risk calves decreases the lymphocyte and neutrophil populations while decreasing PMNL functionality. However, MOS+Bs were shown to increase L-selectin expression on PMNL, implying some mild stimulation may be occurring.
Data Availability Statement
The raw data supporting the conclusions of this article will be made available by the authors, without undue reservation.
Ethics Statement
The animal study was reviewed and approved by the Texas Tech University Institutional Animal Care and Use Committee (IACUC protocol #17005-01).
Author Contributions
ED, TB, YL, and MB all contributed to the animal work and sample analysis for the manuscript. MS contributed in statistical analysis and manuscript editing. MB did the final statistical analysis and helped to write the manuscript. All authors contributed to the article and approved the submitted version.
Conflict of Interest
MB has equity ownership in MB Nutritional Sciences LLC. MB was involved in the design of the experiment, consulted on data analyses, and edited the final version of the manuscript. MDS was employed by company Milk Specialties.
The remaining authors declare that the research was conducted in the absence of any commercial or financial relationships that could be construed as a potential conflict of interest.
Publisher’s Note
All claims expressed in this article are solely those of the authors and do not necessarily represent those of their affiliated organizations, or those of the publisher, the editors and the reviewers. Any product that may be evaluated in this article, or claim that may be made by its manufacturer, is not guaranteed or endorsed by the publisher.
Acknowledgments
The authors would like to thank Milk Specialties and the Texas Animal Nutrition Council for providing funding for this study. The context of this manuscript has been presented in part at the Mid-South Ruminant Nutrition Conference held by TANC. [ED, YL, TB, MS, and MB. 2018. Impacts of various milk replacer supplements on the health and performance of high-risk calves. Mid-South Ruminant Nutrition Conference, Grapevine, TX. August 8-9, 2018.]
Supplementary Material
The Supplementary Material for this article can be found online at: https://www.frontiersin.org/articles/10.3389/fanim.2022.872786/full#supplementary-material
References
Abu-Tarboush H. M., Al-Saiady M. Y., El-Din A. H. (1996). Evaluation of Diet Containing Lactobacilli on Performance, Fecal Coliform, and Lactobacilli of Young Dairy Calves. Anim. Feed Sci. Technol. 57 (1–2), 39–49. doi: 10.1016/0377-8401(95)00850-0
Bai A., Ouyang Q., Zhang W., Wang C., Li S. (2004). Probiotics Inhibit TNF- α -Induced Interleukin-8 Secretion of. World J. Gastroenterol. 10 (3), 455–457. doi: 10.3748/wjg.v10.i3.455
Ballou M. A. (2011). Case Study: Effect of a Blend of Prebiotics, Probiotics, and Hyperimmune Dried Egg Protein on the Performance, Health, and Innate Immune Responses of Holstein Calves. Prof. Anim. Sci. 27, 262–268. doi: 10.15232/S1080-7446(15)30483-6
Ballou M. A., Davis E. M., Kasl B. A. (2019). Nutraceuticals: An Alternative Strategy for the Use of Antimicrobials. Vet. Clin. Food Anim. 35, 507–534. doi: 10.1016/j.cvfa.2019.08.004
Ballou M. A., DePeters E. J. (2008). Supplementing Milk Replacer With Omega-3 Fatty Acids From Fish Oil on Immunocompetence and Health of Jersey Calves. J. Dairy Sci. 91 (9), 3488–3500. doi: 10.3168/jds.2008-1017
Ballou M. A., Hanson D. L., Cobb C. J., Obeidat B. S., Sellers M. D., Pepper-Yowell A. R., et al. (2015). Plane of Nutrition Influences the Performance and Innate Leukocyte Responses, and Resistance to an Oral Salmonella Enterica Serotype Typhimurium Challenge in Jersey Calves. J. Dairy Sci. 98 (3), 1972–1982. doi: 10.3168/jds.2014-8783
Berge A. C. (2016). A Meta-Analysis of the Inclusion of Bio-Mos in Milk or Milk Replacer Fed to Dairy Calves on Daily Weight Gain in the Pre-Weaning Period. J. Anim. Res. Nutr. 4 (1), 1–7. doi: 10.21767/2572-5459.100020
Chen Y., Dong L., Weng D., Liu F., Song L., Li C., et al. (2013). 1,3-β-Glucan Affects the Balance of Th1/Th2 Cytokines by Promoting Secretion of Anti-Inflammatory Cytokines In Vitro. Mole. Med. Rep. 8 (2), 708–712. doi: 10.3892/mmr.2013.1553
Clinical Information: Calf Health Scoring Chart,” in ” Food Animal Production Medicine (University of Wisconsin School of Veterinary Medicine). Available at: https://www.vetmed.wisc.edu/fapm/clinical-info/.
Cobb C. J., Obeidat B. S., Sellers M. D., Pepper-Yowell A. R., Hanson D. L., Ballou M. A. (2014). Improved Performance and Heightened Neutrophil Responses During the Neonatal and Weaning Periods Among Outdoor Group-Housed Holstein Calves. J. Dairy Sci. 97 (2), 930–939. doi: 10.3168/jds.2013-6905
Deignan T., Alwan A., McNair J., Warren T., O’Farrelly C. (2000). Serum Haptoglobin: An Objective Indicator of Experimentally-Induced Salmonella Infection in Calves. Res. Vet. Sci. 69 (2), 153–158. doi: 10.1053/rvsc.2000.0403
Dritz S. S., Shi J., Kielian T. L., Goodband R. D., Nelssen J. L., Tokach M. D., et al. (1995). Influence of Dietary B-Glucan on Growth Performance, Nonspecific Immunity, and Resistance to Streptococcus Suis Infection in Weanling Pigs. J. Anim. Sci., 73, 3341–3350. doi: 10.2527/1995.73113341x
Eicher S. D., Wesley I. V., Sharma V. K., Johnson T. R. (2010). Yeast Cell-Wall Products Containing β-Glucan Plus Ascorbic Acid Affect Neonatal Bos Taurus Calf Leukocytes and Growth After a Transport Stressor. J. Anim. Sci. 88 (3), 1195–1203. doi: 10.2527/jas.2008-1669
Ewaschuk J. B., Johnson I. R., Madsen K. L., Vasanthan T., Ball R., Field C. J. (2012). Barley-Derived Beta-Glucans Increases Gut Permeability, Ex Vivo Epithelial Cell Binding to E. Coli, and Naive T-Cell Proportions in Weanling Pigs. J. Anim. Sci. 90, 2652–2662. doi: 10.2527/jas.2011-4381
Gaggia F., Mattarelli P., Biavati B. (2010). Probiotics and Prebiotics in Animal Feeding for Safe Food Production. Inter. J. Food Microbiol. 141, S15–S28. doi: 10.1016/j.ijfoodmicro.2010.02.031
Ghosh S., Mehla R. K. (2012). Influence of Dietary Supplementation of Prebiotics (Mannanoligosaccharide) on the Performance of Crossbred Calves. Trop. Anim. Health Product. 44 (3), 617–622. doi: 10.1007/s11250-011-9944-8
Gilliland S. E., Bruce B. B., Bush L. J., Staley T. E. (1980). Comparison of Two Strains of Lactobacillus Acidophilus as Dietary Adjuncts for Young Calves. J. Dairy Sci. 1105, 964–972. doi: 10.3168/jds.S0022-0302(80)83033-5
Harris T. L., Liang Y., Sharon K. P., Yoon I., Scott M. F., Carroll J. A., et al. (2017). Influence of Saccharomyces Cerevisiae Fermentation Products, SmartCare in Milk Replacer and Original XPC in Calf Starter, on the Performance and Health of Preweaned Holstein Calves Challeneged With Salmonella Enterica Seroytpe Typhimurium. J. Dairy Sci. 100 (9), 7154–7164. doi: 10.3168/jds.2016-12509
Heinrichs A. J., Jones C. M., Heinrichs B. S. (2003). Effects of Mannan Oligosaccharides or Antibiotics in Neonatal Diets on Health and Growth of Dairy Calves. J. Dairy Sci. 86, 4064–4069. doi: 10.3168/jds.S0022-0302(03)74018-1
Hill T. M., Bateman H. G., Aldrich J. M., Schlotterbeck R. L. (2008). Oligosaccharides for Dairy Calves. Prof. Anim. Sci. 24 (5), 460–464. doi: 10.15232/S1080-7446(15)30881-0
Indart M., Cerone S., Esteban E. N., Yaniz G., De, Inza A. G., et al. (2012). Multispecies Multistrain Probiotic Effects on Calves Development and Health. J. Vet. Med. 225–229. doi: 10.4236/ojvm.2012.24035
Isolauri E., Sutas Y., Kankaanpaa P., Arvilommi H., Salmenen S. (2001). Probiotics: Effects on Immunity. Am. J. Clin. Nutr. 73, 444–450. doi: 10.1093/ajcn/73.2.444s
Jatkauskas J., Vrotniakiene V. (2010). Effects of Probiotic Dietary Supplementation on Diarrhoea Patterns, Faecal Microbiota and Performance of Early Weaned Calves. Vet. Med-Czech. 55 (10), 494–503. doi: 10.17221/2939-VETMED
Jenny B. F., Vandijk H. J., Collins J. A. (1991). Performance and Fecal Flora of Calves Fed a Bacillus Subtilis Concentrate. J. Dairy Sci. 74, 1968–1973. doi: 10.3168/jds.S0022-0302(91)78364-1
Jin L., Dong G., Lei G., Zhou J., Zhang S. (2014). Effects of Dietary Supplementation of Glutamine and Mannan Oligosaccharides on Plamsa Endotoxin and Acute Phase Protein Concentrations and Nutrient Digestibility in Finishing Steers. J. Appl. Anim. Res. 42 (2), 160–165. doi: 10.1080/09712119.2013.823863
Kampen A. H., Olsen I., Tollersrud T., Storset A. K., Lund A. (2006). Lymphocyte Subpopulations and Neutrophil Function in Calves During the First 6 Months of Life. Vet. Immunol. Immunopathol. 113, 53–63. doi: 10.1016/j.vetimm.2006.04.001
Keselman H. J., Kowalchuk R. K., Algina J., Lix L. M., Wilcox R. R. (2000). Testing Treatment Effects in Repeated Measures Designs: Trimmed Means and Bootstrapping. British. J. Math. Stat. Psy. 53 (1), 175–191. doi: 10.1348/000711000159286
Kim G. B., Seo Y. M., Kim C. H., Paik I. K. (2010). Effect of Dietary Prebiotic Supplementation on the Performance, Intestinal Microflora, and Immune Response in Broilers. Poult. Sci. 90 (1), 75–82. doi: 10.3382/ps.2010-00732
Lasaro M. A., Salinger N., Zhang J., Wang Y., Zhong Z., Goulian M., et al. (2009). F1C Fimbriae Play an Important Role in Formation and Intestinal Colonization by the Escherichia Coli Commensal Strain Nissle 1917. App. Environ. Microbiol. 75 (1), 246–251. doi: 10.1128/AEM.01144-08
Liang Y. (2018) Doctoral Dissertation, Texas Tech University. Effects of Various Nutritional Supplements on the Development, Innate Immunity, and Gastrointestinal Health of Young Dairy Calves. Chapter II. The Effects of Supplementing Provia® (Bacillus coagulans 6086) or OmniGen-AF® Alone or in Combination on the Growth Performance and Health of Neonatal Holstein Calves. Available at: https://ttu-ir.tdl.org/bitstream/handle/2346/74491/LIANG-DISSERTATION-2018.pdf?sequence=1
Liang Y., Hudson R. E., Ballou M. A. (2020). Supplementing Neonatal Jersey Calves With a Blend of Probiotic Bacteria Improves the Pathophysiological Response to an Oral Salmonella Enterica Serotype Typhmurium Challenge. J. Dairy. Sci. 103, 7351–7363. doi: 10.3168/jds.2019-17480
Malaczewska J., Wojcik R., Jung L., Siwicki A. K. (2010). Effect of Biolex Beta-HP on Selected Parameters of Specific and non-Specific Humoral and Cellular Immunity in Rats. Bulg. Vet. Instit. Pulawy. 54, 75–80.
Ma T., Tu Y., Zhang N., Guo J., Deng K., Zhou Y., et al. (2020). Effects of Dietary Yeast β Glucan on Nutrient Digestibility and Serum Profiles in Pre-Ruminant Holstein Calves. J. Integr. Ag. 14 (4), 749–757. doi: 10.1016/j.livsci.2020.104170
Meale S. J., Chaucheyras-Durand F., Berends H., Guan L. L., Steele M. A. (2017). From Pre- to Postweaning: Transformation of the Young Calf’s Gastrointestinal Tract. J. Dairy Sci. 100 (7), 5984–5995. doi: 10.3168/jds.2016-12474
Mokhber-Dezfouli M. R., Tajik P., Bolourchi M., Mahouzadeh H. (2007). Effects of Probiotics Supplementation in Daily Milk Intake of Newborn Calves on Body Weight Gain, Body Height, Diarrhea Occurrence and Health Condition. Pak. J. Biol. Sci. 10 (18), 3136–3140. doi: 10.3923/pjbs.2007.3136.3140
Morrison S. J., Dawson S., Carson A. F. (2010). The Effects of Mannan Oligosaccharide and Streptococcous Faecium Addition to Milk Replacer on Calf Health and Performance. Lives. Sci. 131 (2), 292–296. doi: 10.1016/j.livsci.2010.04.002
Murray C. F., Windeyer M. C., Duffield T. F., Haley D. B., Pearl D. L., Waalderbosm K. M., et al. (2014). Associations of Serum Haptoglobin in Newborn Dairy Calves With Health, Growth, and Mortality Up to 4 Months of Age. J. Dairy Sci. 97 (12), 7844–7855. doi: 10.3168/jds.2014-8465
NAHMS (2014). Dairy 2014: Dairy Cattle Management Practices in the United States 2014 (Fort Collins, CO: USDA:APHIS: VS:CEAH, National Animal Health Monitoring Systems).
Nargeskhani A., Dabiri N., Esmaeilkhanian S., Alipour M. M., Bojarpour M. (2010). Effects of Mannanoligosaccharide Glucan or Antibiotics on Health and Performance of Dairy Calves. Anim. Nutr. Feed Techn. 10, 29–36.
Novak M., Vetvicka V. (2009). Glucans as Biological Response Modifiers. Endocr. Metab. Immune Disord. Drug Targets 9 (800), 67–75. doi: 10.2174/187153009787582423
Quezada V. C., Babatunde B. B., Frankel T. L. (2007). Effect of Mannan-Oligosaccharides on the Mucosal Immune System of Dairy Calves. J. Anim. Sci. 85 (Suppl.1),211.
Rendon M., Saldana Z., Erdem A. L., Monteiro-Neto V., Puente J. L., Giron J. A. (2007). Commensal and Pathogenogenic Escherichia Coli Use a Common Pilus Adherance Factor for Epithelial Colonization. Proc. Natl. Acad. Sci. 104 (25), 10637–10642. doi: 10.1073/pnas.0704104104
Richeson J. T., Kegley E. B., Powell J. G., Schaut R. G., Sacco R. E., Ridpath J. F. (2013). Weaning Management of Newly Received Beef Calves With or Without Continuous Exposure to a Persistently Infected Bovine Viral Diarrheal Virus Pen Mate: Effects on Rectal Temperature and Serum Proinflammator Cytokine and Haptoglobin Concentrations. J. Anim. Sci. 91 (3), 1400–1408. doi: 10.2527/jas.2011-4875
Riddell J. B., Gallegos A. J., Harmon D. L., McLeod K. R. (2008). Addition of a Bacillus Based Probiotic to the Diet of Preruminant Calves: Influence on Growth, Health, and Blood Parameters. Intl. J. Appl. Res. Vet. Med. 8 (1), 78–85.
Roodposhti P. M., Dabiri N. (2012). Effects of Probiotic and Prebiotic on Average Daily Gain, Fecal Shedding of Escherichia Coli, and Immune System Status in Newborn Female Calves. Asian-Australian J. Anim. Sci. 25 (9), 1255–1261. doi: 10.5713/ajas.2011.11312
Sandvik A., Wang Y. Y., Morton H. C., Aasen A. O., Wang J. E., Johansen F. E. (2007). Oral and Systemic Administration of β-Glucan Protects Against Lipopolysaccharide-Induced Shock and Organ Injury in Rats. Clin. Exp. Immunol. 148 (1), 168–177. doi: 10.1111/j.1365-2249.2006.03320.x
Stier H., Ebbeskotte V., Gruenwald J. (2014). Immune-Modulatory Effects of Dietary Yeast Beta-1,3/1,6-D-Glucan. Nutr. J. 13 (1), 1–9. doi: 10.1186/1475-2891-13-38
Sun P., Wang J. Q., Zhang H. T. (2010). Effects of Bacillus Subtilis Natto on Performance and Immune Function of Preweaning Calves. J. Dairy Sci. 93 (12), 5851–5855. doi: 10.3168/jds.2010-3263
Swanson K. S., Grieshop C. M., Flickinger E., Bauer L. L., Healy H.-P., Dawson K., et al. (2002). Supplemental Fructooligosaccharides and Mannanoligosaccharides Influence Immune Function, Ileal and Total Tract Nutrient Digestibilities, Microbial Populations and Concentrations of Protein Catabolites in the Large Bowel of Dogs. J. Nutr. 132 (5), 980–989. doi: 10.1093/jn/132.12.3721
Terre M., Calvo M. A., Adelantado C., Kocher A., Bacha A. (2007). Effects of Mannan Oligosaccharides on Performance and Microorganism Fecal Counts of Calves Following an Enhanced-Growth Feeding Program. Anim. Feed. Sci. Technol. 137, 115–125. doi: 10.1016/j.anifeedsci.2006.11.009
Timmerman H. M., Mulder L., Everts H., van Espen D. C., van der Wal E., Klaassen G., et al. (2005). Health and Growth of Veal Calves Fed Milk Replacers With or Without Probiotics. J. Dairy Sci. 88, 2154–2165. doi: 10.3168/jds.s0022-0302(05)72891-5
Tóth S., Kovács M., Bóta B., Szabó-Fodor J., Bakos G., Fébel H. (2020). Effect of Mannanoligosaccharides (MOS) and Inulin Supplementation on the Performance and Certain Physiological Parameters of Calves Reared on Milk Replacer. J.of Appl. Anim. Res. 48 (1), 228–234. doi: 10.1080/09712119.2020.1770096
Wojcik R., Malaczewska J., Trapkowska S., Siwicki A. K. (2007). Influence of β-1,3/1,6-D-Glucan on non-Specific Cellular Defence Mechanisms in Lambs. Zespol. Mikrobiol. i Immunol. 63 (1), 84–86.
Keywords: calf, colostrum, immune, probiotics, yeast
Citation: Davis EM, Liang Y, Batchelder TA, Sellers MD and Ballou MA (2022) Impacts of Various Nutraceutical Milk Replacer Supplements on the Health and Performance of High-Risk Holstein Calves. Front. Anim. Sci. 3:872786. doi: 10.3389/fanim.2022.872786
Received: 10 February 2022; Accepted: 04 May 2022;
Published: 09 June 2022.
Edited by:
Carla Maris Machado Bittar, University of São Paulo, BrazilReviewed by:
Antonella Santillo, University of Foggia, ItalyViviani Gomes, University of São Paulo, Brazil
Copyright © 2022 Davis, Liang, Batchelder, Sellers and Ballou. This is an open-access article distributed under the terms of the Creative Commons Attribution License (CC BY). The use, distribution or reproduction in other forums is permitted, provided the original author(s) and the copyright owner(s) are credited and that the original publication in this journal is cited, in accordance with accepted academic practice. No use, distribution or reproduction is permitted which does not comply with these terms.
*Correspondence: Michael A. Ballou, bWljaGFlbC5iYWxsb3VAdHR1LmVkdQ==
 Emily M. Davis
 Yu Liang1