 Hamideh Keshavarzi1*
 Caroline Lee1
 Tim Dyall1Mark Johnson2
 David Abbott2Sue Belson1Wei Ni2
 Dana L. M. Campbell1
- 1Agriculture and Food, Commonwealth Scientific and Industrial Research Organization (CSIRO), Armidale, NSW, Australia
- 2Data61, Commonwealth Scientific and Industrial Research Organization (CSIRO), Marsfield, NSW, Australia
Sheep are gregarious animals that can form close inter-individual relationships. Social bonds are affected by environmental and within-animal factors, but there is limited understanding of individual factors that influence social relationships, in part due to the challenges of accurately measuring individual social proximity within a group. This study used geospatially precise RTK-GNSS localization devices (Real-Time-Kinematic Global Navigation Satellite System) to evaluate social proximity between individuals with different personality traits in small sheep flocks. First, unsupervised clustering algorithms were used to categorize 78 individual Merino sheep (from a research flock of 108 grazed together for 11 months prior) based on their behavior measured in four behavioral tests: arena, novel object, flight speed, and isolation box. Sixty-five sheep were then categorized into five cohorts of 13 individuals each (clustered into three bold, six bold/fearful, and four fearful animals per cohort). Bold/fearful animals were bold toward a novel object but fearful of a human. Sheep within a single cohort were released into a 0.70 Ha test paddock with RTK-GNSS devices attached to their backs for 3 days to monitor relative positions. All cohorts were tested sequentially over a 5-week period. Social network analyses of GNSS locational data with a distance threshold of up to 30 m for all cohorts together showed no significant effect of personality traits (P = 0.11). There were, however, some significant but inconsistent differences in distances based on personality traits within separate cohorts [i.e., cohorts 1, 3, 4 (P ≤ 0.02), cohorts 2, 5 (P ≥ 0.44)]. When GNSS locational data were analyzed with a distance threshold of up to 2 m (day 2 excluded from all cohorts due to missing values), there was a significant effect of personality traits (P = 0.01) across all cohorts combined. The bold animals showed greater distances from each other relative to their distances from fearful or bold/fearful individuals. Additionally, regardless of personality traits, the average distance between animals decreased 2.2 m over the 3 test days. Social interactions in sheep flocks may be influenced by personality traits of fearfulness and boldness, but further research with larger numbers of sheep across varying environments is needed.
Introduction
Sheep are a gregarious animal species and can form close inter-individual relationships typically measured by proximity to each other (e.g., Le Pendu et al., 1996; Ozella et al., 2020). The social network and structure in a flock of sheep is affected by different within/between animal factors such as age (Lawrence, 1990; Le Pendu et al., 1996; Doyle et al., 2016; Ozella et al., 2020), maternal associations (Le Pendu et al., 1996; Paganoni et al., 2020), and familiarity (Boissy and Dumont, 2002; Ozella et al., 2020). External environmental factors will also affect how sheep interact socially, including food type during grazing (Yiakoulaki et al., 2019) and weather parameters (Doyle et al., 2016; Ozella et al., 2020). An additional animal-based factor that may affect social relationships is individual differences in behavioral tendencies, animal personalities or temperament (exact terminology varies across studies). Individual sheep may vary in specific aspects of their behavioral repertoire such as degree of boldness/shyness, fearfulness, calmness/anxiousness, aggressiveness, or gregariousness (Bickell et al., 2009; Ramseyer et al., 2009; Beausoleil et al., 2012; Dodd et al., 2012; Hauschildt and Gerken, 2015; Miranda-de la Lama et al., 2019). Shyness and fearfulness are typically synonymous, but the term of choice varies across studies. Collectively, these can all be referred to as “personality traits” which is the term used in the current study. These personality traits are defined as aspects of behavior that can be quantified and show between-individual variation and within-individual consistency (Carter et al., 2013).
Previous studies with sheep have shown as group size increased in an experimental setting, groups of bold sheep split into subgroups sooner than groups of shy sheep (Michelena et al., 2009). Individuals within a group of bold or shy sheep exhibited different grazing patterns related to their propensity for social attraction, with bold sheep more likely to disperse and exploit different grazing patches than shy sheep (Michelena et al., 2010). Similarly, shy sheep were observed to graze closer together and move toward each other more often than bold sheep (Sibbald et al., 2009). Sheep that showed similar vocalization responses to an isolation box behavioral test were observed to spend more time together, indicating a preference for individuals with similar personality traits (Doyle et al., 2016). The personality trait of gregariousness which quantified how frequently individual sheep were in close proximity with others, predicted the degree of behavioral synchronization within the flock (Hauschildt and Gerken, 2015). However, no relationship was found between personality traits of boldness, fearfulness, reactions to a startle stimulus and social positions during group movements (Ramseyer et al., 2009). The evidence to date on personality traits and social behavior within a flock of sheep is limited, which may result from the logistical challenges of measuring the social proximity of individuals within a group. The increasing development of new on-animal sensor technologies improves the ability to obtain accurate positional data on livestock animals to detect and quantify social relationships.
To date, on-animal sensor technologies have been used in cattle and sheep to quantify individual proximities within groups to determine affiliative and/or agonistic relationships with varying degrees of accuracy (Boyland et al., 2016; Doyle et al., 2016; Xu et al., 2020). These technologies include proximity loggers (Drewe et al., 2012; Doyle et al., 2016), ultra-wideband positional loggers (Ren et al., 2020; Rocha et al., 2020), and GPS devices (Dumont et al., 2005; Bailey et al., 2018) and have been applied across a range of different group-housed situations. New RTK-GNSS (Real-Time-Kinematic Global Navigation Satellite System) prototype sensor devices were recently validated for use on sheep in a small paddock setting (Keshavarzi et al., 2021). In open conditions with good satellite visibility, these devices increase the accuracy of positional data to within tens of centimeters. This increased precision improves the ability to detect social proximity and interactions between individuals for accurate social network analyses. In the current study, unsupervised clustering algorithms were applied to categorize individuals' personality traits into sub-groups based on their behavioral responses measured across four behavioral tests: arena test, novel object test, isolation box test, and flight speed test. Validated RTK sensor devices (Keshavarzi et al., 2021) were deployed on animals to collect GNSS positional data for social network analysis and estimation of the social distance to determine how individual differences in personality traits influence group interactions. Based on previous research (Michelena et al., 2009; Sibbald et al., 2009) it was predicted that sheep with similar personality traits would show distinct differences in their relative social distances with more fearful sheep expected to be closer to each other than bold sheep. The term “fearful” was selected for the reporting of the current study with the synonymous term “shy” used where appropriate in the text to match the selected term of previous research studies.
Materials and Methods
Ethical Statement
The experiment was approved by the CSIRO FD McMaster Laboratory Chiswick Animal Ethics Committee (ARA 20-14).
Clustering Animals Based on Their Behaviors
Animals and Experimental Protocol
In this experiment, a total of 78 2-year-old Merino wethers (average body weight of 48.27 ± 5.61 kg) were used to characterize individual differences in personality traits. The animals were selected based on weight (heaviest and lightest were excluded) from a research flock of 108 sheep located at the Commonwealth Scientific and Industrial Research Organization (CSIRO) Chiswick Research Station (Armidale, NSW, Australia) that were kept together at pasture for ~11 months and were visually assessed to be healthy before experimentation. Across 4 consecutive days (August 2020, winter season), animals were individually tested in four behavioral tests as described below.
Arena Test
The arena test is a conflict test between two conflicting motivations (toward flock-mates and avoidance of a motionless human), as described by Beausoleil et al. (2005). The arena test protocol used in our study is described in more detail by Marini et al. (2019). Briefly, individual sheep were tested in a 7 × 3 m outdoor arena for 3 min. The same unfamiliar human each time stood in front of a pen of three familiar flockmates at one end of the arena (Figure 1A) to act as conflict and attractant stimuli for the test sheep respectively; behaviors were recorded by both video cameras (Sony Handycam, HDR-XR260E, Sony Electronics Inc., Tokyo, Japan) and the human in the arena. Behaviors manually recorded by the human in the arena and the attendant outside the arena included the number of vocalizations, time to first sniff the human, time to first sniff the flockmates, foot stamps (lifts the foot and stamps it back down on the ground), and the number of approaches to the human. Behaviors recorded from the video using The Observer XT 12.0 (Noldus Information Technology, Wageningen, The Netherlands) included the number of zones crossed, zones entered (the maximum number of zones out of seven that they entered), zone in which the most time was spent, and zone score. Zone score quantified the total time spent near the human and other sheep versus other zones and was estimated by multiplying the total duration spent in zone 1 by 0.1, duration in zone 2 by 0.2, 3 by 0.3, etc., with the weighted duration then summed to calculate the total zone score, which ranged from 18 (0.1*180 if the sheep spent the entire test duration in zone 1) to 126 (0.7*180 if the sheep spent the whole test duration in zone 7). A total of nine behavioral measures were obtained from this test.
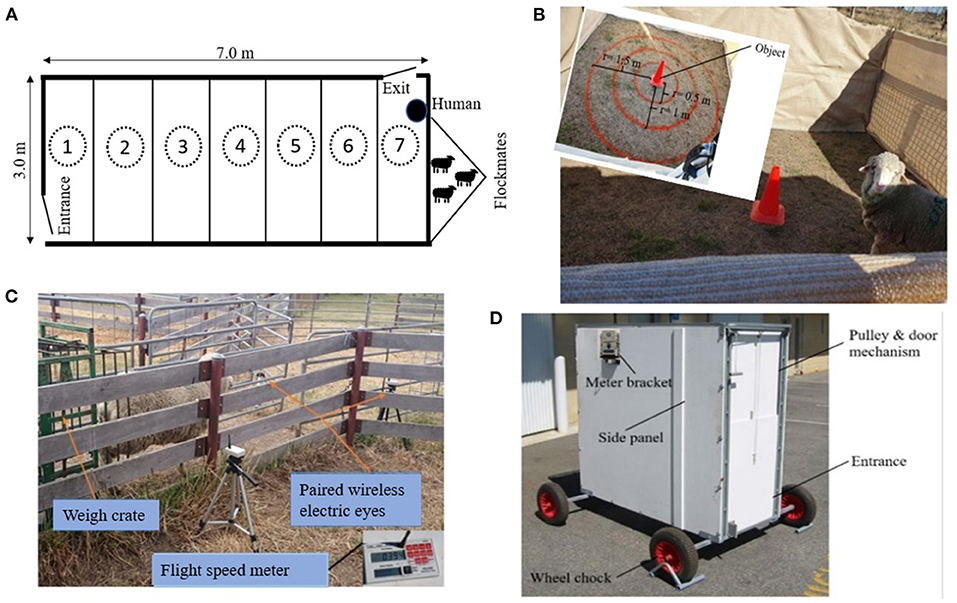
Figure 1. A schematic of the behavioral tests including: (A) arena test, (B) novel object test, (C) flight speed test, and (D) isolation box test.
Novel Object Test
The novel object test measures the fear of novelty, and its use in our study is described in more detail by Verbeek et al. (2012). Individual sheep were placed in a 4 × 4 m opaque arena with an unfamiliar traffic cone at the center for 3 min (Figure 1B) and their behavior was video-recorded (Sony Handycam, HDR-XR260E, Sony Electronics Inc., Tokyo, Japan). The sheep were unfamiliar with the arena and thus this test measured fear of both the environment and object novelty. The arena was divided into four circular zones. The number of zones crossed, and latency to sniff the object were recorded using The Observer XT 12.0 (Noldus Information Technology, Wageningen, The Netherlands). Number of vocalizations were recorded live by an observer sitting beside the opaque arena. A total of three behavioral measures were obtained from this test.
Flight Speed Test
The flight speed test measures the exit speed of a sheep after release from a crush. Infrared sensors (Ruddweigh Australia Pty Ltd., Guyra, Australia) electronically recorded the time taken for the sheep to traverse a fixed distance of 2 m after exiting a crush into a holding yard (Figure 1C). One behavioral measure was obtained from this test.
Isolation Box Test
The isolation box test is a fear-eliciting situation and measures behavioral agitation. The isolation box test was an enclosed wooden box (1.5 m × 50 cm × 2 m) that sheep were placed in for 30 s (Figure 1D). The box comprised an entrance and exit with a stainless-steel pulley and cleat to open the doors. Rubber wheels were fixed to an axle and bolted to the bottom of the box. The agitation level was measured by a meter attached to the side of the box which produces a numeric score (up to 100) based on movement vibrations made by the animal. The agitation scores were manually recorded and number of vocalizations were counted by a human sitting near the box during the test. Behavior within the box was also video recorded (Sony Handycam, HDR-XR260E, Sony Electronics Inc., Tokyo, Japan) to identify freezing behavior (sheep stands completely still without any body or head movement) in sheep with agitation scores of <30. A total of three behavioral measures were obtained from this test.
Clustering
The purpose of clustering in this study was to categorize animals into similar groups in terms of personality traits based on their responses in the four behavioral tests. This would then enable assessment of social interactions between sheep in different personality trait categories (i.e., clusters). To this end, we used two unsupervised machine learning algorithms, namely k-means and hierarchical clustering. Clustering of individuals was based on seven traits identified from the total of 16 measured across all the behavioral tests in which animals showed comparatively more variation (Table 1). The hierarchical clustering algorithm was implemented in R statistical software (R Core Team, 2018) using the function “hclust” with the Ward's method. For this purpose, first, the data were normalized and the distance matrix between the points was then calculated using the Euclidean method. For building the trees and creating the clusters, a Ward's method was used which creates groups so that the variance is minimized within clusters. The trees were then plotted using the “plot” function in R (R Core Team, 2018). The K-means algorithm was also used to classify the animals into subgroups. This technique divides N observations with P variables) into K clusters so that the within-cluster sum of squares is minimized (Jin and Han, 2011). The number of clusters was k = 3 so that we had the optimal total within-cluster sum of squares, as well as distinct groups of animals as the obtained results show (Figures 2A,B).
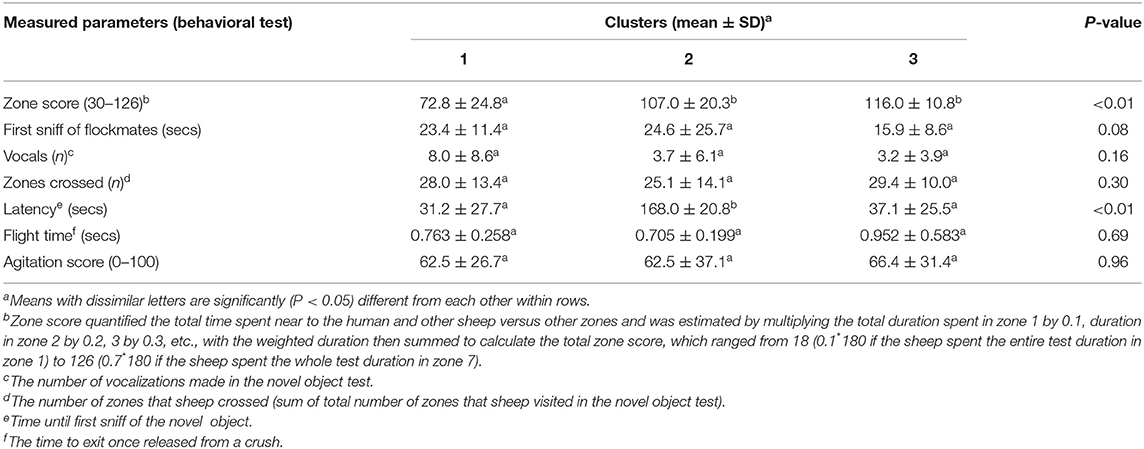
Table 1. Mean (± standard deviation) of the measured parameters of sheep behavior in different clusters.
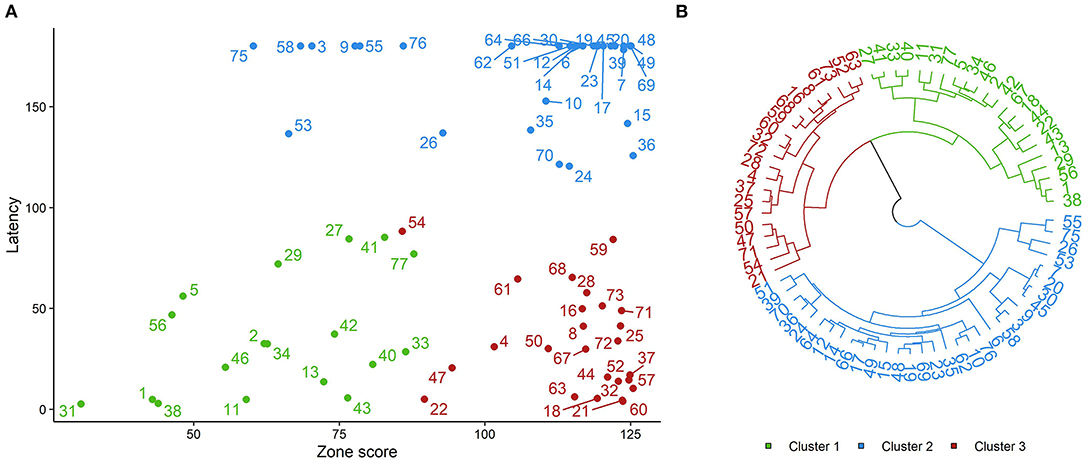
Figure 2. Results of sheep classification using K-means (A) and Hierarchical clustering (B) based of selected variables from four behavioral tests. Individuals with the same color belong to the same cluster. Latency was defined as time (secs) to make first contact with the novel object. Zone score quantified the total time spent near the human and other sheep versus other zones (for a full description of the zone score calculation see Arena Test).
The differences between extracted clusters were then statistically analyzed using separate Kruskal–Wallis tests applied to each of the seven behavioral variables followed by post-hoc Nemenyi tests to identify the personality traits associated with each cluster. Results of the Kruskal–Wallis tests (Table 1) demonstrated that latency to sniff the object (novel object test) and zone score (arena test) were the most significant factors to classify the animals. Based on these results (Table 1), animals in each cluster were identified as: “bold” animals (Cluster 1), “fearful” animals (Cluster 2), and “bold/fearful:” bold toward a novel object but fearful of a human (Cluster 3).
Social Distance and Network
A previous study validated the accuracy of RTK rovers to measure the geospatial positions of individuals in a group of sheep (Keshavarzi et al., 2021). The project showed that the RTK rovers had a high geospatial accuracy of ~20 cm to track the sheep movements. The data generated enabled construction of social networks of animals in the group to show the affinity of individuals to others.
Animals and RTK Rovers
Following the classification of animals based on behavioral tests conducted in late August (2020), the remaining portion of the study was conducted during September and October 2020 (spring) at the Chiswick Research Station. The animals had no previous experience with wearing RTK rovers. Initially, the plan was to test 75 sheep (15 per cohort), but due to hardware problems, only 13 RTK rovers were available for use in the trial. Therefore, a total of 65 sheep from the behavioral testing phase were placed into five cohorts of 13 animals. Selection of 65 sheep out of 75 was firstly based on the animals being in the same clusters across both clustering algorithms (see Clustering), with some individuals then randomly removed. The proportion of animals (based on the cluster analysis results) in each cohort were 3:6:4 from clusters 1, 2, and 3, respectively. Each cohort underwent 2 days of habituation followed by 3 test days over a consecutive five-day period. The first habituation day involved introducing the cohort to the test paddock (~100 m × 70 m). The paddock was estimated to have ~2,500 kg DM/ha of pasture available and water available at the NE and SW corners of the paddock. The second habituation day involved attaching a dog harness to each sheep (Comfy Harness, size 8, 84–120 cm, Company of Animals, Surrey, UK). For ease of checking and identification, each sheep was also numbered with colored wool marker (Heiniger Shearing Supplies, Bibra Lake, WA, Australia) that matched different colored antennas on the RTK rovers. The 3 test days then commenced by fitting an RTK rover to the dog harness and securing it onto the back of the sheep using cable ties (Figure 3). Three days were selected to align with the battery capacity of the devices.
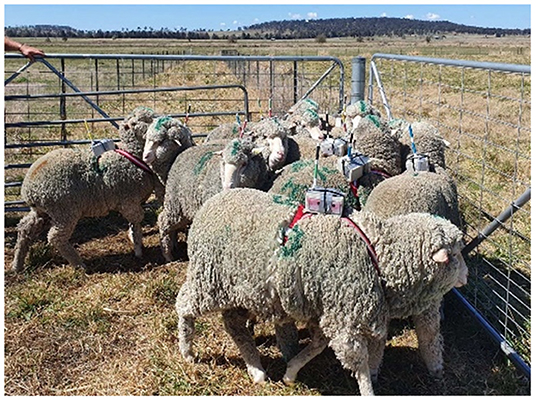
Figure 3. RTK rovers fitted on the backs of sheep.
For each cohort, the devices were attached to the animals on Wednesday morning at 08:30 and then removed on Friday afternoon at 14:30 after 3 days of testing. The device continually recorded the GNSS location data throughout the 3 study days with a one-second sampling rate. Sheep were visually checked four times daily during testing days to ensure the devices remained in position. If a device did slip to the side, all animals in the cohort were walked into the yards near the test paddock to adjust the slipped device. Across all cohorts, animals were brought in a total of 14 times to readjust the position of 35 RTK rovers. Animals were walked back to the test paddock after 15 min on average for all 14 times (data recorded during this time were removed from the analyses). On day 1 of the experiment (habituation day), the reference base station was fixed in the middle of the paddock, and its location was determined from GNSS averaging. Further details on the system set-up and validation can be found in Keshavarzi et al. (2021). The process of habituation and RTK rover data collection was continued for each group from Monday till Friday for a total of 5 weeks until all five cohorts had completed testing. The average minimum, overall, and maximum temperatures across the trial period for each cohort based on weather data collected directly at the Chiswick site were as follows: cohort 1; mean ± SEM min: 4.4 ± 1.1°C, avg: 12.0 ± 0.4°C, max: 20.4 ± 0.9°C, cohort 2; mean ± SEM min: −0.4 ± 1.3°C, avg: 9.2 ± 1.7°C, max: 17.1 ± 1.9°C, cohort 3; mean ± SEM min: 8.0 ± 3.0°C, avg: 15.2 ± 2.3°C, max: 22.4 ± 2.5°C, cohort 4; mean ± SEM min: 3.7± 0.2°C, avg: 12.9 ± 1.6°C, max: 22.1 ± 1.5°C, cohort 5; mean ± SEM min: 9.1 ± 0.9°C, avg: 14.8 ± 1.6°C, max: 21.5 ± 3.4°C.
GNSS Data and Calculation of the Social Distance Between Animals
It was hypothesized that animals with the same personality traits would show distinct differences in their relative social distances, with fearful sheep preferring to remain closer to other fearful sheep and bold sheep being farther apart from each other. For this purpose, GNSS data for all five cohorts within the 3 data collection days were used to estimate the distance between pairs of individuals. From all 13 devices (A, B, C, D, E, F, G, H, J, K, L, M, and N) across 3 test days, the performance of devices was good; however, there were some partial failures [sensor G (cohort 3- 2nd day in the afternoon, and 3rd day in the morning), sensor H (cohort 4- day 2 and 3), sensor M (cohort 4- day 2 and 3), sensor J (cohort 1- day 1 and 2; cohort 2- all 3 days; cohort 3- day 2 and 3; cohort 2- all 3 days)] and total failure for sensor N. Estimating the distance was performed using the daytime data (based on sunset and sunrise in Armidale, NSW, Australia) to ensure visual cues were available as necessary for identifying flock mates. The initial frequency of recorded data was every second. However, it was impossible to compute continuous 1 s data due to the processing power of the PC, so the data were sub-sampled at every 2 s. With three groups (clusters: C) of animals based on having similar personality traits, there were six possible combinations to measure the distance, including the distance between animals with the same personality traits (C1-C1, C2-C2, and C3-C3) as well as animals with different personality traits (C1-C2, C1-C3, and C2-C3). The distance between all groups (clusters) of animals was estimated using the function of “edge_dist” in the “spatsoc package” (Robitaille et al., 2019) while considering threshold distances of up to 2 m and up to 30 m within a time interval of 10 min. The 2 m distance was chosen to capture socially relevant interactions between individuals (Haddadi et al., 2011). The 30 m maximum distance threshold was set based on the paddock size to capture almost all possible neighbors but still included distances as small as 20 cm. The final dataset contained 5,184 observations for all cohorts across 3 test days.
The analysis of variance (ANOVA) method was used to analyze the distance data. Prior to analysis, initial datasets were edited to remove the outliers (11 observations) based on the qqplot created in R. Data were tested for normality using visual assessment of Q–Q plots and the Shapiro-Wilk test. Since Q-Q plots data were not normally distributed, data were orderNorm transformed to meet the normality assumptions of ANOVA (several methods were applied with orderNorm selected as the best option to normalize the data). First, the effect of clusters on social distance was investigated by considering all the data of all cohorts together for both up to 2 m and up to 30 m. The model included the effects of cohort, day, and time group for this analysis. In the 2 m dataset, there was a high proportion of missing data for cohorts 4 and 5 on the second day (68 and 50 out of 149 10-min time intervals for C1-C1 and C3-C3, respectively), as animals were not detected within up to 2 m from each other (they were farther apart), thus, the final dataset was limited to data from the first and the third day only. The analysis was then performed separately for each cohort with the 30 m distance dataset while considering the effect of the animal's cluster. The distance between animals across the 3 study days was estimated based on the data of all cohorts together with the 30 m distance dataset. The “lsmeans” function in the “lsmeans” package (Lenth, 2016) was used to estimate the least squares means for all analyses. The clusters were compared using Tukey tests where differences were considered to be significant at P < 0.05.
Social Network
To further visually display the animal distance results, the position of individuals relative to each other within cohort 1 were examined based on (1) social network analyses of GNSS locational data and (2) plotted GNSS locations of animals. The first test day of cohort 1 only was selected as there were higher and significant distances (as assessed by an ANOVA) between sheep in different clusters to facilitate distinguishing individual sheep positions relative to each other. The distance between individuals was calculated using the “spatsoc” package (Robitaille et al., 2019) during one-hour periods (8 h in total) by considering a threshold distance of up to 30 m. The social network graph was then drawn using the package of “ggplot2” (Wickham, 2016). The width of the edges in the graph was set based on the distance between individuals so that the width increased as the distance between dyads increased. The location of individuals was plotted based on GNSS positional data using the package of “ggplot2” (Wickham, 2016). The movement pattern for each cohort across the 3 study days was also plotted based on GNSS positional data using the “ggplot” function in the package “ggplot2” (Wickham, 2016).
Results
Overall, estimated social distance (up to 30 m) for all cohorts combined across the 3 test days showed that there was no statistically significant difference in distances across all six cluster combinations (P = 0.11). The average distance across all cohorts for individuals within the same clusters were as follows: cluster 1 - bold, average distance = 8.43 ± 4.65 m; cluster 2 - fearful, average distance = 8.13 ± 4.41 m; cluster 3 - bold/fearful, average distance = 8.10 ± 4.50 m. With up to 2 m distance, the difference in social distance was significant (F5,2592 = 2.82, P = 0.01) across all 6 cluster combinations. Animals with the same fearful or bold personality traits showed similar social distances across the cluster types (C1-C2A; C1-C3A; C3-C3AB; C2-C3AB; C2-C2AB; C1-C1B), but bold animals (C1) stayed farther away from other bold animals compared to their distances from the fearful (C2) and bold/fearful (C3) animals (Figure 4). When cohorts were analyzed individually for up to 30 m distance, there were some significant but inconsistent differences within cohorts [i.e., cohort 1 (F5,871 = 3.63, P = 0.002), cohort 2 (P = 0.44), cohort 3 (F5,967 = 3.20, P = 0.007), cohort 4 (F5,970 = 2.55, P = 0.02), and cohort 5 (P = 0.73), Table 2].
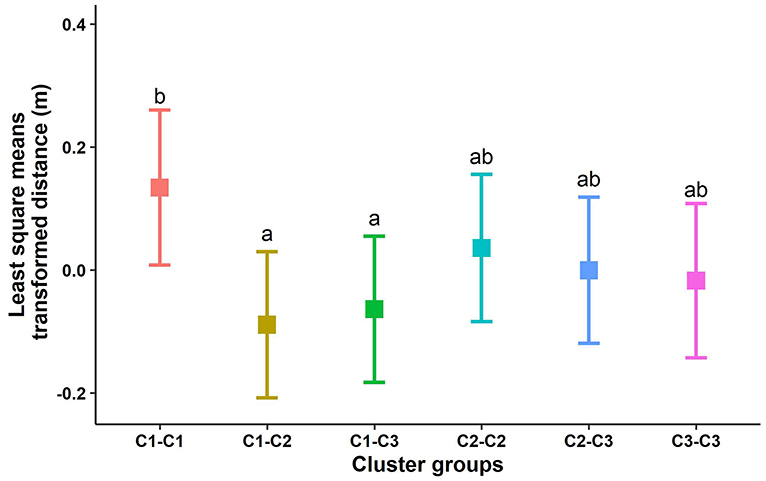
Figure 4. Box plot of the distance between animals with different personality traits with a threshold distance of up to 2 m. Dissimilar letters indicate significant differences based on a Tukey test with α at 0.05. C1, cluster 1 (bold animals); C2, cluster 2 (fearful animals); and C3, cluster 3 [bold toward a novel object but fearful of a human (bold/fearful)].
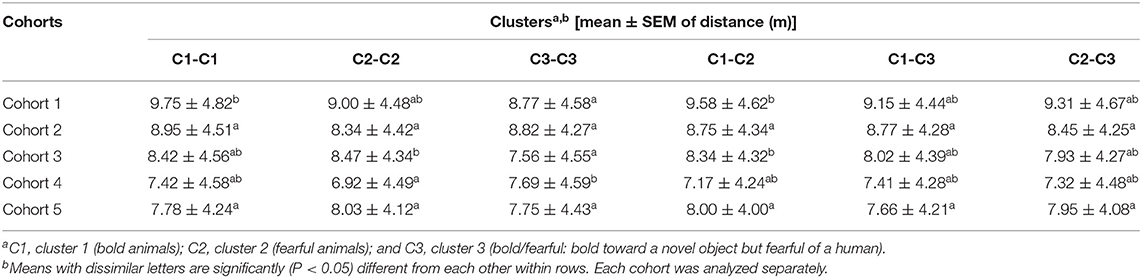
Table 2. Mean (± standard error of the mean) of the distance between animals with different personality traits in different cohorts using up to 30 m distance data.
Regardless of an individual's personality trait, the distance between animals decreased over the study days (F2,5057 = 108.04, P < 0.01). On average, individuals were 2.2 m closer on the last day of the experiment (average distance = 6.91 ± 3.94) compared with the first day (average distance = 9.11 ± 4.65).
The plotted relative positions of animals in the paddock based on GNSS positional data during 8 h on the first day of study for cohort 1 visually confirm the significant social distance result (cluster 1-bold, average distance = 13.10 ± 3.52 m; cluster 2- fearful, average distance = 11.00 ± 3.49 m; cluster 3 - bold/fearful, average distance = 11.40 ± 3.43 m, F5,224 = 8.73, P = 0.01) in which bold animals preferred to stay further away from each other and other animals in the group (Figure 5). The plotted relative positions of animals based on GNSS positional data was also similar to corresponding results from the social network analysis in which a thinner edge width indicates a closer distance (Figure 5). Supplementary Figure 1 displays the movement patterns of individual sheep within each cohort across each hour of each study day.
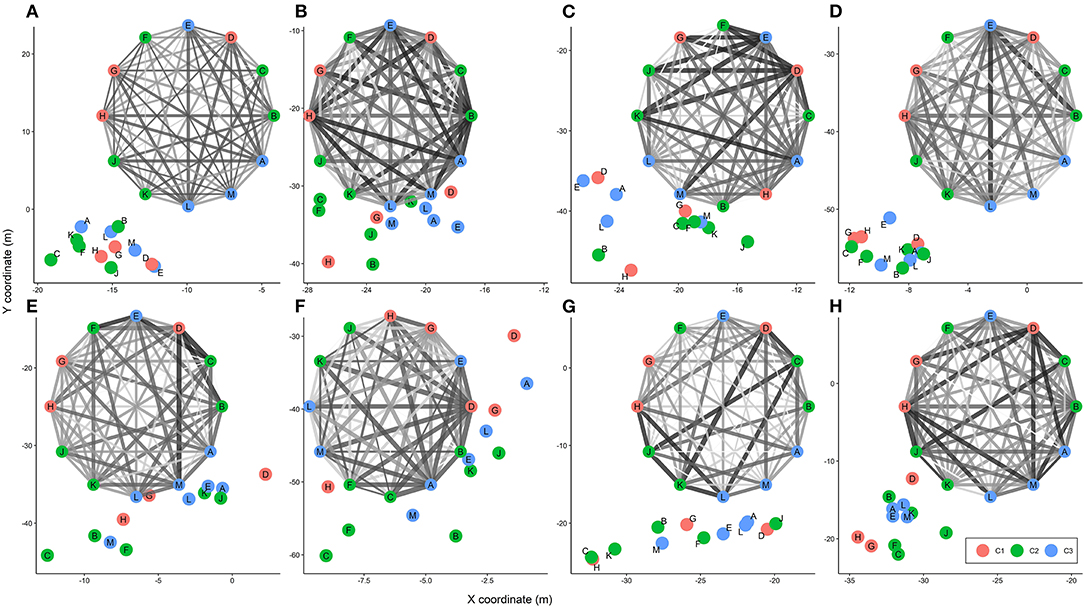
Figure 5. Animal social groups for 8 h [(A–H)] of the first study day based on social network analysis and GNSS positional data in cohort 1. C1, cluster 1 (bold animals); C2, cluster 2 (fearful animals); and C3, cluster 3 [bold toward a novel object but fearful of a human (bold/fearful)]. In both the social network and GNSS positional plots, letters in the vertices (nodes) refer to individual animals and edges show the distance between two animals where a thinner (lighter) line corresponds to a shorter distance and vice versa.
Discussion
This study aimed to determine how sheep with different personality traits of boldness and fearfulness interact in their social group. Distances between individuals were assessed across the day in an experimental grazing paddock using validated RTK rovers that provided precise positional tracking. Across all tested cohorts of sheep combined and considering a threshold distance of up to 30 m, no significant differences were detected in distances between individuals across all six cluster combinations of similar and dissimilar personality traits. However, some differences were observed across specific cohorts showing personality traits did affect social distances, just not in a consistent manner. With a threshold distance of up to 2 m, the bold animals showed greater distances from each other than they did from fearful or bold/fearful individuals.
This study was able to cluster animals within the larger source flock into three classes based on their reactions in behavioral tests including fearful, bold, and fearful of humans but bold in the presence of a novel object to provide further supporting evidence for individual differences in sheep personality traits (Sibbald et al., 2009; Miranda-de la Lama et al., 2019). However, the subsequent effect of these personality traits on interactions within their smaller groups was less clear. Based on previous research, it was predicted that sheep with similar personality traits would show distinct differences in their relative social distances. Specifically, more fearful sheep are more likely to group, and bolder sheep more likely to disperse or be at farther distances from each other more frequently (Michelena et al., 2009, 2010; Sibbald et al., 2009). These predicted differences in inter-individual distances could result if sheep with fearful or shy personality traits were more likely to seek out other sheep with similar traits, or if fearful/shy sheep may also be more gregarious, in which case they would be mutually attracted to be closer to each other. Sheep by nature are gregarious animals, but they exhibit inter-individual differences in degree of gregariousness (Hauschildt and Gerken, 2015; Miranda-de la Lama et al., 2019). The significant distance differences among personality trait groups within individual cohorts using distances of up to 30 m (all interactions analyzed) were inconsistent. However, the differences seen with the up to 2 m dataset (only the closer interactions analyzed) somewhat aligned with predictions where the bold animals showed greater distances from each other than from the fearful and bold/fearful sheep.
The lack of consistent personality trait effects on social distances in the current study may have been a result of the animals with different personality traits being grazed together in the same cohort during the three-day test period. While Doyle et al. (2016) did show that animals within a flock were more likely to associate with each other if they had similar reactions during a behavioral test, other studies comparing behaviors between bold and shy sheep have compared group activity in groups of exclusively bold or exclusively shy sheep (not grazed together during testing i.e., Michelena et al., 2009, 2010; Sibbald et al., 2009). Other research with sheep of different personality types within the same group did not find effects of personality traits on individuals' relative positions within a flock during group movements (Ramseyer et al., 2009). While bold animals may have been less motivated to remain close to each other relative to fearful sheep, the fearful sheep could have been attracted to all other sheep due to a higher degree of gregariousness, thus minimizing the detection of specific personality trait-based differences. Further analyses of interactions when individuals were close to each other to identify both attraction and repulsion behaviors (Xu et al., 2020) may give further insight into whether fearful animals sought out contact and if, conversely, bold animals avoided it. Additionally, sheep breeds differ in sociability (Hinch, 2017) and the animals in this study predominantly moved cohesively around the paddock (Supplementary Figure 1) which may have minimized personality trait effects on dyadic associations. It is also possible that the experimental testing situation did not sufficiently trigger differences in social interactions. For example, if there was minimal difference in available quality or quantity of the sward across the paddock, this could have reduced the chances of bold animals moving away from other individuals. The test paddock was observed to have a relatively even distribution of pasture. However, no formal measures were taken, and available pasture may have been different between the first and last cohorts taking both grazing and pasture growth across time into account. Different experimental testing conditions such as predator threats may have also resulted in greater differentiation in the comparative inter-individual distances between personality trait groups.
The personality traits identified by cluster analysis of the four behavioral tests did not have consistent significant effects on social distances, but regardless of these different traits, individuals were observed to be closer to each other on the last day of the trial compared to the first day. This suggests that as animals became more familiar with each other their inter-individual distances decreased. This is consistent with previous studies that have shown sheep will recognize each other and form social bonds with specific individuals (Kendrick et al., 2001; Ozella et al., 2020) and that familiar individuals are more likely to be in close proximity to each other (Boissy and Dumont, 2002; Ozella et al., 2020). This increased familiarity across time may have also negated any effects of personality type where individuals were all viewed as companions within the group. The movement pattern of animals in each cohort (Supplementary Figure 1) across all 3 study days confirms that regardless of their personality, individuals preferred to stay close to each other. Further testing with larger group sizes over longer periods of time may determine whether sheep with specific personality types are more likely to form subgroups together. However, it is also proposed that as a flock, the presence of both personality types is advantageous for collective grazing behavior (Michelena et al., 2010), where bold sheep disperse to new patches, and shy sheep may crowd to exploit a specific patch (Michelena et al., 2010); thus, subgroup formation may only be transient in time.
While the social distance between individuals did not show consistent effects of personality traits of boldness and fearfulness, additional measures on social interactions in future work may provide insight. Bold individuals may be more likely to initiate group movements, although Ramseyer et al. (2009) did not find evidence to support this. Effects of personality type may become more apparent in different testing situations such as moving to new areas or behavioral transitions (e.g., from resting to grazing). Other behavioral tests that measure additional aspects of personality such as sociability may better explain any variation in preferential social associations. Furthermore, while the arena test has previously been used to characterize behavioral responses to a conflicting situation between social attraction and fear of humans (Beausoleil et al., 2005), it does not differentiate between bold and fearful animals. Adapting well-established tests from other species to sheep is occurring, for example, the startle test (Doyle et al., 2015; Salvin et al., 2020), however further research is still needed. In addition, adaptation of tests from dairy calves to sheep, such as the human approach test (MacKay et al., 2014) may more clearly distinguish bold and fearful animals to provide greater insights into sheep personality. Studying social interactions between individuals with different personality traits could help us to understand the impacts of social groups and whether housing sheep with similar or contrasting personality traits would be more likely to result in beneficial or detrimental consequences for the individuals' welfare. This type of research may also assist with understanding how groups of individuals interact and adapt to specific types of housing systems (Bøe and Færevik, 2003; Schneider et al., 2020), which can have production as well as welfare benefits.
Overall, the personality traits of boldness and fearfulness identified in this study did not substantially affect inter-individual distances in small groups of sheep in experimental paddocks. The high geospatial precision of the RTK devices presents opportunities to explore further factors that can affect sheep social interactions, including detecting potentially more subtle effects. Understanding factors that influence social behavior can improve the management of livestock animals housed in groups.
Data Availability Statement
The raw data supporting the conclusions of this article will be made available by the authors, without undue reservation.
Ethics Statement
The animal study was reviewed and approved by CSIRO FD McMaster Laboratory Chiswick Animal Ethics Committee (ARA 20-14).
Author Contributions
HK, DC, CL, and WN contributed to conception and design of the study. HK, TD, MJ, DA, and SB conducted the animal experiment. HK performed the statistical analyses and wrote the first draft of the manuscript. HK, DC, and CL wrote sections of the manuscript. All authors contributed to manuscript revision, read, and approved the final version.
Funding
This work was funded by the Commonwealth Scientific and Industrial Research Organization (CSIRO; internal funding, URL: www.csiro.au) and HK was supported by a CSIRO Research Plus postdoctoral fellowship.
Conflict of Interest
The authors declare that the research was conducted in the absence of any commercial or financial relationships that could be construed as a potential conflict of interest.
Publisher's Note
All claims expressed in this article are solely those of the authors and do not necessarily represent those of their affiliated organizations, or those of the publisher, the editors and the reviewers. Any product that may be evaluated in this article, or claim that may be made by its manufacturer, is not guaranteed or endorsed by the publisher.
Acknowledgments
The authors are grateful to Troy Kalinowski (CSIRO) and Jim Lea (CSIRO) for their technical support and to Andrew Eichorn (CSIRO) for animal management support.
Supplementary Material
The Supplementary Material for this article can be found online at: https://www.frontiersin.org/articles/10.3389/fanim.2022.872132/full#supplementary-material
References
Bailey, D. W., Trotter, M. G., Knight, C. W., and Thomas, M. G. (2018). Use of GPS tracking collars and accelerometers for rangeland livestock production research. Transl. Anim. Sci. 2, 81–88. doi: 10.1093/tas/txx006
Beausoleil, N. J., Blache, D., Stafford, K. J., Mellor, D. J., and Noble, A. D. L. (2012). Selection for temperament in sheep: domain-general and context-specific traits. Appl. Anim. Behav. Sci. 139, 74–85. doi: 10.1016/j.applanim.2012.02.020
Beausoleil, N. J., Stafford, K. J., and Mellor, D. J. (2005). Sheep show more aversion to a dog than to a human in an arena test. Appl. Anim. Behav. Sci. 91, 219–232. doi: 10.1016/j.applanim.2004.10.008
Bickell, S. L., Nowak, R., Poindron, P., Sèbe, F., Chadwick, A., Ferguson, D., et al. (2009). Temperament does not affect the overall establishment of mutual preference between the mother and her young in sheep measured in a choice test. Dev. Psychobiol. 51, 429–438. doi: 10.1002/dev.20382
Bøe, K. E., and Færevik, G. (2003). Grouping and social preferences in calves, heifers and cows. Appl. Anim. Behav. Sci. 80, 175–190. doi: 10.1016/S0168-1591(02)00217-4
Boissy, A., and Dumont, B. (2002). Interactions between social and feeding motivations on the grazing behaviour of herbivores: sheep more easily split into subgroups with familiar peers. Appl. Anim. Behav. Sci. 79, 233–245. doi: 10.1016/S0168-1591(02)00152-1
Boyland, N. K., Mlynski, D. T., James, R., Brent, L. J. N., and Croft, D. P. (2016). The social network structure of a dynamic group of dairy cows: from individual to group level patterns. Appl. Anim. Behav. Sci. 174, 1–10. doi: 10.1016/j.applanim.2015.11.016
Carter, A. J., Feeney, W. E., Marshall, H. H., Cowlishaw, G., and Heinsohn, R. (2013). Animal personality: what are behavioural ecologists measuring? Biol. Rev. 88, 465–475. doi: 10.1111/brv.12007
Dodd, C. L., Pitchford, W. S., Hocking Edwards, J. E., and Hazel, S. J. (2012). Measures of behavioural reactivity and their relationships with production traits in sheep: a review. Appl. Anim. Behav. Sci. 140, 1–15. doi: 10.1016/j.applanim.2012.03.018
Doyle, R. E., Broster, J. C., Barnes, K., and Browne, W. J. (2016). Temperament, age and weather predict social interaction in the sheep flock. Behav. Proces. 131, 53–58. doi: 10.1016/j.beproc.2016.08.004
Doyle, R. E., Lee, C., McGill, D. M., and Mendl, M. (2015). Evaluating pharmacological models of high and low anxiety in sheep. PeerJ 3:e1510. doi: 10.7717/peerj.1510
Drewe, J. A., Weber, N., Carter, S. P., Bearhop, S., Harrison, X. A., Dall, S. R. X., et al. (2012). Performance of proximity loggers in recording intra- and inter-species interactions: a laboratory and field-based validation study. PLoS ONE 7:e39068. doi: 10.1371/journal.pone.0039068
Dumont, B., Boissy, A., Achard, C., Sibbald, A. M., and Erhard, H. W. (2005). Consistency of animal order in spontaneous group movements allows the measurement of leadership in a group of grazing heifers. Appl. Anim. Behav. Sci. 95, 55–66. doi: 10.1016/j.applanim.2005.04.005
Haddadi, H., King, A. J., Wills, A. P., Fay, D., Lowe, J., Morton, A. J., et al. (2011). Determining association networks in social animals: choosing spatial–temporal criteria and sampling rates. Behav. Ecol. Sociobiol. 65, 1659–1668. doi: 10.1007/s00265-011-1193-3
Hauschildt, V., and Gerken, M. (2015). Individual gregariousness predicts behavioural synchronization in a foraging herbivore, the sheep (Ovis aries). Behav. Proces. 113, 110–112. doi: 10.1016/j.beproc.2015.01.013
Hinch, G. N. (2017). “Understanding the natural behaviour of sheep,” in Advances in Sheep Welfare, eds D. M. Ferguson, C. Lee, and A. Fisher (Amsterdam: Elsevier), 1–15. doi: 10.1016/B978-0-08-100718-1.00001-7
Jin, X., and Han, J. (2011). “K-Means Clustering,” in Encyclopedia of Machine Learning, eds C. Sammut and G. I. Webb (Boston, MA: Springer US), 563–564. doi: 10.1007/978-0-387-30164-8_425
Kendrick, K. M., da Costa, A. P., Leigh, A. E., Hinton, M. R., and Peirce, J. W. (2001). Sheep don't forget a face. Nature 414, 165–166. doi: 10.1038/35102669
Keshavarzi, H., Lee, C., Johnson, M., Abbott, D., Ni, W., and Campbell, D. L. M. (2021). Validation of real-time kinematic (RTK) devices on sheep to detect grazing movement leaders and social networks in merino ewes. Sensors 21:924. doi: 10.3390/s21030924
Lawrence, A. B. (1990). Mother-daughter and peer relationships of Scottish hill sheep. Anim. Behav. 39, 481–486. doi: 10.1016/S0003-3472(05)80412-9
Le Pendu, Y., Maublanc, M.-L., Briedermann, L., and Dubois, M. (1996). Spatial structure and activity in groups of mediterranean mouflon (Ovis gmelini): a comparative study. Appl. Anim. Behav. Sci. 46, 201–216. doi: 10.1016/0168-1591(95)00660-5
Lenth, R. V. (2016). Least-squares means: the R Package lsmeans. J. Stat. Soft. 69:i01. doi: 10.18637/jss.v069.i01
MacKay, J. R. D., Haskell, M. J., Deag, J. M., and van Reenen, K. (2014). Fear responses to novelty in testing environments are related to day-to-day activity in the home environment in dairy cattle. Appl. Anim. Behav. Sci. 152, 7–16. doi: 10.1016/j.applanim.2013.12.008
Marini, D., Cowley, F., Belson, S., and Lee, C. (2019). The importance of an audio cue warning in training sheep to a virtual fence and differences in learning when tested individually or in small groups. Appl. Anim. Behav. Sci. 221:104862. doi: 10.1016/j.applanim.2019.104862
Michelena, P., Jeanson, R., Deneubourg, J.-L., and Sibbald, A. M. (2010). Personality and collective decision-making in foraging herbivores. Proc. Royal Soc. B Biol. Sci. 277, 1093–1099. doi: 10.1098/rspb.2009.1926
Michelena, P., Sibbald, A. M., Erhard, H. W., and McLeod, J. E. (2009). Effects of group size and personality on social foraging: the distribution of sheep across patches. Behav. Ecol. 20, 145–152. doi: 10.1093/beheco/arn126
Miranda-de la Lama, G. C., Pascual-Alonso, M., Aguayo-Ulloa, L., Sepúlveda, W. S., Villarroel, M., and María, G. A. (2019). Social personality in sheep: can social strategies predict individual differences in cognitive abilities, morphology features, and reproductive success? J. Vet. Behav. 31, 82–91. doi: 10.1016/j.jveb.2019.03.005
Ozella, L., Langford, J., Gauvin, L., Price, E., Cattuto, C., and Croft, D. P. (2020). The effect of age, environment and management on social contact patterns in sheep. Appl. Anim. Behav. Sci. 225:104964. doi: 10.1016/j.applanim.2020.104964
Paganoni, B., Macleay, C., van Burgel, A., and Thompson, A. (2020). Proximity sensors fitted to ewes and rams during joining can indicate the birth date of lambs. Comput. Electr. Agri. 170:105249. doi: 10.1016/j.compag.2020.105249
R Core Team (2018). R: A Language and Environment for Statistical Computing. Vienna: R Foundation for Statistical Computing.
Ramseyer, A., Boissy, A., Thierry, B., and Dumont, B. (2009). Individual and social determinants of spontaneous group movements in cattle and sheep. Animal 3, 1319–1326. doi: 10.1017/S1751731109004790
Ren, K., Karlsson, J., Liuska, M., Hartikainen, M., Hansen, I., and Jørgensen, G. H. (2020). A sensor-fusion-system for tracking sheep location and behaviour. Int. J. Distribut. Sensor Netw. 16:155014772092177. doi: 10.1177/1550147720921776
Robitaille, A. L., Webber, Q. M. R., and Vander Wal, E. (2019). Conducting social network analysis with animal telemetry data: applications and methods using spatsoc. Methods Ecol. Evol. 10, 1203–1211. doi: 10.1111/2041-210X.13215
Rocha, L. E. C., Terenius, O., Veissier, I., Meunier, B., and Nielsen, P. P. (2020). Persistence of sociality in group dynamics of dairy cattle. Appl. Anim. Behav. Sci. 223:104921. doi: 10.1016/j.applanim.2019.104921
Salvin, H., Cafe, L., Lees, A., Morris, S., and Lee, C. (2020). A novel protocol to measure startle magnitude in sheep. Appl. Anim. Behav. Sci. 228:104996. doi: 10.1016/j.applanim.2020.104996
Schneider, L., Volkmann, N., Spindler, B., and Kemper, N. (2020). Large group housing systems in fattening bulls—comparison of behavior and performance. Front. Vet. Sci. 7:543335. doi: 10.3389/fvets.2020.543335
Sibbald, A. M., Erhard, H. W., McLeod, J. E., and Hooper, R. J. (2009). Individual personality and the spatial distribution of groups of grazing animals: an example with sheep. Behav. Proces. 82, 319–326. doi: 10.1016/j.beproc.2009.07.011
Verbeek, E., Ferguson, D., Quinquet de Monjour, P., and Lee, C. (2012). Opioid control of behaviour in sheep: effects of morphine and naloxone on food intake, activity and the affective state. Appl. Anim. Behav. Sci. 142, 18–29. doi: 10.1016/j.applanim.2012.09.001
Wickham, H. (2016). ggplot2: Elegant Graphics for Data Analysis, 2nd Edn. Cham: Springer International Publishing : Imprint: Springer.
Xu, H., Li, S., Lee, C., Ni, W., Abbott, D., Johnson, M., et al. (2020). Analysis of cattle social transitional behaviour: attraction and repulsion. Sensors 20:5340. doi: 10.3390/s20185340
Keywords: Merino sheep, unsupervised clustering, social bonds, temperament, social network
Citation: Keshavarzi H, Lee C, Dyall T, Johnson M, Abbott D, Belson S, Ni W and Campbell DLM (2022) Using Real-Time Kinematic (RTK) Devices to Show a Limited Effect of Boldness and Fearfulness on Social Proximity in Sheep Grazing at Pasture. Front. Anim. Sci. 3:872132. doi: 10.3389/fanim.2022.872132
Received: 09 February 2022; Accepted: 13 April 2022;
Published: 25 May 2022.
Edited by:
Suresh Neethirajan, Wageningen University and Research, NetherlandsReviewed by:
Benjamin Lecorps, University of British Columbia, CanadaKathreen Ruckstuhl, University of Calgary, Canada
Copyright © 2022 Keshavarzi, Lee, Dyall, Johnson, Abbott, Belson, Ni and Campbell. This is an open-access article distributed under the terms of the Creative Commons Attribution License (CC BY). The use, distribution or reproduction in other forums is permitted, provided the original author(s) and the copyright owner(s) are credited and that the original publication in this journal is cited, in accordance with accepted academic practice. No use, distribution or reproduction is permitted which does not comply with these terms.
*Correspondence: Hamideh Keshavarzi, aGFtaWRlaC5rZXNoYXZhcnppQGNzaXJvLmF1