
95% of researchers rate our articles as excellent or good
Learn more about the work of our research integrity team to safeguard the quality of each article we publish.
Find out more
ORIGINAL RESEARCH article
Front. Anim. Sci. , 12 December 2022
Sec. Animal Welfare and Policy
Volume 3 - 2022 | https://doi.org/10.3389/fanim.2022.1051572
This article is part of the Research Topic Management Methods to Enhance Animal Welfare and Product Quality View all 6 articles
 Daniela A. Alambarrio1
 Benjamin K. Morris2
 R. Benjamin Davis2
 Kari K. Turner1
 Laura A. Motsinger1
 Travis G. O’Quinn3
 John M. Gonzalez1*
The objective of this study was to collect and quantify three-axis acceleration data from six locations within commercial pig transport trailers during summer. Two trucks with straight-deck trailers transporting two loads per day were observed for 5 consecutive days (N = 20). Accelerometers were placed under the floor of each trailer’s top and bottom decks (DECs) in the center of three sections (SECs): fore, middle, and aft. Data from each trailer section were processed to calculate z- and x,y-axis root mean square (RMS) values and vibration dose values (VDVs) during loading, transport, and unloading. There were no DEC × SEC interactions or SEC main effects for z-axis RMS or VDV during any transportation stage (P > 0.06). The bottom deck had a greater x,y-axis RMS than the top deck during all transportation stages (P < 0.01). The bottom deck had a greater x,y-axis VDV than the top deck during loading and transport (P < 0.03), but there was no difference (P = 0.52) during unloading. The bottom deck had a greater z-axis RMS and VDV than the top deck during loading and transport (P < 0.01), but there were no differences during unloading (P > 0.07). There were no SEC effects for x,y- and z-axis RMSs and VDVs during all transportation stages (P > 0.06). Acceleration values were compared with exposure action values (EAV; injury possible) and exposure limit values (ELV; injury likely) vibrations thresholds. Over the 5 observation days during all transport stages, a greater percentage of compartments violated both RMS and VDV thresholds in the x,y orientation (average 90%) than in the z orientation (average 76%). Overall, these data indicate that bottom decks experience greater three-axis vibrations than top decks in straight-deck trailers and that pigs on bottom decks may experience greater discomfort during transportation that could contribute to fatigue or the non-ambulatory condition.
The animal food industry is under social pressure to adhere to acceptable animal welfare standards. From a social perspective, animal welfare standards account for individual livestock needs and provisioning stress-free environments. Pigs in the USA are transported more than once in their lives because of US multisite pork production, which causes stress that potentially leads to sickness or death (Kephart et al., 2014; Padalino et al., 2018). Thus transportation welfare is a growing social concern. During transportation, livestock are exposed to multiple stressors including handling, steep loading ramps, poor driving skills, feed and water deprivations, and temperature and humidity variation (Hamilton et al., 2004; Peeters et al., 2008; Schwartzkopf-Genswein et al., 2012). Many of these factors and other transportation-related factors contribute to the meat quality (Correa, 2011; Correa et al., 2013) and, more importantly, the animal’s welfare (Pilcher et al., 2011).
In the pork industry, transport loss is the term for pigs that die or become non-ambulatory at any stage from trailer loading at the farm to entering harvest at the commercial abattoir (Ellis et al., 2003; Fitzgerald et al., 2009). A subcategory, non-ambulatory pigs, refers to pigs that cannot move, refuse to walk, and display signs of severe acute stress after transportation (Anderson et al., 2002; Ritter et al., 2009). The non-ambulatory category can be subdivided into two categories: non-ambulatory, non-injured or fatigued pigs, which refuse to walk or keep up with other pigs but display no signs of injury, trauma, or diseased, and non-ambulatory, injured pigs, which become non-ambulatory because of a physically compromised ability to ambulate (Ritter and Ellis, 2008; Kephart et al., 2010). The financial burden associated with non-ambulatory and dead pigs increased from $46 million during 2006 (Ritter et al., 2009) to $89 million during the 2012–15 production window (Ritter et al., 2020). Non-ambulatory and dead pigs not only impact pork industry economics but also reduce the pork industry’s ability to contribute to the food supply and feed a growing population, as discussed by Morris et al. (2021).
During transportation, a pig’s comfort level can be affected by trailer compartment and design (Randall et al., 1996). Different trailer designs are used in the transport of pigs; differences between trailers include the number of compartments and ramps (dalla Costa et al., 2007; Ritter et al., 2008). Some trailer designs may increase pig-handling difficulty during loading and unloading, which may result in more stress (Ritter et al., 2008; Conte et al., 2015) and an increase in transport loss (Cormier and Doonan, 2008; Correa, 2011). In addition, trailers may have different structures, suspension systems, and damper types; however, off-road vehicles and trailers commonly have low-stiffness suspension and poor damping, which affects vibrations in some environments (Randall, 1992; Peeters et al., 2008). Thus, trailer design has potential implications for pig movement (Ritter et al., 2008) and trailer microclimate (Morris et al., 2021).
Although not as extensively studied as other microclimate influencers, trailer vibrations could be a stress influencer during transportation. Early research indicated that pigs were more sensitive to fast simulated trailer vibrations than road noise of slow vibrations (Stephens et al., 1985). Two studies by Perremans et al. (1998; 2001) reported 15- to 25-kg piglets showed elevated heart rates and levels of plasma cortisol and adrenocorticotropic hormone when vertically vibrated. Randall (1992) and Aradom and Gebresenbet (2013) showed that during transportation pigs were subjected to vertical, lateral, and horizontal vibrations induced by vehicle motion which displaced the pig’s center of gravity, causing discomfort and movement sickness. Vibrations are primarily caused by road surface roughness, undulation curvature, variations in speed, and poor suspension systems (Gebresenbet et al., 2003; Rebelle, 2021). Currently, the International Organization for Standardization (ISO) 2631-1 provides exposure action values (EAVs; injury possible) and exposure limit values (ELVs; injury likely) as guidance for whole-body vibration levels that are uncomfortable and potentially dangerous for humans (ISO 2631-1, 1997; ISO 2631-5, 2018). The ISO does not report health risks or performance effects for pigs; however, Streijger et al. (2015) demonstrated that vibration exposure had profound effects on pigs’ specific body parts and systems depending on vibration frequency, amplitude, and duration. Morris et al. (2021) suggested that potbelly and straight-deck trailer vibrations violated ISO EAV and ELV thresholds and reached levels considered uncomfortable to pigs that possibly affect pigs’ muscle function, especially in the bottom aft (BA; Figure 1) trailer compartment. These data were collected during winter and the literature demonstrates that season strongly influences vibrations, transportation losses, and distribution between loss categories. Fitzgerald et al. (2009) showed that fatigued pigs represented the greatest portion of total loss during winter and that dead pigs were greater during summer months. Environmental stressors of pig transportation are well documented in the literature (Ritter et al., 2007; Caulfield et al., 2014; Sommavilla et al., 2017; Driessen et al., 2020). Diemand (1991) reported that materials, including rubber and metal, become stiff and/or brittle and that vibrations from diesel engines are amplified when exposed to cold conditions. This could indicate that vibrations reported by Morris et al. (2021) are not reflective of vibrations experienced by pigs during the warm conditions of the summer. Therefore, the objective was to collect and quantify three-axis acceleration and microclimate conditions from locations within commercial transport trailers shipping market-weight pigs during the summer.
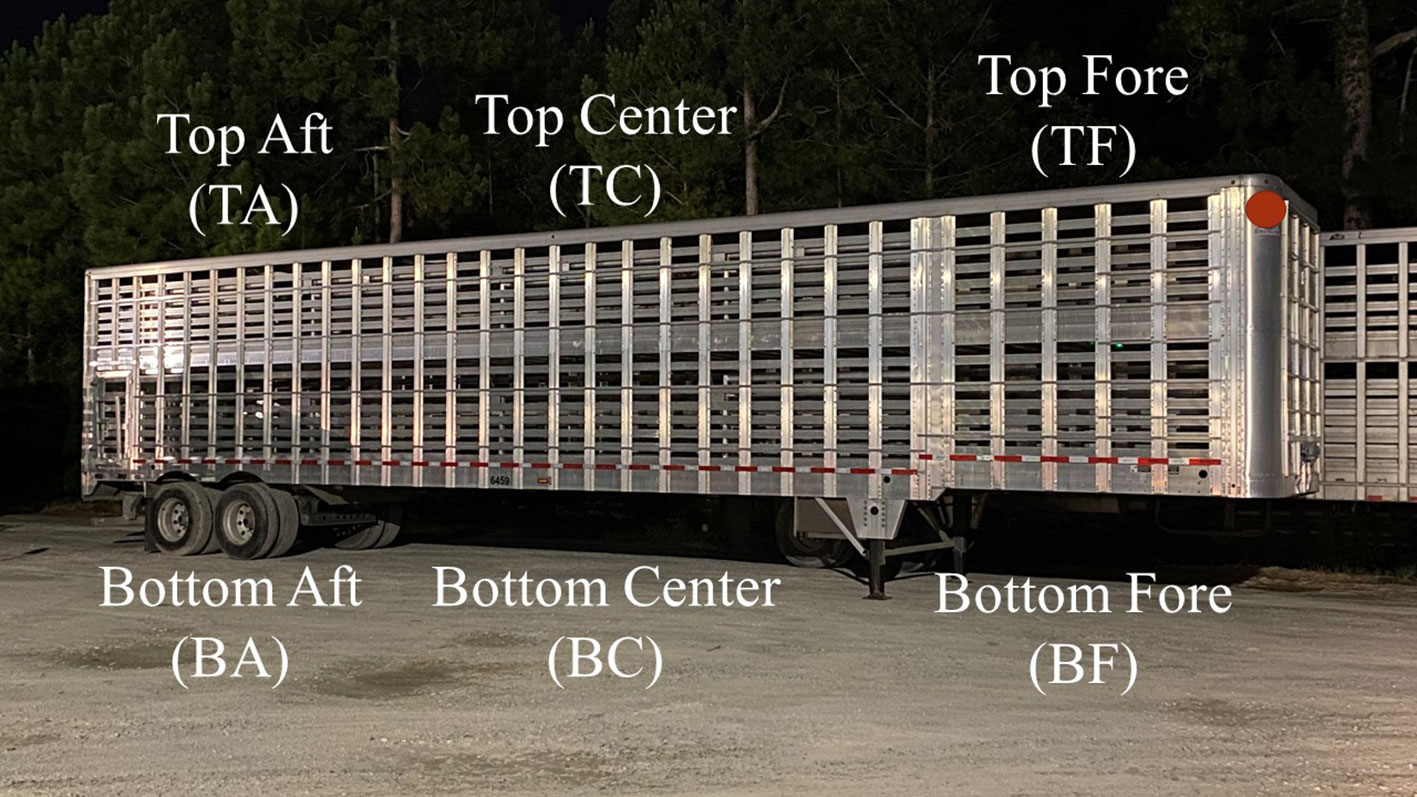
Figure 1 Pictoral representation of straight-deck trailers and approximate sensor placement locations with abbreviation in parentheses. Six locations were top aft (rear; TA), top center (TC), top fore (front; TF), bottom aft (rear; BA), bottom center (BC), and bottom fore (front; BF).
Before the trial began, the study methods were evaluated by the Institutional Animal Care and Use Committee (IACUC) at the University of Georgia and the study was determined not to require IACUC approval. Approval was not required because all procedures occurred before and after client-owned pig transport, and researchers did not observe live pigs (see below). Written informed consent was obtained from the owners for the collection of the data on their pigs utilized in this study.
Vibration data were collected over 5 days in August 2021 on two straight-deck trailers (Figure 1) designated and owned by one North Carolina producer. The accelerometer deployment methods of Morris et al. (2021) were followed. Two loads of finished pigs were observed per truck every day (N = 20). Accelerometer devices [Pelican 1200 Case (Pelican Products, Inc., Torrance, CA, US), Omars AC power supply (Wellmade, Shenzhen, China), myRIO accelerometer (National Instruments, Austin, TX, US)] were attached to the underside of the floor of the top and bottom fore (front) (TB and BF, respectively), center (TC and BC, respectively), and aft (back) (TA and BA, respectively) sections of the trailer with four rubber tarp straps. One accelerometer was placed in the center of the floor (see Morris et al., 2021, for pictoral representation), with the x-axis pointed forward to the direction of movement, y-axis pointed left/right, and z-axis pointed up/down. Accelerometer data were recorded on SanDisk Cruzer Fit 16 GB USB flash drivers (Western Digital, San Jose, CA, US). The temperature and relative humidity of each compartment were recorded every minute using USB data loggers (Model OM-HL-SP-TH; Omega Engineering Inc., Norwalk, CT). Data were not available for the BA sensor on days 1 and 5 due to a lost sensor and loss of power.
Data on truck and trailer make, model, and year were collected prior to trucks leaving their headquarters, but remain confidential in this publication. Trailers were manufactured in 2020, had two decks, air-bag suspension, no internal ramps, and eight compartments, and did not possess mechanical ventilation systems, and all side vents and three roof vents were open to allow maximum airflow. Except for gravel roads at the farms (less than approximately 5% of total distance traveled), trucks traveled on paved roads, and all trips terminated at the same commercial abattoir. On days 1 and 4, trucks transported pigs from the same farms during each morning and afternoon transport session, but farms were different on each day and session (Farms #1, 2, 3, and 4 were 33.0, 48.4, 71.6, and 71.6 km from the plant, respectively). On day 2, both loads for both trucks originated from the same farm (Farm #5, 32.0 km from the plant). On day 3, both trucks transported from the same farm during the morning session (Farm #6, 58.3 km from the plant), one truck transported from the morning farm during the afternoon session, and the second truck transported from a different farm (Farm #7, 33.3 km from the plant). On day 5, loads were transported from four different farms (Farms #8, 9, 10, 11 were 71.5, 25.7, 86.9, and 82.1 km from the plant, respectively). Prior to transporting afternoon loads, trucks returned to headquarters to be washed.
The producer provided documentation of trailer start and end times. Pigs were marked for transport by company personnel prior to shipping, loaded onto trailers by pen, and mixed with pigs from other pens within a compartment. Pigs were loaded at an average density of 0.47 ± 0.02 m2 per pig or 252 ± 0.11 kg/m2 per pig. The producer provided livestock receiving tickets that included the number of pigs transported and loaded and unloaded truck and trailer weights, which were used to calculate loaded and average pig weight. Using the standards of the producer, pigs were subjectively categorized as “dead” or “cripple/stress” by trained personnel at the abattoir’s receiving alley. Pigs found dead or euthanized on the trailer during unloading were classified as dead. A pig not capable of walking under their own power without assistance off the trailer was categorized as a cripple or stressed. Crippled animals had a clear injury preventing them from walking off the trailer. The producer provided Samara Vehicle Telematics Information (Samsara Inc., San Francisco, CA, US) of truck and trailer motion from the farm to the abattoir because passengers were not allowed to track movement. Global positioning system data were used to estimate the three stages of the transportation process noted below.
The methods of Morris et al. (2021) were followed, but data were processed and analyzed within three different stages of the transportation process: loading (LOD), transport (TRA), and unloading (ULD). The LOD stage was from the time the truck and trailer backed up to the farm’s loading dock to the time they moved away from the dock. The TRA stage was from the time the truck and trailer left the farm to the time they arrived at the abattoir’s gate. The ULD stage was from the time the truck and trailer arrived at the abattoir to the time they moved away from the unloading dock.
MATLAB (MathWorks, Natick, MA, US) was used for vibration analyses. Response variables calculated were root mean squares (RMSs), used to evaluate pig vibration exposure, and vibration dose value (VDVs) to quantify total vibration experienced over time. The weights given by ISO 2631-1 were applied to the RMS values to quantify the effective vibration experienced by the pigs instead of physical vibrations in the environment. The acceleration frequency data were analyzed by calculating power spectral density. Motion in the vertical direction consisted of the z-axis, which was the same for the trailer and pigs, and the horizontal direction, which was the x,y-axis combined as a general vibrational bulk quantity represented by RMS or VDV. Pig vibration exposure was compared with ISO thresholds of EAVs and ELVs of RMS 0.43 and 0.86 m/s2, and VDV 8.50 and 17.00 m/s1.75, respectively (ISO 2631-1, 1997).
After each data collection day, temperature and relative humidity data were downloaded using LogPro Software (Omega Engineering Inc.) and imported to Microsoft Excel. Data were averaged within four stages of transportation: LOD, TRA, 30 minutes after transport began (TRA+30), and UDL. The temperature was analyzed 30 minutes after transport commenced to determine the initial effects of pigs and wind velocity on the environment (Morris et al., 2021). Historical temperature and relative humidity data were collected by time from the nearest national weather station (Fayetteville, NC). These values were utilized to calculate trailer compartment temperature and relative humidity change from ambient (Delta). Temperature and relative humidity were also utilized to calculate the temperature–humidity index (THI) using the equation THI (°C) = 0.8T + (RH/100) × (T-14.3) + 46.4, where T denoted temperature and RH denoted relative humidity. Values less than 74 were considered “safe”, between 74 and 79 were considered “critical”, between 79 and 84 were considered “dangerous”, and greater than 84 were considered “emergency” (National Oceanic and Atmospheric Administration, 1976).
The RMS and VDV data were analyzed as a completely randomized design with a 2 × 3 factorial using trailer load as the experimental unit. Fixed effects included trailer deck (DEC; bottom or top), section (SEC; fore, center, or aft), and their interaction. No random effects were included in the model. Temperature and humidity were sorted by time of day (morning or afternoon) and analyzed as above. All data were analyzed using the PROC GLIMMIX statement with the Kenward–Roger degrees of freedom approximation of SAS 9.4 (SAS Inst. Inc., Cary, NC). Pairwise comparisons between the least square mean of factor-level comparisons were calculated with the PDIFF command. All means presented are LSMeans and variation is reported as the standard error of the mean. Differences were considered significant at a P-value < 0.05.
Across both trucks and all trips, approximately 187 pigs, weighing 122 kg, experienced transportation trips (LOD to UDL) lasting 157 min (Table 1). In the present study, morning and afternoon trips had numerically similar LOD, TRA, and UDL durations; however, waits were numerically longer in the afternoon, resulting in more extended total trip time and greater variability. Temperature is another well-documented transport loss influencer. As expected, afternoon trips had hotter atmospheric temperatures by 4.7°C, 6.8°C, and 6.0°C during LOD, TRA, and ULD transportation stages, respectively. Morning trips were exposed to more humid environmental conditions differing from afternoon trips by 28.2%, 28.3%, and 26.3% during LOD, TRA, and UDL transportation stages, respectively.
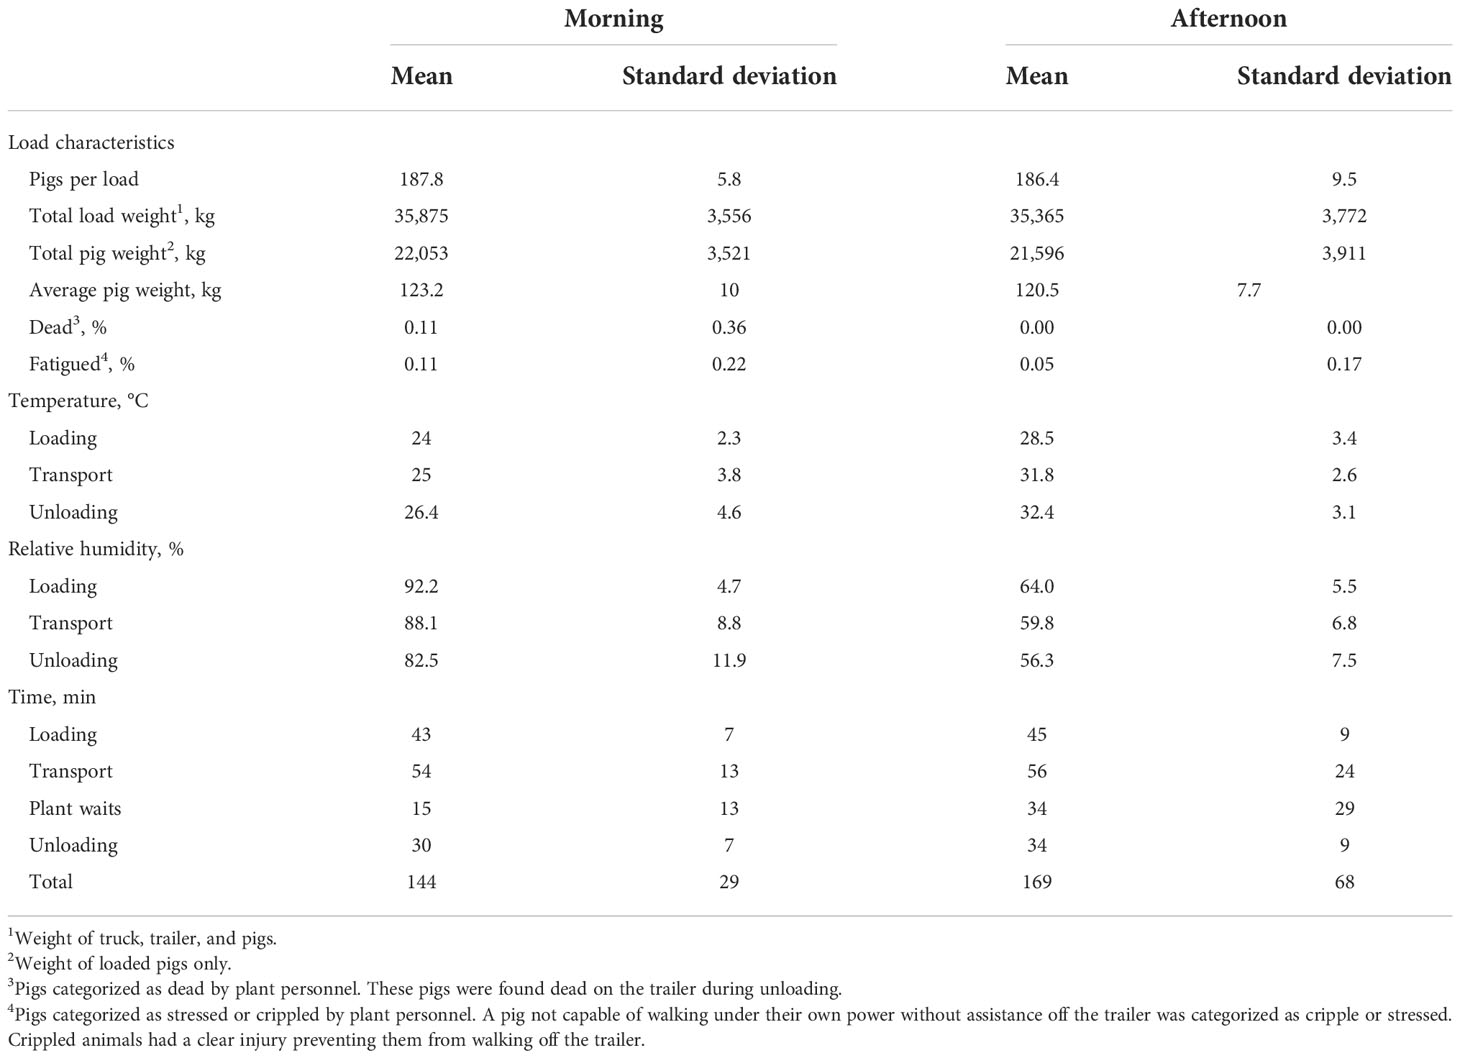
Table 1 Commercial pig transport characteristic means and standard deviations during loading, transport, and unloading.
There were no DEC × SEC interactions for x,y-axis RMS and VDV during all transportation stages (P > 0.11; Figures 2, 3). There were no SEC main effects at all transportation stages (P > 0.07), but the bottom deck had a greater RMS value than the top deck during all stages (P < 0.01). There were no SEC main effects for VDV during all transportation stages (P > 0.12), but the bottom deck had a greater VDV compared with the top deck during LOD and TRA (P < 0.01). There was no SEC effect (P > 0.52) during ULD.
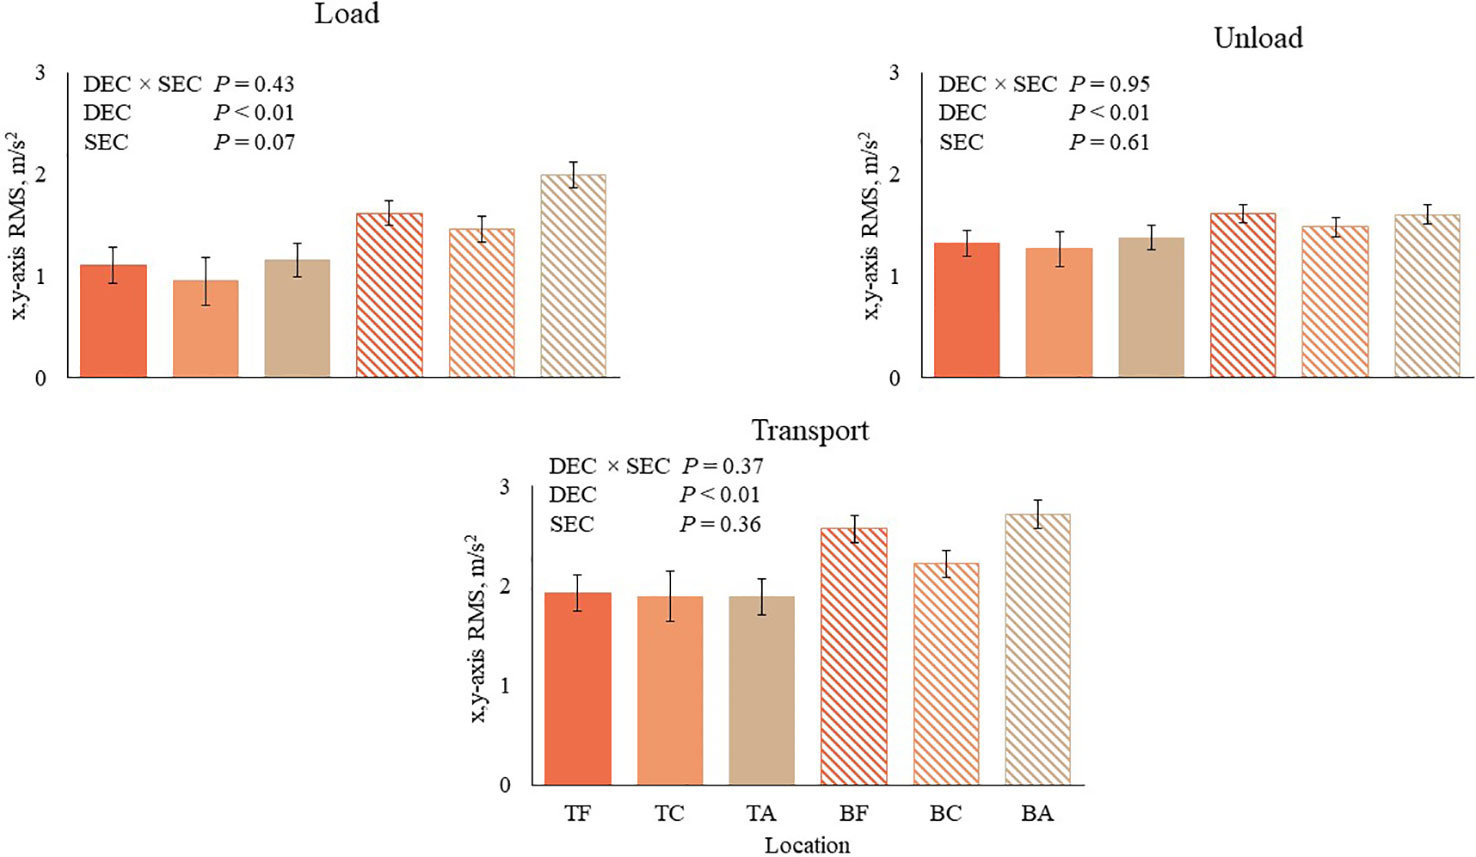
Figure 2 Weighted x,y-axis root mean square (RMS) experienced by pigs transported within two decks (DEC; T, Top; B, bottom) and three sections (SEC; F, fore; C, center; A, aft) located within two trailers during loading, transport, and unloading. Two trailers transported two daily market-weight pig loads over 5 consecutive days.
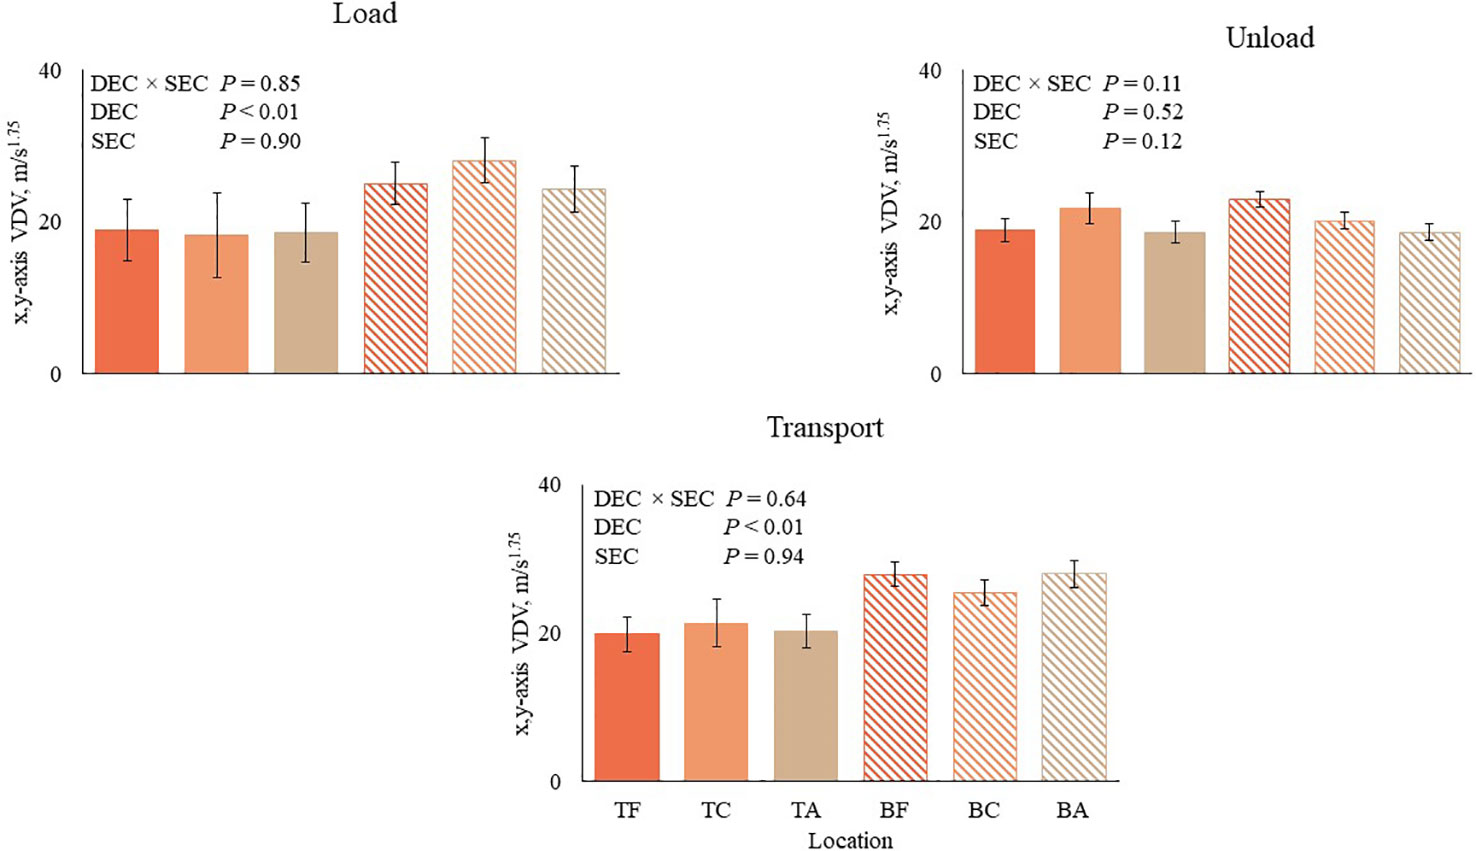
Figure 3 Weighted x,y-axis vibration dose value (VDV) experienced by pigs transported within two decks (DEC; T, Top; B, bottom) and three sections (SEC; F, fore; C, center; A, aft) located within two trailers during loading, transport, and unloading. Two trailers transported two daily market-weight pig loads over 5 consecutive days.
There were no DEC × SEC interactions for z-axis RMS and VDV (P > 0.13; Figures 4, 5). During LOD and TRA stages, the bottom deck had greater RMS and VDV than the top deck (P < 0.01); however, there were no DEC effects for RMS and VDV during ULD (P > 0.07). There were no SEC main effects on RMS and VDV during all transportation stages (P > 0.06).
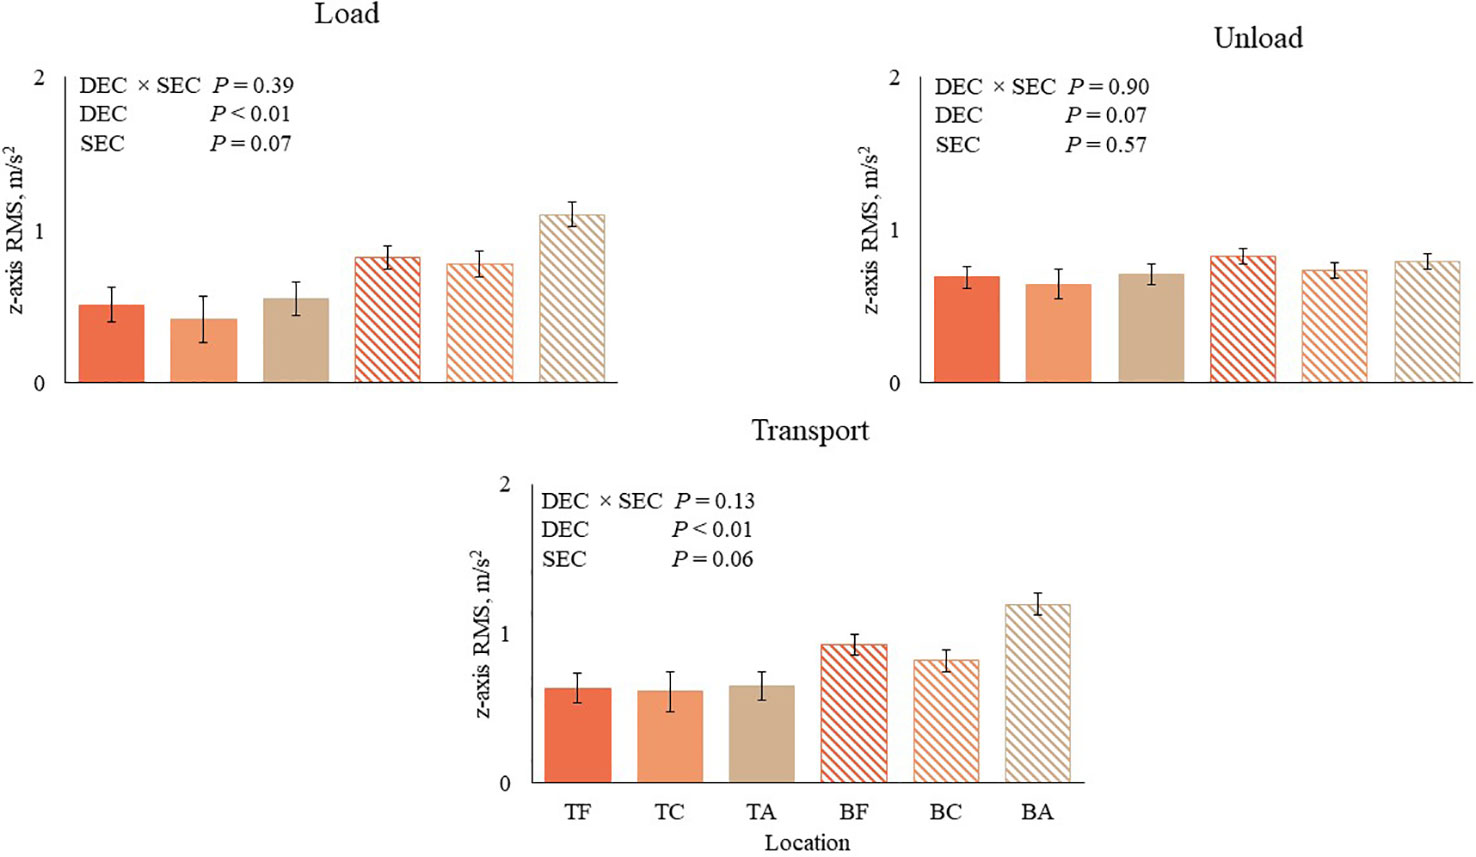
Figure 4 Weighted z-axis root mean square (RMS) experienced by pigs transported within two decks (DEC; T, Top; B, bottom) and three sections (SEC; F, fore; C, center; A, aft) located within two trailers during loading, transport, and unloading. Two trailers transported two daily market-weight pig loads over 5 consecutive days.
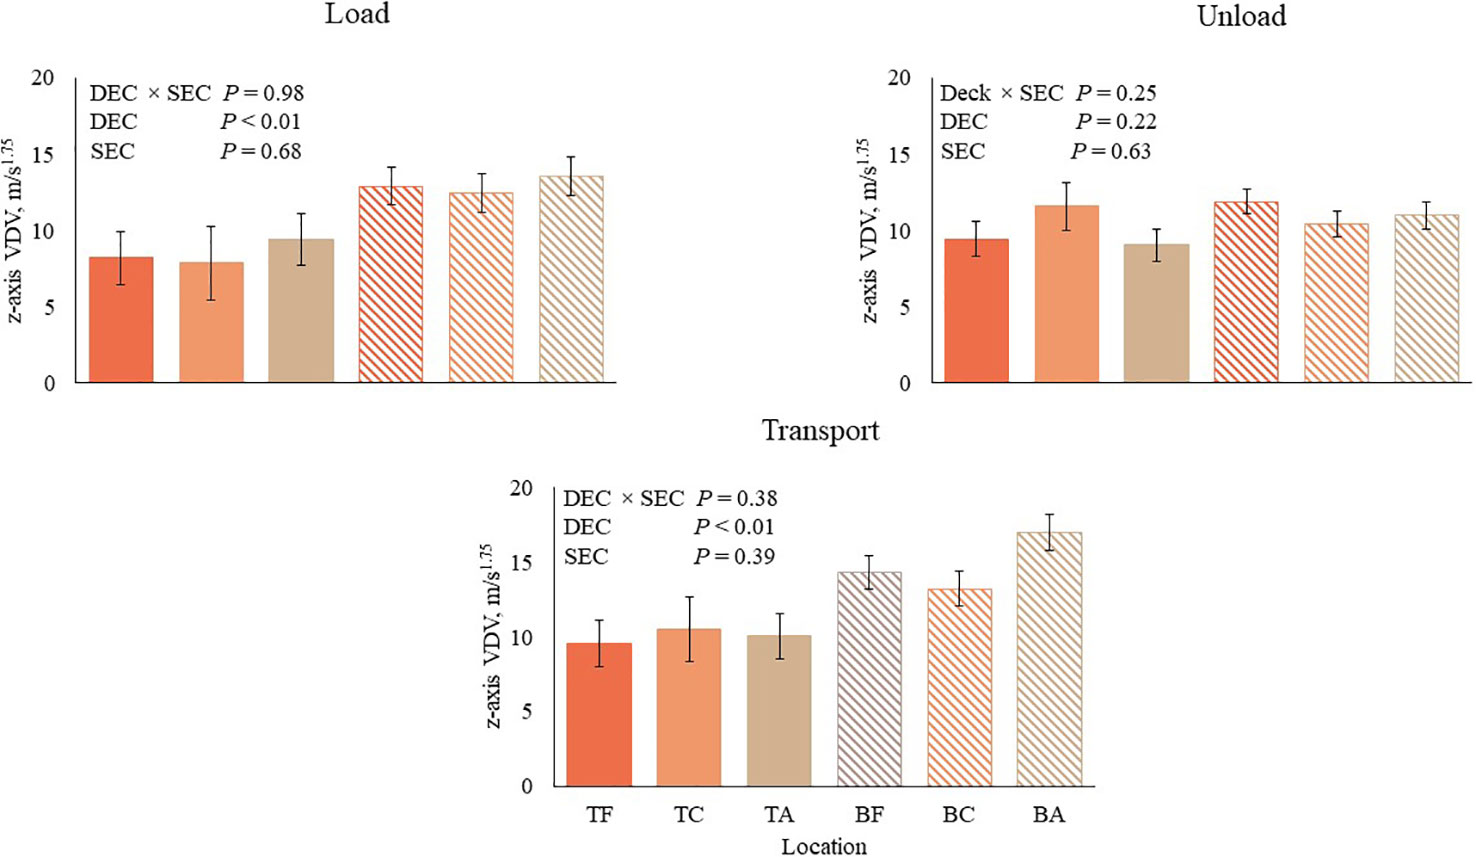
Figure 5 Weighted z-axis vibration dose value (VDV) experienced by pigs transported within two decks (DEC; T, Top; B, bottom) and three sections (SEC; F, fore; C, center; A, aft) located within two trailers during loading, transport, and unloading. Two trailers transported two daily market-weight pig loads over 5 consecutive days.
During all stages of transport over the 5 days of observation, 100% of compartments were exposed to x,y-axis RMS values above the EAV threshold (0.43 m/s2; Figure 6). The x,y-axis ELV threshold (0.86 m/s1.75) was violated by 53%, 100%, and 96% of compartments during LOD, TRA, and ULD, respectively. The z-axis RMS EAV threshold was violated by 96%, 100%, and 96% and the ELV threshold was violated by 25%, 71%, and 63% of compartments during LOD, TRA, and ULD, respectively (Figure 7). The x,y-axis values of 100% of compartments violated the EAV threshold (8.5 m/s2) during all transportation stages (Figure 8). Compartment x,y-axis VDV values violated the ELV threshold (17 m/s1.75) by 71%, 86%, and 78% during LOD, TRA, and ULD, respectively. The z-axis VDV EAV threshold was violated by 96%, 100%, and 93% and the ELV threshold was violated by 43%, 68%, and 64% of compartments during LOD, TRA, and ULD, respectively (Figure 9).
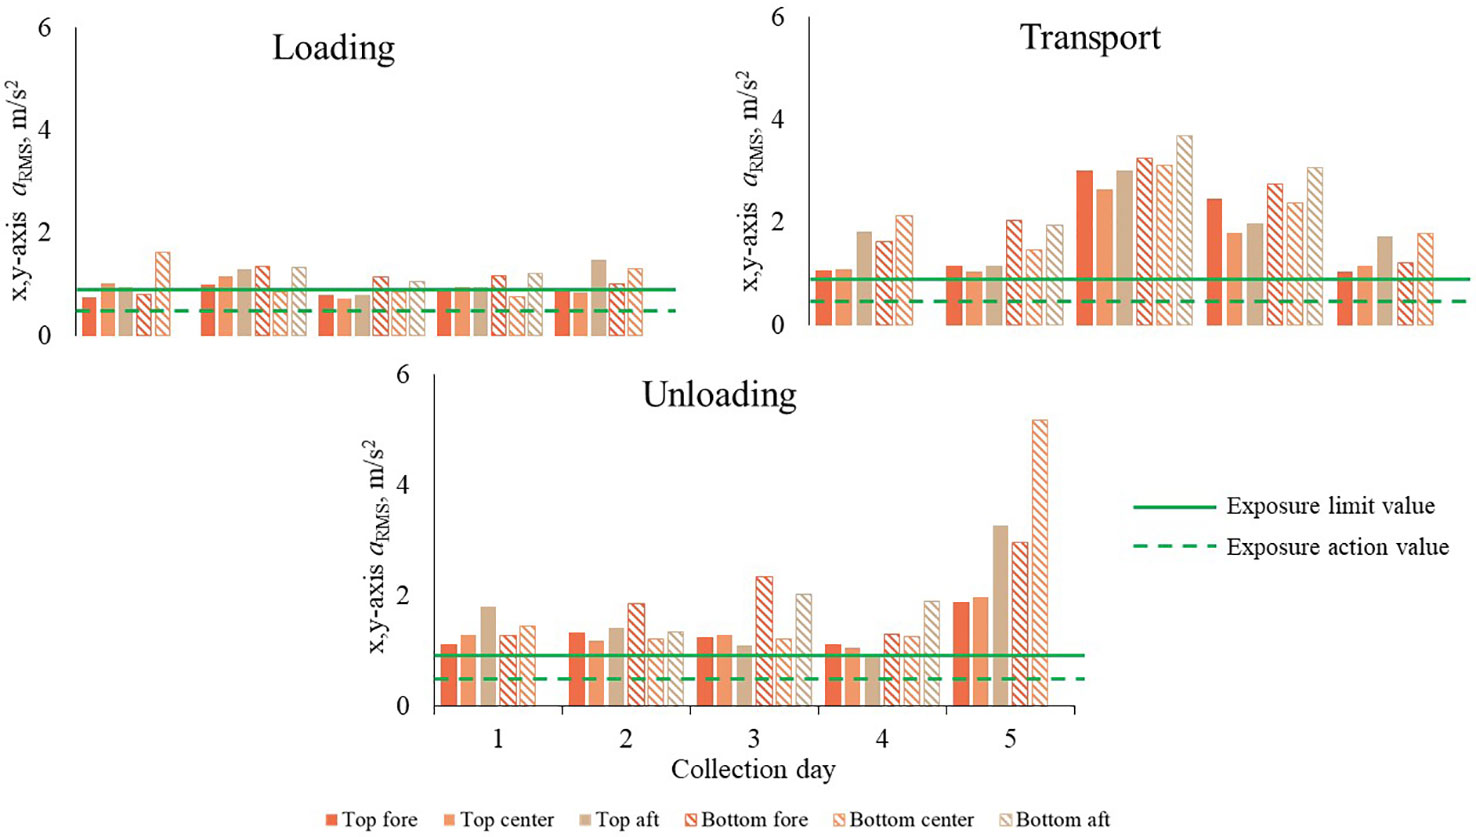
Figure 6 x,y-axis root mean square (RMS) experienced by pigs transported within two decks (DEC; T, Top; B, bottom) and three sections (SEC; F, fore; C, center; A, aft) of two trailers during loading (LOD), transport (TRA), and unloading (UDL). Least squares means encompass two daily market-weight pig loads recorded over 5 consecutive days. Exposure action value (EAV; 0.43 m/s2; dotted green line) and exposure limit value (ELV; 0.86 m/s2; solid green line) correspond to “injury possible” and “injury likely” comfort levels, respectively.
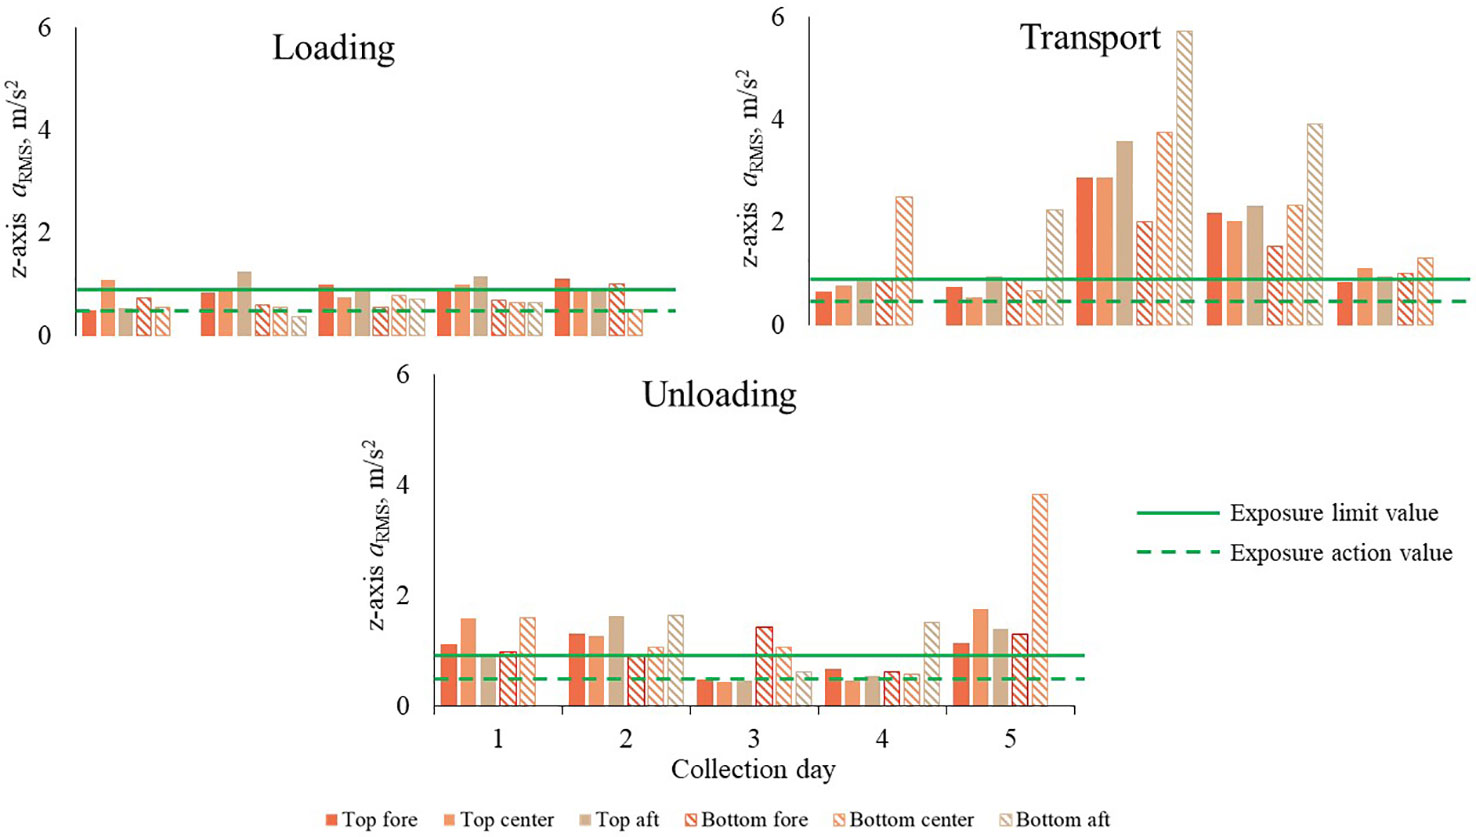
Figure 7 z-axis root mean square (RMS) experienced by pigs transported within two decks (DEC; T, Top; B, bottom) and three sections (SEC; F, fore; C, center; A, aft) of two trailers during loading (LOD), transport (TRA), and unloading (UDL). Least squares means encompass two daily market-weight pig loads recorded over 5 consecutive days. Exposure action value (EAV; 0.43 m/s2; dotted green line) and exposure limit value (ELV; 0.86 m/s2; solid green line) correspond to “injury possible” and “injury likely” comfort levels, respectively.
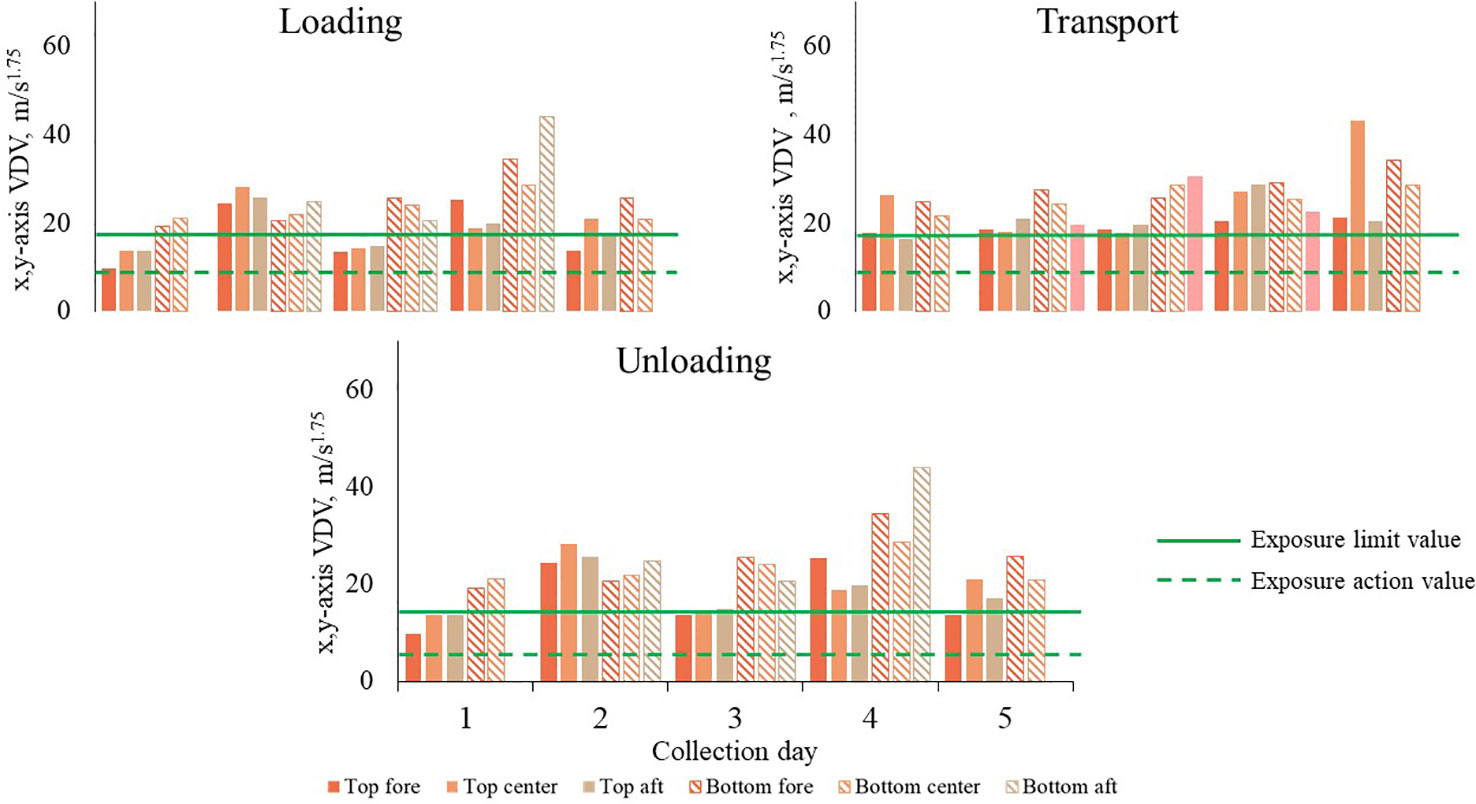
Figure 8 x,y-axis vibration dose value (VDV) experienced by pigs transported within two decks (DEC; T, Top; B, bottom) and three sections (SEC; F, fore; C, center; A, aft) of two trailers during loading (LOD), transport (TRA), and unloading (UDL). Least squares means encompass two daily market-weight pig loads recorded over 5 consecutive days. Exposure action value (EAV; 8.5 m/s1.75; dotted green line) and exposure limit value (ELV; 17 m/s1.75; solid green line) correspond to “injury possible” and “injury likely” comfort levels, respectively.
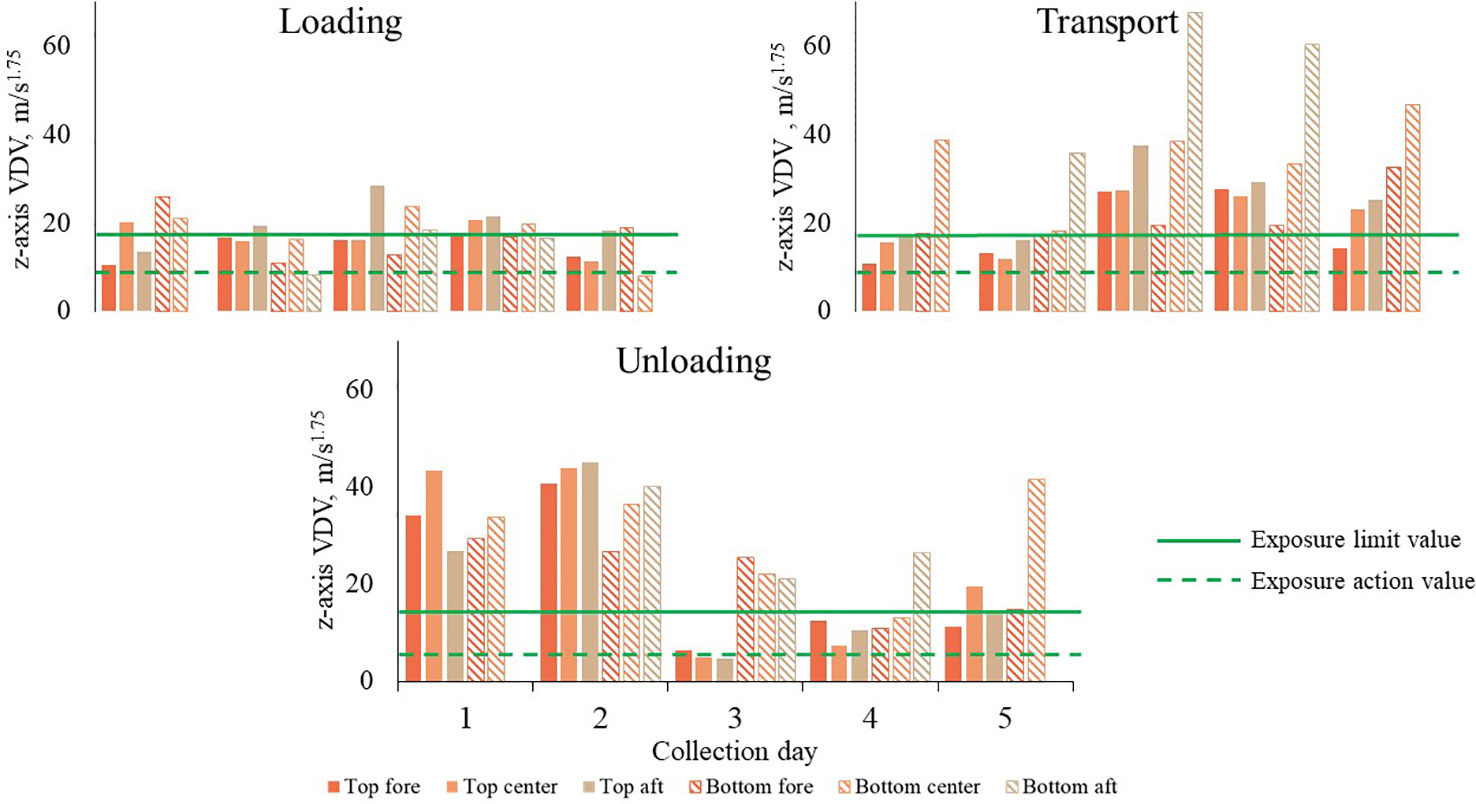
Figure 9 z-axis vibration dose value (VDV) experienced by pigs transported within two decks (DEC>; T, Top; B, bottom) and three sections (SEC; F, fore; C, center; A, aft) of two trailers during loading (LOD), transport (TRA), and unloading (UDL). Least squares means encompass two daily market-weight pig loads recorded over five consecutive days. Exposure action value (EAV; 8.5 m/s1.75; dotted green line) and exposure limit value (ELV; 17 m/s1.75; solid green line) correspond to “injury possible” and “injury likely” comfort levels, respectively.
There were no DEC × SEC interactions for all temperatures and relative humidity measurements recorded in the morning and afternoon (P > 0.21; Table 2). During the morning at all transportation stages there were DEC effects (P < 0.02) for all environmental measures except relative humidity and delta-relative humidity during LOD (P > 0.09). The bottom deck had a greater ambient temperature, delta-temperature, and THI than the top deck (P < 0.02). The top deck had greater relative humidity and delta-relative humidity than the bottom deck during TRA+30, TRA, and UDL stages (P < 0.01). There were no SEC effects for all measures at all stages (P > 0.10), except temperature and delta-temperature at LOD and UDL, and THI at LOD. During LOD, the fore section had a greater ambient temperature, delta-temperature, and THI than the center and aft sections (P < 0.02), which did not differ (P > 0.83). During UDL,the fore section had a greater temperature and delta-temperature than the aft section (P < 0.01), and the center section did not differ from the aft and fore sections (P > 0.18).
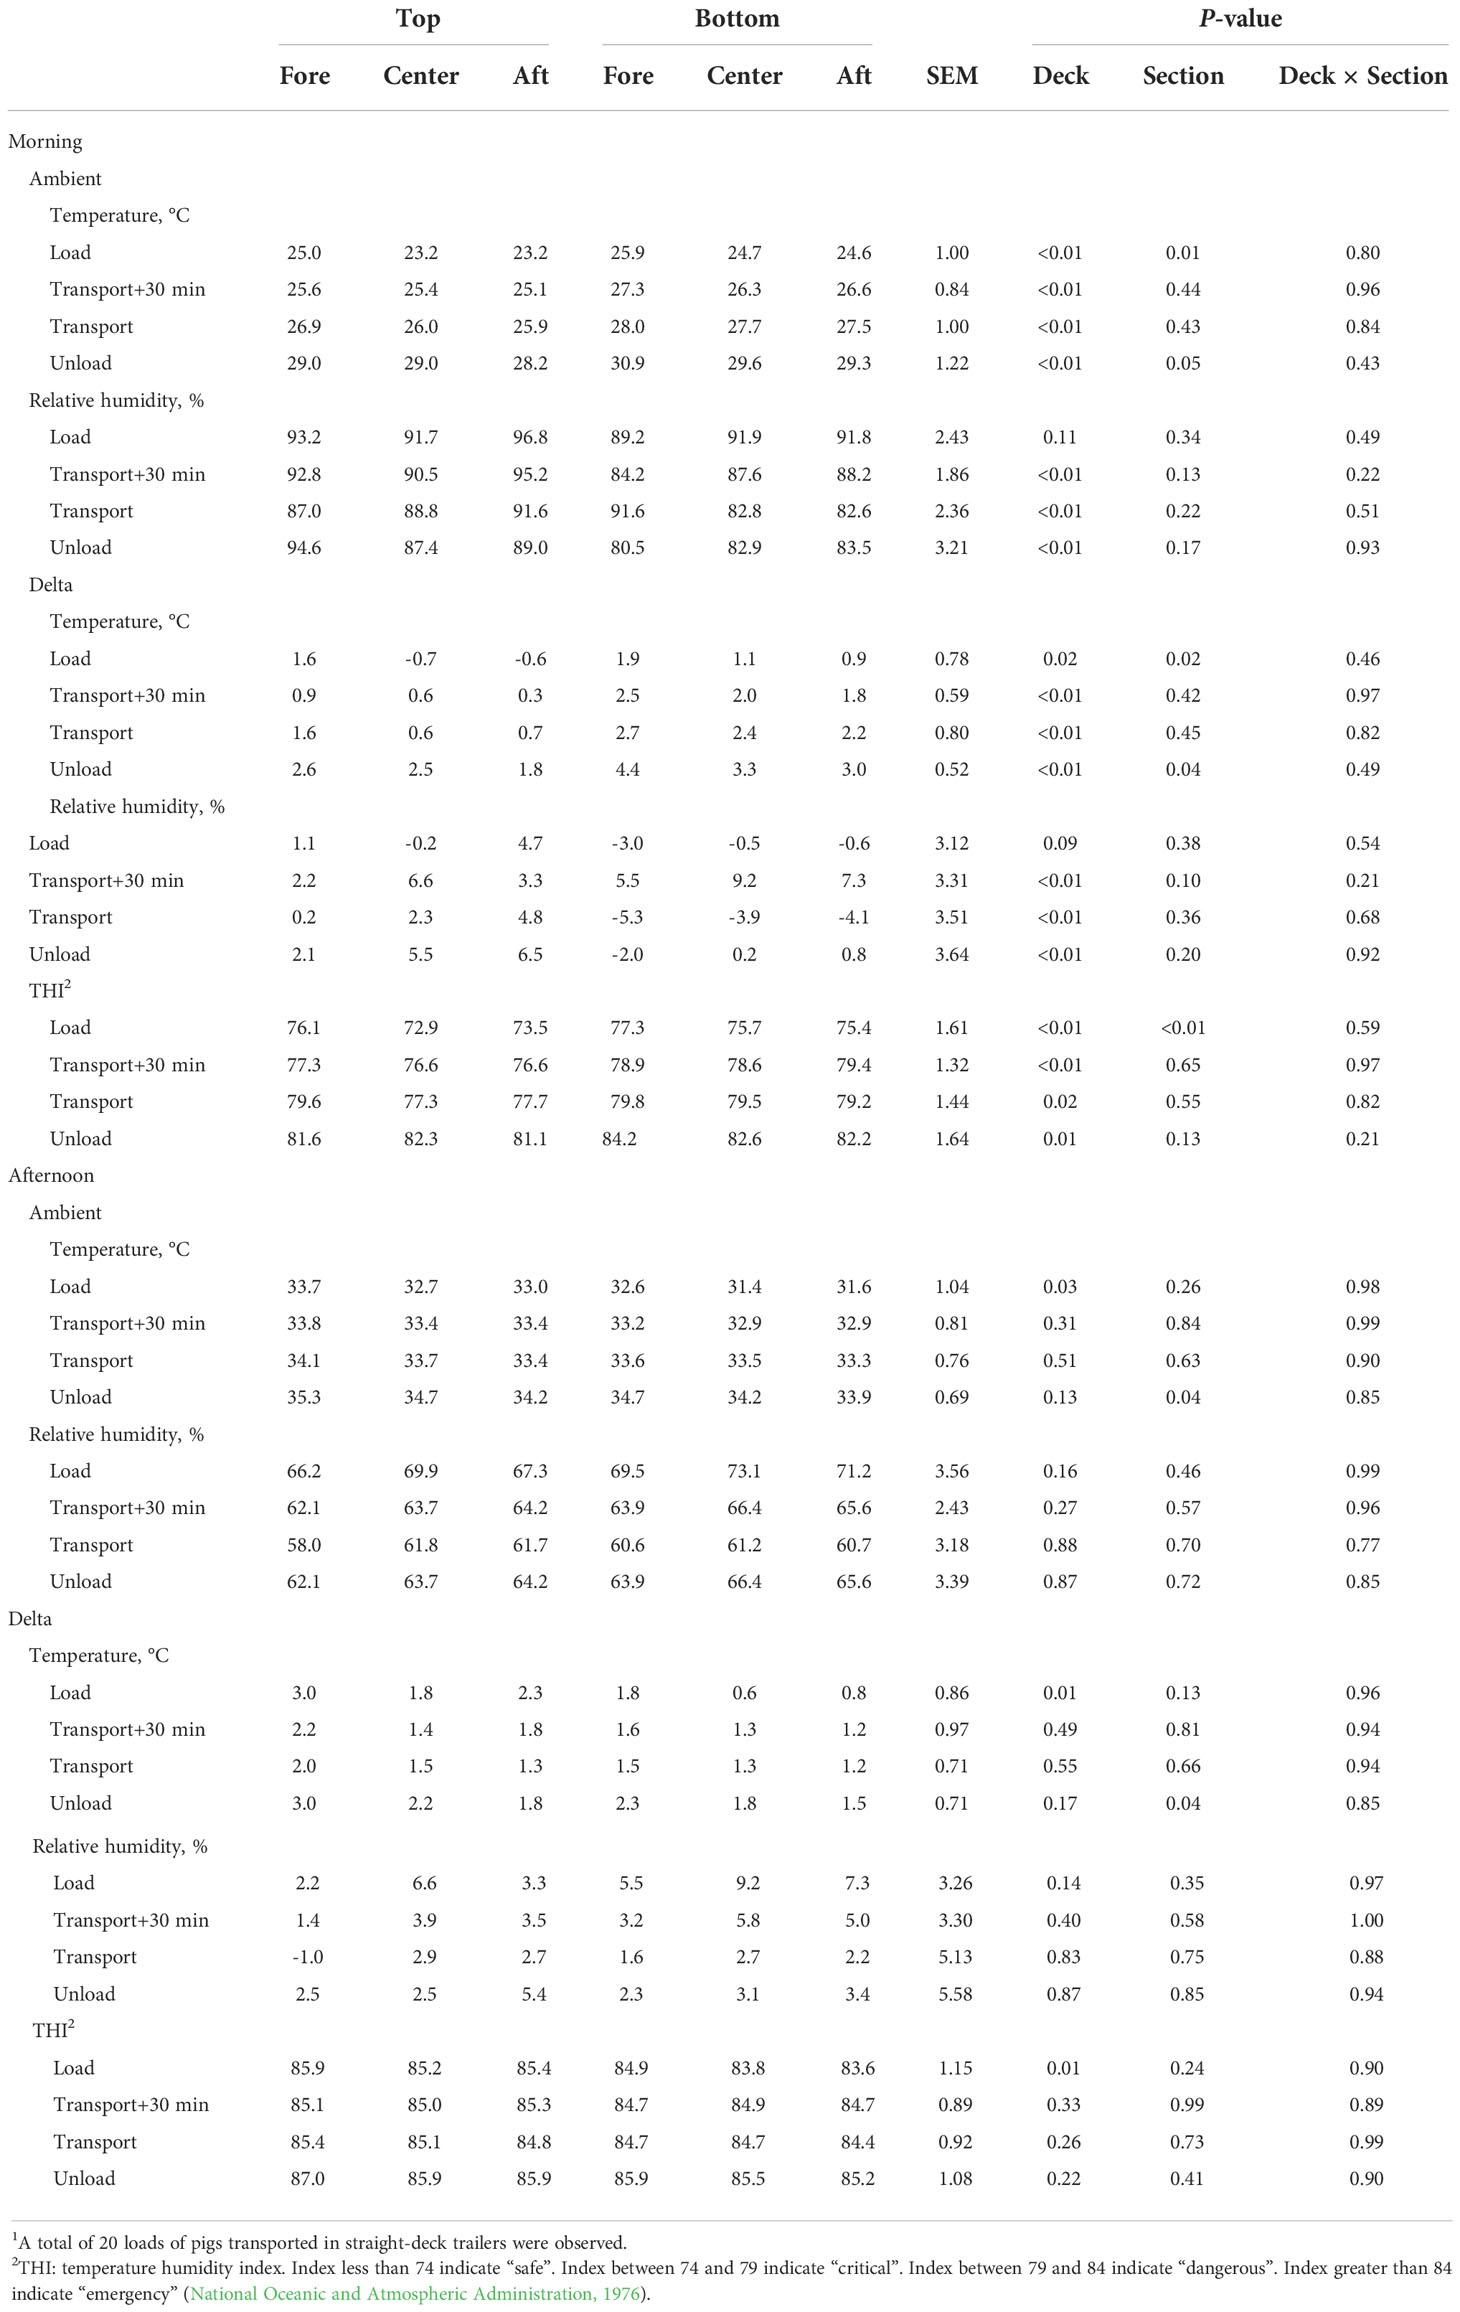
Table 2 Avrage ambient and delta-temperature and relative humidity by deck of straight-deck trailers transporting market pigs in North Carolina during August 20211.
During the afternoon there were no DEC effects for all measures at all stages (P > 0.13) except that the top deck had a greater ambient temperature, delta-temperature, and THI than the bottom deck during LOD (P < 0.03). There were no SEC effects for all measures at all stages (P > 0.13) except for temperature and delta-temperature during UDL (P = 0.04). The fore section had a greater temperature and delta-temperature than the aft section (P < 0.01), and the center section did not differ in either measure compared with the other sections (P > 0.11).
In North Carolina, Morris et al. (2021) observed longer trips (203 min) during winter months than we did in the present study. This was a consequence of the different producers’ pigs and farms being observed. Pérez et al. (2002) and Ritter et al. (2006) reported that pigs exhibited greater fatigue after short trips, but most pigs recovered after 180 min. In the present study, 0.11% of total pigs transported were reported dead in the morning. This percentage was below US industry values reported by Ritter et al. (2020), which range between 0.22% and 0.24%. Morris et al. (2021) reported that in North Carolina the dead pig percentages during winter were equal to the present study. The present study observed that 0.11% and 0.05% of pigs were categorized as fatigued during the morning and afternoon, respectively, which are smaller values than the value reported by Ritter et al. (2020; 0.63%). Ritter et al. (2020) surveyed a much larger percentage of pigs, which could be the reason for the discrepancy in values between the current study and Morris et al. (2021; 0.39%).
Market-weight pig losses during transportation greatly impact animal well-being and industry economics (Ellis et al., 2003). Unfortunately, transport is an inevitable event in the modern pig industry and transportation conditions directly impact pig welfare, stress, and meat quality. Trailer design, space allocation during transport, distance traveled, and weather are major stressors associated with transportation losses and are well documented in the literature (Ritter et al., 2007; Fitzgerald et al., 2009; Pilcher et al., 2011). Because of these studies, pork producers implemented numerous techniques and operating procedures to reduce non-ambulatory pig incidence (Fitzgerald et al., 2009); however, few studies focus on trailer vibration impacts on pig stress and muscle fatigue and function (Randall et al., 1996; Sutherland et al., 2006).
Randall (1992) and Peeters et al. (2008) concluded that livestock experienced greater vibrations than truck drivers and that trailers were weakly dampened structures not designed to minimize vibrations. Each trailer section’s vibration patterns were analyzed in the present study, but individual compartments did not differ in RMS or VDV accelerations; however, pigs transported in trailers’ bottom decks were exposed to greater RMS and VDV accelerations than pigs transported in top decks by 54.8% to 67.6% on the z-axis and 63.3% to 76.1% on the x,y-axis during LOD and TRA. Multiple studies reported that accelerations were more prominent in bottom decks because vibrations were transmitted from the tires and chassis directly to the bottom deck and then to the top deck (Aradom and Gebresenbet, 2013; Morris et al., 2021). By contrast with the current study, Morris et al. (2021) reported that the bottom aft compartment z-axis and x,y-axis RMS and VDV accelerations were greater by 152% to 181% compared with other compartments. The present study used two straight-deck trailers with newer truck and trailer models than those used by Morris et al. (2021), who combined data from various potbelly and straight-deck trailers. Ritter et al. (2007) and Ritter et al. (2008) found that pigs transported in potbelly trailers showed increased fatigue when compared with pigs transported in straight-deck trailers. In addition to observing differences in trailer type, the present study had the same two drivers throughout data collection, allowing a more consistent driving style. Peeters et al. (2008) reported that driving style affected horizontal accelerations but not vertical accelerations and increased pigs’ stress levels. Furthermore, Aradom and Gebresenbet (2013) demonstrated that different drivers produced divergent vibration levels. Therefore, the type of trailer and consistency of drivers could be the reason for the absence of individual compartment differences in the current study.
There are no guidelines for evaluating the physiological impact of exposing pigs to vibrations; however, Perremans et al. (1998) reported that piglets experiencing greater accelerations demonstrated heart measures indicative of greater stress. The ISO standard is based on human whole-body exposure to vibrations, but Randall et al. (1996) stated that ISO standards were the best-available guidance to estimate discomfort in animals. Although past studies used the ISO threshold as a reference, Gebresenbet et al. (2011) used the ISO when evaluating vibration levels and frequencies in dairy cows and later investigated vibration effects on postural stability in cattle and pig behavior (Aradom and Gebresenbet, 2013). The ISO 2631-1 provides a list of approximate comfort levels, with their respective RMS and VDV thresholds, where EAV and ELV values correspond to comfort levels categorized as “injury possible” and “injury likely”, respectively (ISO 2631-1, 1997; Morris et al., 2021).
In the present study, a greater percentage of compartments violated the EAV and ELV thresholds in the x,y-axis, possibly indicating that vibrations in this orientation were more impactful than in the z-axis orientation.
Morris et al. (2021) observed that RMS and VDV accelerations exceed ISO thresholds more on the z-axis. In potbelly trailers, trailer compartments’ z-axis RMS and VDV accelerations exceeded the EAV threshold by 100% and exceeded the ELV threshold by 64.4% and 57.8%, respectively. On straight-deck trailers, trailer compartments’ RMS and VDV exceeded the EAV threshold by 96.2% and 94.1%, respectively, and exceeded ELV by 47.2 and 37.2%, respectively. On the x,y-axis orientation, EAV and ELV thresholds were exceeded by potbelly trailer RMS values by 67% and 14%, respectively, while straight-deck trailers violated thresholds by 41% and 9%, respectively. It is unknown why the results of the current study differ, but possible factors include trailer type, driver, types of roads, weather, number of curves (more in North Carolina than in Kansas), and trailer age/upkeep. These are all factors that are uncontrollable in an industry study such as the present one.
Gebresenbet et al. (2011) reported that vibration exposure values were 0.11 and 0.46 m/s2 above the European Union EAV threshold of 0.5 m/s2 on the z-axis and x,y-axis, respectively. Randall (1992) stated that random horizontal axis movement was the greatest contributor to postural instability, which increases discomfort. Although ISO standards do not provide a specific exposure time period to elicit injury, prolonged (over years) and repetitive exposure would be required to cause substantial effects. However, this does not mean that the vibrations pigs are experiencing are not causing injury or muscle fatigue, especially given the flooring they are transported on. This question should be addressed by subsequent research.
The divergent atmospheric conditions of the current study influenced in-trailer temperature and humidity patterns experienced by transported pigs. Environmental conditions and trailer compartment locations can impact pig comfort and welfare. Thermal variations between trailer compartments occur because of the lack of ventilation due to trailer pressure distribution variation during transportation (Machado et al., 2021a; Machado et al., 2021b). In the current study and during morning LOD, the fore section had 1.5°C-greater ambient and delta-temperatures than the averages of the center and aft sections. This resulted in the fore section having a THI 2.3 units greater than these sections. During morning UDL, the fore section had 1.2°C-greater ambient and delta-temperatures than the aft section, but there were no effects on THI. In afternoon transport sessions, the fore section had only 0.9°C-greater ambient and delta-temperatures than the aft section during UDL. The increased temperatures and THI experienced in the fore compartments is in agreement with Brown et al. (2011); Machado et al. (2021b), and Morris et al. (2021), who also reported that the fore compartments had greater temperature than the other compartments by 2.1°C, 0.65°C, and 2.5°C, respectively. During warm ambient temperatures, Pereira et al. (2018) and Moak et al. (2022) observed similar results where the BF section had a greater THI value than other compartments in potbelly trailers by 1.91 and 1.97 units, respectively. In addition, a greater serum creatine kinase concentration level was also observed in pigs transported in the BF section (Moak et al., 2022), associated with greater temperatures and THI values. Brown et al. (2011) attributed greater BF temperature and THI to the section’s proximity to external heat sources such as the truck engine, floor, and wheels, and the restricted ventilation by the truck cabin in front of the compartment. The current study’s results may indicate that the time of day affects the temperatures pigs experience in various compartments, especially when trailers are not moving and are subjected to increased airflow.
In the current study, RH on trailers was greater during the LOD stage for all trips and decreased during TRA and TRA+30 stages. Pilcher et al. (2011) stated that relative humidity increased during stops and during waiting times in farm and plant facilities. Relative humidity results indicated that airflow and dynamics during transportation were responsible for the RH decrease during TRA and TRA+30 and RH increase during ULD, which is typical for passively ventilated trailers (Dewey et al., 2009). The same trend of RH decrease and increase throughout the transportation process was observed by Morris et al. (2021), with a 0.2% to 6.79% decrease during TRA and a 2.4% to 2.8% increase during stationary or UDL. Unlike temperature trends in the current study, the trailer section did not affect relative humidity measures during morning and afternoon transport. Xiong et al. (2018) found that the humidity and humidity index did not vary among different potbelly trailer sections during mild, warm, and very hot weather conditions. During colder conditions, Morris et al. (2021) found that fore and center sections of potbelly and straight-deck trailers had a 4.3%-greater relative humidity than the aft section. Therefore, this indicates that relative humidity differences within trailers could be influenced by the time of year.
Although trailer sections’ temperatures differed during morning LOD and UDL, there were trailer deck differences in morning temperatures during all stages of transport. Throughout all stages of transport, the bottom deck had on average 1.3°C-greater temperatures than the top deck. This could be due to roof vents on the top deck being open, which allowed hot air to rise and escape the deck. At 30 minutes after transport through unloading, the bottom deck had 5.8% less morning relative humidity than the top deck. Despite this, the bottom deck’s THI was greater through all transportation stages by 1.7 units. Differences seen in the morning were eliminated in the afternoon, except LOD top deck temperature measures and THIs, which were greater than the bottom deck by 1.3°C and 1.4 unit, respectively. The increased temperature could have been from the direct sun that exposure pigs experienced due to roof vents being open and the lack of airflow when there was no trailer movement. Morris et al. (2021) observed similar results where the bottom decks had a greater ambient temperature and relative humidity by 2.7°C and 4.1%, respectively, during winter. (Machado et al. 2021a; 2021b) stated that bottom decks have greater temperatures due to thermal heat core formation resulting in a reduced heat removal rate. Generally, the trailer’s top decks have favorable ventilation conditions for pigs during transportation, but Machado et al. (2021a) stated that pigs transported in top decks were more susceptible to physical stress related to direct solar exposure, which could add to stress. The authors also reported that divergent conditions experienced by pigs transported on straight-deck trailer bottom decks caused them to possess greater rectal temperature and respiratory rate than pigs transported on top decks by 0.69°C and 4.6 breaths/min, respectively. The current study’s results indicate that the bottom deck possesses an unfavorable microclimate during transport in the morning, most likely due to airflow differences, and the top deck possesses an unfavorable microclimate in the afternoon when the trailer is not moving and pigs are exposed to direct sunlight.
Elevated THI during live transport is considered the most relevant risk factor for injured and non-ambulatory pigs (Machado et al., 2021b). Xiong et al. (2015) stated that THI provided a comparative assessment of in-trailer conditions; however, a dispute exists over the THI calculation’s usefulness in determining emergency severity associated with heat stress (EFSA AHAW Panel et al., 2022). Although deck and section differences were found mostly during morning transport, trailer compartments’ THI was in the “danger” or “emergency” category throughout the study. Fox et al. (2014) reported that as ambient temperature increased, THI increased. Pereira et al. (2018) reported that pigs demonstrated more activity when THI was reduced in a compartment’s microclimate. Machado et al. (2021b) observed greater skin temperature, rectal temperature, and lactate in pigs transported in compartments with a THI in the “danger” or “emergency” zone. Moak et al. (2022) reported that serum creatine kinase was 7% greater in the compartment with a THI greater than the ‘alert’ category. Although there are several interventions available for THI mitigation, opportunities do exist to make further improvements in this area.
The present study provided an evaluation of commercial straight-deck trailer vibration profiles and environmental conditions under industry conditions during summer. Study results limitations may lie in the fact two truck/trailer/driver combinations were observed, fewer loads were observed than in the Morris et al. (2021) study, and routes were not standardized. Although the argument could be made that observing fewer truck/trailer/driver combinations could provide less variable results or noisy data, this hypothesis would have to be tested in a controlled study under non-industry conditions. These data indicated that pigs transported in the bottom deck were exposed to hotter temperatures than pigs transported in the top deck during all stages of transportation. Moreover, pigs on the bottom deck were exposed to greater horizontal (x-axis and y-axis) accelerations. The implementation of ISO guidance demonstrated that trailer vibrations during transportation are beyond injury thresholds and may contribute to fatigue or non-ambulatory conditions. To further understand the exact effects of vibrations in pigs, further research is required to determine different strategies that allow the quantification of muscle fatigue during transportation.
The raw data supporting the conclusions of this article will be made available by the authors, without undue reservation.
The study methods were evaluated by the Institutional Animal Care and Use Committee (IACUC) at the University of Georgia and the study was determined not to require IACUC approval.
BM, JG, and RD contributed to the conception and design of the study. JG and KT contributed to the data collection for the study. BM and DA organized the database. DA, JG, and TO performed statistical analysis. DA wrote the first and final draft of the manuscript. JG, KT, LM, and RD contributed with manuscript edits. All authors contributed to manuscript revision, and read and approved the submission.
We thank the producers, drivers, and abattoir personnel (confidential identity and facilities) for allowing data to be collected on their trailers and facilities and for their time and cooperation with the present study.
This research was supported by an Animal Health and Production and Animal Products: Animal Well-being grant (no. 2018-67015-30090/project accession no. 1020292) from the USDA National Institute of Food and Agriculture.
The authors declare that the research was conducted in the absence of any commercial or financial relationships that could be construed as a potential conflict of interest.
All claims expressed in this article are solely those of the authors and do not necessarily represent those of their affiliated organizations, or those of the publisher, the editors and the reviewers. Any product that may be evaluated in this article, or claim that may be made by its manufacturer, is not guaranteed or endorsed by the publisher.
Anderson D. B., Ivers D. J., Benjamin M. E., Gonyou H. W., Jones D. J., Miller K. D., et al. (2002). “Physiological responses of market hogs to different handling practices,” in Proc. Am. Assoc. Swine Vet, Kansas City, MO. 399–400.
Aradom S., Gebresenbet G. (2013). Vibration on animal transport vehicles and related animal behaviours with special focus on pigs. J. Agric. Sci. Technol. 3 (3A), 231.
Brown J. A., Samarakone T. S., Crowe T., Bergeron R., Widowski T., Correa J. A., et al. (2011). Temperature and humidity conditions in trucks transporting pigs in two seasons in eastern and western Canada. Trans. ASABE 54 (6), 2311–2318. doi: 10.13031/2013.40650
Caulfield M. P., Cambridge H., Foster S. F., McGreevy P. D. (2014). Heat stress: A major contributor to poor animal welfare associated with long-haul live export voyages. Veterinary J. 199 (2), 223–228. doi: 10.1016/j.tvjl.2013.09.018
Conte S., Faucitano L., Bergeron R., Torrey S., Gonyou H. W., Crowe T., et al. (2015). Effects of season, truck type and location within truck on gastrointestinal tract temperature of market-weight pigs during transport. J. Anim. Sci. 93, 5840–5848. doi: 10.2527/jas.2015-9338
Correa J. A. (2011). Effect of farm handling and transport on physiological response, losses and meat quality of commercial pigs. Adv. Pork Production 22, 249–256.
Correa J. A., Gonyou H. W., Torrey S., Widowski T., Bergeron R., Crowe T. G., et al. (2013). Welfare and carcass and meat quality of pigs being transported for two hours using two vehicle types during two seasons of the year. Can. J. Anim. Science. 93, 43–55. doi: 10.4141/cjas2012-088
dalla Costa O. A., Faucitano L., Coldebella A., Ludke J. V., Peloso J. V., dalla Roza D., et al. (2007). Effects of the season of the year, truck type and location on truck on skin bruises and meat quality in pigs. Livestock Sci. 107 (1), 29–36. doi: 10.1016/j.livsci.2006.08.015
Dewey C., Haley C., Widowski T., Poljak Z., Friendship R. (2009). Factors associated with in-transit losses of fattening pigs. Anim. Welfare. 18 (4), 355–361.
Diemand D. (1991). Automotive and construction equipment for arctic use, materials problems. Cold Regins Tech. Digest. 91 (5), 1–23.
Driessen B., Van Beirendonck S., Buyse J. (2020). Effects of transport and lairage on the skin damage of pig carcasses. Animals 10 (4), 575. doi: 10.3390/ani10040575
EFSA AHAW Panel, Nielsen S. S., Alvarez J., Bicout D. J., Calistri P., Canali E., et al. (2022). Scientific opinion on the welfare of pigs during transport. EFSA J. 20 (9), 7445.
Ellis M., McKeith F., Hamilton D., Bertol T., Ritter M. (2003). “Analysis of the current situation: What do downers cost the industry and what can we do about it,” in Proceedings of the 4th American Meat Science Association Pork Quality Symposium, Columbia, MO. 1–3.
Fitzgerald R. F., Stalder K. J., Matthews J. O., Schultz Kaster C. M., Johnson A. K. (2009). Factors associated with fatigued, injured, and dead pig frequency during transport and lairage at a commercial abattoir. J. Anim. Sci. 87 (3), 1156–1166. doi: 10.2527/jas.2008-1270
Fox J., Widowski T., Torrey S., Nannoni E., Bergeron R., Gonyou H. W., et al. (2014). Water sprinkling market pigs in a stationary trailer. 1. effects on pig behaviour, gastrointestinal tract temperature and trailer micro-climate. Livestock Science. 160, 113–123. doi: 10.1016/j.livsci.2013.12.019
Gebresenbet G., Aradom S., Bulitta F. S., Hjerpe E. (2011). Vibration levels and frequencies on vehicle and animals during transport. Biosyst. Engineering. 110 (1), 10–19. doi: 10.1016/j.biosystemseng.2011.05.007
Gebresenbet G., Wikner I., Van De Water G., Freson L., Geers R. (2003). A smart system for surveillance of animal welfare during transport. Deutsche Tierarztliche Wochenschrift. 110 (12), 494–498.
Hamilton D. N., Ellis M., Bertol T. M., Miller K. D. (2004). Effects of handling intensity and live weight on blood acid-base status in finishing pigs. J. Anim. science. 82 (8), 2405–2409. doi: 10.2527/2004.8282405x
ISO 2631-1 (1997). Mechanical vibration and shock–evaluation of human exposure to whole-body vibration–part 1: general requirements (Geneva: International Organization for Standardization).
ISO 2631-5 (2018). Mechanical vibration and shock–evaluation of human exposure to whole-body vibration–part 5: method for evaluation of vibration containing multiple shocks (Geneva: International Organization for Standardization).
Kephart K. B., Harper M. T., Raines C. R. (2010). Observations of market pigs following transport to a packing plant. J. Anim. science. 88 (6), 2199–2203. doi: 10.2527/jas.2009-2440
Kephart R., Johnson A., Sapkota A., Stalder K., McGlone J. (2014). Establishing sprinkling requirements on trailers transporting market weight pigs in warm and hot weather. Animals 4 (2), 164–183. doi: 10.3390/ani4020164
Machado N. A., Barbosa-Filho J. A., Ramalho G. L., Pandorfi H., Da Silva I. J. (2021a). Trailer heat zones and their relation to heat stress in pig transport. Engenharia Agrícola. 41, 427–437. doi: 10.1590/1809-4430-eng.agric.v41n4p427-437/2021
Machado N. A., Martin J. E., Barbosa-Filho J. A. D., Dias C. T., Pinheiro D. G., de Oliveira K. P., et al. (2021b). Identification of trailer heat zones and associated heat stress in weaner pigs transported by road in tropical climates. J. Thermal Biol. 97, 102882. doi: 10.1016/j.jtherbio.2021.102882
Moak K. A., Bergeron R., Conte S., Bohrer B. M., Arrazola A., Devillers N., et al. (2022). Use of two novel trailer types for transportation of pigs to slaughter. i. effects on trailer microclimate, pig behaviour, physiological response, and meat quality under Canadian summer conditions. Can. J. Anim. Science., 1–14. doi: 10.1139/CJAS-2022-0023
Morris B. K., Davis R. B., Brokesh E., Flippo D. K., Houser T. A., Najar-Villarreal F., et al. (2021). Measurement of the three-axis vibration, temperature, and relative humidity profiles of commercial transport trailers for pigs. J. Anim. Science. 99 (2), 1–14 skab027. doi: 10.1093/jas/skab027
Padalino B., Tullio D., Cannone S., Bozzo G. (2018). Road transport of farm animals: mortality, morbidity, species and country of origin at a southern Italian control post. Animals 8 (9), 155. doi: 10.3390/ani8090155
Peeters E., Deprez K., Beckers F., De Baerdemaeker J., Aubert A. E., Geers R. (2008). Effect of driver and driving style on the stress responses of pigs during a short journey by trailer. Anim. Welfare-Potters Bar Then Wheathmpsted 17 (2), 189.
Pereira T. L., Titto E. A. L., Conte S., Devillers N., Sommavilla R., Diesel T., et al. (2018). Application of a ventilation fan-misting bank on pigs kept in a stationary trailer before unloading: Effects on trailer microclimate, and pig behaviour and physiological response. Livestock Science. 216, 67–74. doi: 10.1016/j.livsci.2018.07.013
Pérez M. P., Palacio J., Santolaria M. P., Aceña M. C., Chacón G., Gascón M., et al. (2002). Effect of transport time on welfare and meat quality in pigs. Meat science. 61 (4), 425–433. doi: 10.1016/S0309-1740(01)00216-9
Perremans S., Randall J. M., Allegaert L., Stiles M. A., Rombouts G., Geers R. (1998). Influence of vertical vibration on heart rate of pigs. J. Anim. Science. 76 (2), 975–981. doi: 10.2527/1998.762416x
Perremans S., Randall J. M., Rombouts G., Decypere E., Geers R. (2001). Effect of whole-body vibration in the vertical axis on cortisol and adrenocorticotropic hormone levels in piglets. J. Anim. Science. 79 (4) 975–981. doi: 10.2527/2001.794975x
Pilcher C. M., Ellis M., Rojo-Gómez A., Curtis S. E., Wolter B. F., Peterson C., et al. (2011). Effects of floor space during transport and journey time on indicators of stress and transport losses of market-weight pigs. J. Anim. Science. 89 (11), 3809–3818. doi: 10.2527/jas.2010-3143
Randall J. M. (1992). Human subjective response to lorry vibration: Implications for farm animal transport. J. Agric. Eng. Res. 52, 295–307. doi: 10.1016/0021-8634(92)80068-4
Randall J. M., Cove M. T., White R. P. (1996). Resonant frequencies of broiler chickens. Anim. Science. 62 (2), 369–374. doi: 10.1017/S1357729800014697
Rebelle J. (2021). Truck loading or unloading operations: Reduction of the whole-body vibration exposure of pallet truck drivers at the dock leveller location. Int. J. Ind. Ergonomics. 83, 103127. doi: 10.1016/j.ergon.2021.103127
Ritter M., Ellis M. (2008). “Effect of season and trailer design on transport losses in market weight pigs,” in Presentation at the Livestock Transport Conference, Kansas City, MO, USA. 620.
Ritter M. J., Ellis M., Berry N. L., Curtis S. E., Anil L., Berg E., et al. (2009). Transport losses in market weight pigs: I. a review of definitions, incidence, and economic impact. Prof. Anim. Scientist. 25 (4), 404–414. doi: 10.15232/S1080-7446(15)30735-X
Ritter M. J., Ellis M., Bertelsen C. R., Bowman R., Brinkmann J., DeDecker J. M., et al. (2007). Effects of distance moved during loading and floor space on the trailer during transport on losses of market weight pigs on arrival at the packing plant. J. Anim. Science. 85 (12), 3454–3461. doi: 10.2527/jas.2007-0232
Ritter M. J., Ellis M., Bowman R., Brinkmann J., Curtis S. E., DeDecker J. M., et al. (2008). Effects of season and distance moved during loading on transport losses of market-weight pigs in two commercially available types of trailer. J. Anim. Science. 86 (11), 3137–3145. doi: 10.2527/jas.2008-0873
Ritter M. J., Ellis M., Brinkmann J., DeDecker J. M., Keffaber K. K., Kocher M. E., et al. (2006). Effect of floor space during transport of market-weight pigs on the incidence of transport losses at the packing plant and the relationships between transport conditions and losses. J. Anim. Science. 84 (10), 2856–2864. doi: 10.2527/jas.2005-577
Ritter M. J., Yoder C. L., Jones C. L., Carr S. N., Calvo-Lorenzo M. S. (2020). Transport losses in market weight pigs: II. US incidence and economic impact. Trans. Anim. Science. 4 (2), 1103–1112. doi: 10.1093/tas/txaa041
Schwartzkopf-Genswein K. S., Faucitano L., Dadgar S., Shand P., González L. A., Crowe T. G. (2012). Road transport of cattle, swine and poultry in north America and its impact on animal welfare, carcass and meat quality: A review. Meat science. 92 (3), 227–243. doi: 10.1016/j.meatsci.2012.04.010
Sommavilla R., Faucitano L., Gonyou H., Seddon Y., Bergeron R., Widowski T., et al. (2017). Season, transport duration and trailer compartment effects on blood stress indicators in pigs: Relationship to environmental, behavioral and other physiological factors, and pork quality traits. Animals 7 (2), 8. doi: 10.3390/ani7020008
Stephens D. B., Sharman D. F., Ingram D. L., Bailey K. J. (1985). An analysis of some behavioural effects of the vibration and noise components of transport in pigs. quarterly journal of experimental physiology. Translation Integration. 70 (2), 211–217. doi: 10.1113/expphysiol.1985.sp002904
Streijger F., Lee J. H., Chak J., Dressler D., Manouchehri N., Okon E. B., et al. (2015). The effect of whole-body resonance vibration in a porcine model of spinal cord injury. J. Neurotrauma. 32 (12), 908–921. doi: 10.1089/neu.2014.3707
Sutherland M. A., McDonald A., McGlone J. J. (2006). “Factors influencing the percentage of dead and fatigued pigs during transport,” in Proc. 19th IPVS Congr, Copenhagen, Denmark. 609.
Xiong Y., Gates R. S., Green-Miller A. R. (2018). Factors affecting trailer thermal environment experienced by market pigs transported in the US. Animals 8 (11), 203. doi: 10.3390/ani8110203
Keywords: accelerations, animal well-being, environment, fatigued pig syndrome, stress, transport loss
Citation: Alambarrio DA, Morris BK, Davis RB, Turner KK, Motsinger LA, O’Quinn TG and Gonzalez JM (2022) Commercial straight-deck trailer vibration and microclimate conditions during market-weight pig transport during summer. Front. Anim. Sci. 3:1051572. doi: 10.3389/fanim.2022.1051572
Received: 23 September 2022; Accepted: 15 November 2022;
Published: 12 December 2022.
Edited by:
Genaro C. Miranda-de La Lama, University of Zaragoza, SpainReviewed by:
Mette S. Herskin, Aarhus University, DenmarkCopyright © 2022 Alambarrio, Morris, Davis, Turner, Motsinger, O’Quinn and Gonzalez. This is an open-access article distributed under the terms of the Creative Commons Attribution License (CC BY). The use, distribution or reproduction in other forums is permitted, provided the original author(s) and the copyright owner(s) are credited and that the original publication in this journal is cited, in accordance with accepted academic practice. No use, distribution or reproduction is permitted which does not comply with these terms.
*Correspondence: John M. Gonzalez, am9obmdvbnpAdWdhLmVkdQ==
Disclaimer: All claims expressed in this article are solely those of the authors and do not necessarily represent those of their affiliated organizations, or those of the publisher, the editors and the reviewers. Any product that may be evaluated in this article or claim that may be made by its manufacturer is not guaranteed or endorsed by the publisher.
Research integrity at Frontiers

Learn more about the work of our research integrity team to safeguard the quality of each article we publish.