 Godstime Taiwo1
 Modoluwamu Idowu1Shelby Collins1Taylor Sidney1Matthew Wilson1
 Andres Pech-Cervantes2
 Ibukun M. Ogunade1*
- 1Division of Animal and Nutritional Sciences, West Virginia University, Morgantown, WV, United States
- 2Agricultural Research Station, Fort Valley State University, Fort Valley, GA, United States
We applied chemical group-based metabolomics to identify blood metabolic signatures associated with residual feed intake in beef cattle. A group of 56 crossbred growing beef steers (average BW = 261.3 ± 18.5 kg) were adapted to a high-forage total mixed ration in a confinement dry lot equipped with GrowSafe intake nodes for period of 49 d to determine their residual feed intake classification (RFI). After RFI determination, weekly blood samples were collected three times from beef steers with the lowest RFI [most efficient (HFE); n = 8] and highest RFI and least-efficient [least efficient (LFE); n = 8]. Plasma was prepared by centrifugation and composited for each steer. Metabolome analysis was conducted using a chemical isotope labeling (CIL)/liquid chromatography–mass spectrometry, which permitted the analysis of metabolites containing amine/phenol-, carboxylic acid-, and carbonyl-chemical groups, which are metabolites associated with metabolisms of amino acids, fatty acids, and carbohydrates, respectively. A total number of 495 amine/phenol-containing metabolites were detected and identified; pathway analysis of all these metabolites showed that arginine biosynthesis and histidine metabolism were enriched (P < 0.10) in HFE, relative to LFE steers. Biomarker analyses of the amine/phenol-metabolites identified methionine, 5-aminopentanoic acid, 2-aminohexanedioic acid, and 4-chlorolysine as candidate biomarkers of RFI [false discovery rate ≤ 0.05; Area Under the Curve (AUC) > 0.90]. A total of 118 and 330 metabolites containing carbonyl- and carboxylic acid-chemical groups, respectively were detected and identified; no metabolic pathways associated with these metabolites were altered and only one candidate biomarker (methionine sulfoxide) was identified. These results identified five candidate metabolite biomarkers of RFI in beef cattle which are mostly associated with amino acid metabolism. Further validation using a larger cohort of beef cattle of different genetic pedigree is required to confirm these findings.
Introduction
Due to rising feed costs, efficiency of feed nutrient use for better growth performance continues to be of significant interest (Holmgren and Feuz, 2015). Residual feed intake (RFI), a measure of feed efficiency in beef cattle, is known to be moderately heritable (Koch et al., 1963; Herd et al., 2004) and has been improved over the years via genetic selection (Arthur et al., 2001). However, factors other than genetic factors, including differences in host metabolism and gut microbiome contribute to variation in RFI (Herd and Arthur, 2009; Myer et al., 2017). Consequently, several studies have focused on understanding the physiological mechanisms that cause differences in RFI, the difference between an animal's actual intake vs. its predicted feed intake based on average daily gain (ADG) and metabolic body weight (Koch et al., 1963; Herd and Arthur, 2009). Animals with low (negative) RFI values consume less feed than expected and are feed efficient whereas animals with high (positive) RFI values consume more feed than expected and are feed inefficient (Koch et al., 1963).
In recent years, the advent of metabolomics has provided an opportunity to comprehensively analyze multiple metabolites in biological samples. Indeed, several studies have applied metabolomics to provide insight into the metabolic status of animals with varying RFI with a twin-goal of identifying blood metabolic signatures that could be used as predictive biomarkers due to the high cost associated with the direct measurement of RFI in animals (Goldansaz et al., 2020). Studies that have attempted to identify candidate biomarkers of RFI mostly applied analytical tools, such as nuclear magnetic resonance and liquid chromatography–mass spectrometry (LC-MS) (Connolly et al., 2019; Goldansaz et al., 2020). However, due to limited sensitivity and/or quantitative accuracy of these methods, only a small number of high-abundance metabolites can be analyzed (Pan and Raftery, 2007; Imperlini et al., 2016). The chemical isotope labeling (CIL) LC-MS is a metabolomics technique that provides a new opportunity to perform chemical-group-based metabolome profiling (Zhao and Li, 2020). This method can detect thousands of metabolites based on their chemical groups (such as amine/phenol, carbonyl, and carboxylic acid chemical groups) in biological samples thereby allowing a holistic view of the metabolome with highly accurate metabolite quantification (Zhao et al., 2019). Metabolites containing amine/phenol, carbonyl, and carboxylic acid chemical groups are common intermediates and/or end products of metabolisms of amino acids, carbohydrate (such as glucose), and fatty acids, respectively. Due to the functional roles of amino acids, carbohydrate, and fatty acids and their associated metabolic pathways on animal health and productivity, we hypothesized that metabolites related to their metabolisms could serve as candidate biomarkers of RFI. Therefore, the objective of this study was to analyze the plasma amine/phenol-, carbonyl-, and carboxylic acid-metabolome of crossbred beef steers divergent for high and low RFI to identify blood metabolic signatures that could serve as candidate biomarkers for divergent RFI in beef cattle.
Materials and Methods
Animals, Feeding, RFI Determination, and Blood Sample Collection
The research procedures were approved by the Institutional Animal Care and Use Committees of West Virginia University (protocol number 1608003693). A group of 56 crossbred growing beef steers (average BW = 261.3 ± 18.5 kg) were adapted to a high-forage total mixed ration (TMR; primarily consisting of corn silage; ground hay; and a ration balancing supplement; CP = 13.2%, NDF = 45.9%, and NEg = 0.93 Mcal/kg) in a dry lot equipped with GrowSafe intake nodes. The dry lot was comprised of five pens of 1,500 m2 (with 312 m2 under roof), each served by six GrowSafe 8000 (GrowSafe Systems Ltd., Airdrie, Alberta, Canada) feeding nodes. Steers were assigned to the pens at random and identified with a passive, half-duplex, transponder ear tag (Allflex USA Inc., Dallas–Fort Worth, TX) before entry into the test facility. Specifically, the steers were allowed to adjust to the feeding facilities for 15 days before the start of the trial. After the adjustment period, individual feed intake was measured over 49 days. Daily BW for each animal were regressed on time using simple linear regression to calculate beginning BW, mid-test BW, and average daily gain (ADG). Animal ADG and metabolic mid-test BW (MMTW = mid-test BW0.75) were regressed against individual average daily dry matter intake (DMI), and RFI was calculated as the residual or the difference between the predicted value of the regression and the actual measured value based on the following equation: Y = β0 + β1X1 + β2X2 + ε, where Y is the observed DMI (kg/d), β0 is the regression intercept, β1 and β2 are the partial regression coefficients, X1 is the MMTW (kg), X2 is the ADG (kg/d), and ε indicates the RFI (kg/d) (Durunna et al., 2011).
At the end of the feed efficiency trial and after the RFI values were available, all animals were ranked by RFI coefficients. Based on the RFI coefficients, the most-efficient with the lowest RFI (HFE; n = 8) and the least-efficient with the highest RFI (LFE; n = 8) beef steers were selected, kept separate from other beef steers, and fed the same diet for additional 21 days (designated in this study as d 50 – 70). Blood samples from HFE and LFE steers were collected from the coccygeal vessels before the morning feeding on d 56, 63, and 70 into 10-mL vacutainer tubes containing sodium heparin (Vacutainer, Becton Dickinson, Franklin Lakes, NJ). Immediately after collection, the blood samples were placed on ice, and thereafter centrifuged at 1,500 × g for 20 min at 4°C to harvest the plasma. The plasma samples were then frozen at −80°C until later analysis.
Sample Preparation for Metabolome Analysis
The plasma samples collected on d 56, 63, and 70 were composited for each steer. Metabolites from the composited samples were first extracted using methanol-protein precipitation method as previously described by Zhao et al. (2019). The extracts were then re-dissolved in 200 μL water and stored at −80°C until metabolome analysis was performed.
CIL/LC-MS-Based Metabolomics Analysis
In-depth untargeted metabolome profiling of the extracted plasma was done using a CIL/LC-MS-based technique. The technique uses a differential 12C-/13C-isotope labeling to derivatize metabolites based on their chemical groups (amines/phenols, carboxylic acids, and carbonyls) (Zhao et al., 2019). Detailed description of the sample analysis including metabolite labeling, sample normalization using LC–ultraviolet quantification of the labeled metabolites, and LC-MS operating conditions and set-up have been described in a previous study (Zhao et al., 2019). Relative quantification of the 12C-/13C-labeled metabolites based on peak ratio values was analyzed using a Bruker Compact quadrupole time-of-flight MS (Bruker, Billerica, MA) linked to an UltiMate 3000 ultra-high-performance LC system (Thermo Scientific, MA). For each plasma sample, a total number of 16 LC-MS data files were generated (8 HFE samples and 8 LFE samples).
Metabolite Data Processing and Identification
All 16 raw LC-MS data files were processed using IsoMS Pro 1.0 using the procedures described by Mung and Li (2017). Briefly, the 12C-/13C-peak pairs were extracted from each run by the IsoMS software. In this step, the redundant pairs (those of adduct ions and dimers) and noise signal (having a singlet peak) were filtered out, only retaining a protonated ion of a peak pair for one true metabolite and then, the peak intensity ratio was calculated for each peak pair. The IsoMS-Quant program was then used to determine the chromatographic peak ratio of each peak pair and to generate the final metabolite-intensity table (Huan and Li, 2015). Metabolite identification was done using a two-tier identification approach. In tier 1, peak pairs from metabolite-intensity tables were searched against a chemical isotope-labeled (CIL) metabolite library based on accurate mass and retention time (RT) (Huan and Li, 2015). This CIL library contains 1,060 unique endogenous metabolites including 711 amines/phenols, 187 carboxylic acids, 85 hydroxyls, and 77 carbonyls. In tier 2, linked identity (LI) library was used for the identification of the remaining peak pairs based on accurate mass and predicted RT information. The LI Library contains over 2,000 metabolic-pathway-related metabolites extracted from the KEGG database (Li et al., 2013).
Statistical Analysis
Metabolite intensity values of each chemical group (amine/phenol, carbonyl, hydroxyl, and carboxylic acid) were separately imported MetaboAnalyst 5.0 software (https://www.metaboanalyst.ca/) for statistical analysis (Chong et al., 2019). Prior to statistical testing, log-transformation, normalization by median, and autoscaling of the data were performed. Median normalization was performed with the aim of eliminating undesirable inter-sample variations, and to ensure individual samples were truly comparable to one another. Auto-scaling was applied to make metabolites more comparable to each other in magnitude. Partial least squares discriminant analysis (PLS-DA) scores plot was generated to visualize the metabolome difference between treatments. Volcano plot analysis was performed to identify those metabolites that differed [false discovery rate (FDR) ≤ 0.05] between LFE and HFE steers. The utility of the metabolites with FDR ≤ 0.05 to serve as potential biomarkers of RFI was further tested using a receiver operating characteristic (ROC) curves as calculated by the ROCCET web server (Xia et al., 2013). Area under the curve (AUC), a value that combines sensitivity and specificity for a diagnostic test was used (Xia et al., 2013). Metabolites having AUC > 0.90 were chosen as potential biomarkers associated with RFI (Xia et al., 2013). Pathway analysis of all metabolites was also performed with a Bos taurus KEGG pathway library using global test for enrichment method and relative-betweeness centrality for topology analysis, to determine altered nutrient pathways between the two groups of animals.
Results
The results of the performance of LFE and HFE steers are shown in Table 1. The average RFI values of HFE and LFE steers were −1.93 and 2.01 kg/d, respectively. The initial BW, final BW, and ADG were similar between the two groups (P > 0.05); however, LFE steers had greater (P = 0.01) DMI (16.0 kg/d) than HFE steers (11.9 kg/d).
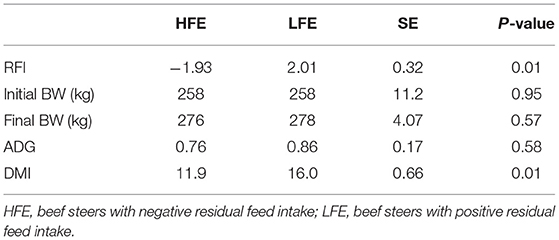
Table 1. Performance of beef steers with divergent residual feed intake.
Amine/Phenol-Metabolome Associated With Divergent RFI
A total number of 495 amine/phenol-containing metabolites were detected and identified (Supplementary Table 1). The PLS-DA plot showed clear separation between the two groups of steers using the first two principal components with 12.2 and 8.5% of explained variance (Figure 1), indicating that plasma amine/phenol-metabolome of the beef steers is associated with selection for RFI. A total of 42 differentially abundant (FDR ≤ 0.05) metabolites were detected between HFE and LFE steers (Figure 2). Plasma concentrations of 21 metabolites, including isomers of 4-chlorolysine, citrulline, ornithine, arginine, histamine, taurine, carnosine were greater (FDR ≤ 0.05) in HFE steers while 21 metabolites, including 3 isomers of 5-aminopentanoic acid, methionine, prolyl-methionine, and 2-aminohexanedioic acid were greater (FDR ≤ 0.05) in LFE steers (Table 2). The results of the ROC analysis revealed that four metabolites (methionine, 5-aminopentanoic acid, 2-aminohexanedioic acid, and 4-chlorolysine) with respective AUC values of 0.969, 0.906, 0.953, and 0.938 had sufficient specificity and sensitivity to qualify as candidate biomarkers of divergent high and low RFI values (Figure 3). The box plots showing the distributions of these candidate biomarkers in LFE and HFE steers are shown in Figure 4. Results of the pathway analysis of all metabolites showed that arginine biosynthesis and histidine metabolism were enriched (P < 0.10) in HFE, relative to LFE steers (Figure 5).
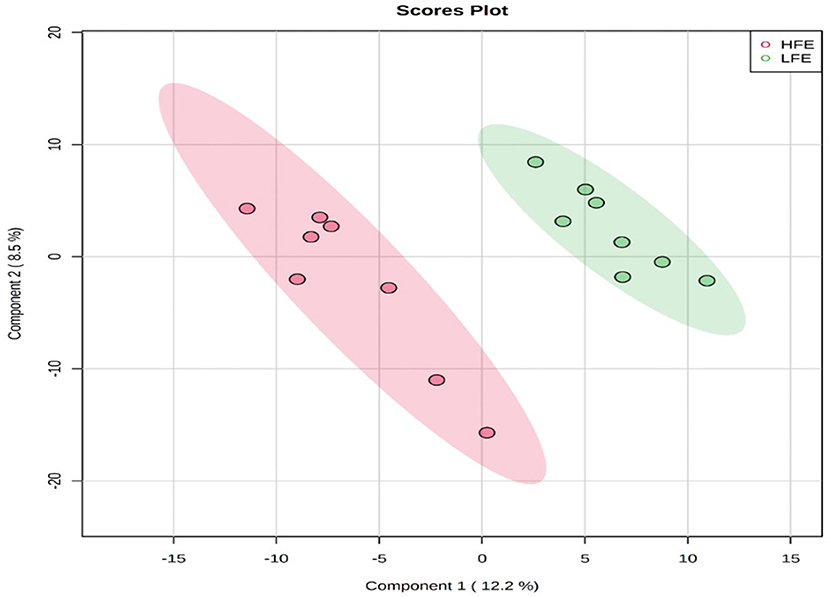
Figure 1. PLS-DA scores plot of amine/phenol-metabolome of LFE and HFE steers. HFE, beef steers with negative residual feed intake; LFE, beef steers with positive residual feed intake.
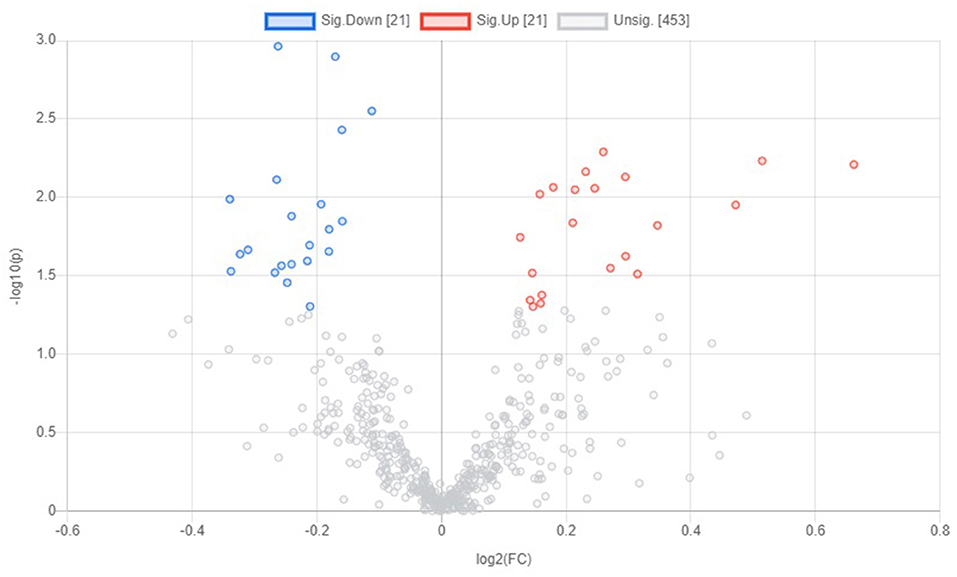
Figure 2. Volcano plot showing the differentially abundant amine/phenol-containing metabolites. Metabolites with false discovery ratio ≤ 0.05 (red or blue) are differentially increased or reduced in HFE, relative to LFE. HFE, beef steers with negative residual feed intake; LFE, beef steers with positive residual feed intake.
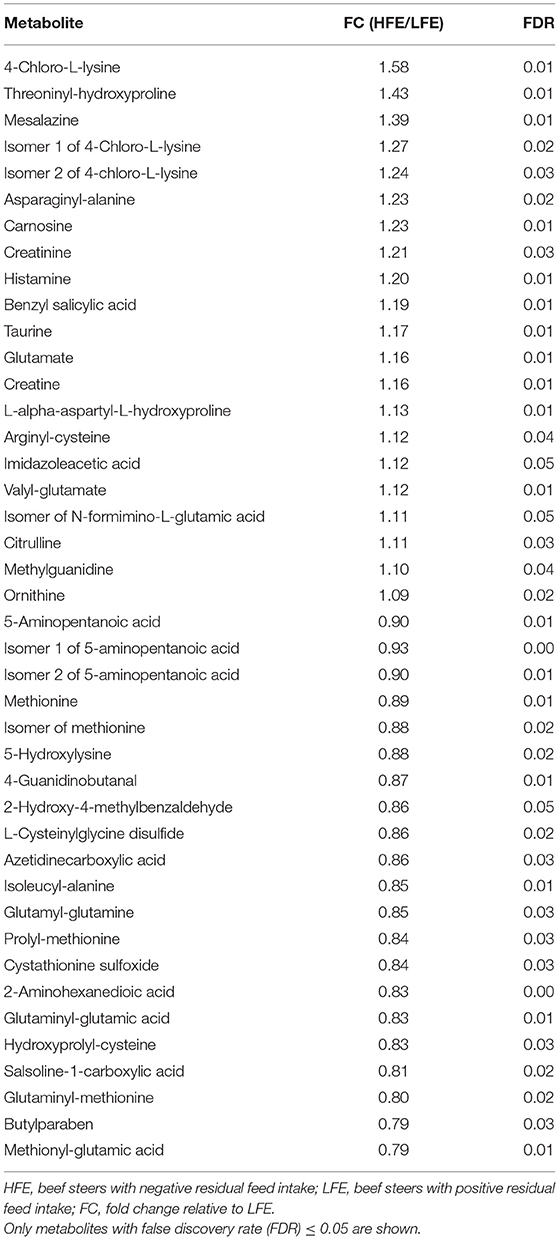
Table 2. Differentially abundant amine/phenol-metabolites in beef steers with divergent residual feed intake.
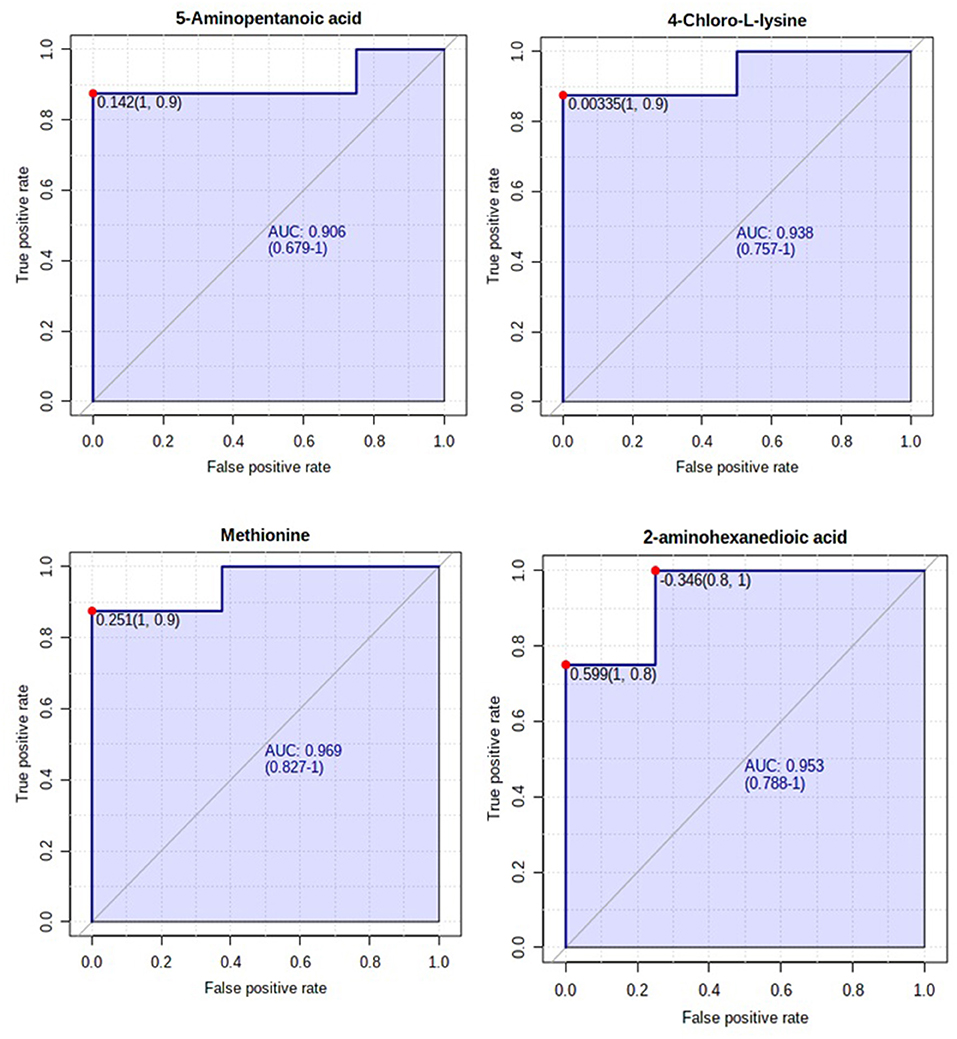
Figure 3. Biomarker analysis of plasma amine/phenol metabolome. ROC curve analysis of candidate plasma amine/phenol biomarkers (methionine, 5-aminopentanoic acid, 2-aminohexanedioic acid, and 4-chlorolysine) of beef steer with divergent RFI values.
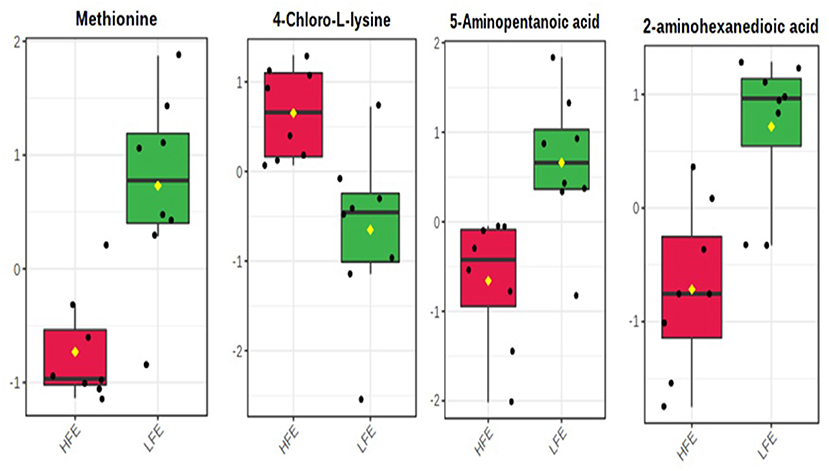
Figure 4. Relative distributions of the candidate plasma amine/phenol biomarkers of beef steer with divergent RFI values. HFE, beef steers with negative residual feed intake; LFE, beef steers with positive residual feed intake.
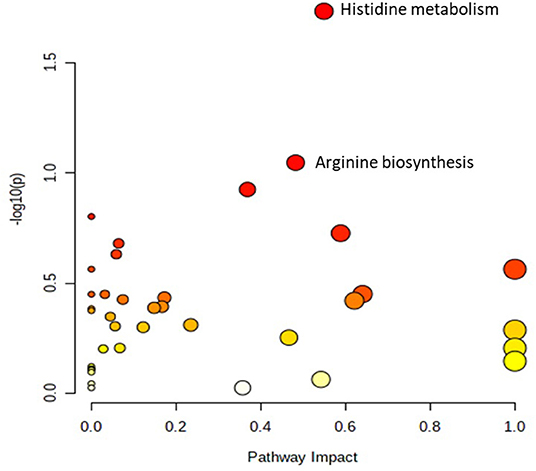
Figure 5. Pathway analysis of the amine/phenol-metabolites of beef steers with divergent RFI values. Metabolic pathways with –log10(P) ≥ 1.0 (equivalent to P ≤ 0.10) are enriched in HFE steers, relative to LFE. HFE, beef steers with negative residual feed intake; LFE, beef steers with positive residual feed intake.
Carbonyl-Metabolome Associated With Divergent RFI
A total of 118 carbonyl-containing metabolites were detected and identified (Supplementary Table 2). The PLSDA score plot showed a slight overlap, indicating little or no alterations in the carbonyl-metabolome of both groups (Figure 6A). A total of five differentially abundant (FDR ≤ 0.05) metabolites were detected (Figure 6B). Plasma concentrations of two metabolites (ethyl acetoacetic acid and 7-oxoheptanoic acid) were greater (FDR ≤ 0.05) in HFE whereas three metabolites (2-hydroxymethyl-4-oxobutanoic acid, glycolaldehyde, and koeniginequinone B were greater (FDR ≤ 0.05) in LFE steers (data not shown). All the differentially abundant metabolites had AUC values <0.9 indicating that none of them had sufficient specificity and sensitivity to qualify as candidate biomarkers of divergent high and low RFI values. Pathway analysis of all the carbonyl-metabolites revealed no altered (P > 0.10) metabolic pathway (Supplementary Figure 1).
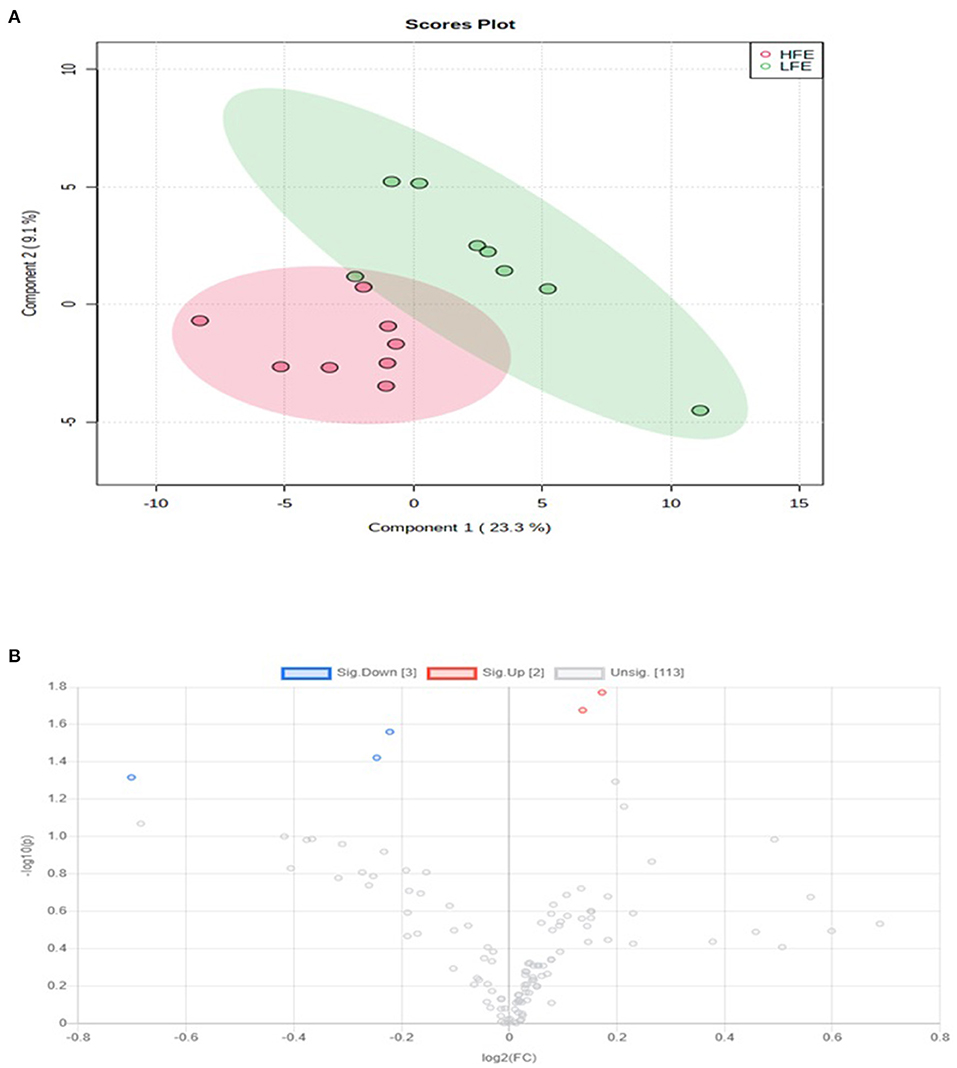
Figure 6. (A) PLS-DA scores plot of carbonyl-metabolome of LFE and HFE steers; (B) Volcano plot showing the differentially abundant carbonyl-containing metabolites. Metabolites with false discovery ratio ≤ 0.05 (red or blue) are differentially increased or reduced in HFE, relative to LFE. HFE, beef steers with negative residual feed intake; LFE, beef steers with positive residual feed intake.
Carboxylic Acid-Metabolome Associated With Divergent RFI
A total of 330 carboxyl-containing metabolites were detected and identified (Supplementary Table 3). The PLSDA score plot showed a slight overlap, indicating slight alterations in the carboxyl-metabolome between HFE and LFE steers (Figure 7A). A total of five differentially abundant (FDR ≤ 0.05) metabolites were detected (Figure 7B). Plasma concentrations of four metabolites (5-carboxy-alpha-chromanol, ureidoacrylic acid, 6-hydroxynicotinic acid, N-acetyl-L-proline) were greater (FDR ≤ 0.05) in HFE whereas only one metabolite (methionine sulfoxide) was greater (FDR ≤ 0.05) in LFE steers. The results of the ROC analysis revealed that only methionine sulfoxide with AUC value of 0.938 had sufficient specificity and sensitivity to qualify as candidate biomarker of divergent high and low RFI values (Figure 8). Pathway analysis of all the carboxylic acid-metabolites revealed no altered (P > 0.10) metabolic pathway (Supplementary Figure 2).
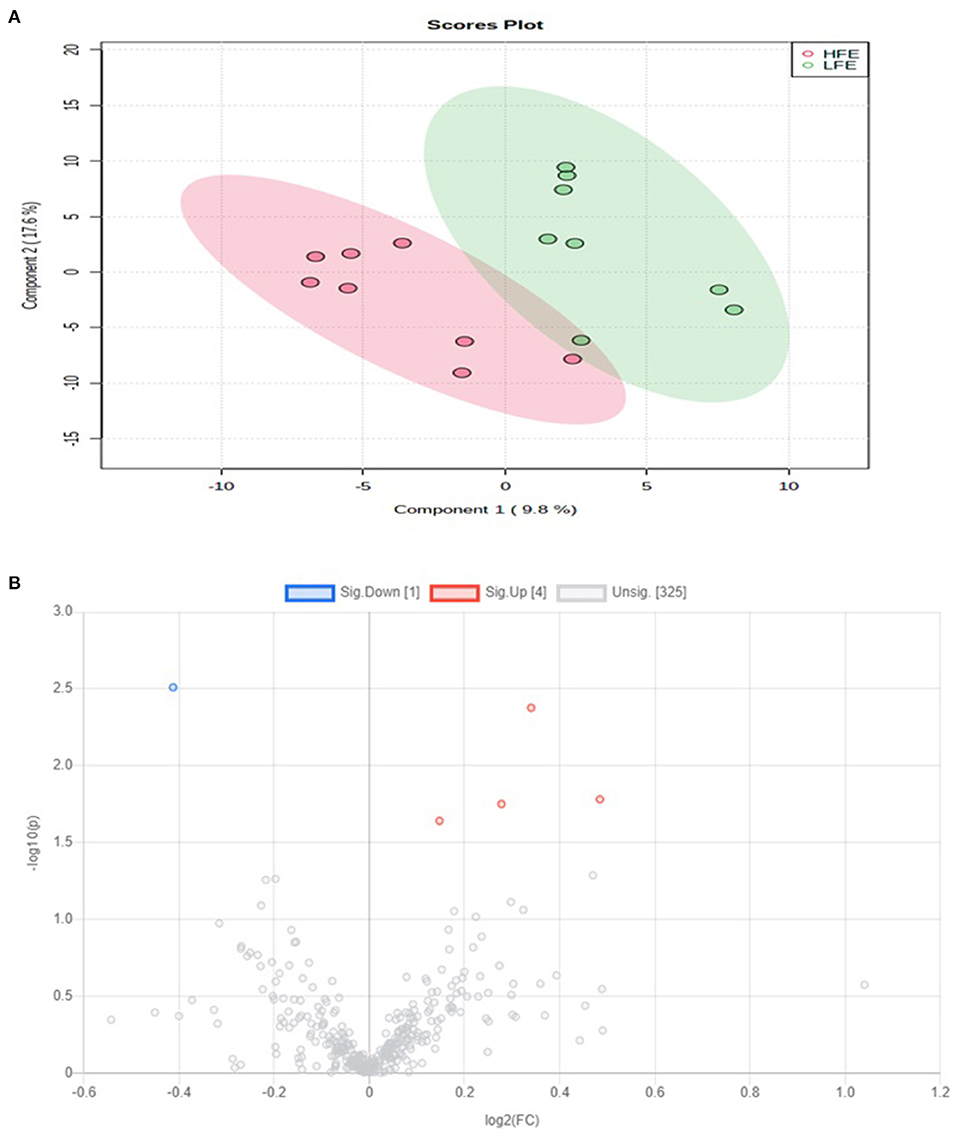
Figure 7. (A) PLS-DA scores plot of carboxyl-acid-metabolome of LFE and HFE steers; (B) Volcano plot showing the differentially abundant carboxylic acid-containing metabolites. Metabolites with false discovery ratio ≤ 0.05 (red or blue) are differentially increased or reduced in HFE, relative to LFE. HFE, beef steers with negative residual feed intake; LFE, beef steers with positive residual feed intake.
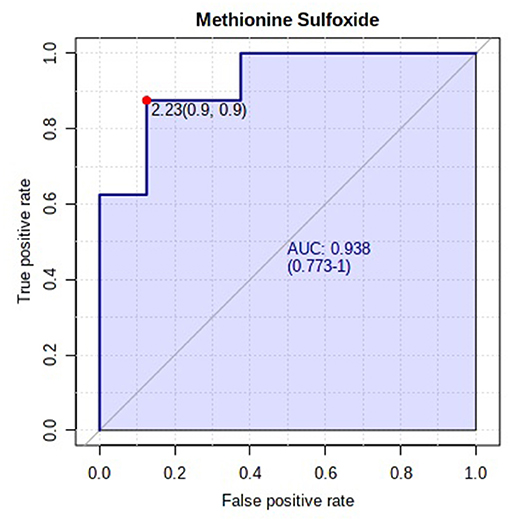
Figure 8. Biomarker analysis of plasma carboxylic acid-metabolome. ROC curve analysis of methionine sulfoxide.
Discussion
Metabolites containing amine/phenol chemical group are common intermediate and/or end products of amino acid metabolism (Zhao et al., 2019). Amino acid metabolism contributes largely to the productivity of farm animals due to its functional roles in various biochemical and metabolic processes in the cells of animals including growth, production, and reproduction. Altered plasma amine/phenol-metabolome of the beef steers suggests the significance of amino acid metabolism to productivity and feed efficiency of those animals. In this study, four amine/phenol-containing metabolites were identified as candidate biomarkers to classify beef steers into high and low-RFI groups: methionine, 5-aminopentanoic acid, 6-aminohexanoic acid, 4-chlorolysine, and 7-cyano-7-carbaguanine. Relative concentration of plasma methionine was lower in HFE, relative to LFE steers. Methionine is known to be the first limiting amino acid in growing beef cattle when microbial protein is the only source of amino acids (Richardson and Hatfield, 1978), and its deficiency in diet has been reported to be associated with poor growth performance in growing beef cattle (Ragland-Gray et al., 1997). In addition to the role of methionine in tissue protein synthesis, methionine can serve as a precursor for synthesis of other amino acids such as taurine, cysteine, apolipoprotein, and can donate its methyl groups, via S-adenosyl methionine, for synthesis of choline, carnitine, creatine, and phospholipids which are all essential for improved skeletal muscle and hepatic lipid metabolism for energy supply especially during reduced supply of glucose. In this study, lower plasma level of methionine in HFE steers was accompanied with higher plasma levels of taurine and creatine, which are known to regulate lipid metabolism in humans and farm animals (da Silva et al., 2014; Karisa et al., 2014; Ibrahim et al., 2019; Li et al., 2021). In a similar study, Karisa et al. (2014) reported that plasma concentration of creatine was associated with RFI. In the same study, creatine was reported to interact with AMP activated protein kinase which is known to stimulate hepatic and skeletal muscle fatty acid oxidation. When there is an insufficient glucose supply due to low DMI, as observed in HFE steers, to meet energy demands for growth and other physiological processes, there is normally an increased hepatic lipid catabolism to generate acetyl-CoA, which can enter the citric acid cycle to generate energy in the form of ATP and/or be converted to oxidative fuels including ketones (Rui, 2014). In support of our results, several studies have reported differences in tissue mitochondrial function, and amino acid and energy metabolisms in animals divergent for low and high RFI (Bottje and Carstens, 2009; Baldassini et al., 2018; Mukiibi et al., 2018). In a previous study, Mukiibi et al. (2018) reported upregulation of hepatic genes responsible for lipid secretion, transport and efux in more-efficient beef cattle compared to less-efficient ones. In dairy cattle, Salleh et al. (2018) reported that RFI status is associated with regulation of energy via hepatic lipid metabolism. Considering these facts, we speculate that reduced plasma concentration of methionine in HFE steers was probably due to its increased uptake by the hepatic cells to synthesize other metabolites that aid lipid beta-oxidation to compensate for reduced energy supply due to low DMI.
4-chlorolysine, a derivative of lysine, was identified as a candidate biomarker of RFI in this study. Lysine plays a significant role in tissue protein synthesis and energy metabolism (Tome and Bos, 2007). Plasma lysine concentration has been reported to be associated with RFI in two previous studies in beef heifer and steer (Karisa et al., 2014; Jorge-Smeding et al., 2019), although no AUC values were provided in both studies. In our study, higher level of 4-chlorolysine in HFE steers also corresponded to higher levels of 5-aminopentanoic acid and 2-aminohexanedioic acid, which were also identified as candidate biomarkers in this study. 5-aminopentanoic acid and 2-aminohexanedioic acid are intermediate products of lysine degradation (Guidetti and Schwarcz, 2003). In fact, in a recent study, 2-aminohexanedioic acid, also known as aminoadipic acid, has been previously identified as a candidate serum metabolite biomarker of RFI in sheep (Goldansaz et al., 2020). A study in rat revealed induced cell death and reduced tissue protein synthesis with in vitro supplementation of aminoadipic acid (Nishimura et al., 2000). Thus, a high level of 4-chlorolysine and low levels of 2-aminohexanedioic acid and 5-aminopentanoic acid would be expected to result in increased tissue protein synthesis in HFE steers.
Two amino acid metabolism-related pathways, histidine metabolism and arginine biosynthesis, were enriched in HFE steers, relative to LFE. Histidine metabolism results in production of several metabolites including glutamate, histamine, and carnosine, all of which were increased in HFE steers. Glutamate promotes neural functioning, cell proliferation, and the production of other amino acids (Wünschiers et al., 2012; Holeček, 2020). Histamine can function as a homeostatic neurotransmitter while carnosine exhibits anti-inflammatory and cytoprotective effects by scavenging free radicals and reducing protein glycation mostly in skeletal muscle (Mendelson, 2008; Wünschiers et al., 2012; Holeček, 2020). Arginine biosynthesis pathway synthesizes arginine and several intermediate products including citrulline and ornithine, all of which were increased in HFE steers. Arginine helps in the control of normal cell division, wound healing, and removal of ammonia via the urea cycle (Rhoads and Wu, 2009; Wünschiers et al., 2012). Enrichment of these aforementioned pathways and their associated metabolites in HFE steers is evidence of better health and immune status, relative to LFE steers. Our results concur with prior investigations that have attempted to associate blood metabolites with RFI in cattle; several of these studies have reported an association of a good number of amino acid metabolism-related metabolites including creatine, tyrosine, glycine, glutamine, ornithine, aspartate, lysine, and valine with RFI in beef cattle, although no AUC values for these metabolites were reported (Karisa et al., 2014; Clemmons et al., 2017; Jorge-Smeding et al., 2019).
Several studies that analyzed the hepatic transcriptome of beef cattle with divergent RFI reported altered expressions of genes related to lipid and carbohydrate metabolisms (Mukiibi et al., 2018; Higgins et al., 2019), indicating possibility of differences in their hepatic metabolisms which would be expected to lead to alterations in blood concentrations of their metabolites. In our study, none of the plasma metabolites related to carbohydrate and fatty acid metabolisms (carbonyl- and carboxylic acid-metabolome), except methionine sulfoxide, which is an oxidized form of methionine, qualified as candidate biomarkers in this study. In fact, very few related metabolites were differentially abundant, and no associated metabolic pathways were different between HFE and LFE steers. These results were unexpected given the significant roles of carbohydrate and fatty acid metabolisms to the health and productivity of ruminants. In fact, blood glucose, an important carbonyl-containing metabolite and non-esterified fatty acids (NEFA), which are carboxylic acid-containing metabolites, are often used as markers of health and energy status in ruminants (Gleghorn et al., 2004; Adewuyi et al., 2005). A possible explanation for the lack of difference may be because glucose is in continuous supply via gluconeogenesis in ruminants (Young, 1977). Increased concentrations of blood NEFA reflect extensive fat mobilization from body reserves due to negative energy balance and fatty acid release from adipocytes most especially during lactation period in high-yielding dairy cows (Bowden, 1971). Unlike in dairy cows, there is a little need for an extensive body fat mobilization which is not expected to cause a significant change in blood NEFA (Clemmons et al., 2017). In agreement with our results, two previous studies observed no differences in blood glucose and NEFA in beef cattle divergent for low and high RFI (Bourgon et al., 2017; Clemmons et al., 2017).
Conclusion
The findings of the present study demonstrate differences in the plasma amine/phenol-metabolome of beef steers with divergent high and low RFI values indicating an association between blood amino acid metabolic signatures and RFI divergence in beef steers. Two amino acid metabolic pathways, histidine metabolism and arginine biosynthesis, were found to be associated with RFI. Five candidate metabolite biomarkers of divergent RFI related to amino acid metabolism pathway (methionine, methionine sulfoxide, 5-aminopentanoic acid, 2-aminohexanedioic acid, and 4-chlorolysine) were identified in this study. Validation studies using a larger cohort of beef cattle of different genetic pedigree are needed to confirm the robustness of the candidate plasma biomarkers identified in this study.
Data Availability Statement
The original contributions presented in the study are included in the article/Supplementary Material, further inquiries can be directed to the corresponding author.
Ethics Statement
The animal study was reviewed and approved by Institutional Animal Care and Use Committees of West Virginia University.
Author Contributions
IO and MW designed the experiment. GT, IO, SC, TS, and MI conducted the experiment and analyzed the data. IO, GT, and AP-C drafted the manuscript. IO reviewed the final manuscript together with GT and MI. All authors contributed to the article and approved the submitted version.
Funding
This work was funded by West Virginia University Experimental Station (scientific article number 3419) in support of U.S. Department of Agriculture hatch multi-state regional project W-3010.
Conflict of Interest
The authors declare that the research was conducted in the absence of any commercial or financial relationships that could be construed as a potential conflict of interest.
Publisher's Note
All claims expressed in this article are solely those of the authors and do not necessarily represent those of their affiliated organizations, or those of the publisher, the editors and the reviewers. Any product that may be evaluated in this article, or claim that may be made by its manufacturer, is not guaranteed or endorsed by the publisher.
Supplementary Material
The Supplementary Material for this article can be found online at: https://www.frontiersin.org/articles/10.3389/fanim.2021.783314/full#supplementary-material
References
Adewuyi, A., Gruys, E., and Van Eerdenburg, F. (2005). Non esterified fatty acids (NEFA) in dairy cattle. A review. Vet. Q. 27, 117–126. doi: 10.1080/01652176.2005.9695192
Arthur, P. F., Archer, J. A., Johnston, D. J., Herd, R. M., Richardson, E. C., and Parnell, P. F. (2001). Genetic and phenotypic variance and covariance components for feed intake, feed efficiency, and other postweaning traits in Angus cattle. J. Anim. Sci. 79, 2805–2811. doi: 10.2527/2001.79112805x
Baldassini, W. A., Bonilha, S. F. M., Branco, R. H., Vieira, J. C. S., Padilha, P. M., and Lanna, D. P. D. (2018). Proteomic investigation of liver from beef cattle (Bos indicus) divergently ranked on residual feed intake. Mol. Biol. Rep. 45, 2765–2773. doi: 10.1007/s11033-018-4341-2
Bottje, W. G., and Carstens, G. E. (2009). Association of mitochondrial function and feed efficiency in poultry and livestock species. J. Anim. Sci. 87, 48–63. doi: 10.2527/jas.2008-1379
Bourgon, S. L., Diel de Amorim, M., Miller, S. P., and Montanholi, Y. R. (2017). Associations of blood parameters with age, feed efficiency and sampling routine in young beef bulls. Livestock Sci. 195, 27–37. doi: 10.1016/j.livsci.2016.11.003
Bowden, D (1971). Non-esterified fatty acids and ketone bodies in blood as indicators of nutritional status in ruminants: a review. Canad. J. Anim. Sci. 51, 1–13. doi: 10.4141/cjas71-001
Chong, J., Wishart, D. S., and Xia, J. (2019). Using MetaboAnalyst 4.0 for comprehensive and integrative metabolomics data analysis. Curr. Protoc. Bioinformatics 68:e86. doi: 10.1002/cpbi.86
Clemmons, B. A., Mihelic, R. I., Beckford, R. C., Powers, J. B., Melchior, E. A., McFarlane, Z. D., et al. (2017). Serum metabolites associated with feed efficiency in black angus steers. Metabolomics 13:147. doi: 10.1007/s11306-017-1282-z
Connolly, S., Dona, A., Wilkinson-White, L., Hamblin, D., D'Occhio, M., and González, L. A. (2019). Relationship of the blood metabolome to subsequent carcass traits at slaughter in feedlot Wagyu crossbred steers. Sci. Rep. 9:15139. doi: 10.1038/s41598-019-51655-2
da Silva, L. A., Tromm, C. B., Bom, K. F., Mariano, I., Pozzi, B., da Rosa, G. L., et al. (2014). Effects of taurine supplementation following eccentric exercise in young adults. Appl. Physiol. Nutri. Metab. 39, 101–104. doi: 10.1139/apnm-2012-0229
Durunna, O. N., Mujibi, F. D. N., Goonewardene, L., Okine, E. K., Wang, Z., and Moore, S. S. (2011). Feed efficiency differences and re-ranking in beef steers fed grower and finisher diets. J. Anim. Sci. 89, 158–167. doi: 10.2527/jas.2009-2514
Gleghorn, J. F., Elam, N. A., Galyean, M. L., Duff, G. C., Cole, N. A., and Rivera, J. D. (2004). Effects of crude protein concentration and degradability on performance, carcass characteristics, and serum urea nitrogen concentrations in finishing beef steers. J. Anim. Sci. 82, 2705–2717. doi: 10.2527/2004.8292705x
Goldansaz, S. A., Markus, S., Berjanskii, M., Rout, M., Guo, A. C., Wang, Z., et al. (2020). Candidate serum metabolite biomarkers of residual feed intake and carcass merit in sheep. J Anim Sci. 98:skaa298. doi: 10.1093/jas/skaa298
Guidetti, P., and Schwarcz, R. (2003). Determination of α-aminoadipic acid in brain, peripheral tissues, and body fluids using GC/MS with negative chemical ionization. Brain. Res. Mol. Brain. Res. 118, 132–139. doi: 10.1016/j.molbrainres.2003.08.004
Herd, R. M., and Arthur, P. F. (2009). Physiological basis for residual feed intake. J. Anim. Sci. 87(E. Suppl.), E64–E71. doi: 10.2527/jas.2008-1345
Herd, R. M., Oddy, V. H., and Richardson, E. C. (2004). Biological basis for variation in residual feed intake in beef cattle. 1. Review of potential mechanisms. Aust. J. Exp. Agric. 44, 431–440. doi: 10.1071/EA02220
Higgins, M. G., Kenny, D. A., Fitzsimons, C., Blackshields, G., Coyle, S., McKenna, C., et al. (2019). The effect of breed and diet type on the global transcriptome of hepatic tissue in beef cattle divergent for feed efficiency. BMC Genomics 20:525. doi: 10.1186/s12864-019-5906-8
Holeček, M (2020). Histidine in health and disease: metabolism, physiological importance, and use as a supplement. Nutrients 12:848. doi: 10.3390/nu12030848
Holmgren, L., and Feuz, D. (2015). 2015 Costs and Returns for a 200 Cow, Cow-Calf Operation. All Current Publications, paper 711. Available online at: http://digitalcommons.usu.edu/extension_curall/711 (accessed July 08, 2021).
Huan, T., and Li, L. (2015). Quantitative metabolome analysis based on chromatographic peak reconstruction in chemical isotope labeling liquid chromatography mass spectrometry. Anal. Chem. 87, 7011–7016. doi: 10.1021/acs.analchem.5b01434
Ibrahim, D., Sayed, R. E., Abdelfattah-Hassan, A., and Morshedy, A. M. (2019). Creatine or guanidinoacetic acid? Which is more effective at enhancing growth, tissue creatine stores, quality of meat, and genes controlling growth/myogenesis in Mulard ducks. J. Appl. Anim. Res. 47, 159–166. doi: 10.1080/09712119.2019.1590205
Imperlini, E., Santorelli, L., Orrù, S., Scolamiero, E., Ruoppolo, M., and Caterino, M. (2016). Mass spectrometry-based metabolomic and proteomic strategies in organic acidemias. BioMed Res. Int. 2016:9210408. doi: 10.1155/2016/9210408
Jorge-Smeding, E., Renand, G., Centeno, D., Pétéra, M., Durand, S., Polakof, S., et al. (2019). “Metabolomics reveals changes in urea cycle associated to residual feed intake in growing heifers,” in Energy and Protein Metabolism and Nutrition (Wageningen: Wageningen Academic), 231–232. doi: 10.3920/978-90-8686-891-9_50
Karisa, B., Moore, S., and Plastow, G. (2014). Analysis of biological networks and biological pathways associated with residual feed intake in beef cattle. Anim. Sci. J. 85, 374–387. doi: 10.1111/asj.12159
Koch, R. M., Swiger, L. A., Chambers, D., and Gregory, K. E. (1963). Efficiency of feed use in beef cattle. J. Anim. Sci. 22, 486–494. doi: 10.2527/jas1963.222486x
Li, L., Li, R., Zhou, J., Zuniga, A., Stanislaus, A. E., Wu, Y., et al. (2013). MyCompoundID: using an evidence-based metabolome library for metabolite identification. Anal. Chem. 85, 3401–3408. doi: 10.1021/ac400099b
Li, Y., Zang, Y., Zhao, X., Liu, L., Qiu, Q., Ouyang, K., et al. (2021). Dietary supplementation with creatine pyruvate alters rumen microbiota protein function in heat-stressed beef cattle. Front. Microbiol. 12:715088. doi: 10.3389/fmicb.2021.715088
Mendelson, S. D (2008). “Nutritional supplements and metabolic syndrome,” in Metabolic Syndrome and Psychiatric Illness, ed S. D. Mendelson (Cambridge, MA: Academic Press), 141–186. doi: 10.1016/B978-012374240-7.50012-7
Mukiibi, R., Vinsky, M., Keogh, K. A., Fitzsimmons, C., Stothard, P., Waters, S. M., et al. (2018). Transcriptome analyses reveal reduced hepatic lipid synthesis and accumulation in more feed efficient beef cattle. Sci. Rep. 8:7303. doi: 10.1038/s41598-018-25605-3
Mung, D., and Li, L. (2017). Development of chemical isotope labeling LC-MS for milk metabolomics: comprehensive and quantitative profiling of the amine/phenol submetabolome. Anal. Chem. 89, 4435–4443. doi: 10.1021/acs.analchem.6b03737
Myer, P. R., Freetly, H. C., Wells, J. E., Smith, T. P. L., and Kuehn, L. A. (2017). Analysis of the gut bacterial communities in beef cattle and their association with feed intake, growth, and efficiency. J. Anim. Sci. 95, 3215–3224. doi: 10.2527/jas.2016.1059
Nishimura, R. N., Santos, D., Fu, S. T., and Dwyer, B. E. (2000). Induction of cell death by l-alpha-aminoadipic acid exposure in cultured rat astrocytes: relationship to protein synthesis. Neurotoxicology 21, 313–320.
Pan, Z., and Raftery, D. (2007). Comparing and combining NMR spectroscopy and mass spectrometry in metabolomics. Anal. Bioanal. Chem. 387, 525–527. doi: 10.1007/s00216-006-0687-8
Ragland-Gray, K. K., Amos, H. E., Mccann, M. A., Williams, C. C., Sartin, J. L., Barb, C. R., et al. (1997). Nitrogen metabolism and hormonal responses of steers fed wheat silage and infused with amino acids or casein. J. Anim. Sci. 75, 3038–3045. doi: 10.2527/1997.75113038x
Rhoads, J. M., and Wu, G. (2009). Glutamine, arginine, and leucine signaling in the intestine. Amino Acids 7, 111–122 doi: 10.1007/s00726-008-0225-4
Richardson, C. R., and Hatfield, E. E. (1978). The limiting amino acids in growing cattle. J. Anim. Sci. 46, 740–745. doi: 10.2527/jas1978.463740x
Rui, L (2014). Energy metabolism in the liver. Compr. Physiol. 4, 177–197. doi: 10.1002/cphy.c130024
Salleh, S. M., Mazzoni, G., Løvendahl, P., and Kadarmideen, H. N. (2018). Gene co-expression networks from RNA sequencing of dairy cattle identifies genes and pathways affecting feed efficiency. BMC Bioinformatics 19:513. doi: 10.1186/s12859-018-2553-z
Tome, D., and Bos, C. (2007). Lysine Requirement through the Human Life Cycle. J. Nutri. 137, 1642–1645. doi: 10.1093/jn/137.6.1642S
Wünschiers, R., Jahn, M., Jahn, D., Schomburg, I., Peifer, S., Heinzle, E., et al. (2012). “Metabolism,” in Biochemical Pathways: An Atlas of Biochemistry and Molecular Biology, 2nd ed., eds G. Michal, and D. Schomburg (Hoboken, NJ: John Wiley & Sons, Inc), 37–209. doi: 10.1002/9781118657072
Xia, J., Broadhurst, D. I., Wilson, M., and Wishart, D. S. (2013). Translational biomarker discovery in clinical metabolomics: an introductory tutorial. Metabolomics 9, 280–299. doi: 10.1007/s11306-012-0482-9
Young, J (1977). Gluconeogenesis in cattle: Significance and methodology. J. Dairy Sci. 60, 1–15. doi: 10.3168/jds.S0022-0302(77)83821-6
Zhao, S., Li, H., Han, W., Chan, W., and Li, L. (2019). Metabolomic coverage of chemical-group-submetabolome analysis: group classification and four-channel chemical isotope labeling LC-MS. Anal. Chem. 91, 12108–12115. doi: 10.1021/acs.analchem.9b03431
Keywords: metabolome, amino acid, metabolism, methionine, lysine degradation
Citation: Taiwo G, Idowu M, Collins S, Sidney T, Wilson M, Pech-Cervantes A and Ogunade IM (2022) Chemical Group-Based Metabolome Analysis Identifies Candidate Plasma Biomarkers Associated With Residual Feed Intake in Beef Steers. Front. Anim. Sci. 2:783314. doi: 10.3389/fanim.2021.783314
Received: 26 September 2021; Accepted: 10 December 2021;
Published: 18 January 2022.
Edited by:
Otávio R. Machado Neto, São Paulo State University, BrazilReviewed by:
Welder A. Baldassini, São Paulo State University, BrazilRozaihan Mansor, Putra Malaysia University, Malaysia
Copyright © 2022 Taiwo, Idowu, Collins, Sidney, Wilson, Pech-Cervantes and Ogunade. This is an open-access article distributed under the terms of the Creative Commons Attribution License (CC BY). The use, distribution or reproduction in other forums is permitted, provided the original author(s) and the copyright owner(s) are credited and that the original publication in this journal is cited, in accordance with accepted academic practice. No use, distribution or reproduction is permitted which does not comply with these terms.
*Correspondence: Ibukun M. Ogunade, ibukun.ogunade@mail.wvu.edu