- 1Adaptation Physiology Group, Wageningen University & Research, Wageningen, Netherlands
- 2Department of Biosystems and Technology, Swedish University of Agricultural Sciences, Alnarp, Sweden
- 3Animals in Science and Society, Faculty of Veterinary Medicine, Utrecht University, Utrecht, Netherlands
Modern welfare definitions not only require that the Five Freedoms are met, but animals should also be able to adapt to changes (i. e., resilience) and reach a state that the animals experience as positive. Measuring resilience is challenging since relatively subtle changes in animal behavior need to be observed 24/7. Changes in individual activity showed potential in previous studies to reflect resilience. A computer vision (CV) based tracking algorithm for pigs could potentially measure individual activity, which will be more objective and less time consuming than human observations. The aim of this study was to investigate the potential of state-of-the-art CV algorithms for pig detection and tracking for individual activity monitoring in pigs. This study used a tracking-by-detection method, where pigs were first detected using You Only Look Once v3 (YOLOv3) and in the next step detections were connected using the Simple Online Real-time Tracking (SORT) algorithm. Two videos, of 7 h each, recorded in barren and enriched environments were used to test the tracking. Three detection models were proposed using different annotation datasets: a young model where annotated pigs were younger than in the test video, an older model where annotated pigs were older than the test video, and a combined model where annotations from younger and older pigs were combined. The combined detection model performed best with a mean average precision (mAP) of over 99.9% in the enriched environment and 99.7% in the barren environment. Intersection over Union (IOU) exceeded 85% in both environments, indicating a good accuracy of the detection algorithm. The tracking algorithm performed better in the enriched environment compared to the barren environment. When false positive tracks where removed (i.e., tracks not associated with a pig), individual pigs were tracked on average for 22.3 min in the barren environment and 57.8 min in the enriched environment. Thus, based on proposed tracking-by-detection algorithm, pigs can be tracked automatically in different environments, but manual corrections may be needed to keep track of the individual throughout the video and estimate activity. The individual activity measured with proposed algorithm could be used as an estimate to measure resilience.
Introduction
Successful adaptation to changes is beside the Five Freedoms a critical pillar in modern animal welfare definitions (Mellor, 2016). Animals should be able to cope with challenges in their environment and reach a state that the animals experience as positive. In other words, to enhance pig welfare, pigs should be not only free from any kind of discomfort but also be resilient to perturbations. Resilient pigs are able to cope or rapidly recover from a perturbation (Colditz and Hine, 2016). Perturbations in pig production could be management related (e.g., mixing, transport) or environment related (e.g., disease, climate). Non-resilient pigs have more difficulty recovering or cannot recover at all from perturbations and therefore experience impaired welfare. The lack of ability to cope with perturbations causes a risk for these non-resilient animals to develop intrinsic problems like tail biting or weight loss (Rauw et al., 2017; Bracke et al., 2018).
To prevent welfare problems in pigs, a management system that provides information on resilience will most likely be needed in the future. With such a management system, the farmer will know when resilience is impaired and which animals it concerns. These animals labeled by a management system as non-resilient could be assisted when required. However, such a system is difficult to develop since resilience is difficult to measure. Resilience consists of many parameters that could be monitored. Currently, mainly physiological parameters are used to measure resilience in pigs. Blood parameters such as white blood cell count or hemoglobin levels, but also production parameters such as body weight are used to measure resilience (Hermesch and Luxford, 2018; Berghof et al., 2019). However, measuring these physiological parameters requires invasive handling of the animal. In addition, these parameters represent a delayed value due to the nature of the measurements, and therefore they are less suitable for immediate decision support.
Recent studies investigated activity and group dynamics as traits to measure resilience. Several studies show a reduction in activity as a response to sickness (van Dixhoorn et al., 2016; Trevisan et al., 2017; Nordgreen et al., 2018; van der Zande et al., 2020). Pigs are lethargic during sickness; they spend more time lying down and less time standing and feeding. Not only sickness affects activity, but also climate has an influence on the activity of pigs, with pigs showing lower activity levels when temperature increases. Costa et al. (2014) showed that relative humidity affected pig activity as well and that pigs had a preference to lay close to the corridor when relative humidity was high. To conclude, activity could be a suitable indicator of resilience to perturbations of different nature.
It is extremely time-consuming to measure activity and location of individuals in multiple pens continuously by human observations. The use of sensors could facilitate automatic activity monitoring and minimize the need for human observers. The activity of an individual could be measured by using accelerometers, which could be placed in the ear of the pig, just like an ear tag. Accelerometers measure accelerations along three axes. With the use of machine learning, accelerations can be transformed into individual activity levels (van der Zande et al., 2020). The main advantage of using accelerometers is that the devices usually have a static ID incorporated in their hardware. In other words, identities of animals are known all the time unless they lose the accelerometer. On the other hand, accelerometer placement could affect readings and therefore introduce extra noise in raw acceleration data. With placement in the pig's ear, ear movements can cause confounding of true levels of physical activity. Noise in acceleration data could lead to false positive activity. In addition, the location of the animal is not known when using accelerometers, which further limits more precise resilience measurements since proximity and location preference could be included when the location is known.
As an alternative to sensors placed on animals, computer vision allows for non-invasive analysis of images or videos containing relevant individual activity and location data. Several studies investigated computer vision algorithms to recognize a pig and track it in a video to estimate activity (Larsen et al., 2021). The main advantage of using computer vision to measure activity is that activity is calculated from the pig's location in each frame, allowing for the calculation of proximity to pen mates and location preferences. Ott et al. (2014) measured activity on a pen level by looking at changes in pixel value between consecutive frames of a video. They compared the automated measured activity with human observations and found a strong correlation of 0.92. This indicated that the use of algorithms for automated activity monitoring could minimize the need for human observations. The limitation of the approach of Ott et al. (2014) is that in their method, the activity is expressed at pen level, where individual information is preferred for a management system. Pigs observed from videos are difficult to distinguish individually, so Kashiha et al. (2013) painted patterns on the back of pigs to recognize individuals. An ellipse was fitted to the body of each pig, and the manually applied recognition pattern was used to identify the pig. On average, 85.4% of the pigs were correctly identified by this algorithm. Inspired by patterns, Yang et al. (2018) painted letters on the back of the pigs and trained a Faster R-CNN to recognize the individual pigs and their corresponding letters. Tested on 100 frames, 95% of the individual pigs was identified correctly. These studies mainly concentrated on detecting the manually applied markings/patterns for pig identification and while the approach showed relatively good performance, the manually applied marking is labor intensive. Markings must be consistent and at least be refreshed every day to be able to see the markings properly.
Huang et al. (2018) used an unspecified pig breed with variation in natural coloration and made use of this natural variation to identify pigs from a video. A Gabor feature extractor extracted the different patterns of each individual and a trained Support Vector Machine located the pigs within the pen. An average recognition of 91.86% was achieved. However, most pigs in pig husbandry do not have natural coloration. Another possibility is to recognize individuals by their unique ear tag (Psota et al., 2020). Pigs and ear tags were detected by a fully-convolutional detector and a forward-backward algorithm assigned ID-numbers, corresponding to the detected ear tags, to the detected pigs. This method resulted in an average precision >95%. Methods using manual markings are successful but could still be invasive to the animal and labor intensive.
The studies that do not rely on manual marking of animals, have difficulties in consistent identification of individuals during the tracking. Ahrendt et al. (2011) detected pigs using support maps and tracked them with a 5D-Gaussian model. This algorithm was able to track three pigs for a maximum of 8 min. However, this method was also computationally demanding. Cowton et al. (2019) used a Faster R-CNN to detect pigs at a 90% precision. To connect the detections between frames (DEEP) Simple Online Realtime Tracking (SORT) was used. The average duration before losing the identity of the pig was 49.5 s and the maximum duration was 4 min. Another method used 3D RGB videos rather than 2D RGB videos to track pigs (Matthews et al., 2017). Pigs were detected with the use of depth data combined with RGB channels, and a Hungarian filter connected the detected pigs between frames. The average duration of a pig being tracked was 21.9 s. Zhang et al. (2018) developed a CNN-based detector and a correlation filter-based tracker. This algorithm was able to identify an average of 66.2 unique trajectories in a sequence of 1,500 frames containing nine pigs. Despite the variety of methods, none could track a pig while maintaining the identity for longer than 1 min on average. In practice, this would result in a human observer correcting IDs more than 360 times for an hour-long video with six pigs being monitored. A computer vision algorithm used to measure activity should be able to maintain identity for a longer period of time to lower human input.
All the previous studies based on different convolutional neural network (CNN) architectures showed a robust performance when it comes to single pig detection. However, continuous detection across several frames and under varying conditions remains challenging. You Only Look Once v3 (YOLOv3) is a CNN with outstanding performance (Benjdira et al., 2019). SORT could be used for tracking across several frames. SORT is an online tracker which only process frames from the past (and not from the future). The main advantage of an online tracking algorithm is improved speed, but this algorithm is fully dependent of the quality of the detections. The fast and accurate detections of YOLOv3 and the connection of the detections across frames by SORT might allow for longer tracking of individual pigs. Therefore, the aim of this study was to investigate the potential of state-of-the-art CV algorithms using YOLOv3 and SORT for pig detection and tracking for individual activity monitoring in pigs.
Materials and Methods
Ethical Statement
The protocol of the experiment was approved by the Dutch Central Authority for Scientific Procedures on Animals (AVD1040020186245) and was conducted in accordance with the Dutch law on animal experimentation, which complies with the European Directive 2010/63/EU on the protection of animals used for scientific purposes.
Animals and Housing
A total of 144 crossbred pigs was used in this study. The pigs originated from the same farm but were born and raised in two different environments: a barren and an enriched environment. Piglets from the barren environment were born in farrowing crates, and the sow was constrained until weaning at 4 weeks of age. Upon weaning, eight pigs per litter were selected based on body weight and penned per litter in pens with partly slatted floors until 9 weeks of age. A chain and a jute bag were provided as enrichment. Feed and water were provided ad-libitum. The second environment was an enriched environment, where piglets were born from sows in farrowing crates. After 3 days post-farrowing, the crate was removed, and the sow was able to leave the farrowing pen into a communal area consisting of a lying area, feeding area, and a dunging area together with four other sows. Seven days post-farrowing, the piglets were also allowed to leave the farrowing pen into the communal area and were able to interact with the four other sows and their litters. The piglets were weaned at 9 weeks of age in this system.
All pigs entered the research facility in Wageningen at 9 weeks of age. The pigs originating from the barren environment remained in a barren environment. Each barren pen (0.93 m2/pig) had a partly slatted floor and a chain and a ball were provided as enrichment. The pigs originating from the enriched environment were housed in enriched pens (1.86 m2/pig) which had sawdust and straw as bedding material. A jute bag and a rope were alternated every week. Once a week, fresh peat was provided, as were cardboard egg boxes, hay or alfalfa according to an alternating schedule. Additionally, six toys were alternated every 2 days. Each pen, independent of environment, consisted of six pigs, balanced by gender, and feed and water were available ad-libitum. Lights were on between 7:00 and 19:00 h and a night light was turned on between 19:00 and 7:00 h. The experiment was terminated at 21 weeks of age.
Data
An RGB camera was mounted above each pen and recorded 24 h per day during the experiment. The videos were 352 by 288 pixels and recorded in 25 fps. Due to the smaller width of the barren pens, neighboring pens were visible on the videos of the barren pens. To avoid that the pigs from neighboring pens were detected and allow an equal comparison between the barren and enriched environment, the neighboring pens were blocked prior to the analysis (Figure 1A). Frames were annotated using LabelImg (Tzutalin, 2015). The contours of the pig were labeled by a bounding box, where each side of the bounding box touches the pig (Figure 1). One annotation class (pig) was used, and only pigs in the pen of interest were annotated.
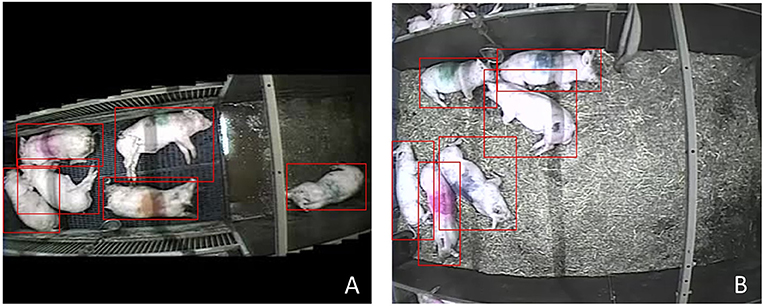
Figure 1. Example frames with annotated bounding boxes (red boxes) in the barren (A) environment with blocked neighboring pens and the enriched (B) environment.
Three different detection models were evaluated to assure the best detection results possible under varying circumstances: using frames where young pigs were annotated (young model), using frames where old pigs were annotated (old model), and a combination. The young model contained annotations of randomly selected frames from pigs around 10 weeks of age. The training dataset consisted of 2,000 annotated frames, where 90% of the frames was used for training, and 10% was used for validation. The old model was trained on 2,000 annotated randomly selected frames of pigs from 17 to 21 weeks of age, where 90% was used for training, and 10% was used for validation. The combined model consisted of young and old animals' annotations, with 4,000 annotated frames split into 90% training data and 10% validation data.
To review a possible difference in the performance of tracking between environments, one video of ~7 h (n frames = 622,570) of each environment without any human activity except for the activity of the caretaker was used for tracking. The pigs were 16 weeks of age in this video, which is an age that was not used for training of the detection models. Every 1780th frame was annotated to obtain 350 equally distributed frames per environment and to evaluate the three different detection models (young, old and combined). All the frames were then used to test the success of the multiple-object tracking.
Detection Method
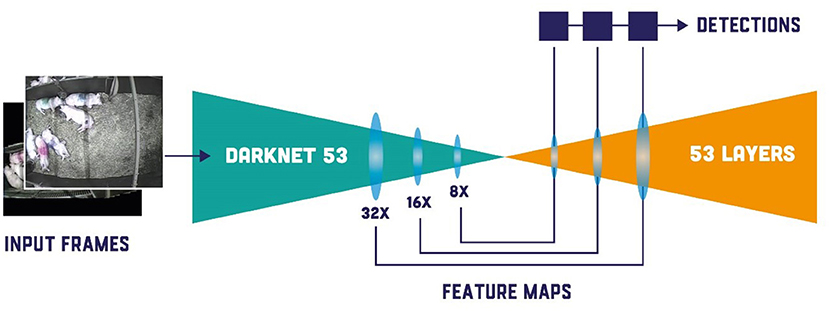
To assure high computational speed and robust multiple object detection, the You Only Look Once version 3 (YOLOv3) algorithm was used to detect pigs in their home pens (Redmon and Farhadi, 2018). YOLOv3 is an accurate object detection network that features multi-scale detection, a more robust feature extraction backbone compared to other convolutional neural networks (CNN)-based detectors and an improved loss function calculation. The YOLOv3 framework consists of two main multi-scale modules: the Feature Extractor and the Object Detector (Figure 2). The input for YOLOv3 are frames/images of interest. First, an input frame/image passes through the Darknet-53, which is a deep convolutional neural network consisting of 53 layers and used for initial feature extraction. The output of the feature extraction step consists of three different feature maps, where the original input image is down sampled by 32, 16, and 8 times from its original size, respectively. These feature maps are then passed through another 53 fully convolutional layers of the Object Detector module of the YOLOv3 network to produce actual detection kernels. The final YOLOv3 architecture is a 106 layer deep neural network, which produces detections at three different scales (using previously produced feature maps of different sizes) to allow accurate detection of objects with varying size. The tree detection kernels produced at layers 82, 94, and 106 are then combined in a vector with the coordinates of all three detections and corresponding probabilities of the final combined bounding box being a pig.
YOLOv3 is not perfect and will detect bounding boxes without a pig in them (i.e., false positives). False positives (FP) will create extra IDs that are difficult to filter after tracking; thus FP were removed after detection. Frames with FP were identified when more than six pigs were detected, since there were six pigs housed per pen. When this occurred, the six bounding boxes with the highest probability of being a pig were kept, and the extra bounding boxes were removed. This resulted in a deletion of 6,563 detections in the barren environment (out of 3,741,073 detections) and 3,080 detections in the enriched environment (out of 3,733,521 detections). After the first removal of detections, all bounding boxes with a probability of detecting a pig lower than 0.5 were removed to ensure that all random detections were deleted. This resulted in a deletion of another 4,992 detections in the barren environment and 2,680 detections in the enriched environment.
Tracking Method
Simple Online and Real-Time (SORT) was used to track pigs in their home pen (Bewley et al., 2016). The detections produced by YOLOv3 network were used as the input for the SORT tracking algorithm. The performance of SORT is highly dependent on the quality of the initial detection model since SORT has no such functionality itself. The SORT algorithm utilizes the combination of common techniques such as the Hungarian algorithm and Kalman filter for object tracking. The Kalman filter is used to predict future positions of the detected bounding boxes. These predictions serve as a basis for continuous object tracking. This filter uses a two-step approach. In the first prediction step, the Kalman filter estimates the future bounding box along with the possible uncertainties. As soon as the bounding box is known, the estimates are updated in the second step and uncertainties are reduced to enhance the future predictions. The Hungarian algorithm predicts whether an object detected in the current frame is the same as the one detected in the previous adjacent frame. This is used for object re-identification and maintenance of the assigned IDs. The robust re-identification is crucial for continuous and efficient multiple object tracking. The Hungarian algorithm uses different measures to evaluate the consistency of the object detection/identification (e.g., Intersection over Union and/or shape score). The Intersection over Union (IoU) score indicates the overlap between bounding boxes produced by the object detector in one frame and another frame. If the bounding box of the current frame overlaps the bounding box of the previous frame, it will probably be the same object. The shape score is based on the change in shape or size. If there is little change in shape or size, the score increases, guaranteeing re-identification. The Hungarian algorithm and the Kalman filter operate together in SORT implementation. For example, if object A was detected in frame t, and object B is detected in frame t+1, and objects A and B are defined as the same object based on the scores from the Hungarian algorithm, then objects A and B are confirmed being the same object. The Kalman filter could use the location of object B in frame t+1 as a new measurement for object A in frame t to minimize uncertainty and improve the overall score.
Evaluation
Detection results were evaluated by using mean average precision (mAP), intersection over union (IOU), number of false positives (FP) and number of false negatives (FN). mAP is the mean area under the precision-recall curve for all object classes. IOU represents the overlap between two bounding boxes. FP are detections of a pig which is not a pig, where FN are missing detections of a pig.
The tracking algorithm generates more tracks (i.e., part of the video with an assigned ID) than individuals, so each track was manually traced back to the individual that was tracked. Not all tracks could be traced back to a pig, and these tracks are referred to as FP tracks (Figure 3A). Occasionally, individuals take over the track of another pig. This is referred to as ID switches (Figures 3B,C).
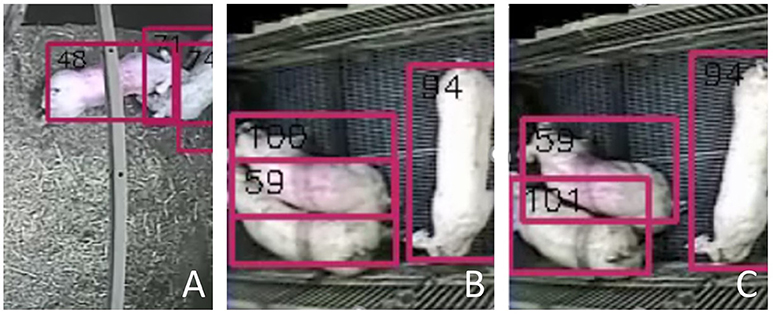
Figure 3. Examples of FP tracks and ID switches: (A) An example of a false positive (FP) track, where two pigs are visible, but three bounding boxes are identified. The bounding box most right (nr. 74) is labeled as a FP track since it could not be assigned to a pig; (B) The moment just before the ID switch of pig nr. 59; (C) Just after the ID switch, where bounding box nr. 59 has moved up to another pig compared to (B). The original pig nr. 59 received a new ID.
Results
Detection
Figure 4 shows the mean average precision (mAP) and intersection over union (IOU) for all three detection models. In both environments, the mAP was over 99%. The combined detection model reached a mAP of 99.95% in the enriched environment. In both environments, IOU was the lowest with the young detection model. Adding older animals (i.e., combined detection model) improved the IOU in the enriched environment. The old detection model had the highest IOU in the barren environment.
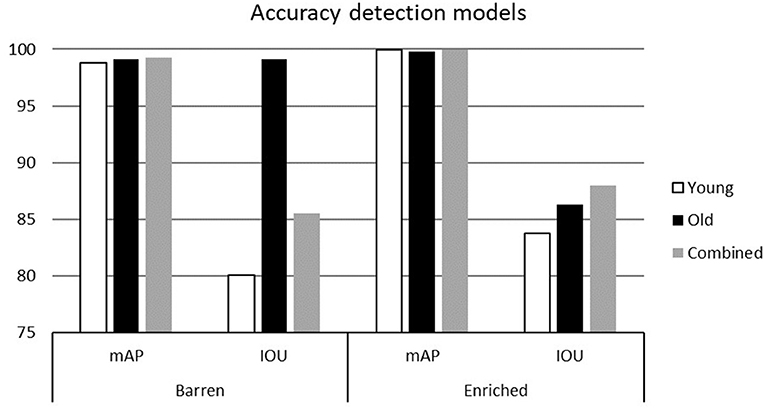
Figure 4. Mean Average Precision (mAP) and Intersection Over Union (IOU) for the barren and enriched environment using the “young,” “old,” and “combined” detection model.
Figure 5 shows the number of FP and FN for all detector models in both environments. The detector trained on young animals found 128 FP in the barren environment where it only found two FP in the enriched environment. FP in the barren environment dropped drastically when older animals were used in or added to the detection model. FN (undetected pigs) decreased in both environments when older animals were used compared to only using younger animals. For both environments, FN dropped even further when young and old animals were combined in the detection model. The combined detection model was used in tracking since it performed best in both environments.
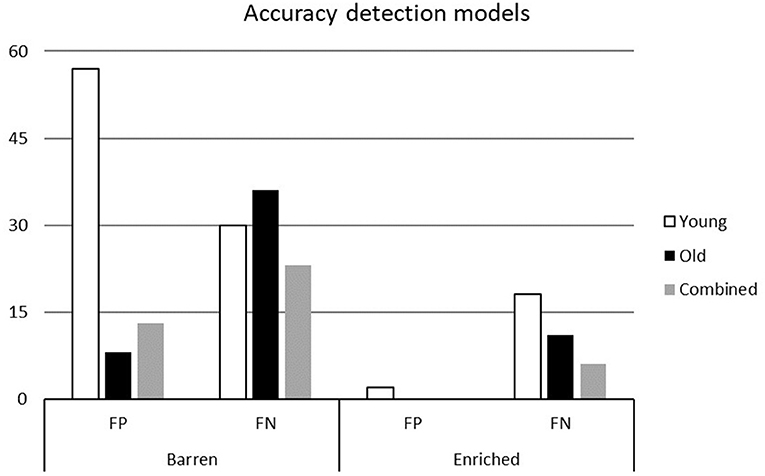
Figure 5. The number of false positives (FP; i.e., tracks not associated with a pig) and false negatives (FN; i.e., undetected pig) for the barren and enriched environment using the “young,” “old,” and “combined” detection model.
Tracking
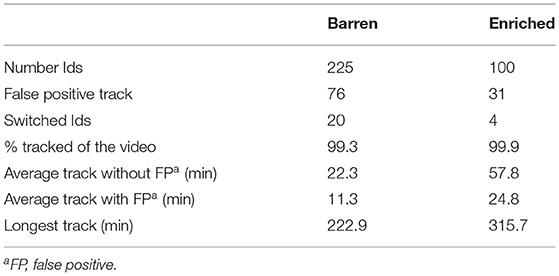
In the barren environment, more tracks were identified compared to the enriched environment (Table 1). In both environments, approximately one third of the tracks were a FP track. In other words, one-third of the IDs found could not be assigned to a pig. More IDs were switched in the barren environment compared to the enriched environment. FP tracks had a short duration in both environments. On average, the length of FP tracks was 9.9 s in the barren environment and 2.2 s in the enriched environment. When these short FP tracks were excluded, on average individual pigs were tracked for 22.3 min in the barren environment and 57.8 min in the enriched environment.
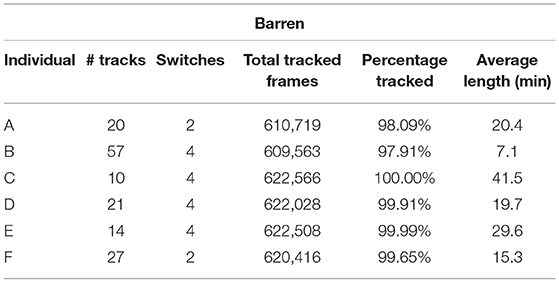
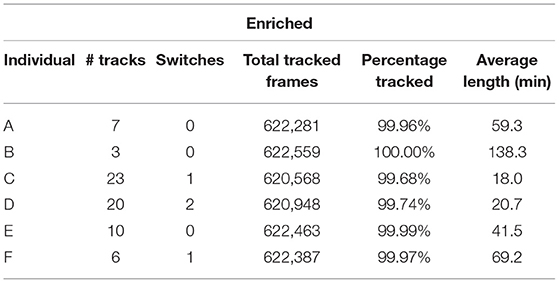
There was variation between individuals in the performance of the tracking algorithm (Tables 2, 3). In the barren environment the highest number of tracks traced back to one individual was 57, whereas in the enriched environment this was only 23 tracks. The lowest individual average track length was therefore 18 min, where the highest was 138.3 min in the enriched environment. The average individual track length in the barren environment varied between 7.1 and 41.5 min.
Figures 6, 7 display all tracks per individual including FP tracks. In both environments there was a period between ~11:24 and 13:48 where all IDs were maintained. In this period, the pigs were mostly lying down. Especially before and after this period of resting most new IDs were assigned to individuals. In these periods the pigs were actively moving around and interacting with pen mates.
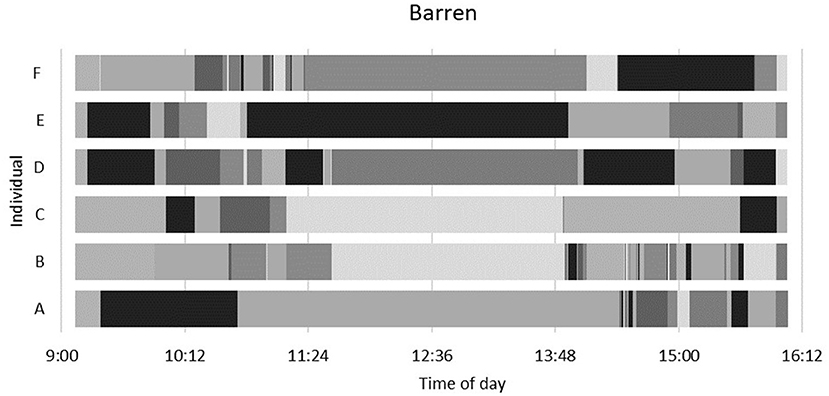
Figure 6. Tracks per individual in the barren environment including false positive tracks corresponding to the time of day.
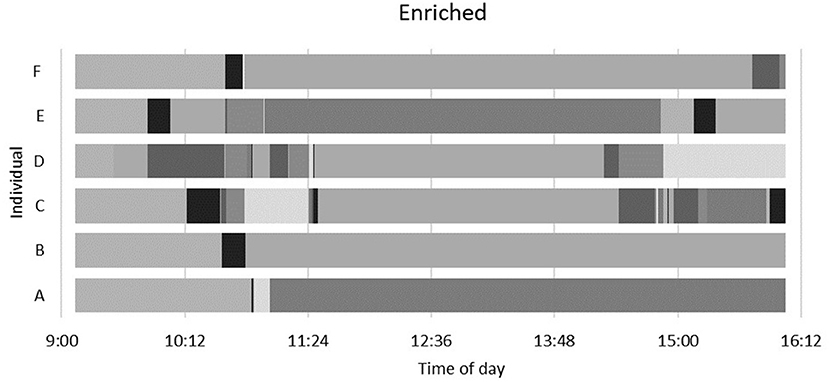
Figure 7. Tracks per individual in the enriched environment including false positive tracks corresponding to the time of day.
Discussion
The aim of this study was to investigate the potential of state-of-the-art CV algorithms using YOLOv3 and SORT for pig detection and tracking for individual activity monitoring in pigs. This study showed the potential of state-of-the-art CV algorithms for individual object detection and tracking. Results showed that individual pigs could be tracked up to 5.3 h in an enriched environment with maintained identity. On average, identity was maintained up to 24.8 min without manual corrections. In tracking-by-detection methods, as used in this study, tracking results are dependent on the performance of the detection method. No literature was found showing an algorithm maintaining identity for longer than 1 minute on average without manually applied marking. The highest average tracking time reported until now was 49.5 s (Cowton et al., 2019). This study outperformed existing literature in maintaining identity in tracking pigs with an average tracking duration of 57.8 min. However, this study used a long video sequence of 7 h, while pigs are known to be active during certain periods of time. This might result in a distorted comparison between studies. However, when the average length of tracks is calculated based on trajectories during active time, the average length of the enriched housed pigs is still between 6.4 and 17.2 min. The average track length of barren housed pigs was lower (3.3–24.6 min), but still higher than found in the literature. The main difference between this study and others is the use of YOLOv3 as a detector.
The proposed tracking algorithm was trained and tested on annotated frames from different ages. Yang et al. (2018) tested their algorithm on different batches within the same pig farm and results were “quite good.” They state: “the size of pigs does not matter much.” This study, however, proves otherwise. There is a difference in performance between different ages within the same environment (i.e., different size of pigs). Psota et al. (2020) also had a training set that consisted of different pen compositions, angles and ages. They reported that a dataset containing frames from finisher pigs performed better than a dataset containing frames from nursery pigs. This is in line with results presented in the current study, where IOU of the old detection model was higher than the IOU of the young detection model. Another phenomenon was shown in current results: in the enriched environment, the IOU of the combined detection model exceeded the IOU of the young and the old detection model, while in the barren environment the old detection model performed best. This interaction between environment and age could be explained by unoccupied surface in the pen. Enriched housed pigs had twice as much space available than barren housed pigs. In addition, pigs grow rapidly and especially in the barren environment, pigs are more occluded when growing older. Visually, the frames of the old detection model are more similar to the test frames than the frames of the young detection model (Figure 8). Thus, the old detection model fits the test frames the best in the barren environment, and therefore has the best performance. When annotations of younger animals are added, some noise is added in the detections, creating a more robust detection model (higher mAP) with a lower IOU.
Besides the difference in age, there was also a difference in the environment in the current study. The tracking algorithm performed better in the enriched environment rather than in the barren environment. The only difference between the two environments was the use of bedding material and enrichments and the space allowance per pig. The bedding material was not observed to be detected as a pig, so the space allowance is responsible for the difference in performance. The most difficult situations to detect pigs individually is when pigs are touching each other. When in close proximity, IDs can be lost or switched, which could happen more often when there is less space available per pig.
The appearance of pigs (i.e., spots or color marking) appeared to be irrelevant in the performance of the tracking algorithm. Some pigs were colored for identification in the experiment with a saddle-like marking that was prominently visible to the human observer. The tracking algorithm was not affected by the coloring. A pig with a pink marker had the most tracks in the barren environment (Table 2; individual C) but was among the pigs with the fewest tracks in the enriched environment (Table 3; individual F). Creating more tracks per individual appears to be more strongly related to unfortunate placement of the pig within the pen rather than disturbance by background colors or shadows.
ID switches are a difficult problem in tracking. Not only do you lose the identity, but identities are switched without any visibility in tracking data except when IDs are checked manually. Psota et al. (2020) also reported ID switches. An example showed that despite all animals were detected, only seven out of 13 had the correct ID. We expected that two tracks would exchange their IDs, however, that only happened twice out of 24 switches identified. The other 22 switches showed one individual receiving a new ID number, and the other individual took over the other animal's original ID. These one-sided switches are not well-described in the literature (Li et al., 2009). An advantage of this type of switches is that it is easier to trace back in tracking data since a new ID is created in the process and usually this new ID only has a limited track length. However, it still remains an issue in tracking data. Removing these false positives based on short track length seems a viable way to correct for ID switches.
The algorithm used in this study showed is a first step to measure resilience in future applications. Individual activity or variation in individual activity under stress is a potential indicator of resilience (Cornou and Lundbye-Christensen, 2010; van Dixhoorn et al., 2016; Nordgreen et al., 2018; van der Zande et al., 2020). The algorithm presented estimated bounding boxes and connected them between frames with assigned IDs. When the trajectory is lost, a human observer needs to assign the trajectory to the right ID. Using this algorithm for six pigs, the human observer needs to correct on average the IDs 10 times per hour for enriched housed pigs, and 22 times per hour for barren housed pigs. For a commercial management system, this would still be too labor-intensive, but for research-purposes this is possible. To improve performance further, multiple sensors should be integrated to achieve high accuracy with less labor (Wurtz et al., 2019). To recognize damaging behavior using proposed algorithm is challenging due to the low occurrence of such behavior. Posture estimation could be integrated in proposed algorithm since these behaviors occur regularly. However, for research purposes, this algorithm allows tracking activity of a larger number of individual animals in a non-invasive manner. From location data of every frame, distance moved could be calculated.
Conclusions
The aim of this study was to investigate the potential of state-of-the-art CV algorithms using YOLOv3 and SORT for pig detection and tracking for individual activity monitoring in pigs. Results showed that individual pigs could be tracked up to 5.3 h in an enriched environment with maintained identity. On average, identity was maintained up to 24.8 min without manual corrections. Using annotations of a combination of younger and older animals had the best performance to detect pigs in both the barren and the enriched environment. The tracking algorithm performed better on pigs housed in an enriched environment compared to pigs in a barren environment, probably due to the lower stocking density. The tracking algorithm presented in this study outperformed other studies published to date. The better performance might be due to the different detection method used, variation in environment, time of day or the size of the training data used. Thus, based on tracking-by-detection algorithm using YOLOv3 and SORT, pigs can be tracked in different environments. The tracks could in future applications be used as an estimate to measure resilience of individual pigs, by recording activity, proximity to other individuals and use of space under varying conditions.
Data Availability Statement
The raw data supporting the conclusions of this article will be made available by the authors, without undue reservation.
Ethics Statement
The animal study was reviewed and approved by the Dutch Central Authority for Scientific Procedures on Animals.
Author Contributions
TR, LZ, and OG contributed to the conception of the study. LZ and OG developed the tracking algorithm. LZ performed the analysis and wrote the first draft. All authors reviewed and approved the final manuscript.
Funding
This study was part of research program Green II – Toward A groundbreaking and future-oriented system change in agriculture and horticulture with project number ALWGR.2017.007 and was financed by the Netherlands Organization for Scientific Research.
Conflict of Interest
The authors declare that the research was conducted in the absence of any commercial or financial relationships that could be construed as a potential conflict of interest.
Acknowledgments
The authors thank Séverine Parois for carrying out the experiment and Manon van Marwijk and Monique Ooms for putting up the cameras and collecting the videos.
References
Ahrendt, P., Gregersen, T., and Karstoft, H. (2011). Development of a real-time computer vision system for tracking loose-housed pigs. Comput. Electr. Agric. 76, 169–174. doi: 10.1016/j.compag.2011.01.011
Benjdira, B., Khursheed, T., Koubaa, A., Ammar, A., and Ouni, K. (2019). “Car detection using unmanned aerial vehicles: comparison between faster r-cnn and yolov3,” in 2019 1st International Conference on Unmanned Vehicle Systems-Oman (UVS) (Muscat: IEEE), 1–6.
Berghof, T. V., Poppe, M., and Mulder, H. A. (2019). Opportunities to improve resilience in animal breeding programs. Front. Genet 9:692. doi: 10.3389/fgene.2018.00692
Bewley, A., Ge, Z., Ott, L., Ramos, F., and Upcroft, B. (2016). “Simple online and realtime tracking,” in 2016 IEEE International Conference on Image Processing (ICIP) (Phoenix, AZ: IEEE), 3464–3468.
Bracke, M. B. M., Rodenburg, T. B., Vermeer, H. M., and van Nieker, T. G. C. M. (2018). Towards a Common Conceptual Framework and Illustrative Model for Feather Pecking in Poultry and Tail Biting in Pigs-Connecting Science to Solutions. Available online at: http://www.henhub.eu/wp-content/uploads/2018/02/Henhub-pap-models-mb-090218-for-pdf.pdf (accessed July 15, 2020).
Colditz, I. G., and Hine, B. C. (2016). Resilience in farm animals: biology, management, breeding and implications for animal welfare. Anim. Prod. Sci. 56, 1961–1983. doi: 10.1071/AN15297
Cornou, C., and Lundbye-Christensen, S. (2010). Classification of sows' activity types from acceleration patterns using univariate and multivariate models. Comput. Electr. Agric. 72, 53–60. doi: 10.1016/j.compag.2010.01.006
Costa, A., Ismayilova, G., Borgonovo, F., Viazzi, S., Berckmans, D., and Guarino, M. (2014). Image-processing technique to measure pig activity in response to climatic variation in a pig barn. Anim. Prod. Sci. 54, 1075–1083. doi: 10.1071/AN13031
Cowton, J., Kyriazakis, I., and Bacardit, J. (2019). Automated individual pig localisation, tracking and behaviour metric extraction using deep learning. IEEE Access 7, 108049–108060. doi: 10.1109/ACCESS.2019.2933060
Hermesch, S., and Luxford, B. (2018). “Genetic parameters for white blood cells, haemoglobin and growth in weaner pigs for genetic improvement of disease resilience,” in Proceedings of the 11th World Congress on Genetics Applied to Livestock Production (Auckland), 11–16.
Huang, W., Zhu, W., Ma, C., Guo, Y., and Chen, C. (2018). Identification of group-housed pigs based on Gabor and Local Binary Pattern features. Biosyst. Eng. 166, 90–100. doi: 10.1016/j.biosystemseng.2017.11.007
Kashiha, M., Bahr, C., Ott, S., Moons, C. P., Niewold, T. A., Ödberg, F. O., et al. (2013). Automatic identification of marked pigs in a pen using image pattern recognition. Comput. Electr. Agric. 93, 111–120. doi: 10.1016/j.compag.2013.01.013
Larsen, M. L., Wang, M., and Norton, T. (2021). Information technologies for welfare monitoring in pigs and their relation to welfare quality®. Sustainability 13:692. doi: 10.3390/su13020692
Li, Y., Huang, C., and Nevatia, R. (2009). “Learning to associate: hybridboosted multi-target tracker for crowded scene,” in 2009 IEEE Conference on Computer Vision and Pattern Recognition (Miami, FL: IEEE), 2953–2960.
Matthews, S. G., Miller, A. L., Plötz, T., and Kyriazakis, I. (2017). Automated tracking to measure behavioural changes in pigs for health and welfare monitoring. Sci. Rep 7, 1–12. doi: 10.1038/s41598-017-17451-6
Mellor, D. J. (2016). Updating animal welfare thinking: moving beyond the “Five Freedoms” towards “a Life Worth Living. Animals 6:21. doi: 10.3390/ani6030021
Nordgreen, J., Munsterhjelm, C., Aae, F., Popova, A., Boysen, P., Ranheim, B., et al. (2018). The effect of lipopolysaccharide (LPS) on inflammatory markers in blood and brain and on behavior in individually-housed pigs. Physiol. Behav. 195, 98–111. doi: 10.1016/j.physbeh.2018.07.013
Ott, S., Moons, C., Kashiha, M. A., Bahr, C., Tuyttens, F., Berckmans, D., et al. (2014). Automated video analysis of pig activity at pen level highly correlates to human observations of behavioural activities. Livest. Sci. 160, 132–137. doi: 10.1016/j.livsci.2013.12.011
Psota, E. T., Schmidt, T., Mote, B., and Pérez, L. C. (2020). Long-term tracking of group-housed livestock using keypoint detection and map estimation for individual animal identification. Sensors 20:3670. doi: 10.3390/s20133670
Rauw, W. M., Mayorga, E. J., Lei, S. M., Dekkers, J., Patience, J. F., Gabler, N. K., et al. (2017). Effects of diet and genetics on growth performance of pigs in response to repeated exposure to heat stress. Front. Genet. 8:155. doi: 10.3389/fgene.2017.00155
Redmon, J., and Farhadi, A. (2018). Yolov3: an incremental improvement. arXiv preprint arXiv:1804.02767.
Trevisan, C., Johansen, M. V., Mkupasi, E. M., Ngowi, H. A., and Forkman, B. (2017). Disease behaviours of sows naturally infected with Taenia solium in Tanzania. Vet. Parasitol. 235, 69–74. doi: 10.1016/j.vetpar.2017.01.008
van der Zande, L. E., Dunkelberger, J. R., Rodenburg, T. B., Bolhuis, J. E., Mathur, P. K., Cairns, W. J., et al. (2020). Quantifying individual response to PRRSV using dynamic indicators of resilience based on activity. Front. Vet. Sci. 7:325. doi: 10.3389/fvets.2020.00325
van Dixhoorn, I. D., Reimert, I., Middelkoop, J., Bolhuis, J. E., Wisselink, H. J., Groot Koerkamp, P. W., et al. (2016). Enriched housing reduces disease susceptibility to co-infection with porcine reproductive and respiratory virus (PRRSV) and Actinobacillus pleuropneumoniae (A. pleuropneumoniae) in young pigs. PloS One 11:e0161832. doi: 10.1371/journal.pone.0161832
Wurtz, K., Camerlink, I., D'Eath, R. B., Fernández, A. P., Norton, T., Steibel, J., et al. (2019). Recording behaviour of indoor-housed farm animals automatically using machine vision technology: a systematic review. PLoS ONE 14:e0226669. doi: 10.1371/journal.pone.0226669
Yang, Q., Xiao, D., and Lin, S. (2018). Feeding behavior recognition for group-housed pigs with the Faster R-CNN. Comput. Electr. Agric. 155, 453–460. doi: 10.1016/j.compag.2018.11.002
Keywords: tracking, computer vision, pigs, video, activity, resilience, behavior
Citation: van der Zande LE, Guzhva O and Rodenburg TB (2021) Individual Detection and Tracking of Group Housed Pigs in Their Home Pen Using Computer Vision. Front. Anim. Sci. 2:669312. doi: 10.3389/fanim.2021.669312
Received: 18 February 2021; Accepted: 15 March 2021;
Published: 12 April 2021.
Edited by:
Dan Børge Jensen, University of Copenhagen, DenmarkReviewed by:
Mona Lilian Vestbjerg Larsen, KU Leuven, BelgiumYang Zhao, The University of Tennessee, Knoxville, United States
Copyright © 2021 van der Zande, Guzhva and Rodenburg. This is an open-access article distributed under the terms of the Creative Commons Attribution License (CC BY). The use, distribution or reproduction in other forums is permitted, provided the original author(s) and the copyright owner(s) are credited and that the original publication in this journal is cited, in accordance with accepted academic practice. No use, distribution or reproduction is permitted which does not comply with these terms.
*Correspondence: Lisette. E. van der Zande, bGlzZXR0ZS52YW5kZXJ6YW5kZSYjeDAwMDQwO3d1ci5ubA==
 Lisette. E. van der Zande
 Oleksiy Guzhva
 T. Bas Rodenburg