 Gaël de Rocquigny1*
 Clément Dubost1,2
 Pierre Humbert2
 Laurent Oudre3
 Christophe Labourdette2
 Nicolas Vayatis2Jean-Pierre Tourtier1
 Pierre-Paul Vidal4,2
- 1Department of Anesthesia and Critical Care Medicine, Begin Military Hospital, Saint-Mandé, France
- 2Université Paris-Saclay, ENS Paris-Saclay, CNRS, Centre Borelli, Cachan, France
- 3L2TI, Université Paris 13, Villetaneuse, France
- 4Institute of Information and Control, Hangzhou Dianzi University, Zhejiang, China
Background: Precise monitoring of the Depth of Anesthesia (DoA) is essential to prevent intra-operative awareness (in case of underdosage) or increased post-operative morbi-mortality (in case of overdosage). The recording of a high- frequency multimodal monitoring during general anesthesia (GA) and the capability of classification of dynamic networks should have the potential to help predicting the DoA in a clinical practice. In this study, we aimed at predicting the DoA according four levels (Awake, Loss of Consciousness (LOC), Anesthesia, Return of Consciousness (ROC), Emergence) thanks to a Hidden Markov Model (HMM) relying on four common physiologic variables: Mean Blood Pressure (MBP), Heart Rate (HR), Respiratory Rate (RR), and end-expiratory concentration of sevoflurane (AAEt).
Methods: After induction by sufentanil and propofol, the anesthesia was maintained by sevoflurane. We recorded the physiological variables at a high frequency during all the procedure [cardiopulmonary variables, AAEt, 2- channel ElectroEncephaloGraphy (EEG) data, and BIS values]. In the training phase, the different states (Awake, LOC, Anesthesia, ROC, Emergence) were identified according to the reading of the spectrograms of the two EEG channels. However, the prediction with the HMM were only based on the four physiological variables.
Results: On a dataset consisting of 60 patients under general anaesthesia, results suggested that the HMM had a true positive rate (TPR) for identifying Awake, Anesthesia and Emergence of 88%, 72% and 58%, respectively.
Conclusion: To our knowledge, this is the first application of such a model to identify the DoA without relying on EEG data. We suggest that a HMM can help the anesthetist monitoring the DoA out of a set of current physiologic variables without necessity of brain monitoring. The model could be improved by increasing the number of patients in the database and accuracy would probably benefit from adding in the model the data of a single EEG channel.
1 Introduction
Adequate Depth of Anesthesia (DoA) has been defined by experts as “the probability of non-response to stimulation, calibrated against the strength of the stimulus, the difficulty of suppressing the response, and the drug-induced probability of non-responsiveness at defined effect site concentrations” (1). Precise knowledge of the DoA is essential to allow accurate titration of the drugs administered. The objective of the tailored anesthesia is twofold: (i) to avoid excessively deep narcosis, associated with a higher risk of post-operative cognitive dysfunction and delayed awakening, (ii) to prevent underdosing, which is associated with a risk of awareness (2). The determination of the optimal doses of anesthetics necessary for the induction and maintenance of General Anesthesia (GA) is based firstly on pharmacological knowledge of the drugs used and secondly on non-specific clinical signs related to the (generally deleterious) effects of these products. This reasoning takes little or no account of the great inter-and intra-individual variability of patients.
Carrying out the monitoring of DoA in the best possible way implies a tool meeting three fundamental criteria (3): (i) the observed changes must be correlated with the concentration of anesthetic agents, and this, in an identical manner whatever the agent or combinations used, (ii) the result of the prediction should be sensitive to changes in the intensity of the anesthetic or surgical stimulus, and (iii) it must be able to detect the loss and return of consciousness to prevent the risk of overdosage or memorization.
Compulsory monitoring during the anesthesia includes heart rate (HR), blood pressure (BP), respiratory, and muscle function, but it does not include the brain, despite being the main target of the anesthetics (4). To date, only a few teams aimed at evaluating the DoA using multiple parameters analysis. In 2014, Schneider et al. developed the Anesthesia Multimodal Index of Consciousness (AMIC) (5). Their model included demographic data from the patients, the nature and quantity of the drugs injected, and standard physiological signals such as HR, mean BP, and ElectroEncephaloGraphy (EEG) features (Approximate entropy or Weighted spectral median frequency). While it demonstrated a significantly better predictive value of the DoA compared to BIS values, in this study, the sampling rates for analysis of the physiological signals only ranged between 10 s and 5 min. Their multimodal approach produced promising results but we believe that increasing the sampling rate is critical in order to develop a real time approach.
Another approach of the prediction of the DoA consists in interpreting multiple EEG features. Classification methods developed recently have been proved to be efficient to treat EEG data (6, 7). For instance, several studies have shown that artificial neural networks fed with several standard EEG parameters recorded during anesthesia could effectively assess the DoA (8, 9). In both studies, the authors used the BIS as the comparator and required the recording of several EEG channels. Finally, putting together the recording of a high-frequency multimodal monitoring during GA and the capability of classification of the recent techniques should have the potential to improve the prediction of the DoA in a clinical perspective.
In that context, our aim was to improve the assessment of DoA in clinical routine. First, we continuously recorded at high frequency the physiologic parameters routinely monitored during anesthesia. While not used in the final prediction, we included a 2-channel EEG in order to build a database of properly labeled states. Then using a HMM learned on this database, we aimed at predicting the state of anesthesia (classification task) relying only on four common physiologic variables.
2 Methods
2.1 Subjects and anesthesia protocol
The study has been conducted in the Begin military teaching hospital, Saint-Mandé, France. The criteria of inclusions were: age >18 years, low-risk surgery under GA, acceptance of the patient with low comorbidity score (only 3 patients were classified ASA 3). All methods were carried out in accordance with relevant guidelines and regulations. The protocol has been approved by Pr. JE Bazin, head of the ethics committee of the French society of anesthesiology (SFAR) under the number IRB00010254-2016-018. Informed written consent was obtained from all subjects involved in the study. This manuscript adheres to the applicable CONSORT guidelines.
All the patients were pre-oxygenated by 100% oxygen for at least 3 min before induction via face-mask ventilation. Sufentanil 0.3 mg/kg was injected rapidly followed 3 min later by 2–4 mg/kg propofol in combination with ketamine 20 mg. When required for the surgery, patients were paralyzed following induction with a bolus of 0.17 mg/kg of cisatracurium. After connection to the ventilator, patients were ventilated with tidal volume of 6 mg/kg ideal-body weight, 5 cmH2O Positive endexpiratory Pressure (PEEP) and a respiratory rate between 10 and 14 to maintain EtCO2 between 30 and 40 mmHg. Anesthesia was maintained with sevoflurane MAC age-adjusted (e.g., 1.0). Dose adjustments were made by the anesthetist in charge of the patient depending on clinical variables available.
2.2 Equipment and variables
Patients were continuously monitored with the multi-parameter CARESCAPE™ Monitor B850 from General Electrics Healthcare Finland Oy, Helsinki, Finland. Monitoring included electrocardiogram (ECG), pulsed oxygen saturation, non-invasive blood pressure, bispectral index or BIS (with the BIS™ Quatro Sensor from Medtronic), inhaled and exhaled concentrations of halogens, oxygen and CO2. The continuously recorded EEG has been chosen as the gold standard for evaluating the DoA and testing the reliability of our algorithm. The variables were recorded at a frequency of 1 Hz except for the EEG (see below). For the first two thirds of the patients, we recorded 2 EEG channels at 100 Hz each using the E-EEG module for the CARESCAPE™ monitor B850. In order to correctly detect the anterior displacement of alpha waves identified under GA, we used electrodes F4 and C4 with electrode A1 (contralateral mastoid) as a reference. The data were recorded by a personal software, SmartRéa, allowing synchronized recording of the values of interest (10). For the last third of the cohort, a 32-channel EEG was recorded using the Brain Vision actiCHamp.
2.3 EEG analysis and identification of the depth of anesthesia (training phase)
To preserve the frequencies characteristic of GA, we digitally filtered the EEG signal with a bandpass filter between 1 and 20 Hz. Then, on each channel a Short Time Fourier Transform is used with window size equals to 1,024 samples and 50% overlap to compute their respective spectrograms. For all patients, spectrograms were plotted and visually analyzed regarding the presence or not of δ, α and θ waves as the signature of anesthesia under sevoflurane (11). Five phases of GA were characterized: Awake, Loss of Consciousness (LOC), Anesthesia, Return of Consciousness (ROC) and Emergence (see Figure 1 for an example). Surgical anesthesia under sevoflurane is defined by the presence of a strong θ oscillation at 4–8 Hz. LOC, referring to the transition from Awake to Anesthesia, was identified by the increased α power between 8 and 12 Hz on the spectrogram, before the appearance of the θ waves. ROC was characterized by the progressive disappearance of the θ wave, while the α 8–12 Hz wave persisted. Finally, Emergence was defined by the decrease and disappearance of the α 8–12 Hz wave.
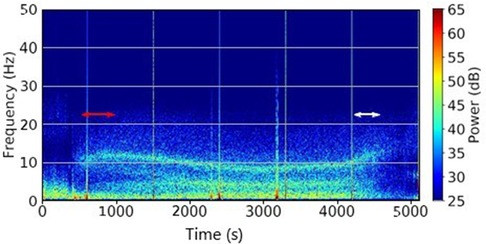
Figure 1. Typical spectrogram with sevoflurane. Units are seconds (s) for the time, Hertz (Hz) for the frequencies. The Loss Of Consciousness (LOC) stage is delimited by the red lines and the Recovery Of Consciousness (ROC) stage by the white ones.
The two transition stages LOC and ROC were also clinically validated according to classic clinical signs (loss of ciliary reflex at LOC, motor response to simple order for ROC). In case of disagreement, the subject was excluded.
2.4 Model and data included
The HMM (12) includes four simple variables, constantly monitored in the operating room and whose evolution under GA was related to the degree of DoA: HR, MBP, RR and AAEt. It permits to predict the most likely states (Awake, LOC, Anesthesia, ROC, and Emergence) through the observations (i.e., the physiological variables).
To fit the data under the HMM framework, we had to transform the continuous variables into nominal features. Therefore, we individually discretized the variables into classes of amplitude 0, 1, 2, 3 in order to group similar physiological signals within the same class and to reduce intra-individual variability while maintaining inter-individual variability. For each patient, class 0 corresponded to the lowest values and class 3 to the highest values. Discretization was performed by the Ckmeans algorithm (13) except for the variable AAEt which was discretized using the 1% and 3% thresholds commonly used in anesthesia (see an example Figure 2). As each patient is unique, thresholds values for each class were personalized. Then, as we also recorded the EEG, we knew the ground-truth and we could directly learn the HMM on this preprocessed dataset using classical empirical distribution functions. Each of the five steps Awake, LOC, Anesthesia, ROC, and Emergence was therefore coded as a state of a HMM, S = 0, 1, 2, 3, 4. The full protocol used in this experiment has been recently published (10).
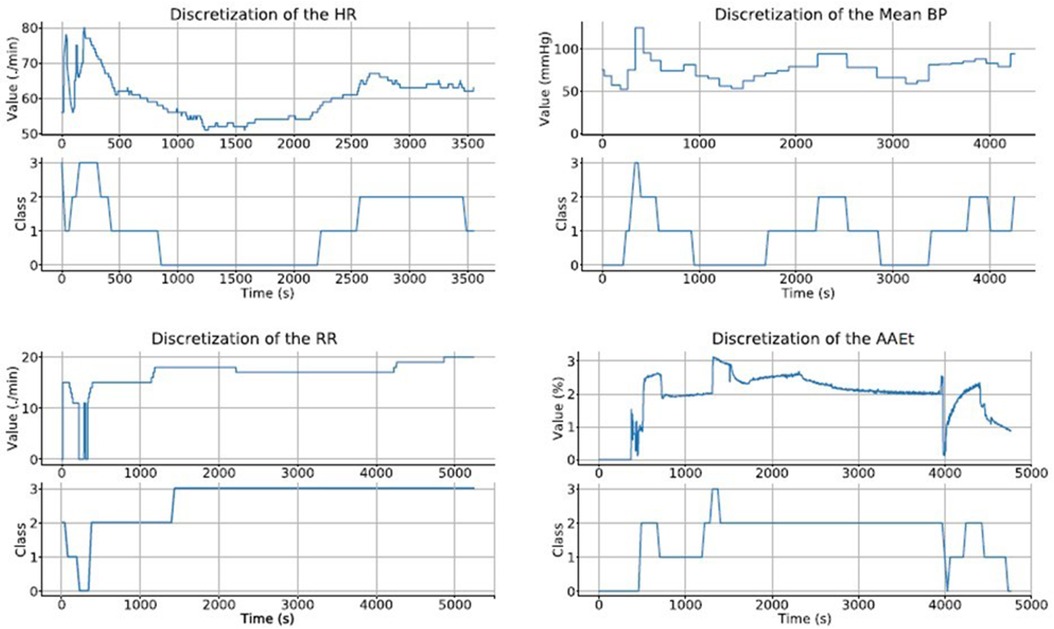
Figure 2. Example of discretization of the 4 variables of a patient as a function of time. For each variable, are represented: Bottom: discrete values in 4 classes from 0 to 3. Top: evolution of actual values over time.
2.5 Dataset and metrics
The algorithm was trained on 40 patients, and then tested on the remaining 20 patients. The patients were randomly assigned to each set. We evaluated the performance of the algorithm using confusion matrices. “True positives” and “true negatives” were the states correctly identified and discriminated by the algorithm out of a set of variables, in contrast with “false positives” and “false negatives”. Four usual standard metrics (14, 15) were then extracted from the confusion matrices:
- True Positive Rate (TPR) or sensitivity, calculated as the ratio of true positives to the sum of true positives and false negatives
- True Negative Rate (TNR) or specificity, calculated as the ratio of true negatives to the sum of true negatives and false positives
- Positive Predictive Value (PPV) or precision: calculated as the ratio of true positives to the sum of true positives and false positives
- Negative Predictive Value (NPV): calculated as the ratio of true negatives to the sum of true negatives and false negatives
We repeated this operation 10 times and thus obtained 10 train/test datasets of 40/20 patients and computed a confusion matrix for each.
3 Results
3.1 Subjects included and demographic data
Between February 2016 and May 2018, 88 subjects have been included end 60 were retained for the final analysis (see Figure 3 for the flow chart).
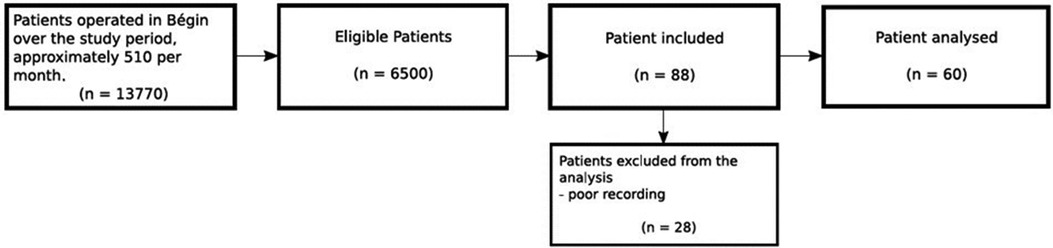
Figure 3. Flow chart.
Demographic data of the population are presented in Table 1. Patients were excluded when more than 20% of the recording was not available, or when the 5 states of anesthesia (Awake, Loss of Consciousness (LOC), Anesthesia, Return of Consciousness (ROC), Emergence) were not clearly identifiable. This mainly occurred due to electrical artefacts on the EEG recordings.
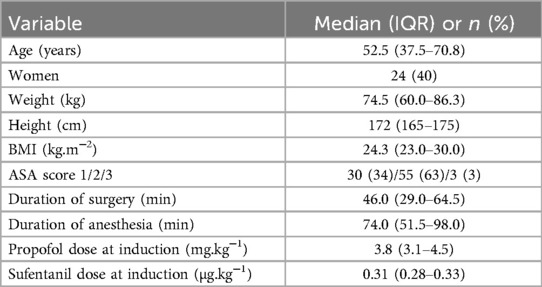
Table 1. Demographic and epidemiologic data.
3.2 Result with four observations
We describe the complete performances of the classification obtained by our model with a normalized confusion matrix and several metrics. Results including four variables are presented in the Figure 4A. The rows present the true states identified by the EEG and the columns present the states predicted by the algorithm. In the Table 2, we present four different metrics assessing the performance of our method when four variables were included. For the prediction of the Anesthesia state, the true positive rate (TPR) is 72% with a high positive predictive value (PPV) of 84%. However, the negative predictive value is rather low with 59%: when the model predicts that the patient is not in the Anesthesia state, it is wrong in 41% of the cases.
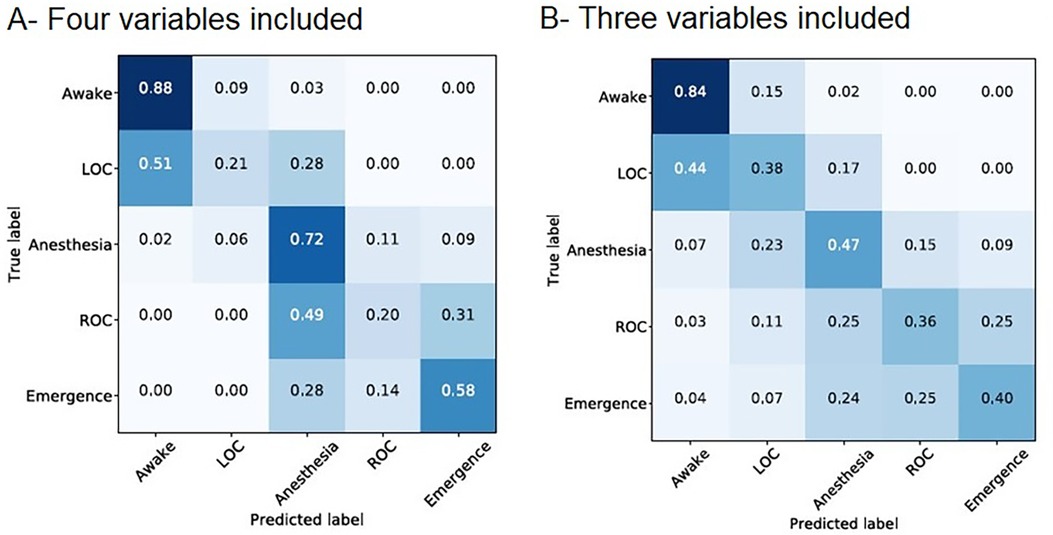
Figure 4. (A) Average of the 10 normalized confusion matrices obtained when 4 variables are included in the HMM. (B) Average of the 10 normalized confusion matrices obtained when 3 variables are included in the HMM. For each panel, on the vertical axis: actual state according to the EEG, on the horizontal axis: predicted state by the model. The intensity of the color is correlated with the number. HMM, hidden Markov model.
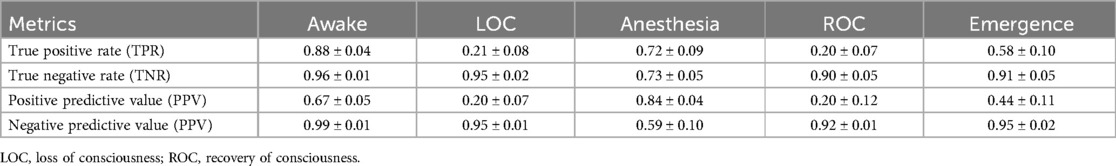
Table 2. Intrinsic characteristics (avg ± std) of the model including 4 variables.
The LOC and ROC states represent 5% and 9% of the true states respectively. They are both poorly predicted with TPR of 21% and 20%. The model tends to predict LOC and ROC with delay. Indeed, LOC and ROC are mostly wrongly identified as the state before (LOC is identified as Awake in 51% of cases and ROC is identified as Anesthesia in 49% of cases).
3.3 Result with only three observations
To ensure that the classification of our model was not excessively based on the variable AAEt, we evaluated the predictions when excluding this variable. Results including only MBP, HR and RR are presented in the Figure 4B. The Table 3 presents the intrinsic characteristics of this model.
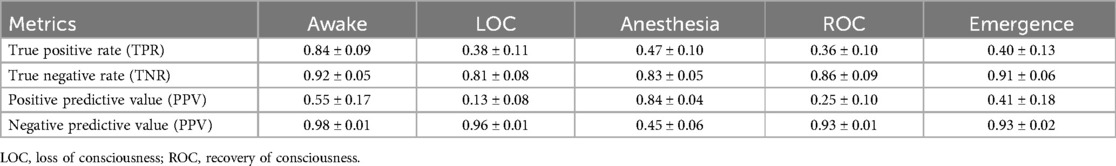
Table 3. intrinsic characteristics (avg ± std) of the model including 3 variables.
The TPR for the prediction of the state Anesthesia is 47%. This poor sensitivity is related to the fact that the model with three observations tends to overpredict LOC and ROC, with 6% and 9% of the true states respectively compared to 20% and 15% of the predicted states respectively. By way of consequence, the model with three observations is associated with an increased TPR for predicting LOC (from 21% to 38%) and ROC (from 20% to 36%) compared to the model with four observations. However, LOC is still wrongly identified as Awake in 44% of cases and discrimination between ROC and Anesthesia or Emergence remains poor. Last but not least, Emergence is predicted as Awake or LOC in 11% of the cases in the model with three observations.
The positive predictive values (i.e., precision) are higher for the prediction of all states (ROC excepted) in the model with four observations. The measurement of the expired fraction of halogenated gas does not contain all the information by itself but appears to improve the model in a significant way.
3.4 Examples of the results
To better visualize the classification of our method with 4 observations, we present in the Figure 5A the example of one (non-normalized) confusion matrix for one split of the dataset. We did the same with including only 3 variables, and on the same split of the dataset, see Figure 5B.
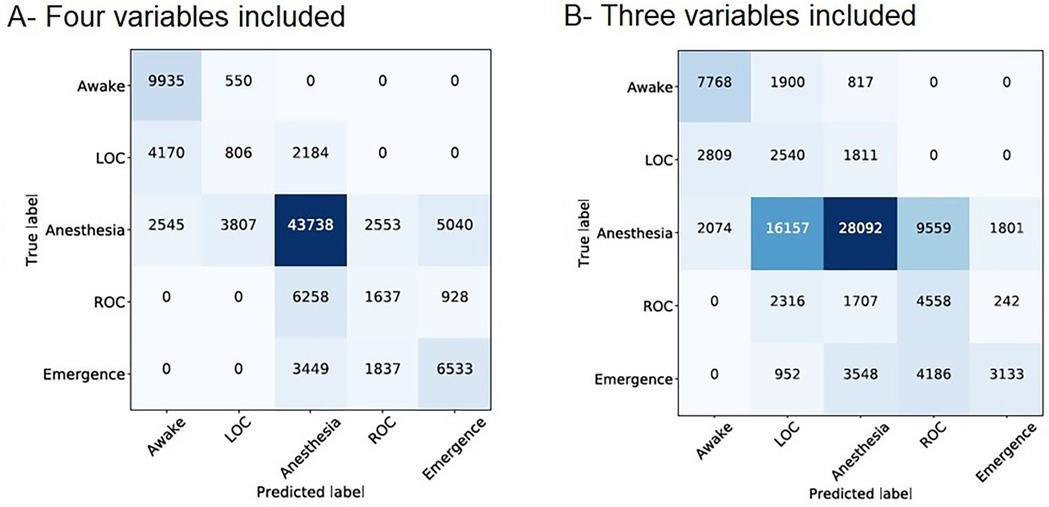
Figure 5. (A) Confusion matrix obtained on one split of the dataset and when 4 variables are included in the HMM. (B) Confusion matrix obtained on one split of the dataset and when 3 variables are included in the HMM. For each panel, on the vertical axis: actual state according to the EEG, on the horizontal axis: predicted state by the model. The intensity of the color is correlated with the number. HMM, hidden Markov model.
Figure 6 displays the prediction of the state of consciousness in two patients. Our results showed that the algorithm well predicted anesthesia and never mixed up the LOC and the ROC. However, these transition states were misplaced in time in a few cases. Finally, Figure 6B shows an example where at the end of the anesthesia the BIS failed to detect the beginning of the ROC while our algorithm detected it precisely.
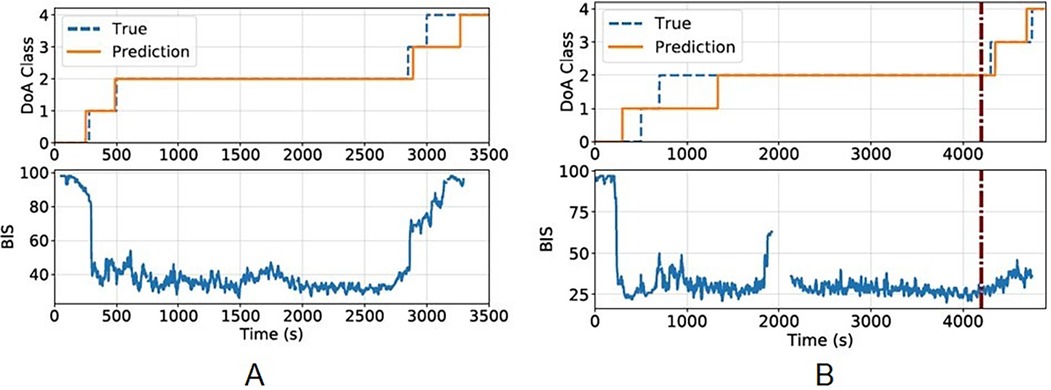
Figure 6. Prediction on two patients (A) and (B) for each subfigure, the upper part corresponds to the states S = {0, 1, 2, 3, 4} = {awake, LOC, anesthesia, ROC, emergence} predicted by the algorithm (in orange) compared to the reality (in dash-blue line) as assessed by the EEG. The lower part corresponds to the BIS value between 0 and 100. LOC, loss of consciousness; ROC, recovery of consciousness.
4 Discussion
Our method demonstrated an acceptable agreement between the prediction of the DoA by a simple model that takes into account only 4 of the variables that must be monitored during any GA (MBP, HR, RR, and AAEt) and the actual DoA assessed by the EEG. The TPR of our model for the identification of the Awake, Anesthesia and Emergence states were 88%, 72% and 58% respectively.
To predict DoA without including EEG data could seem incomplete. On the contrary, the interest of our model is to highlight how high-frequency recording of simple clinical variables combined with machine learning can help in assessing the DoA through the reactivity of the autonomic nervous system. Anesthesiologists have to consider the pre- and post-induction values of HR, BP, RR and AAEt and monitor them every 10-min during routine anesthesia. It means that the assessment of the patient's DoA is routinely based on the comparison of a maximum of about 24 values per hour. In contrast, the algorithm processed these variables every second. For a low-risk patient with BP assessed every 5 min, it represents 10.820 values every hour. The interest of this approach is twofold: (i) simplicity in its construction and understanding: unlike the multimodal index of consciousness developed by Schneider et al. (5), our model is based only on four variables that are easy to apprehend by the anesthetist and compulsory monitored for any anesthesia, and (ii) would not require any additional equipment as the data included are all mandatory for the anesthesia practice. It could prove to be helpful to identify the moment when the anesthesia is deep enough to authorize the surgical incision when EEG monitoring is not available or poorly reliable, or when the cost benefit ratio is unfavorable.
Our choice of the four variables MBP, HR, RR, and AAEt was pragmatic: they are simple clinical parameters, monitored obligatorily during any GA and familiar to the anesthetist physician. There is an interdependence between these parameters, but each one contains its own part of information. In our opinion, RR is a relevant variable of the patient's autonomic nervous system as a surrogate of EtCO2 regardless of the use of a neuromuscular blockade. Indeed, RR is set up by the anesthesiologist in order to obtain a targeted EtCO2 between 35 and 40 mmHg. RR adjustments under general anesthesia are thus correlated to variations of CO2 production and cardiac output. However, this correlation would probably no longer be valid in the case of intraoperative absorption of CO2 (pneumoperitoneum). As MBP and HR are highly dependent on other factors than DoA (major fluid loss, vasoactive agents or some anesthetic drugs with specific heartrate-slowing effect), our results can only be extrapolated to relatively healthy patients undergoing simple surgery.
Obviously, other parameters would also be relevant, notably HR variability, which is the most studied parameter in this field (16, 17). However, the integration of this parameter necessarily induces a time lag (for the calculation of the variability over a given window) which we wanted to avoid.
Since the DoA is an intrinsically dynamic process, we decided to use a Hidden Markov Model (HMM) (12), which is the simplest form of Bayesian dynamic network. The main advantage of HMMs lies in their probabilistic nature adapted to time-dependent signals (such as speech or handwriting). Another motivation to use such model was that HMMS have already been used successfully for the recognition of various patterns, including language (18, 19) and handwriting recognition (20), analysis of biological sequences (21), and even sleep-wake recognition by EEG analysis (22, 23).
To identify the five hidden states in the learning phase of the HMM, we visualized spectrograms and defined each state with the presence or not of δ, α and θ waves as the signature of Anesthesia under sevoflurane (11). We found only one study which identifies like us all the stages of anesthesia in real conditions by reading the spectrogram (24). The subjective and still little validated character of this method represents the main limitation of our study. The difficulty was to characterize LOC and ROC with sufficient precision on the spectrogram for learning HMM. Most studies interested in the identification of LOC and ROC consider these stages as the punctual transition from one stable state to another (Awake to Anesthesia and Anesthesia to Emergence). In the healthy volunteer where hypnotic concentrations are progressively increased before complete arrest and awakening of the subject, LOC and ROC are clinically described by the loss and recovery of the simple order response and thus limit the unconscious phase without prejudging the reactivity to pain. Temporal correlation with the spectrogram of a frontal EEG channel identifies them by the appearance and disappearance of alpha and delta waves (25, 26). In these studies, LOC and ROC result in time- symmetrical electroencephalographic changes (25). We chose to apply this method by symmetrically bounding LOC and ROC by the presence of alpha/delta waves and the absence of theta waves. However, it has been shown in real life that LOC and ROC are not explained by the same neurophysiobiological processes (27) and that ROC may present different EEG signals depending on age or brain vulnerability (26, 28, 29). This imprecision probably explains in part the disappointing performance of our algorithm for LOC and ROC. Moreover, those transition states are less represented with LOC and ROC corresponding to only 5% and 9% of the recordings, respectively.
Other limitations include the relatively small number of patients included, the duration of the study (prolonged on 3 years due to the authors' operational constraints), and the offline aspect of the current prediction.
But these limitations are counterbalanced by several strengths. Our methodology sought to be pragmatic by reproducing the real conditions of medical practice. Balanced anesthesia is the most commonly used protocol in our hospital and in France. It associates an intravenous injection of opioid followed by propofol, then neuromuscular blockade if needed; the maintenance of the anesthesia is done by inhaled halogen. The immediate impact is to associate in each patient, and thus on each spectrogram, the signature of propofol (used for induction) and that of sevoflurane (used for maintenance).
Our model differs from most other monitoring systems (5) in that it does not emit a numerical value but the direct identification of a state of interest. The advantage is to translate the DoA in real time and in a concrete way without imposing on the doctor the analysis of a number whose construction is unknown. The disadvantage is the purely qualitative nature of our model which does not allow the detection of overdosage. Moreover, we have chosen a unidirectional model considering that the course of a GA is itself a one-way process, with an imposed succession of states. This choice does not make it possible to envisage the transition from LOC to Awake (in the event of stopping or lightening the anesthesia for example) and ROC to Anesthesia (in the event of intra-operative awakening leading to a deepening of the anesthesia).
In conclusion, our method demonstrated promising results for the prediction of the DoA integrating 4 variables compulsory monitored during anesthesia. Future work will focus on adding the data from a single EEG channel in the model, in parallel with the increase of the cohort to improve the accuracy of the model.
Data availability statement
The raw data supporting the conclusions of this article will be made available by the authors, without undue reservation.
Ethics statement
The studies involving humans were approved by Ethics committee of the French society of anesthesiology (SFAR) (IRB 00010254-2016-018). The studies were conducted in accordance with the local legislation and institutional requirements. The participants provided their written informed consent to participate in this study.
Author contributions
GR: Formal Analysis, Methodology, Writing – original draft, Writing – review & editing. CD: Conceptualization, Formal Analysis, Methodology, Software, Supervision, Validation, Writing – original draft, Writing – review & editing. PH: Conceptualization, Formal Analysis, Methodology, Software, Writing – review & editing. LO: Conceptualization, Supervision, Validation, Writing – review & editing. CL: Supervision, Validation, Writing – review & editing. NV: Supervision, Validation, Writing – review & editing. J-PT: Supervision, Validation, Writing – review & editing. P-PV: Supervision, Validation, Writing – review & editing.
Funding
The author(s) declare that no financial support was received for the research, authorship, and/or publication of this article.
Conflict of interest
The authors declare that the research was conducted in the absence of any commercial or financial relationships that could be construed as a potential conflict of interest.
Publisher's note
All claims expressed in this article are solely those of the authors and do not necessarily represent those of their affiliated organizations, or those of the publisher, the editors and the reviewers. Any product that may be evaluated in this article, or claim that may be made by its manufacturer, is not guaranteed or endorsed by the publisher.
References
1. Shafer SL, Stanski DR. Defining depth of anesthesia. In: Modern Anesthetics. Berlin, Heidelberg: Springer (2008). p. 409–23.
2. Sebel PS, Bowdle TA, Ghoneim MM, Rampil IJ, Padilla RE, Gan TJ, et al. The incidence of awareness during anesthesia: a multicenter United States study. Anesth Analg. (2004) 99:833–9. doi: 10.1213/01.ANE.0000130261.90896.6C
3. Thornton C, Jones JG. Evaluating depth of anesthesia: review of methods. Int Anesthesiol Clin. (1993) 31(4):67–88. doi: 10.1097/00004311-199331040-00008
4. Merry AF, Cooper JB, Soyannwo O, Wilson IH, Eichhorn JH. International standards for a safe practice of anesthesia 2010. Can J Anaesth. (2010) 57(11):1027–34. doi: 10.1007/s12630-010-9381-6
5. Schneider G, Jordan D, Schwarz G, Bischoff P, Kalkman CJ, Kuppe H, et al. Monitoring depth of anesthesia utilizing a combination of electroencephalographic and standard measures. Anesthesiology. (2014) 120(4):819–28. doi: 10.1097/ALN.0000000000000151
6. Yan B, Wang Y, Li Y, Gong Y, Guan L, Yu S. An EEG signal classification method based on sparse auto-encoders and support vector machine. 2016 IEEE/CIC International Conference on Communications in China (ICCC). IEEE (2016). p. 1–6. doi: 10.1109/ICCChina.2016.7636897
7. Shin Y, Lee S, Ahn M, Cho H, Jun SC, Lee HN. Noise robustness analysis of sparse representation based classification method for non-stationary EEG signal classification. Biomed Signal Proces Control. (2015) 21:8–18. doi: 10.1016/j.bspc.2015.05.007
8. Sadrawi M, Fan SZ, Abbod MF, Jen KK, Shieh JS. Computational depth of anesthesia via multiple vital signs based on artificial neural networks. Biomed Res Int. (2015) 2015:536863. doi: 10.1155/2015/536863
9. Ortolani O, Conti A, Di Filippo A, Adembri C, Moraldi E, Evangelisti A, et al. EEG signal processing in anaesthesia. Use of a neural network technique for monitoring depth of anaesthesia. Br J Anaesth. (2002) 88(5):644–8. doi: 10.1093/bja/88.5.644
10. Dubost C, Humbert P, Oudre L, Labourdette C, Vayatis N, Vidal PP. Quantitative assessment of consciousness during anesthesia without EEG data. J Clin Monit Comput. (2021) 35(5):993–1005. doi: 10.1007/s10877-020-00553-4
11. Purdon PL, Sampson A, Pavone KJ, Brown EN. Clinical electroencephalography for anesthesiologists: part I: background and basic signatures. Anesthesiology. (2015) 123(4):937–60. doi: 10.1097/ALN.0000000000000841
12. Rabiner L, Juang B. An introduction to hidden Markov models. IEEE ASSP Mag. (1986) 3:4–16. doi: 10.1109/MASSP.1986.1165342
13. Wang H, Song M. Ckmeans.1d.dp: optimal k-means clustering in one dimension by dynamic programming. R J. (2011) 3(2):29–33. doi: 10.32614/RJ-2011-015
14. Parikh R, Mathai A, Parikh S, Chandra Sekhar G, Thomas R. Understanding and using sensitivity, specificity and predictive values. Indian J Ophthalmol. (2008) 56(1):45–50. doi: 10.4103/0301-4738.37595
15. Akobeng AK. Understanding diagnostic tests 1: sensitivity, specificity and predictive values. Acta Paediatr. (2007) 96(3):338–41. doi: 10.1111/j.1651-2227.2006.00180.x
16. Nakatsuka I, Ochiai R, Takeda J. Changes in heart rate variability in sevoflurane and nitrous oxide anesthesia: effects of respiration and depth of anesthesia. J Clin Anesth. (2002) 14(3):196–200. doi: 10.1016/s0952-8180(01)00384-1
17. Sleigh J, Donovan J. Comparison of bispectral index, 95% spectral edge frequency and approximate entropy of the EEG, with changes in heart rate variability during induction of general anaesthesia. Br J Anaesth. (1999) 82(5):666–71. doi: 10.1093/bja/82.5.666
18. Rabiner LR. A tutorial on hidden Markov models and selected applications in speech recognition. Proc IEEE. (1989) 77:257–86. doi: 10.1109/5.18626
19. Gales M, Young S. The application of hidden Markov models in speech recognition. Found Trends® Sig Process. (2008) 1(3):195–304. doi: 10.1561/2000000004
20. Bunke H, Roth M, Schukat-Talamazzini EG. Off-line cursive handwriting recognition using hidden Markov models. Pattern Recog. (1995) 28:1399–413. doi: 10.1016/0031-3203(95)00013-P
21. Yoon BJ. Hidden Markov models and their applications in biological sequence analysis. Curr Genomics. (2009) 10:402–15. doi: 10.2174/138920209789177575
22. Riazy S, Wendler T, Pilz J. Automatic two-channel sleep staging using a predictor–corrector method. Physiol Meas. (2018) 39:014006. doi: 10.1088/1361-6579/aaa109
23. Kim J, Hyub H, Yoon SZ, Choi HJ, Kim KM, Park SH. Analysis of EEG to quantify depth of anesthesia using hidden Markov model. Annu Int Conf IEEE Eng Med Biol Soc. (2014) 2014:4575–8. doi: 10.1109/EMBC.2014.6944642
24. Zetterlund EL, Gréen H, Oscarsson A, Vikingsson S, Vrethem M, Lindholm ML, et al. Determination of loss of consciousness: a comparison of clinical assessment, bispectral index and electroencephalogram: an observational study. Eur J Anaesthesiol. (2016) 33(12):922–8. doi: 10.1097/EJA.0000000000000532
25. Purdon PL, Pierce ET, Mukamel EA, Prerau MJ, Walsh JL, Wong KF, et al. Electroencephalogram signatures of loss and recovery of consciousness from propofol. Proc Natl Acad Sci U S A. (2013) 110(12):E1142–51. doi: 10.1073/pnas.1221180110
26. Purdon PL, Pavone KJ, Akeju O, Smith AC, Sampson AL, Lee J, et al. The ageing brain: age-dependent changes in the electroencephalogram during propofol and sevoflurane general anaesthesia. Br J Anaesth. (2015) 115 Suppl 1(Suppl 1):i46–57. doi: 10.1093/bja/aev213
27. Kelz MB, Sun Y, Chen J, Cheng Meng Q, Moore JT, Veasey SC, et al. An essential role for orexins in emergence from general anesthesia. Proc Natl Acad Sci U S A. (2008) 105(4):1309–14. doi: 10.1073/pnas.0707146105
28. Chander D, García PS, MacColl JN, Illing S, Sleigh JW. Electroencephalographic variation during end maintenance and emergence from surgical anesthesia. PLoS One. (2014) 9(9):e106291. doi: 10.1371/journal.pone.0106291
Keywords: depth of anesthesia (DoA) estimation, hidden Markov model (HMM), machine learning methods, spectrogram analysis, cardiopulmonary variables
Citation: de Rocquigny G, Dubost C, Humbert P, Oudre L, Labourdette C, Vayatis N, Tourtier J-P and Vidal P-P (2024) Assessment of the depth of anesthesia with hidden Markov model based on cardiopulmonary variables. Front. Anesthesiol. 3:1391877. doi: 10.3389/fanes.2024.1391877
Received: 26 February 2024; Accepted: 24 July 2024;
Published: 22 August 2024.
Edited by:
Hossam El Beheiry, University of Toronto, CanadaReviewed by:
Christian Bohringer, UC Davis Medical Center, United StatesWael Saasouh, Detroit Medical Center, United States
Copyright: © 2024 de Rocquigny, Dubost, Humbert, Oudre, Labourdette, Vayatis, Tourtier and Vidal. This is an open-access article distributed under the terms of the Creative Commons Attribution License (CC BY). The use, distribution or reproduction in other forums is permitted, provided the original author(s) and the copyright owner(s) are credited and that the original publication in this journal is cited, in accordance with accepted academic practice. No use, distribution or reproduction is permitted which does not comply with these terms.
*Correspondence: Gaël de Rocquigny, Z2FlbC5kZXJvY3F1aWdueUBnbWFpbC5jb20=