 Masataka Adachi1
 Sou Nobukawa
 Keiichiro Inagaki
95% of researchers rate our articles as excellent or good
Learn more about the work of our research integrity team to safeguard the quality of each article we publish.
Find out more
ORIGINAL RESEARCH article
Front. Appl. Math. Stat. , 05 September 2024
Sec. Dynamical Systems
Volume 10 - 2024 | https://doi.org/10.3389/fams.2024.1426253
Fatigue is one of the crucial factors in human error-related traffic accidents. Despite the development of highly advanced intelligent transport systems, fatigue-related traffic accidents have not decreased. The factors inducing driver fatigue are classified into mental and physical categories. Physical fatigue results from muscle strain due to prolonged driving and operations. Mental fatigue, on the other hand, results from the continuous mental effort required for driving, including repeated perception and decision-making regarding driving situations and route planning. Monitoring driver fatigue can help prevent fatigue-related traffic accidents. Therefore, researchers have studied its relationship with various biomarkers such as sleep state, eye movement, facial expression, and electroencephalography (EEG) activation levels. Moreover, studies have revealed the relationship between fatigue and cognitive performance, which is affected by factors such as extended periods of driving. Furthermore, the strategy, quantity, and quality of driving operations and perception differ in various traffic environments. For instance, driving stress levels vary depending on factors such as the number of vehicles on the road, traffic congestion, and road conditions. However, the brain activity associated with mental and physical workload due to the traffic environment and its factors remains unknown. In particular, the relationship between mental and physical stress resulting from varying levels of operation and perception in different driving environments, the accumulation of driver fatigue caused by such stress, and the related brain activity are still unclear. In this study, we focused on investigating the mental and physical workload that accumulates in drivers and induces physical and mental fatigue, as well as the related brain activity caused by different traffic environments. We investigate these aspects through driving experiments, measuring EEG in driving environments created by varying the traffic environment and density using a driving simulator. The results confirmed differences in theta- and alpha-band spectral responses, which are associated with driver fatigue, across different traffic environments. Further examination of the causal relationship showed that mental and physical workload were associated with fatigue-related spectral responses depending on the traffic environment. These findings imply that the level of cognitive and operational load inherent in driving environments plays a crucial role in driver fatigue.
Intelligent Transport Systems (ITS) technology has advanced significantly in recent years, especially with the remarkable progress in AI technology. These recent advancements in ITS have led to the implementation of driving support systems on roads. These systems utilize sensors installed on the road to recognize the status of other vehicles and obstacles, enabling real-time support for the driver’s actions through communication. Moreover, various automobile technologies leveraging highly developed AI have been introduced to detect dangerous traffic objects and facilitate automatic driving, all developed for the purpose of preventing traffic accidents. However, despite these technological advancements, traffic accidents continue to occur due to various factors. Accidents resulting from human error remain a significant concern, often leading to fatal or serious incidents that are difficult to prevent even with current ITS technologies.
The main causes of traffic accidents due to human error include distracted driving, improper driving operation, misperception, and failure to check safety. These human errors result from several factors, including fluctuations in the driver’s concentration caused by passengers (1, 2), deterioration of the driver’s mental and physical functions due to lack of sleep or fatigue (3–5), and environmental factors such as long driving hours in a monotonous road environment (6–9). Fatigue is a significant research topic, which is a problem not only in vehicle driving but also in train (10, 11) and airplane operation (12, 13). Despite efforts, fatigue-related traffic accidents have not decreased (5). Previous studies on vehicle operation and fatigue have classified driver fatigue factors into mental and physical categories (14, 15). Physical fatigue is caused by muscle strain due to prolonged driving (16, 17) and operations during driving such as accelerating, braking, and steering wheel operation and/or decreased physical ability due to lack of sleep. Mental fatigue, on the other hand, results from the accumulation of mental effort in driving, involving repeated perceptual evaluations and decision-making regarding driving situations and route planning (4, 18–20). Monitoring driver fatigue can potentially prevent fatigue-related traffic accidents. Studies have investigated its relationship with various biological markers, including sleep state (5, 20, 21), eye movements (22–25), facial expressions (26, 27), electroencephalography (EEG) activation levels (14, 28–32), and functional connections in the brain (33–35).
EEG evaluation is a useful indicator due to its potential to simultaneously assess not only the changes in brain activity related to fatigue but also its relationship to driving behavior (28). Previous studies have reported increases in EEG delta and theta activity (36), theta-alpha band activity (14, 37), and alpha band activity (8, 38) in relation to increased driver fatigue. Studies focusing on mental fatigue occurring during driving have shown increased activity in the delta, theta, and alpha bands (39–41). Tran et al. also reported that the spectral response associated with such mental fatigue shows a large increase in the theta and alpha bands and small increases in the delta and beta bands (42). Thus, it is well-known that driving fatigue, including mental fatigue, manifests in changes in the theta to alpha bands of the EEG spectrum. However, the specific driving factors that contribute to such fatigue are still unknown.
Research has revealed the relationship between fatigue and cognitive performance, which are affected by factors such as prolonged driving in a monotonous environment (6–8) and lack of sleep (5, 20, 21), both in driving simulators and real vehicles. However, the quantity and quality of driving operations and cognition vary across different traffic environments, such as urban areas and highways. It has been widely reported that driver fatigue occurs when driving in a monotonous environment for a prolonged time. Moreover, the level of driving stress could be affected by different driving conditions, such as traffic volume, congestion, and road conditions (43–46). Within these contexts, particularly concerning the mental and physical workload resulting from varying levels of operation and cognition in different driving environments, as well as driver fatigue due to the accumulation of such stress, the associated brain activity remains unknown.
This study aims to investigate the mental and physical workload experienced by drivers and the related brain activity caused by different traffic environments. We evaluated these aspects using EEG measurements in driving environments created by varying the traffic environment and density using a driving simulator. Specifically, we reproduced driving scenarios in an urban area, traffic congestion, and a highway with different levels of cognitive and operational demands. We investigated the effects of cognitive and operational demands on fatigue and the related EEG responses during driving. Furthermore, workload evaluations using NASA-TLX (47), questionnaires on fatigue, and analyses of cognitive and operational behaviors during driving experiments were conducted to evaluate their causal relationship with the EEG responses.
We recruited 12 male participants for the experiments, who were aged 19 to 23 years (mean age 21.5 ± 0.87) and licensed drivers. All participants had no health or neurological problems and had normal or corrected-to-normal vision by glasses or contact lenses, as described on their driver’s license. Prior to the experiments, the purpose and details of the experiment were explained to each participant, and informed consent was obtained. Before the experiments, we assessed arousal levels using the Japanese-translated version of the Karolinska Sleepiness Scale (48), and all participants met the criteria for low arousal conditions on the scale.
Figure 1 illustrates our experimental setup for EEG recording and driving simulation, designed to replicate the functional view of vehicle driving. The setup included a personal computer (PC) display (LG 34GL750-B, 1920 × 1,080), stereo speakers, a steering controller, and gas and brake pedals (Logitech G29 Driving Force Feedback Racing Wheel), a high-performance PC (Intel Core i9 processor 3.30 GHz with 128 GB RAM and NVIDIA GeForce RTX3070 8 GB VGA card) for data collection, traffic scene capture, and simulator control, an adjustable driver’s seat, and an EEG recorder (Polymate AP108, Miyuki-Giken Co., Ltd., Japan). The engine sound was emitted from the stereo speakers at a volume below 80 dB. The distance between the PC display and the participant’s head was approximately 60 cm, imitating a field of view of about ±30 degrees, which encompasses the functional view (approximately ±20 degrees) observed during vehicle driving, as reported in previous studies (49, 50).
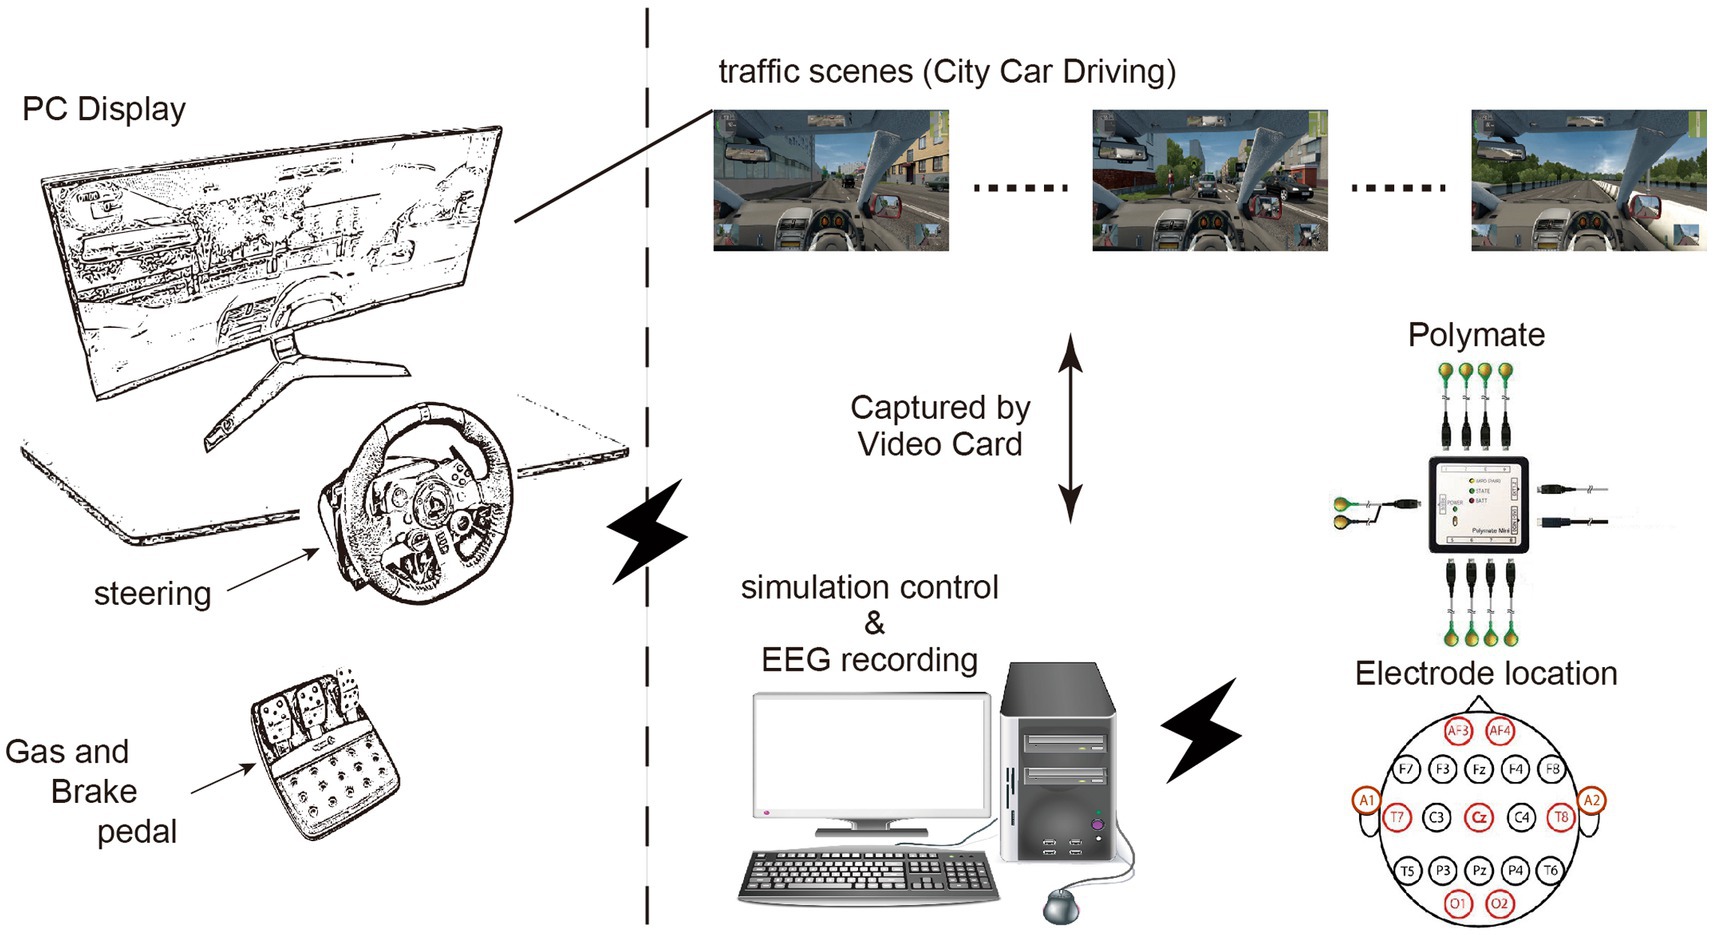
Figure 1. Experimental setup and electroencephalography (EEG) recording system during driving simulations. The experimental setup consisted of a personal computer (PC) display, stereo speakers, a steering controller, gas and brake pedals, a high-performance PC for data collection, traffic scene capture, and driving simulator control, an adjustable driver’s seat, and an EEG recorder. A 9-channel EEG setup with electrodes was placed at 7 sites (AF3, AF4, T7, T8, Cz, O1, and O2) covering the entire brain area, along with two reference sites (A1 and A2) according to the International 10–20 electrode positioning system. City Car Driving was used as the driving simulator.
During the experiments, City Car Driving (Forward Development Ltd.) was utilized as the driving simulation software. Traffic scenes from this software were projected onto the PC display at 30 frames per second (fps). These scenes were captured by a video card for the post-analysis of drivers’ perceptions and vehicle operations.
Prolonged vehicle driving causes both mental and physical fatigue. Figure 2 summarizes the driving scenarios used in our experiment. To investigate the causal factors between drivers’ fatigue and these mental and physical factors, we simulated three different traffic conditions: normal driving, driving in heavy traffic densities in an urban area, and driving on a highway with normal traffic density. For the urban area, traffic density was set at 20% (hereafter, referred to as urban) to simulate typical traffic conditions and at 100% for driving in congested traffic (referred to as traffic jams). For highway driving, the traffic density was set at 20% (referred to as highway). Studies have reported that fatigue in driving typically sets in after approximately 30 min (8, 51, 52). Therefore, the duration of driving for each condition was set at 30 min.
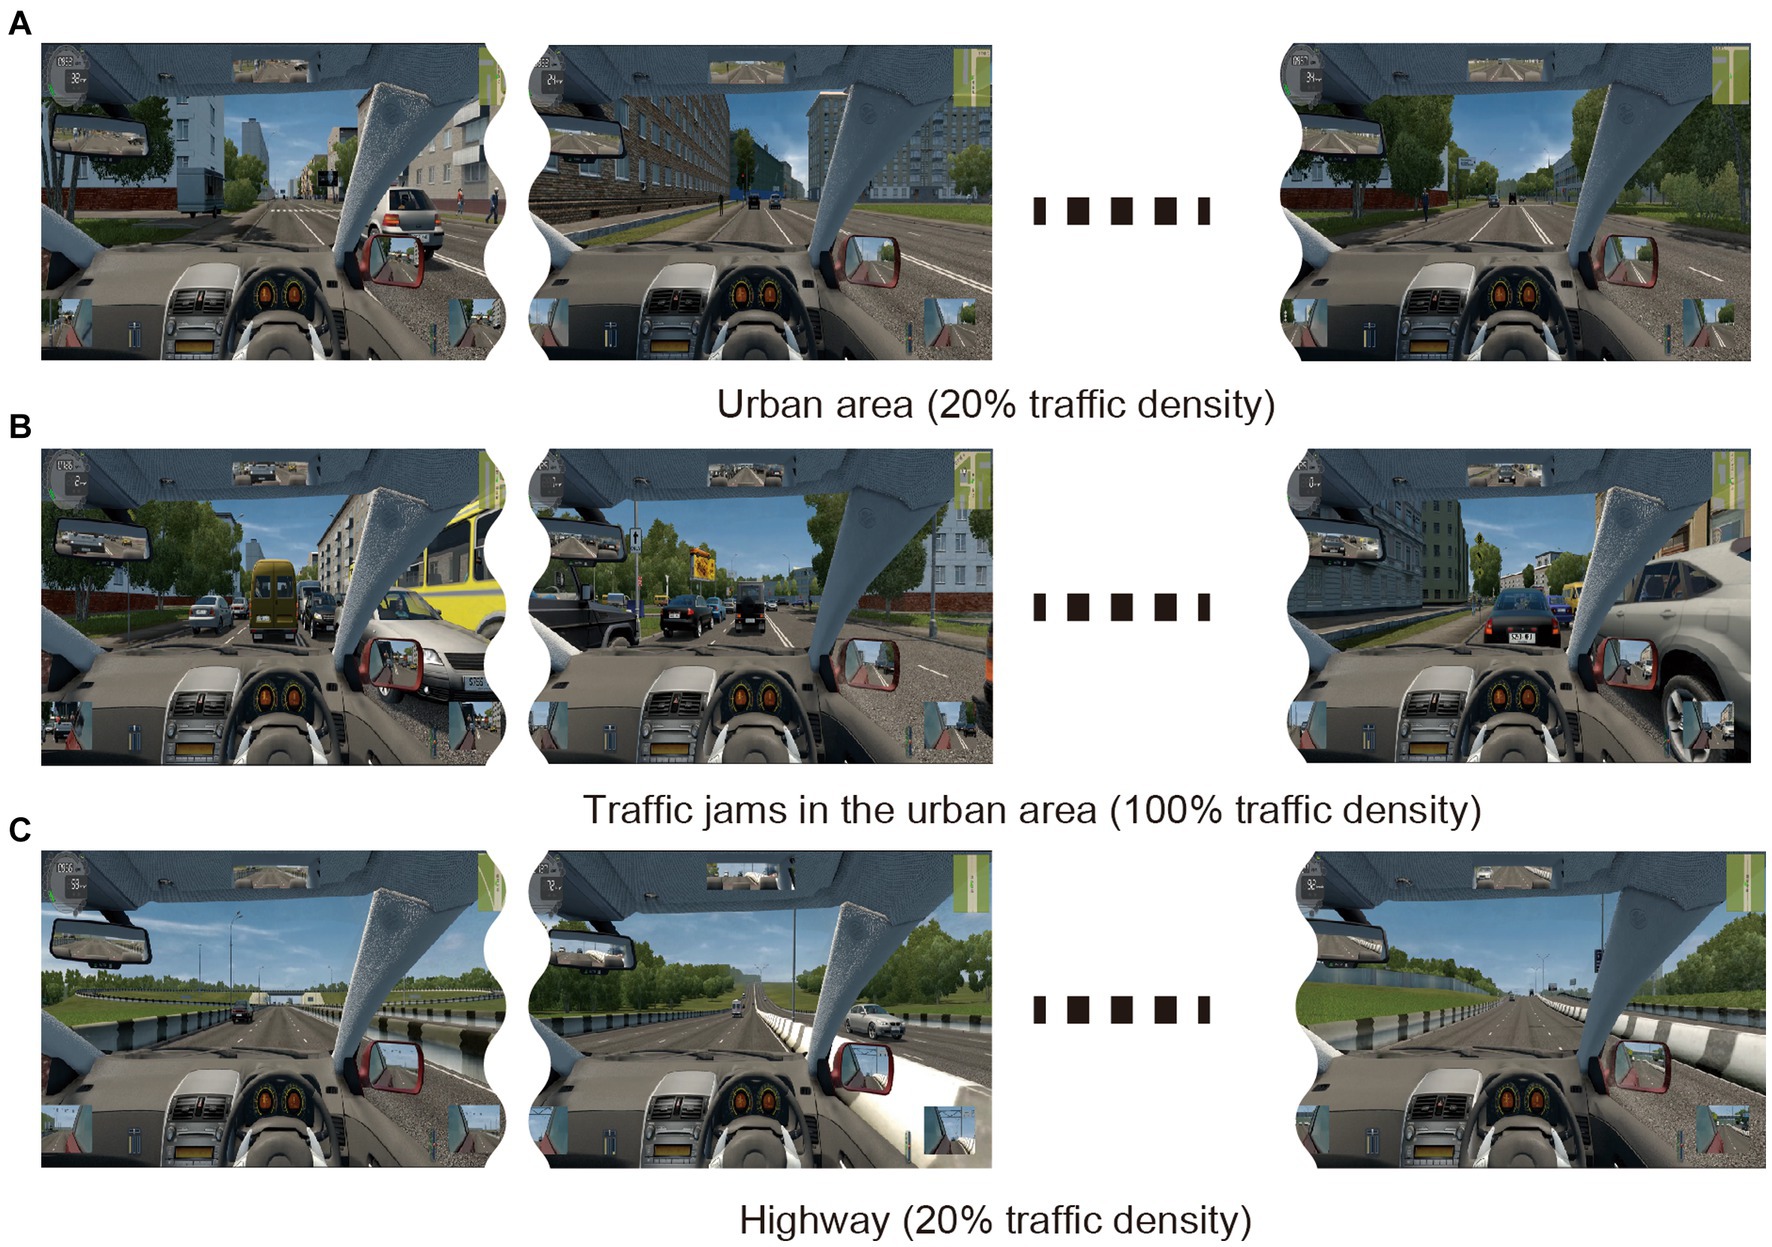
Figure 2. Stimulus scenarios for three different traffic conditions: (A) urban driving with 20% traffic density, (B) congested driving (100% traffic density), and (C) highway driving with 20% traffic density. The duration of driving for each condition was 30 min.
In our driving scenarios, we mainly controlled the number of maneuvers and the perception times for each driving condition. Specifically, drivers needed to recognize traffic scenes and perform maneuvers when driving in the urban area with 20% traffic density, whereas drivers did less scene recognition when driving in congestion due to mainly performing gas and brake pedal operations. In highway driving, drivers performed fewer driving maneuvers, mainly using the pedals and steering, while searching for road signs and other vehicles.
Before the experiment in the driving simulator, participants performed a 60 min session of driving simulation to familiarize themselves with the simulator. Following this familiarization phase, participants did a 30 min drive in one of the traffic scenarios described above. After completing the 30 min driving task, participants were asked to respond to a fatigue questionnaire (Supplementary Figure S1), visually presented on a scale of 0 to 100 to assess the level of fatigue they felt, with higher scores indicating higher levels of fatigue. To ensure a fair assessment of fatigue, each driving condition was tested on a separate day within the same time zone. All experimental procedures and EEG recordings described below were conducted in accordance with the Declaration of Helsinki and were approved by the Ethics Committee of the Ethics Committee of the Chubu University (Protocol# 20210016).
The EEGs of all participants were recorded during each of the driving scenarios described above. Participants sat in the driver’s seat and adjusted it to their preferred position. During the experiment, participants were instructed to drive as they would under ordinary driving circumstances, adhering to traffic regulations.
EEGs of all participants were recorded using a Polymate AP108. We utilized a 9-channel EEG setup with electrodes placed at 7 sites (AF3, AF4, T7, T8, Cz, O1, and O2) covering the entire brain area, along with two reference sites (A1 and A2) according to the International 10–20 electrode positioning system (53). Prior to electrode placement, the scalp was wiped using paper towels soaked in alcohol to avoid EEG signal deterioration caused by scalp oils. The sampling frequency was set at 500 Hz. In analyzing the Fourier spectra, we focused on EEG signals measured from the occipital electrodes (O2) because fatigue-related responses are typically observed in this region (28).
To investigate the causal relationship between variations in mental and physical workload and the onset of fatigue across different driving environments, we initially analyzed the number of perceptual targets, related to mental load, and the number of driving operations, related to physical load, in each of the three distinct driving conditions. Previous studies have reported qualitative and quantitative variations in fatigue occurrence across different tasks (54). In the context of driving, the perceptual and physical load experienced by drivers varies depending on the driving environment. Considering these aspects, we estimated the perceptual and physical load during the three distinct driving environments by examining captured video data from driving simulator experiments. In the present study, perceptual load was defined as the number of perceptual objects such as traffic signals, pedestrians, crossings, signs, and other vehicles. Physical load was determined based on the frequency of right and left turns, lane changes, and gas and brake pedal operations.
Fast Fourier transform (FFT) was used to obtain the frequency spectrum of EEG signals. Prior to FFT analysis, the DC component of the EEG data was removed following the application of a band-pass filter (4–45 Hz, using a zero-phase digital filtering method). Subsequently, data points showing prominent trends and quick phasic noise (spiky responses) exceeding three times the standard deviation were removed as artifacts. FFT analysis was conducted on randomly selected 1 s epochs using a Hanning window. This epoching process and FFT calculation were iterated 1,000 times to ensure equal contribution of data from both the initial and final 2 min of the driving session for calculating the power spectrum. Finally, the obtained power frequency spectrum was averaged and converted into the probability distribution p(k) by Equation (1):
where s(k) is the averaged power spectrum at the frequency k, and nyq is the Nyquist frequency (250 Hz). To compare these spectral responses regarding fatigue induced by driving, changes in theta and alpha band spectral responses were determined by subtracting the spectral response calculated from the initial 2 min from that calculated from the final 2 min. All analyses were performed using MATLAB and its signal processing toolbox. This study focused on spectral responses within the theta (4–8 Hz) and alpha bands (8–13 Hz), which are known to reflect fatigue (28).
After the driving experiment in each traffic condition, the workload caused by the driving was evaluated using the NASA-TLX scale. The NASA-TLX provides a subjective assessment of workload by considering mental demand (MD), physical demand (PD), temporal demand (TD), own performance (OP), effort (EF), and frustration (FR). In the present study, each index was initially scored on a scale ranging from 0 to 100, with higher scores indicating a higher workload. Next, the contribution of each index to the driving task was determined through pairwise comparisons of workload indexes for each participant. These comparisons yielded 15 possible pairings across the six workload indexes, from which participants selected an index from each pair that contributed more to the overall workload of the driving task. The frequency of selection for each workload index in these comparisons was tallied to determine the weight for each workload index (Supplementary Tables S1–S3). Finally, the weighted workload (WWL) was calculated by Equation (2):
where wi and vi are the weight and score, respectively, of each workload index.
Statistical significance was evaluated using the paired Student’s t-test, and effect sizes were calculated using Cohen’s d (55). Statistical analyses were performed using EZR software (56), and the effect size was determined using G*power (57).
First, we investigated the relationship between driver fatigue and induced EEG spectral response across each driving scenario. Figures 3, 4 illustrate the changes in the spectral response and the average changes in theta- and alpha-band spectral responses in each driving scenario. The largest response was observed in the theta- and alpha-band activity during urban driving (0.0032 ± 0.0023). However, the theta- and alpha-band activities declined during congested driving (0.0016 ± 0.0030). Conversely, in highway driving, the theta- and alpha-band activity was diminished (−0.0004 ± 0.0038). These results were compared for each condition using the paired Student’s t-test. A significant difference was found in changes in the theta- and alpha-band activity between urban and highway driving (p < 0.01, Cohen’s d = 1.14). No significant difference was found between urban and congested driving (p = 0.066, Cohen’s d = 0.59) nor between congested and highway driving (p = 0.08, Cohen’s d = 0.59).
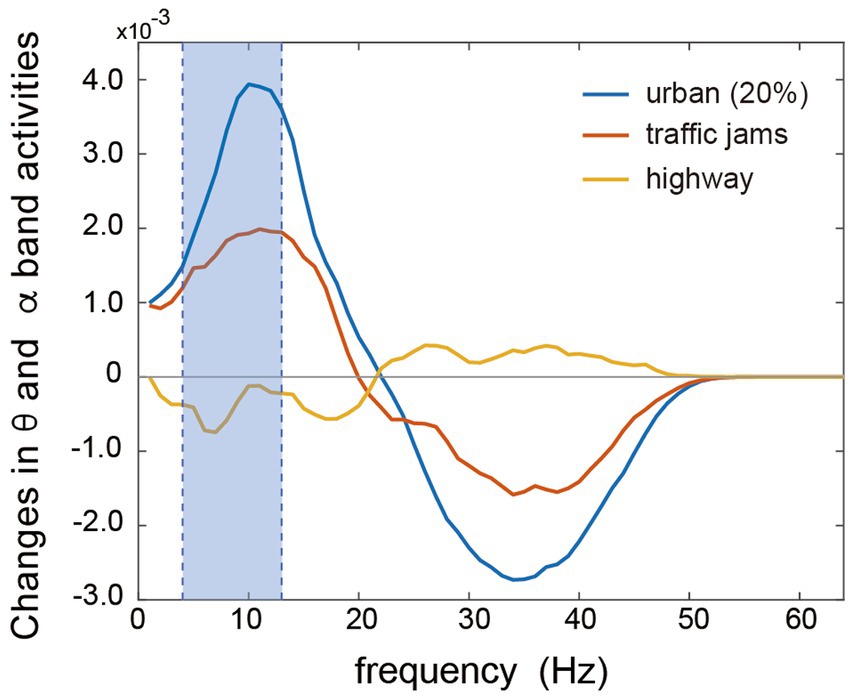
Figure 3. Grand averages of the normalized power spectrum between the initial 2 min and the final 2 min of driving in three different traffic conditions. The solid blue, orange, and yellow lines represent urban driving with 20% traffic density, congested driving, and highway driving, respectively. Pale blue areas show theta- and alpha-band (4–13 Hz) activities.
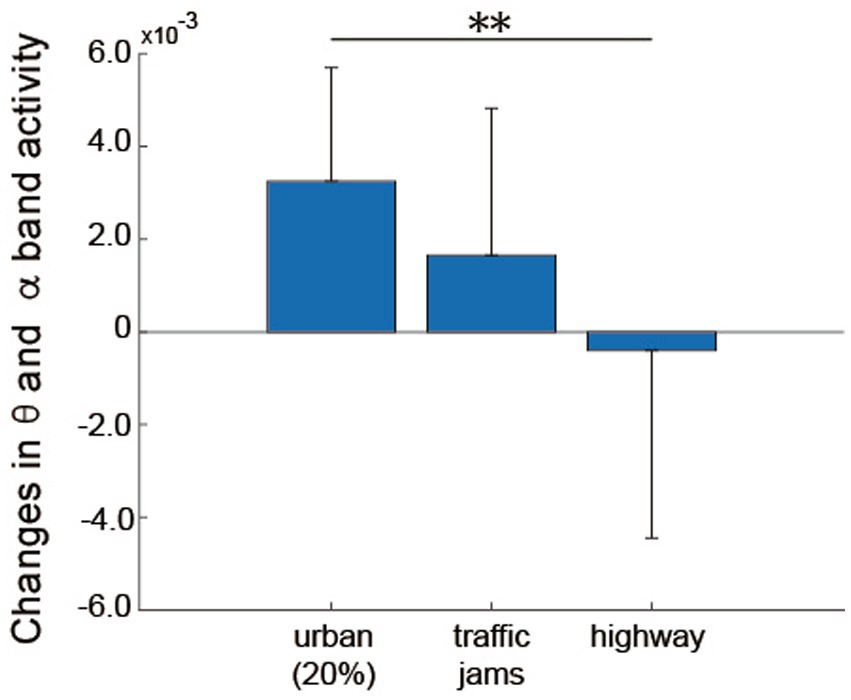
Figure 4. Average changes in the theta- to alpha-band spectral responses between the initial 2 min and the final 2 min of driving in three different traffic conditions. **Indicates statistical significance (p < 0.01), evaluated by Student’s t-test. The error bar indicates one standard deviation.
Figure 5 summarizes the WWL and each factor of NASA-TLX in each driving scenario. The average WWL was higher in urban (61.07 ± 11.03) and congested driving (67.00 ± 19.23) than in highway driving (48.57 ± 13.09). The scores for MD were also higher in urban (68.64 ± 10.89) and congested driving (67.73 ± 22.49) than in highway driving (50.45 ± 26.23). PD was highest in congested driving (61.82 ± 27.49), followed by urban driving (50.00 ± 16.37), and then highway driving (38.18 ± 18.86). TD was higher in urban (56.36 ± 23.36) and congested driving (51.82 ± 29.40) than in highway driving (36.36 ± 16.11). OP scores were similar across scenarios (urban: 35.91 ± 23.04; traffic jams: 37.27 ± 27.58; highway: 30.45 ± 23.10). EF scores were higher in urban driving (77.27 ± 14.82) than in congested (67.25 ± 25.26) and highway driving (64.09 ± 24.84). FR scores were highest in congested driving (74.54 ± 20.27), followed by urban driving (65.00 ± 21.11), and then highway driving (64.09 ± 16.62). Statistical differences in WWL and each factor of NASA-TLX between driving scenarios were evaluated using paired Student’s t-tests. For the WWL, significant differences were confirmed between urban and highway driving (p < 0.01, Cohen’s d = 1.120), and between congested and highway driving (p < 0.05, Cohen’s d = 1.032). For MD, significant differences were found between urban and highway driving (p < 0.05, Cohen’s d = 0.908), and between congested and highway driving (p < 0.05, Cohen’s d = 0.706). PD showed significant differences only between congested and highway driving (p < 0.01, Cohen’s d = 1.003). TD showed significant differences only between urban and highway driving (p < 0.05, Cohen’s d = 0.997). Significant differences in EF were found only between urban and highway driving (p < 0.05, Cohen’s d = 0.644). No significant differences were found in OP or FR across any combinations.
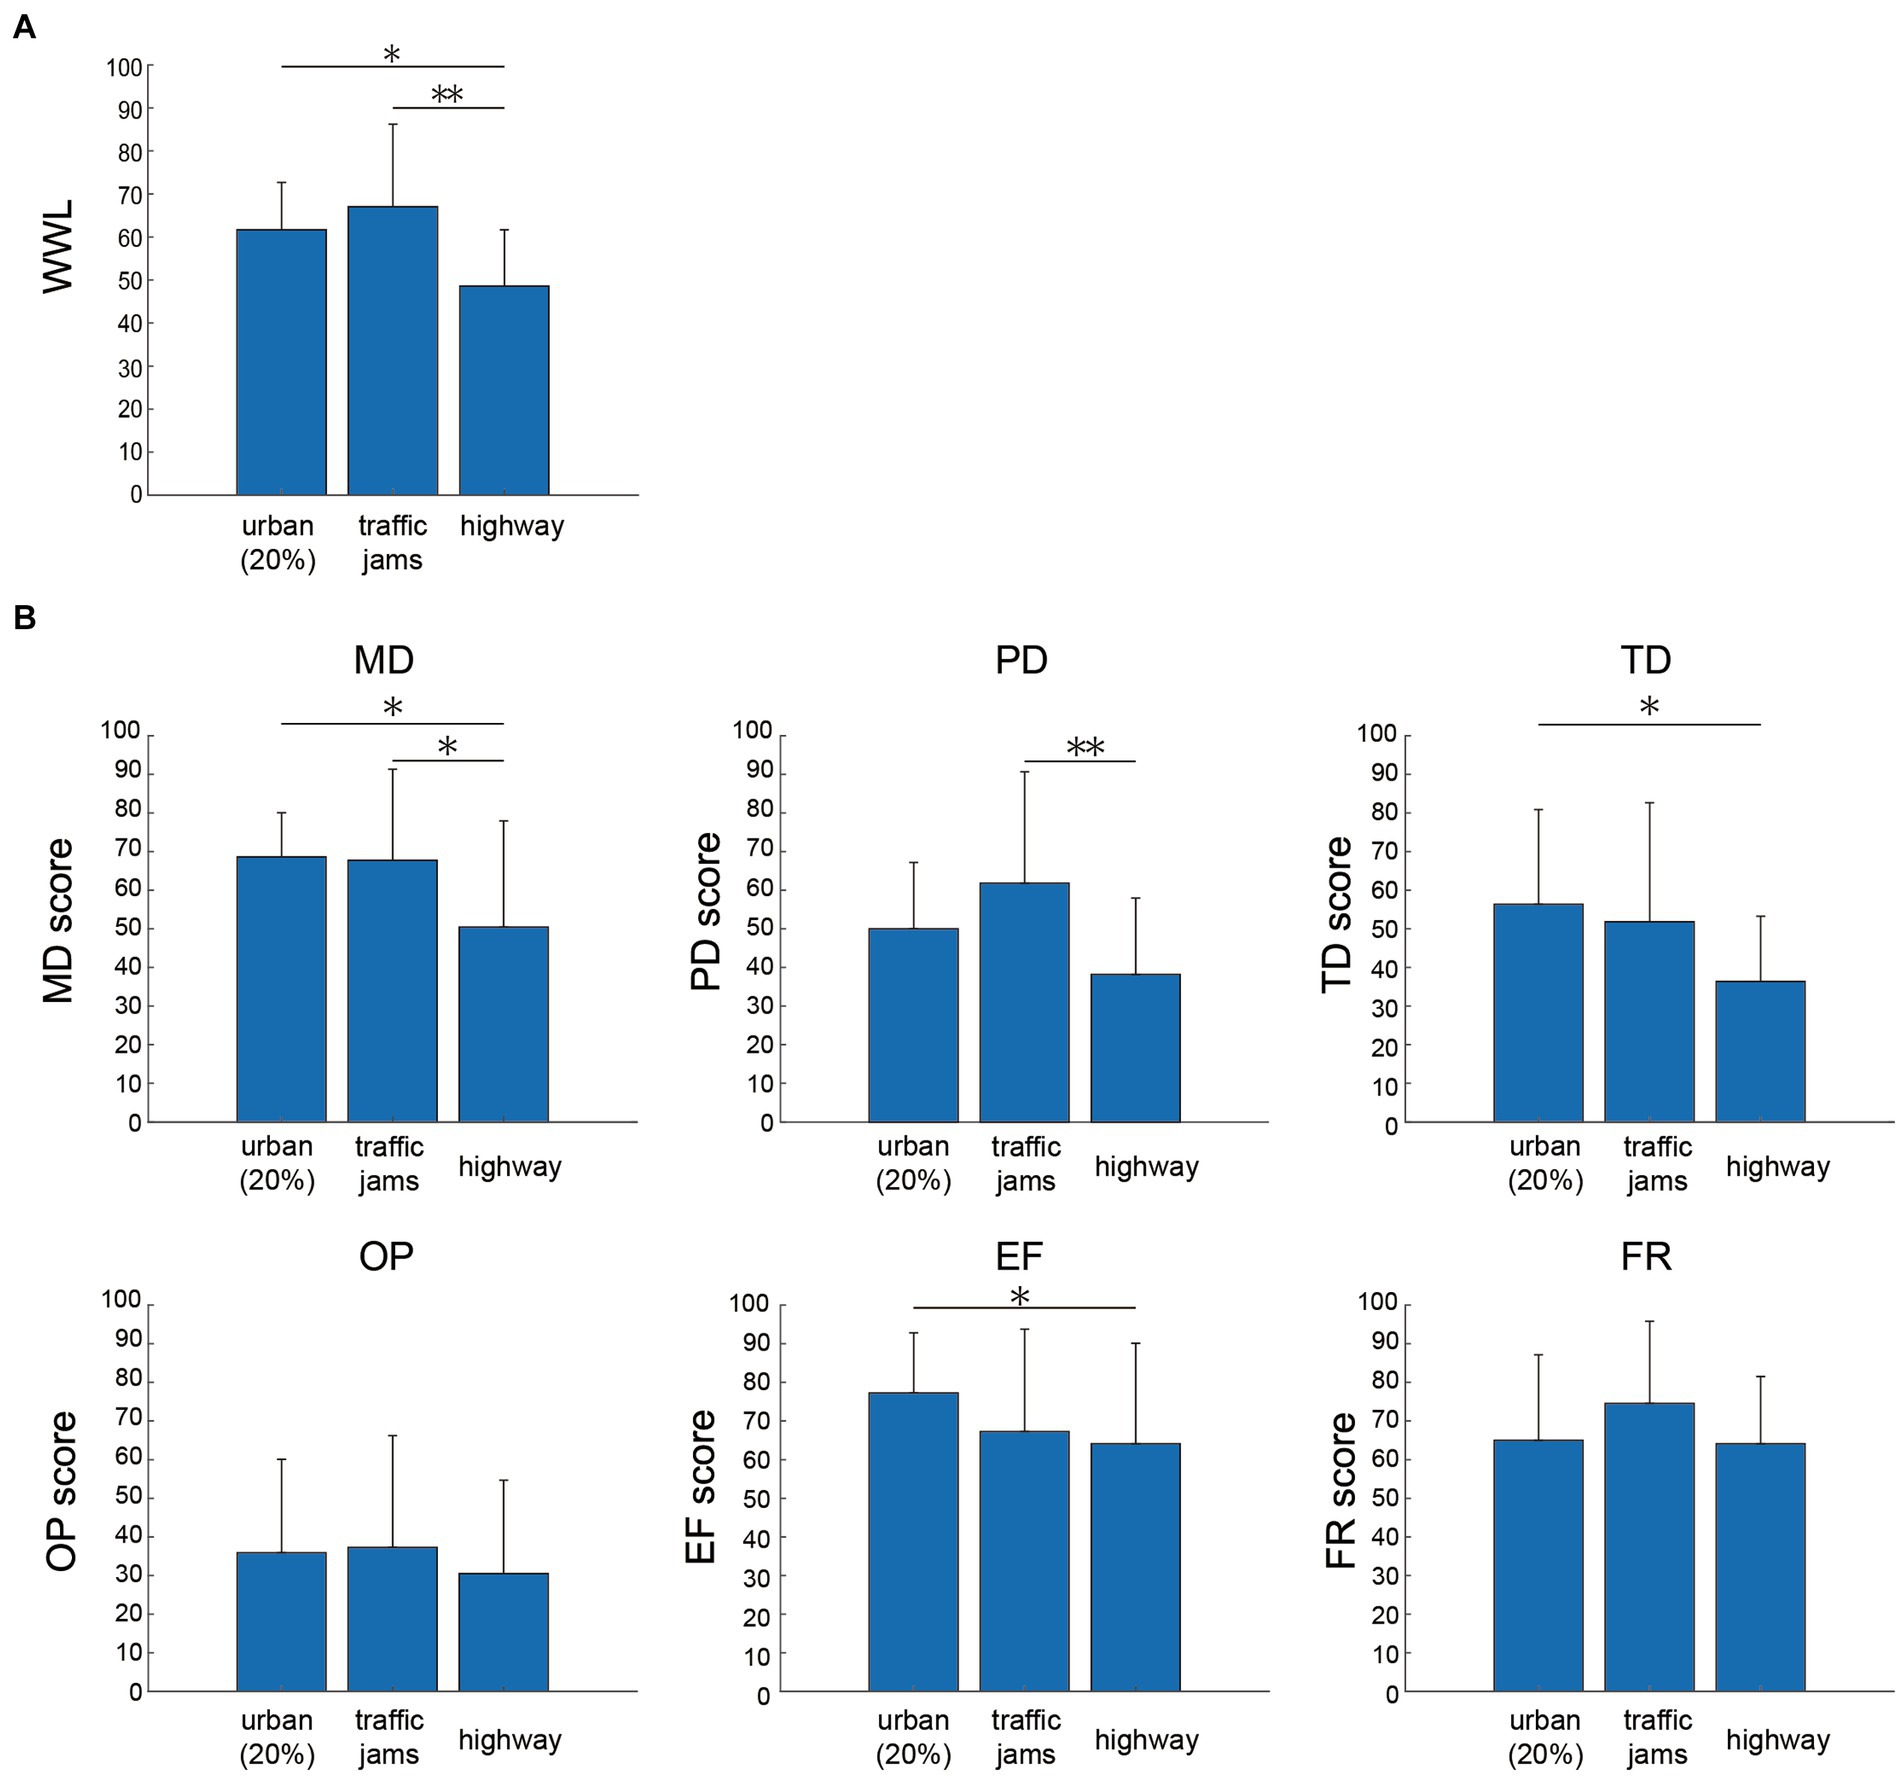
Figure 5. The weighted workload [WWL: (A)] and individual scores [MD, PD, TD, OP, EF, and FR, (B)] on the NASA-TLX during driving in three different traffic conditions. * and ** Indicate statistical significance (p < 0.05 and p < 0.01, respectively), evaluated by Student’s t-test. The error bar indicated one standard deviation.
Figure 6 summarizes the numbers of operations and perceptual objects. The total number of operations and perceived objects was highest in urban driving (265.91 ± 31.41), followed by congested driving (213.45 ± 30.93), and then highway driving (196.63 ± 14.20). Significant differences were found between all combinations (urban-traffic jams: p < 0.01, Cohen’s d = 1.683; urban-highway: p < 0.01, Cohen’s d = 2.964; traffic jams-highway: p < 0.05, Cohen’s d = 0.823). The number of operations in urban (115.00 ± 15.90) and congested driving (122.91 ± 22.33) was higher than in highway driving (80.27 ± 10.76). Significant differences were found between urban and highway driving (p < 0.01, Cohen’s d = 2.557) and between congested and highway driving (p < 0.01, Cohen’s d = 2.432). The number of perceptual objects was highest in urban driving (150.91 ± 20.49), followed by highway driving (113.36 ± 6.19), and then congested driving (90.54 ± 13.72). Significant differences were found between all combinations (urban-traffic jams: p < 0.01, Cohen’s d = 3.461; urban-highway: p < 0.01, Cohen’s d = 2.480; traffic jams-highway: p < 0.01, Cohen’s d = 2.141). These results confirm the relationship between the number of operations and levels of perception mentioned in section 2.3, “Driving scenarios,” of the Methods section.
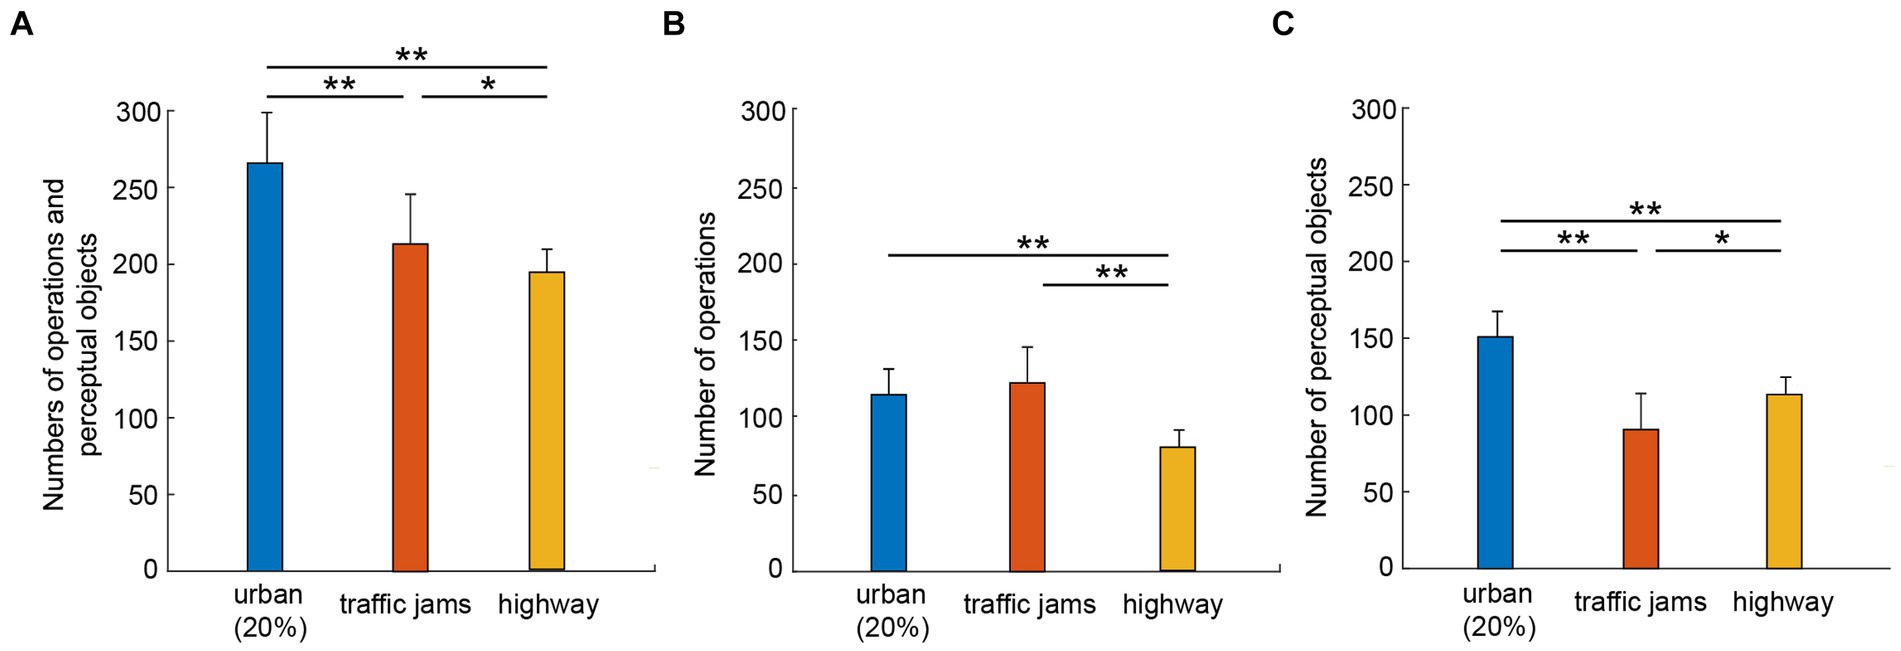
Figure 6. Numbers of vehicle operations and perceptions of traffic objects during driving in three different traffic conditions. * and ** Indicate statistical significance (p < 0.05 and p < 0.01, respectively), evaluated by Student’s t-test. (A–C) Represent the total number of operations and perceptions, number of operations, and number of perceptions, respectively. The error bar indicates one standard deviation.
Figure 7 shows scatter plots of the change in spectral response of theta and alpha bands compared with WWL, the change in spectral response of theta and alpha bands compared with the number of operations and perceptions, and WWL compared with the number of operations and perceptions, respectively. The Pearson’s correlation coefficients between the change in the spectral response of the theta and alpha bands and WWL were 0.94, 0.90, and 0.93 for urban, traffic jams, and highway driving, respectively. The correlation coefficients between theta and alpha band spectral response changes and the number of operations and cognitions were 0.88, 0.94, and 0.90 for urban, traffic jams, and highway driving, respectively. The correlation coefficients between WWL and the number of operations and perceptions in urban, traffic jams, and highway driving were 0.95, 0.96, and 0.95.
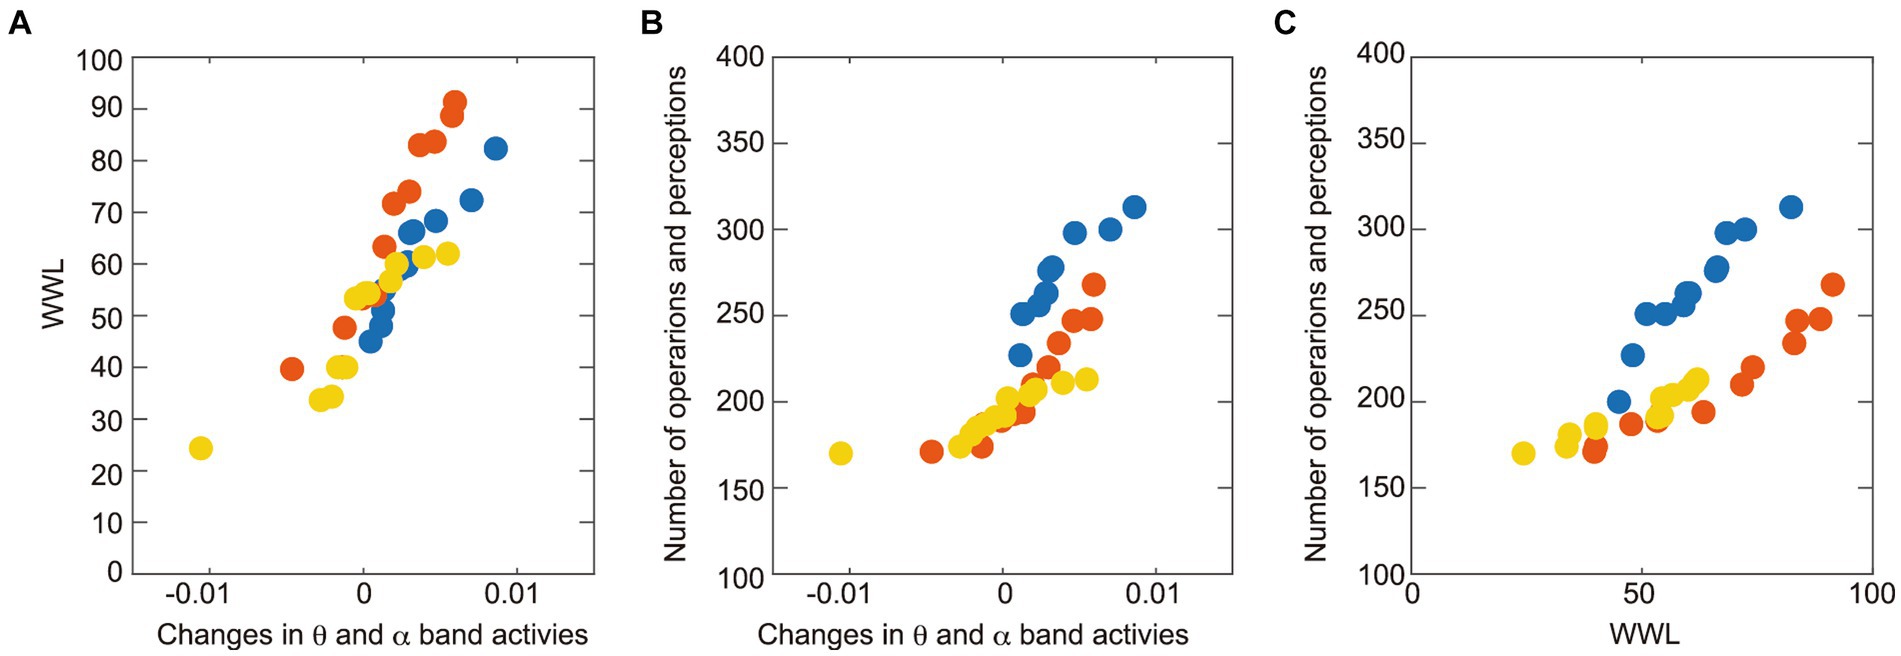
Figure 7. Scatter plot showing the relationship between (A) changes in theta- to alpha-band spectral response (initial versus final 2 min of driving) and WWL, (B) changes in theta- to alpha-band spectral responses (initial versus final 2 min of driving) and number of operations and perceptions, and (C) WWL and number of operations and perceptions. Blue, orange, and yellow-filled circles represent the three different traffic conditions urban driving with 20% traffic density, congested driving, and highway driving, respectively.
Figure 8 illustrates the level of fatigue determined by the fatigue questionnaire. The levels of fatigue reported by participants in urban, traffic-jam, and highway scenarios were 72.27 ± 10.52, 62.27 ± 29.79, and 46.81 ± 18.49, respectively. A statistical difference was found only between urban and highway driving (p < 0.01, Cohen’s d = 1.693). No significant difference was found between urban and congested driving (p = 0.18, Cohen’s d = 0.451) or between congested and highway driving (p = 0.12, Cohen’s d = 0.621).
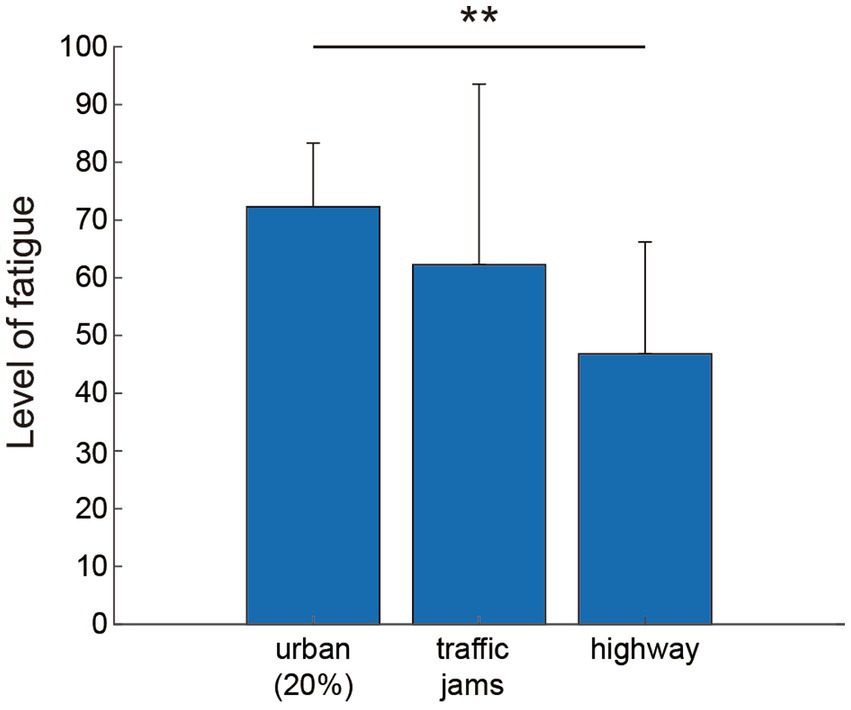
Figure 8. Levels of fatigue assessed using a questionnaire (Supplementary Figure S1) during driving in three different traffic conditions. **Indicates statistical significance (p < 0.01), evaluated by Student’s t-test. The error bar indicates one standard deviation.
In this study, we investigated the mental and physical workload induced by different driving environments using EEG. We simulated three distinct driving conditions with varying levels of perception and vehicle operational demands using a driving simulator. The results confirmed differences in theta- and alpha-band spectral responses as reported by Lal and Craig (14) and Awais et al. (37) across the three driving conditions. In particular, a fatigue-related increase was found in urban driving and in congested driving. Higher correlations were also confirmed among theta- and alpha-band spectral responses, subjective workload evaluations using NASA-TLX, and the number of operations and perceptions related to the amount of mental and physical workload. These findings imply that the amount of load related to driver perception and operation inherent in driving environments is an essential factor in inducing driver fatigue.
This study suggests a relationship between theta- and alpha-band spectral responses, as indicators of fatigue, and the induction of various perceptual and vehicle operating loads under different driving conditions. Here, we discuss the causal relationship between these spectral responses and the varying levels of perceptual and driving demands across different driving environments. Previous studies have indicated that mental fatigue results from the mental effort required for repeated perceptual evaluations and decision-making regarding driving situations (4, 18–20), whereas physical fatigue arises from the cumulative physical effort involved in actions such as using the pedals and steering (16, 17, 20). The occurrence of fatigue is closely related to both qualitative and quantitative task-related factors (54). In the present study, the cumulative loads of perceptual and vehicle driving demands (Figure 6, left) showed a similar trend to the changes in theta- and alpha-band spectral activity, with high correlations (Figure 4; i.e., urban>traffic jams>highway, Figure 7). However, this similarity was not observed when the numbers of operations and perceptual objects were considered individually (Figure 6; middle and right plots). Therefore, the quantitative factors of driver fatigue under different driving conditions can be explored by examining the perceptual and driving operation demands. Under the driving conditions simulated in this study, urban driving required both perception of the driving situation and driving operations, whereas driving in congested traffic mainly required driving operations. Conversely, driving on highways required a significant perceptual load. These results suggest that fatigue is more likely to occur in urban areas, where the perception and driving operation requirements are the highest. Furthermore, the main cause of fatigue in congested driving appears to be the physical stress associated with driving operations, whereas in highway driving, the main cause of fatigue seems to be the mental stress associated with cognitive activities.
Next, we explored the relationship between changes in theta- and alpha-band spectral responses across different traffic environments and subjective workload assessment using the NASA-TLX score. The WWL obtained from the NASA-TLX reflects fatigue based on task complexity and difficulty, with higher scores correlating with increased fatigue (54). Average WWL was highly correlated with the theta- and alpha-band spectral responses indicative of fatigue, as shown in Figure 4, and with the level of perception and operation (Figure 6, left). The findings in Figure 5 confirm that both MD and PD are high for urban driving, PD is pronounced for congested driving, and MD is elevated for highway driving. The cumulative load of these demands is presumed to reflect the complexity and difficulty of each driving environment. This was echoed in the theta- and alpha-band spectral responses. Further analysis of each NASA-TLX score for each driving condition revealed that both MD and PD were higher for driving in congested traffic. In urban driving, MD and PD remained elevated, albeit with PD slightly lower than in congested driving. Lastly, MD surpasses PD during highway driving. These findings suggest that both mental and physical workloads contribute to fatigue in urban driving, while mental load predominantly contributes to fatigue in highway driving. However, the MD and PD scores in congested driving were generally high, and the trends of rank differed from the spectral response and the numbers of operations and perceptual objects in the present study. According to the weights calculated for WWL determined by pairwise comparison (Supplementary Table S2), the FR component in NASA-TLX contributed more to WWL for traffic jams compared to MD and PD. Therefore, trends in WWL may differ from the spectral response and the number of operations and perceptual objects for traffic jams. As previously reported, driver stress in congested driving varies widely (46), and these differences, with less contribution from MD and PD compared to FR scores, may reflect the variability among drivers, as observed in our subjective NASA-TLX evaluations.
This study had limitations regarding the use of a simulator to replicate the driving visual environment and evaluate driver fatigue. Fatigue during driving in the different simulated driving conditions was psychologically evaluated. Traffic conditions such as pedestrians and other vehicles during driving were set in accordance with the actual driving environment, but some aspects differed from real vehicle driving conditions. The findings of these driving simulations regarding fatigue and its contributing factors are presumed to be generally applicable to real-world driving situations. However, in the future, the validity of these findings could be further substantiated by conducting evaluations during actual driving in real-world environments, following a defined protocol. Nonetheless, assessing fatigue during real driving poses certain challenges due to safety concerns, and it may increase the risk of collisions.
In this study, EEG was measured from seven electrode sites (Figure 1), but only the EEG signal measured from O2 was evaluated. The results confirmed differences in theta- and alpha-band spectral responses across the three driving conditions. However, to further understand the details of mental and physical workload-related brain activities in these different conditions, it is necessary to investigate the relationships between electrode sites through functional connectivity or coherence analysis with graph theory in the future.
Our findings were obtained from a limited sample size. The study also did not balance age and gender. Previous research has demonstrated that drivers’ personality traits and driving behaviors, such as perception and maneuvers, vary across ages (58–60) and differ between genders (61, 62). Although we believe that our findings are applicable to these conditions based on a certain level of significance and effect size, future studies would benefit from a more comprehensive evaluation, including a larger sample size that encompasses a broader range of age groups and genders.
The raw data supporting the conclusions of this article will be made available by the authors, without undue reservation.
The studies involving humans were approved by the Ethics Committee of the Ethics Committee of the Chubu University. The studies were conducted in accordance with the local legislation and institutional requirements. The participants provided their written informed consent to participate in this study. The animal study was approved by the Ethics Committee of the Ethics Committee of the Chubu University. The study was conducted in accordance with the local legislation and institutional requirements. Written informed consent was obtained from the individual(s) for the publication of any potentially identifiable images or data included in this article.
MA: Conceptualization, Formal analysis, Investigation, Methodology, Writing – original draft, Writing – review & editing. SN: Investigation, Writing – original draft, Writing – review & editing, Validation. KI: Conceptualization, Formal analysis, Funding acquisition, Investigation, Methodology, Project administration, Supervision, Validation, Writing – original draft, Writing – review & editing.
The author(s) declare that financial support was received for the research, authorship, and/or publication of this article. This work was supported by JSPS KAKENHI Grant-in-Aid for Scientific Research (C) JP 22K12138.
The authors declare that the research was conducted in the absence of any commercial or financial relationships that could be construed as a potential conflict of interest.
All claims expressed in this article are solely those of the authors and do not necessarily represent those of their affiliated organizations, or those of the publisher, the editors and the reviewers. Any product that may be evaluated in this article, or claim that may be made by its manufacturer, is not guaranteed or endorsed by the publisher.
The Supplementary material for this article can be found online at: https://www.frontiersin.org/articles/10.3389/fams.2024.1426253/full#supplementary-material
1. Vollrath, M, Meilinger, M, and Krüger, H. How the presence of passengers influences the risk of a collision with another vehicle. Accid Anal Prev. (2002) 34:649–54. doi: 10.1016/S0001-4575(01)00064-1
2. Sheykhfard, A, Haghighi, F, and Das, S. How does talking with passengers threatens pedestrian life? An analysis of drivers' performance based on real-world driving data. Transport Res F: Traffic Psychol Behav. (2023) 95:464–79. doi: 10.1016/j.trf.2023.05.010
3. Otmani, S, Pebayle, T, Roge, J, and Muzet, A. Effect of driving duration and partial sleep deprivation on subsequent alertness and performance of car drivers. Physiol Behav. (2005) 84:715–24. doi: 10.1016/j.physbeh.2005.02.021
4. May, JF, and Baldwin, CL. Driver fatigue: the importance of identifying causal factors of fatigue when considering detection and countermeasure technologies. Transport Res F: Traffic Psychol Behav. (2009) 12:218–24. doi: 10.1016/j.trf.2008.11.005
5. Sprajcer, M, Dawson, D, Kosmadopoulos, A, Sach, EJ, Crowther, ME, Sargent, C, et al. How tired is too tired to drive? A systematic review assessing the use of prior sleep duration to detect driving impairment. Nat Sci Sleep. (2023) 15:175–206. doi: 10.2147/NSS.S392441
6. Schmidt, EA, Schrauf, M, Simon, M, Fritzsche, M, Buchner, A, and Kincses, WE. Drivers' misjudgement of vigilance state during prolonged monotonous daytime driving. Accid Anal Prev. (2009) 41:1087–93. doi: 10.1016/j.aap.2009.06.007
7. Larue, GA, Rakotonirainy, A, and Pettitt, AN. Driving performance impairments due to hypovigilance on monotonous roads. Accid Anal Prev. (2011) 43:2037–46. doi: 10.1016/j.aap.2011.05.023
8. Zhang, Y, Ma, J, Zhang, C, and Chang, R. Electrophysiological frequency domain analysis of driver passive fatigue under automated driving conditions. Sci Rep. (2021) 11:20348. doi: 10.1038/s41598-021-99680-4
9. Ma, J, Gu, J, Jia, H, Yao, Z, and Chang, R. The relationship between drivers’ cognitive fatigue and speed variability during monotonous daytime driving. Front Psychol. (2018) 9:459. doi: 10.3389/fpsyg.2018.00459
10. Fan, C, Peng, Y, Peng, S, Zhang, H, Wu, Y, and Kwong, S. Detection of train driver fatigue and distraction based on forehead EEG: a time-series ensemble learning method. IEEE Trans Intell Transp Syst. (2022) 23:13559–69. doi: 10.1109/TITS.2021.3125737
11. Fan, C, Huang, S, Lin, S, Xu, D, Peng, Y, and Yi, S. Types, risk factors, consequences, and detection methods of train driver fatigue and distraction. Comput Intell Neurosci. (2022) 2022:1–10. doi: 10.1155/2022/8328077
12. Hu, X, and Lodewijks, G. Detecting fatigue in car drivers and aircraft pilots by using non-invasive measures: the value of differentiation of sleepiness and mental fatigue. J Saf Res. (2020) 72:173–87. doi: 10.1016/j.jsr.2019.12.015
13. Hamann, A, and Carstengerdes, N. Assessing the development of mental fatigue during simulated flights with concurrent EEG-fNIRS measurement. Sci Rep. (2023) 13:4738. doi: 10.1038/s41598-023-31264-w
14. Lal, SKL, and Craig, A. A critical review of the psychophysiology of driver fatigue. Biol Psychol. (2001) 55:173–94. doi: 10.1016/S0301-0511(00)00085-5
15. Zeng, C, Mu, Z, and Wang, Q. Classifying driving fatigue by using EEG signals. Comput Intell Neurosci. (2022) 2022:1–13. doi: 10.1155/2022/1885677
16. Sabir, AA, and Isha, ASNB. Assessing the fatigue related psychological risk factors among oil and gas tankers drivers in Malaysia. Int Rev Manag Mark. (2016) 6:138–42.
17. Ospina-Mateus, H, and Jiménez, LAQ. Understanding the impact of physical fatigue and postural comfort experienced during motorcycling: a systematic review. J Transp Health. (2019) 12:290–318. doi: 10.1016/j.jth.2019.02.003
19. Gastaldi, M, Rossi, R, and Gecchele, G. Effects of driver task-related fatigue on driving performance. Procedia Soc Behav Sci. (2014) 111:955–64. doi: 10.1016/j.sbspro.2014.01.130
20. Ahn, S, Nguyen, T, Jang, H, Kim, JG, and Jun, SC. Exploring neuro-physiological correlates of drivers' mental fatigue caused by sleep deprivation using simultaneous EEG, ECG, and fNIRS data. Front Hum Neurosci. (2016) 10:219. doi: 10.3389/fnhum.2016.00219
21. Yang, JH, Mao, S, Tijerina, L, Pilutti, T, Coughlin, JF, and Feron, E. Detection of driver fatigue caused by sleep deprivation. IEEE Trans Syst Man Cybern A. (2009) 39:694–705. doi: 10.1109/TSMCA.2009.2018634
22. Xu, J, Min, L, and Hu, L. Real-time eye tracking for the assessment of diver fatigue. Healthc Technol Lett. (2018) 5:54–8. doi: 10.1049/htl.2017.0020
23. Di Stasi, L, Renner, R, Catena, A, Andres, C, Cañas, JJ, Velichkovsky, BM, et al. Towards a driver fatigue test based on the saccadic main sequence: a partial validation by subjective report data. Transp Res C. (2012) 21:123–33. doi: 10.1016/j.trc.2011.07.002
24. Kurosawa, Y, Mochiduki, S, Hoshino, Y, and Yamada, M. Measurement of fatigue based on changes in eye movement during gaze. IEICE Trans Inf Syst. (2020) 5:1203–7. doi: 10.1587/transinf.2019EDL8162
25. Lyapunov, SI, Shoshina, II, and Lyapunov, IS. Tremor eye movements as an objective marker of Driver’s fatigue. Hum Physiol. (2022) 48:71–7. doi: 10.1134/S0362119722010091
26. Tianjun, Z, Zhang, C, Wu, T, Ouyang, Z, Li, H, Na, X, et al. Research on a real-time driver fatigue detection algorithm based on facial video sequences. Appl Sci. (2022) 12:2224. doi: 10.3390/app12042224
27. Li, D, Zhang, X, Liu, X, Ma, Z, and Zhang, B. Driver fatigue detection based on comprehensive facial features and gated recurrent unit. J Real-Time Image Proc. (2023) 20:19. doi: 10.1007/s11554-023-01260-4
28. Lal, SKL, and Craig, A. Driver fatigue: psychophysiological effects. The Fourth International Conference on Fatigue and Transportation, (2000) Australia.
29. Zuraida, R, Iridiastadi, H, Sutalaksana, IZ, and Suprijanto, S. An analysis of EEG changes during prolonged simulated driving for the assessment of driver fatigue. J Eng Technol Sci. (2019) 51:290–302. doi: 10.5614/j.eng.technol.sci.2019.51.2.9
30. Li, W, He, Q, Fan, X, and Fei, Z. Evaluation of driver fatigue on two channels of EEG data. Neurosci Lett. (2012) 506:235–9. doi: 10.1016/j.neulet.2011.11.014
31. Wang, H, Dragomir, A, Abbasi, NI, Li, J, Thakor, NV, and Bezerianos, A. A novel real-time driving fatigue detection system based on wireless dry EEG. Cogn Neurodyn. (2018) 12:365–76. doi: 10.1007/s11571-018-9481-5
32. Tian, Y, and Cao, J. Fatigue driving detection based on electrooculography: a review. EURASIP J Image Video Process. (2021) 2021:33. doi: 10.1186/s13640-021-00575-1
33. Chen, J, Wang, H, Wang, Q, and Hua, C. Exploring the fatigue affecting electroencephalography based functional brain networks during real driving in young males. Neuropsychologia. (2019) 129:200–11. doi: 10.1016/j.neuropsychologia.2019.04.004
34. Li, G, Wang, J, Xu, W, Wu, K, Liu, Y, Bezerianos, A, et al. Self-regulation phenomenon emerged during prolonged fatigue driving: an EEG connectivity study. IEEE Trans Neural Syst Rehabil Eng. (2023) 31:4895–906. doi: 10.1109/TNSRE.2023.3339768
35. Wang, H, Liu, X, Hu, H, Wan, F, Li, T, Gao, L, et al. Dynamic reorganization of functional connectivity unmasks fatigue related performance declines in simulated driving. IEEE Trans Neural Syst Rehabil Eng. (2020) 28:1790–9. doi: 10.1109/TNSRE.2020.2999599
36. Lal, SKL, and Craig, A. Driver fatigue: electroencephalography and psychological assessment. Psychophysiology. (2002) 39:313–21. doi: 10.1017/S0048577201393095
37. Awais, M, Badruddin, N, and Drieberg, M. Driver drowsiness detection using EEG power spectrum analysis. 2014 IEEE REGION 10 SYMPOSIUM, (2014), 244–247.
38. Simon, M, Schmidt, EA, Kincses, WE, Fritzsche, M, Bruns, A, Aufmuth, C, et al. EEG alpha spindle measures as indicators of driver fatigue under real traffic conditions. Clin Neurophysiol. (2011) 122:1168–78. doi: 10.1016/j.clinph.2010.10.044
39. Xiaoli, X, Jiangbi, H, Xiaoming, L, Pingsheng, L, and Shuyun, W. The EEG changes during night-time driver fatigue. 2009 IEEE Intelligent Vehicles Symposium, (2009), 935–939.
40. Borghini, G., Vecchiato, G, Toppi, J, Astolfi, L, Maglione, A, Isabella, R, et al., “Assessment of mental fatigue during car driving by using high resolution EEG activity and neurophysiologic indices,” 2012 Annual International Conference of the IEEE Engineering in Medicine and Biology Society, San Diego, CA, USA, (2012), pp. 6442–6445.
41. Gharagozlou, F, Nasl Saraji, G, Mazloumi, A, Nahvi, A, Motie Nasrabadi, A, Rahimi Foroushani, A, et al. Detecting driver mental fatigue based on EEG alpha power changes during simulated driving. Iran J Public Health. (2015) 44:1693–700.
42. Tran, Y, Craig, A, Craig, R, Chai, R, and Nguyen, H. The influence of mental fatigue on brain activity: evidence from a systematic review with meta-analyses. Psychophysiology. (2020) 57:e13554. doi: 10.1111/psyp.13554
43. Antoun, M, Ding, D, Bohn-Goldbaum, EE, Michael, S, and Edwards, KM. Driving in an urban environment, the stress response and effects of exercise. Ergonomics. (2018) 61:1–9. doi: 10.1080/00140139.2018.1468494
44. Rigas, G, Goletsis, Y, Bougia, P, and Fotiadis, DI. Towards driver’s state recognition on real driving conditions. Int J Veh Technol. (2011) 2011:1–14. doi: 10.1155/2011/617210
45. Matthews, G, Tsuda, A, Xin, G, and Ozeki, Y. Individual differences in driver stress vulnerability in a Japanese sample. Ergonomics. (1999) 42:401–15.
46. Hennessy, DA, and Wiesenthal, DL. The relationship between traffic congestion, driver stress and direct versus indirect coping behaviours. Ergonomics. (1997) 40:348–61. doi: 10.1080/001401397188198
47. Hart, SG, and Staveland, LE. Development of NASA-TLX (task load index) results of empirical and theoretical research. In: PA Hancock and N Meshkati, editors. Human mental workload. North-Holland: (1988). 139–83.
48. Åkerstedt, T. Gillberg M subjective and objective sleepiness in the active individual. Int J Neurosci. (1990) 52:29–37. doi: 10.3109/00207459008994241
49. Ball, K, Beard, B, Roenker, D, Miller, R, and Griggs, D. Age and visual search: expanding the useful field of view. J Opt Soc Am A. (1988) 5:2210–9.
50. Edwards, JD, Vance, DE, Wadley, VG, Cissell, GM, Roenker, DL, and Ball, KK. Reliability and validity of useful field of view test scores as administered by personal computer. J Clin Exp Neuropsychol. (2005) 5:529–43. doi: 10.1080/13803390490515432
51. Saxby, DJ, Matthews, G, Hitchcock, EM, Warm, JS, Funke, GJ, and Gantzer, T. Effect of active and passive fatigue on performance using a driving simulator. Proc Hum Factors Ergon Soc Annu Meet. (2008) 52:1751–5. doi: 10.1177/154193120805202113
52. Saxby, DJ, Matthews, G, and Neubauer, C. The relationship between cell phone use and management of driver fatigue: It’s complicated. J Saf Res. (2017) 61:129–40. doi: 10.1016/j.jsr.2017.02.016
53. Jasper, H. The ten twenty electrode system of the international federation. Electroencephalogr Clin Neurophysiol. (1958) 10:367–75. doi: 10.1016/0013-4694(58)90051-8
54. Alhaag, MH, Ramadan, MZ, Al-harkan, IM, Alessa, FM, Alkhalefah, H, Haider, M, et al. Determining the fatigue associated with different task complexity during maintenance operations in males using electromyography features. Int J Ind Ergon. (2022) 88:103273. doi: 10.1016/j.ergon.2022.103273
55. Cohen, J. Statistical power analysis for the behavior science. 2nd ed. Hillsdale, NJ: Lawrence Erlbaum Associates (1988).
56. Kanda, Y. Investigation of the freely-available easy-to-use software "EZR" (easy R) for medical statistics. Bone Marrow Transplant. (2013) 48:452–8. doi: 10.1038/bmt.2012.244
57. Faul, F, Erdfelder, E, Lang, AG, and Buchner, A. G*power 3: a flexible statistical power analysis program for the social, behavioral, and biomedical sciences. Behav Res Methods. (2007) 39:175–91. doi: 10.3758/BF03193146
58. Arafa, A, Saleh, LH, and Senosy, SA. Age-related differences in driving behaviors among non-professional drivers in Egypt. PLoS One. (2020) 15:e0238516. doi: 10.1371/journal.pone.0238516
59. Huo, F, Gao, R, Sun, C, and Hou, G. Age differences in hazard perception of drivers: the Rolesof emotion. Front Psychol. (2022) 13:867673. doi: 10.3389/fpsyg.2022.867673
60. Zhang, H, Ni, D, Ding, N, Sun, Y, Zhang, Q, and Li, X. Structural analysis of driver fatigue behavior: a systematic review. Transp Res Interdiscip Perspect. (2023) 21:100865. doi: 10.1016/j.trip.2023.100865
61. Yang, Y, Wong, A, and McDonald, M. Does gender make a difference to performing in-vehicle tasks? IET Intell Transp Syst. (2015) 9:359–65. doi: 10.1049/iet-its.2013.0117
62. Fountas, G, Pantangi, SS, Hulme, KF, and Anastasopoulos, P. The effects of driver fatigue, gender, and distracted driving on perceived and observed aggressive driving behavior: a correlated grouped random parameters bivariate probit approach. Anal Methods Accid Res. (2019) 22:100091–365. doi: 10.1016/j.amar.2019.100091
Keywords: mental stress, physical stress, driving operation, cognition, EEG, spectral response
Citation: Adachi M, Nobukawa S and Inagaki K (2024) Assessment of driver fatigue-related brain responses and causal factors during driving under different traffic conditions. Front. Appl. Math. Stat. 10:1426253. doi: 10.3389/fams.2024.1426253
Edited by:
Christian Uhl, Ansbach University of Applied Sciences, GermanyReviewed by:
Thomas Wahl, Inria Nancy – Grand-Est Research Center, FranceCopyright © 2024 Adachi, Nobukawa and Inagaki. This is an open-access article distributed under the terms of the Creative Commons Attribution License (CC BY). The use, distribution or reproduction in other forums is permitted, provided the original author(s) and the copyright owner(s) are credited and that the original publication in this journal is cited, in accordance with accepted academic practice. No use, distribution or reproduction is permitted which does not comply with these terms.
*Correspondence: Keiichiro Inagaki, a2F5QGlzYy5jaHVidS5hYy5qcA==
Disclaimer: All claims expressed in this article are solely those of the authors and do not necessarily represent those of their affiliated organizations, or those of the publisher, the editors and the reviewers. Any product that may be evaluated in this article or claim that may be made by its manufacturer is not guaranteed or endorsed by the publisher.
Research integrity at Frontiers
Learn more about the work of our research integrity team to safeguard the quality of each article we publish.