 José Américo Nabuco Leva Ferreira Freitas
 Oliver Bischof
- IMRB, Mondor Institute for Biomedical Research, INSERM U955 – Université Paris Est Créteil, UPEC, Faculté de Médecine de Créteil, Créteil, France
The aging process is a complex and multifaceted phenomenon affecting all living organisms. It involves a gradual deterioration of tissue and cellular function, leading to a higher risk of developing various age-related diseases (ARDs), including cancer, neurodegenerative, and cardiovascular diseases. The gene regulatory networks (GRNs) and their respective niches are crucial in determining the aging rate. Unveiling these GRNs holds promise for developing novel therapies and diagnostic tools to enhance healthspan and longevity. This review examines GRN modeling approaches in aging, encompassing differential equations, Boolean/fuzzy logic decision trees, Bayesian networks, mutual information, and regression clustering. These approaches provide nuanced insights into the intricate gene-protein interactions in aging, unveiling potential therapeutic targets and ARD biomarkers. Nevertheless, outstanding challenges persist, demanding more comprehensive datasets and advanced algorithms to comprehend and predict GRN behavior accurately. Despite these hurdles, identifying GRNs associated with aging bears immense potential and is poised to transform our comprehension of human health and aging. This review aspires to stimulate further research in aging, fostering the innovation of computational approaches for promoting healthspan and longevity.
1 Introduction
Aging is a natural process that leads to a gradual decline in an individual’s physiological function and reserve, diminishing their ability to survive and reproduce as they age. Its universal occurrence is a significant risk factor for developing several chronic diseases like cancer and cardiovascular or neurodegenerative diseases, ultimately leading to death bearing considerable individual and societal consequences and representing a growing global socio-economic burden. Consequently, substantial resources are dedicated to enhancing health span, focusing on the years an individual lives without chronic and debilitating diseases, in contrast to lifespan, which measures the total years from birth to death (1, 2).
The quest to understand aging and identify molecular and cellular mechanisms promoting health span traces back to the pioneering work of Benjamin Gompertz (3). Throughout history, reductionist science played a pivotal role in unraveling aging mechanisms, life span control, and age-related diseases. Notably, using Caenorhabditis elegans as a model organism, single-gene perturbation approaches yielded pivotal insights in aging research. The insulin-like signaling (ILS) pathway and germline signals, two major pathways, regulate lifespan across worms, flies, and mammals, with the transcription factor DAF-16/FOXO linking both. However, hundreds of other genes also contribute to longevity, complexifying the aging process (4–11).
López-Otín et al. (12, 13) condensed the intricate aging process and its underlying mechanisms into twelve hallmarks, offering a comprehensive framework to capture the essence of aging and comprehend its complexity. These interconnected hallmarks, including genomic instability, telomere attrition, epigenetic alterations, loss of proteostasis, disabled macroautophagy, deregulated nutrient-sensing, mitochondrial dysfunction, cellular senescence, stem cell exhaustion, altered intercellular communication, chronic inflammation, and dysbiosis, contribute to the aging process, each representing a complex and multifaceted process influenced by various factors. Understanding these hallmarks is pivotal for developing interventions that delay aging and mitigate age-related diseases.
The complex nature of aging necessitates using in silico systems approaches that can offer a comprehensive framework to understand the fundamental principles governing gene regulatory interactions in aging organisms and predict aging genes. Various methods, such as Boolean networks, regression methods, correlation networks, functional networks, mutual information, ordinary and partial differential equation models, and neural networks, have been developed for depicting gene regulatory networks (GRNs), each tailored to specific input data and scientific questions.
Biological clocks, primarily utilizing epigenetic markers, accurately estimate biological age, providing more precise mortality risk estimation than chronological age. Contemporary techniques increasingly consider dynamic, nonlinear molecular interactions and leverage comprehensive published datasets. GRNs can benefit significantly from approaches involving higher orders of gene regulation, considering temporal changes in each molecular regulatory layer when integrating multi-OMICS datasets. Examples of these approaches, including studies by Schwanhäusser et al. (14), La Manno et al. (15), Hoffmann et al. (16), and Badia-i-Mompel et al. (17) have made substantial contributions to the study of gene regulatory networks, providing valuable insights into the molecular mechanisms underlying gene regulation.
2 Mathematical models describing aging
The modeling of aging and age-related processes spans a wide array of methodologies applicable across various scales, from organismal to molecular levels (2, 8, 18–20). At the organismal scale, methodologies hinge on the foundational principles of molecular biology to deduce macroscopic properties. Conversely, molecular scale approaches operate on a data-driven basis, utilizing paradigms like Boolean logic, regression methods, information theory, neural networks, ordinary differential equations (ODEs), and partial differential equations (PDEs). It is crucial to emphasize that selecting an appropriate approach relies on the specific requirements of the study and the availability of resources. Therefore, a comprehensive understanding of the underlying principles becomes imperative when choosing and implementing these methodologies.
2.1 Macroscopic scale models
Santiago et al. (2) offer an extensive review elucidating how asymmetry in cellular division shapes replicative aging in yeast, fostering a population with heightened robustness to fitness challenges. Complementing this, Kogan et al. (21) introduce a mathematical model grounded in the topological properties of the genomic network within an individual, considering factors like network size (number of genes) and connectivity (average number of target genes per protein). Aligned with the Gompertz law, which posits an exponential increase in mortality with age across multiple species, this model implies that interventions targeting network stability prove more efficacious in extending lifespan than those aimed at reducing molecular stresses. This insight might explain the presence of long-lived organisms boasting extended health spans compared to closely related species.
From another perspective, Galvis et al. (22) developed a model to explore the replicative exhaustion of fibroblasts intricately linked to cellular senescence. This model gauges cellular age/senescence based on the number of DNA replication cycles each cell undergoes. Throughout simulations, cells face growth arrest or apoptosis, becoming senescent after reaching 50 population doublings. Optimizing model parameters with experimental data, Galvis et al. capture the temporal activity of five senescence biomarkers (senescence-associated β-galactosidase, Ki-67 decrease, γH2AX, TUNEL, and population doublings). This underscores that population dynamics can be approximated using a relatively simple set of rules, shedding light on the mechanisms underpinning the cellular aging process.
2.2 Boolean models
Boolean networks serve as a structural framework for describing GRNs, where each gene is a node with active or inactive states, and edges represent causal relationships. A gene’s state hinges on its regulators, combined through Boolean functions incorporating OR, AND, or NOT operators. Figures 1A,B depict a Boolean network example and its associated equation, representing an architecture known as latch. The target gene T is regulated by a regulator R through an interaction modulated by gene M activity. A transcriptomic trajectory resulting from this GRN configuration is shown in Figure 1C.
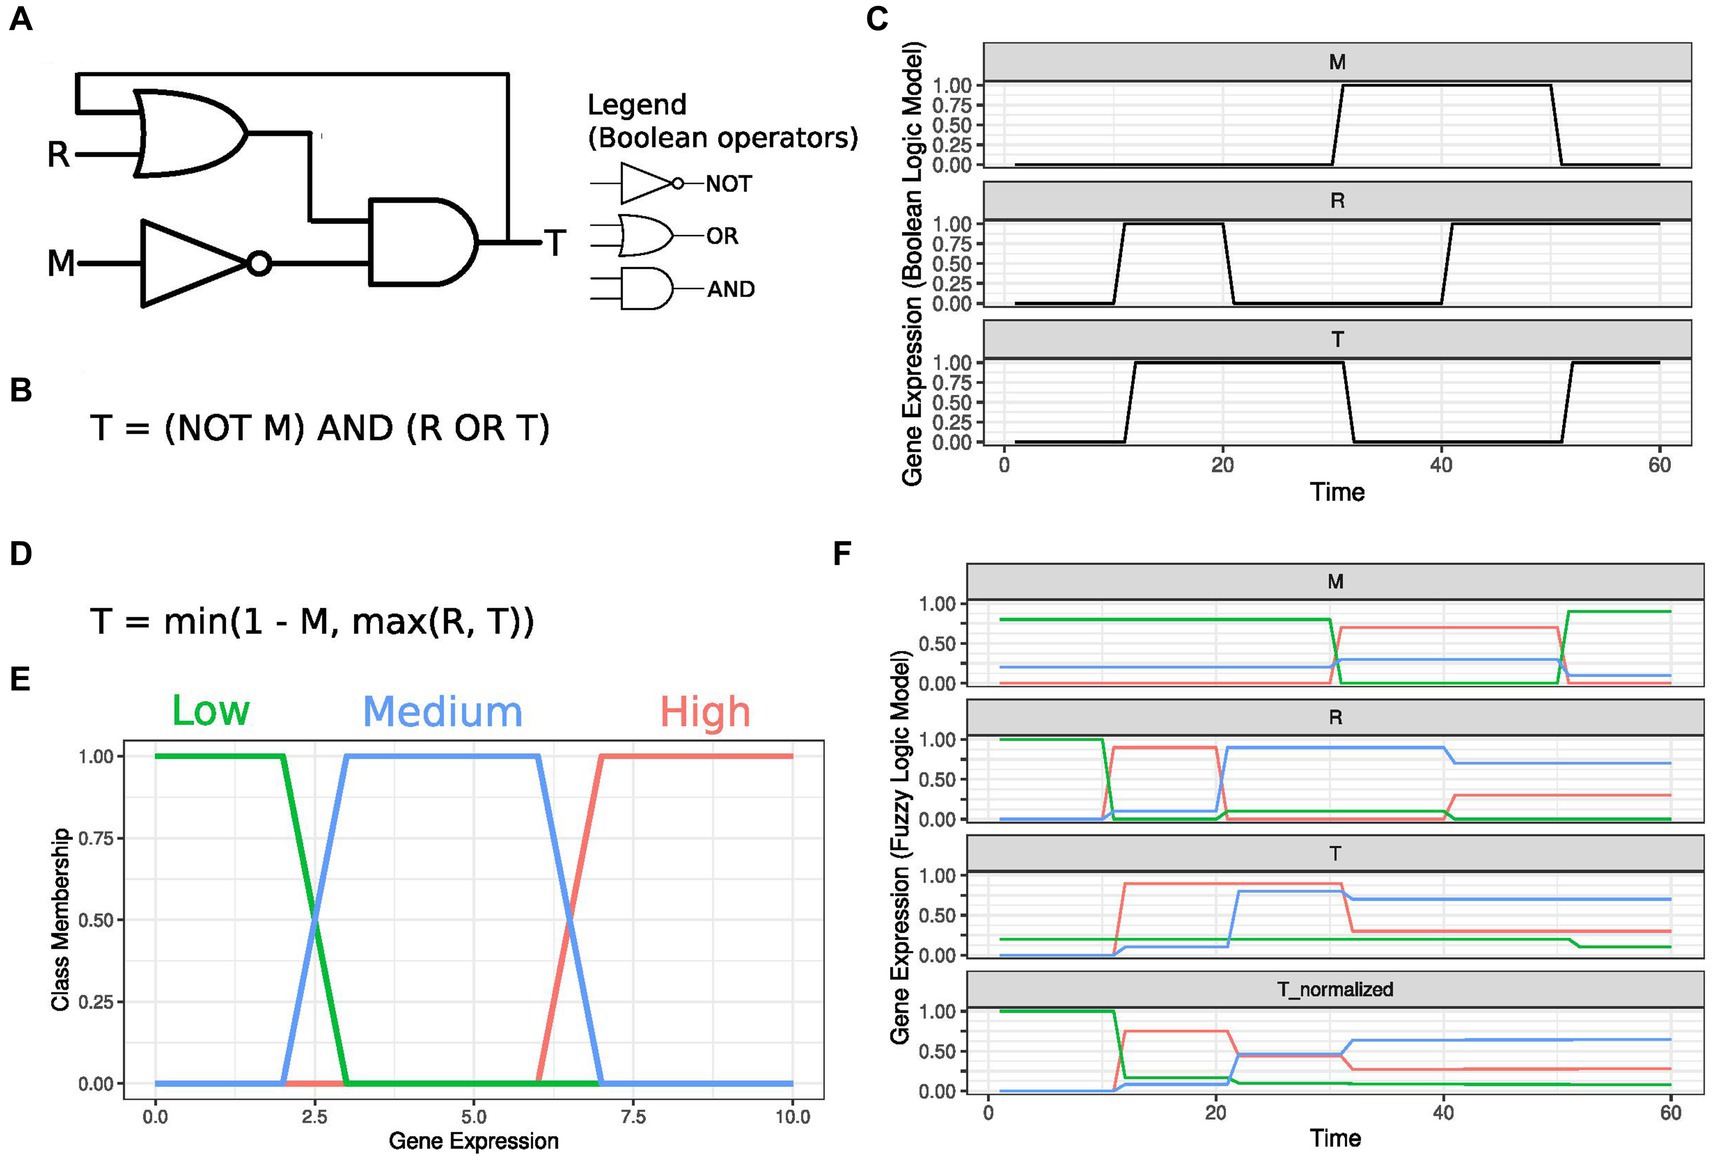
Figure 1. Boolean and fuzzy logic gene regulatory networks. (A) A Boolean gene regulatory network depicting a target gene T, activated by a regulator R. This interaction is controlled by the inhibitory modulator M. Standard symbols used to represent Boolean operators are shown. (B) Boolean logic equation representing the diagram depicted in (A). T levels in the equation’s right-hand side characterize a feedback loop, which, in this example, implements a memory effect in the network. (C) Time course T expression as a function of the inputs M and R. The inhibitory Modulator is initially inactivated, and R activation leads to T expression. Due to the feedback loop, T keeps high expression levels even after R is inactivated. Target T expression is reset to low values with the expression of the inhibitory modulator M. If M is expressed, activating R does not influence T levels. As soon as M is deactivated, T responds to R levels. (D) Equation describing T regulation using Fuzzy logic operators equivalent to those represented in panels (A,B). (E) Membership function mapping gene expression to three distinct, overlapping classes. (F) Time course T expression as a function of M and R levels under a fuzzy logic framework. The fuzzy logic operators are applied to each track independently, and T class membership values are normalized at each instant to ensure they sum to 1. M is initially set to 80% Low and 20% Medium in this example. As the regulator changes from 100% Low to 10% Medium +90% High, T unnormalized levels rise to 10% Medium +90% High. T still presents a 20% Low membership level due to M’s Low membership levels. As R levels transition at Time 20 from 10% Medium +90% High to 10% Low +90% Medium, T unnormalized levels for the Medium class rise, and unnormalized High levels are kept analogously to the Boolean logic case. When M is activated to 30% Medium +70% High, T unnormalized membership levels decrease to 70% Medium +30% High, with the membership class tending to Low. Slightly increasing R High membership at Time 40 does not affect T levels. Inactivating M by increasing its Low membership to 100% leads to a decrease in T Low membership.
Choo et al. (23) leveraged a Boolean network model to pinpoint the minimal set of genes in the MAPK pathway that can cease cancer cell proliferation. Schwab et al. (24, 25) evaluated the stability of aging signaling pathways using a Boolean network approach, assessing perturbations through mean normalized Hamming distances and reconstructing Boolean network ensembles from single-cell data, offering insights into the dynamics of aging in human hematopoietic stem cells. With the assumption that cells from the same patient are in equilibrium, i.e., that one cell can assume the transcriptional state exhibited by another in the same sample, they built pseudo-time trajectories for each patient. These trajectories were used to infer the regulators for each gene using Boolean functions. Since more than one function can lead to the same pseudo-time trajectory, they built a set of 1,000 networks per patient with distinct combinations of possible regulatory functions for each gene. They assessed the network’s stability by changing a gene’s state for each network and quantifying how many genes display a distinct Boolean state in the next time point compared to the unperturbed dynamic. Overall, the networks generated from hematopoietic stem cell data from young patients displayed a smaller discrepancy between perturbed and unperturbed dynamics than those generated from aged individuals.
Fuzzy logic extends Boolean networks by introducing more than two categories, like ‘low,’ ‘medium,’ and ‘high’ (26, 27). Gene expression levels map to these states through a ‘membership function’ and regulatory interactions, executed by fuzzy logic operators (OR, AND, or NOT), output states with intermediary values for each category. The equation represented in Figure 1D demonstrates a Fuzzy logic extension for the Boolean operators shown in Figure 1A. By defining the membership for functions as portrayed in Figure 1E, we still observe how gene M influences target T dynamics, given the regulator R levels in Figure 1F. The obtained values are converted to one definite state using the inverse of the membership function to evaluate predictions. Aldridge et al. (28) manually constructed a fuzzy network to model colon cancer response to membrane receptors, yielding less deviation from validation data than a discrete model with equivalent links. Poblete et al. (29) employed a neural network to optimize parameters for a model with fuzzy membership functions describing gene regulation. Fuzzy networks offer enhanced flexibility and realism in modeling GRNs compared to Boolean networks.
In summary, Boolean and fuzzy networks prove potent for modeling GRNs, identifying gene sets to impede aging and ARDs, and deciphering intricate regulatory interactions. However, their suitability is limited to reduced-sized networks, and addressing the exponential growth of states with increasing nodes is essential. Moreover, designing specific solutions for categorizing continuous molecule concentrations into discrete bins is crucial for each application.
2.3 Regression-based models
Regression analysis seeks optimal parameters to replicate a response using one or more independent variables (30). This method aims to find a set of coefficients that minimize the difference between predicted and actual dependent variable values.
While regression analysis does not reveal underlying gene regulation mechanisms, it predicts gene behavior based on other gene expressions or phenotypic quantities like age or weight. For instance, Hackett et al. (31) employed nonlinear regression to construct a yeast GRN by analyzing transcriptome responses to over 200 transcription factor (TF) activations. Machine learning algorithms identified regulatory interactions, unveiling new pathways and understanding their impact on gene expression patterns. Similarly, Li et al. (32) developed a hybrid model integrating data from young and old individuals’ blood cells, using regression methods to identify factors contributing to changes in gene expression during aging.
Regression methods offer broad possibilities for analyzing quantities derived from measured data. Zhang et al. (33) used linear regression to pinpoint age-related differentially expressed genes in 23 mouse tissues, defining global aging genes (GAGs). They determined GAG expression increases with age for each identified cell type, shedding light on genes and pathways in aging-related diseases.
Jordan and Miska (34) analyzed C. elegans growth curves in a distinctive approach, constructing a two-dimensional nonlinear model with inferred parameters for each curve. This separated the dependency of each parameter on experimental variables (genotype and diet), highlighting at least two independent modulators regulating observed traits. This approach identified genetic factors in observed traits and revealed how environmental factors regulate them.
2.3.1 Biological clocks
The use of regression models in aging research to predict biological age, also called aging clocks, is a rapidly evolving field of study (35). Hannum et al. (36) pioneered using DNA methylation levels in blood cells to accurately predict chronological age, highlighting the difference between expected and actual age as an indicator of molecular damage. Advancing this, Horvath (37) introduced a multi-tissue aging clock, proving valuable in primate studies. More recently, Levine et al. (38) proposed a technique to forecast mortality risk using DNA methylation levels in blood cells. Unlike traditional age-based training, this method incorporates phenotypic parameters like liver and kidney metabolite concentration and white blood cell count measures into a regression model. In a further development, Belsky et al. (39) introduced DunedinPACE (for Pace of Aging Calculated from the Epigenome), a next-generation DNA-methylation biomarker estimating the pace of aging.
Together, these approaches provide a more comprehensive evaluation of biological age and mortality risk, offering the potential for more effective interventions and treatments in ARDs.
2.3.2 Multi-OMICS regression models
Partial Least Squares Regression (PLS) extends the linear regression model to handle multiple response variables, making it apt for analyzing multi-OMICS datasets (40, 41). This method iteratively identifies components with the highest variance in each dataset, conducting a linear regression to predict molecule levels from the dataset considered a response variable. For instance, Rohart et al. (41) utilized PLS to integrate mRNA, microRNA, and proteomics datasets from breast cancer samples, revealing markers distinguishing between different cancer subtypes. In another application, Thévenot et al. (42) explored changes in the urine metabolome associated with aging, identifying 52 age-correlated metabolites, including increased carbohydrates and decreased acylcarnitines and nucleosides.
The Multi-Omics Factor Analysis (MOFA) framework integrates multi-OMICS datasets by pinpointing patterns in distinct molecular assays conducted on the same samples (43, 44). These patterns, represented as latent factors, are linearly mapped to each assay. The framework extends to sparse datasets from single-cell assays [MOFA+; (45)].
While regression-based methods are generally effective, they necessitate a sample size larger than the number of terms in the regression for a unique solution. In genomics studies, overcoming this challenge often involves assuming a sparse solution (37) or representing it in terms of latent variables, grouping genes with similar profiles (41).
2.4 Correlation networks
Correlation networks (CNs) play a pivotal role in OMICS studies, visually presenting pairwise correlations among molecular species. These networks, constructed from single-OMICS or multi-OMICS datasets, can be combined with graph theory metrics to highlight influential nodes (18, 30, 46). In single-OMICS datasets, CNs reveal molecules sharing similar profiles, aiding in the selection of candidates for signaling pathways enrichment (30, 41, 42, 47–50). Our studies, exploring cells undergoing cellular senescence (CS) through metabolic, transcriptomic, and DNA accessibility datasets, employed CNs to profile molecular relationships (51–53).
In a study of cardiac failure due to high blood pressure, Froese et al. (48) utilized CNs to analyze gene expression modules in cardiomyocytes, cardiac endothelial cells, and cardiac fibroblasts, which were used to identify transcription factor binding sequences enriched in co-expression modules. This provided novel regulatory molecules for hypertension therapies. TF motif binding, crucial from a systemic perspective, determines the dimensionality of the epigenetic landscape representing the phenotype (34). In single-cell datasets, gene clustering aids in identifying cells with similar expression and associated gene markers. When applied to datasets collected from individuals with distinct ages, this procedure highlights physiological age-associated changes that lead to an increase in disease incidence (54–56).
Multi-OMICS CNs follow a similar construction, depicting molecules with similar accumulation profiles, even across different biochemical properties. Yu et al. (57) identified highly correlated gene-protein pairs in cerebral endothelial cells, revealing their significance in an Alzheimer’s disease model. Klaus et al. (58) explored liver responses to a high-fat diet at metabolic and transcriptomic layers, unveiling metabolite-gene relationships with implications for Type 2 Diabetes.
In our studies on lung fibroblasts undergoing CS, we computed Spearman correlations between metabolomic and transcriptomic datasets under various stress sources, revealing central nodes like Glycerol Kinase (GK) (53). Malod-Dognin et al. (49) integrated multiple cancer samples, highlighting genes impacting in vitro cancer growth and stratifying patient data for distinct survival predictions.
Non-negative matrix factorization (NMF) also identifies latent factors associated with differentially accumulated molecules, considering that this association is mediated by non-negative coefficients (40, 44). This premise ensures that the latent factors can be mapped to the dataset’s features (i.e., genes, metabolites, or chromatin regions enriched with a histone mark), leading to more interpretable conclusions. The identified factors present similar coefficients for highly correlated molecules, simplifying downstream clustering techniques. Huang et al. (59) analyzed mice’s eye gene expression. This study identified a set of glaucoma-associated genes that could also discriminate ill mice samples from a second independent one. Zheng et al. (60) applied an NMF-based approach to a list of genetic mutations and were able to stratify cancer types associated with each mutation set.
While correlation networks are versatile in portraying molecular features associated with experimental conditions, their representations may not correspond directly to mechanistic interactions, often a product of common modulation.
2.5 Molecular interaction networks
Cellular metabolism involves molecules with distinct biochemical properties interacting through electrostatic binding sites and translocating between compartments via passive chemical gradients or active transport. Networks representing these interactions connect elements with shared biological functions, irrespective of their biochemical nature—encompassing genes, proteins, histone marks, and enzymes catalyzing metabolic conversions.
In the field of molecular interaction networks, Chuang et al. (18) explored their utility in identifying cancer biomarkers and cell fate decision drivers, integrating protein–protein interactions (PPIs) and transcription factor (TF) binding site identification. Our studies delved into the dynamic chromatin landscape of senescent cells, integrating TF chromatin binding from ATAC-seq with histone marks detected by ChIP-seq, predicting target gene expression (51, 52). Huang et al. (61) compiled a database summarizing TF binding from scATAC-seq, enriched by scRNA-seq-detected gene expression in the same cell. Ren and Kuan (62) benchmarked a multi-tissue biological age clock based on transcriptome data against DNA-methylation-based approaches.
While molecular interaction networks offer flexibility in conceptualizing multi-OMICS regulation, they often lack quantitative details about molecular reactions and may contain false-positive interactions. Integrating experimental data and complementary modeling approaches, such as regression methods (16), becomes crucial to mitigate this.
2.6 Mutual information
Mutual information approaches are statistical tools used to measure the predictability of one variable based on another. They quantify the degree of association and reveal dependencies between molecules. In simpler terms, if two molecules share high mutual information, knowing the levels of one molecule allows us to determine a narrow range that contains the value for the other molecule. This concept is illustrated by the GRN instance shown in Figure 2A, where, as previously, a gene M modulates the target T activation by regulator R. T gene levels are defined as shown in Figure 2B, which, under distinct M and R values, give rise to the multiple dynamics shown in Figure 2C. As expected, a high M value leads to no interaction between R and T, leading to a low mutual information between these two genes. As M decreases, the coupling between R and T increases, resulting in higher mutual information values. This phenomenon is evident in Figure 2D, where the cases associated with higher mutual information correspond to more precise T-level estimates by knowing that R values are contained in a small interval. Pioneering studies by Sachs et al. (63), Chuang et al. (18), and Linde et al. (30) have used mutual information to uncover complex relationships among molecular entities.
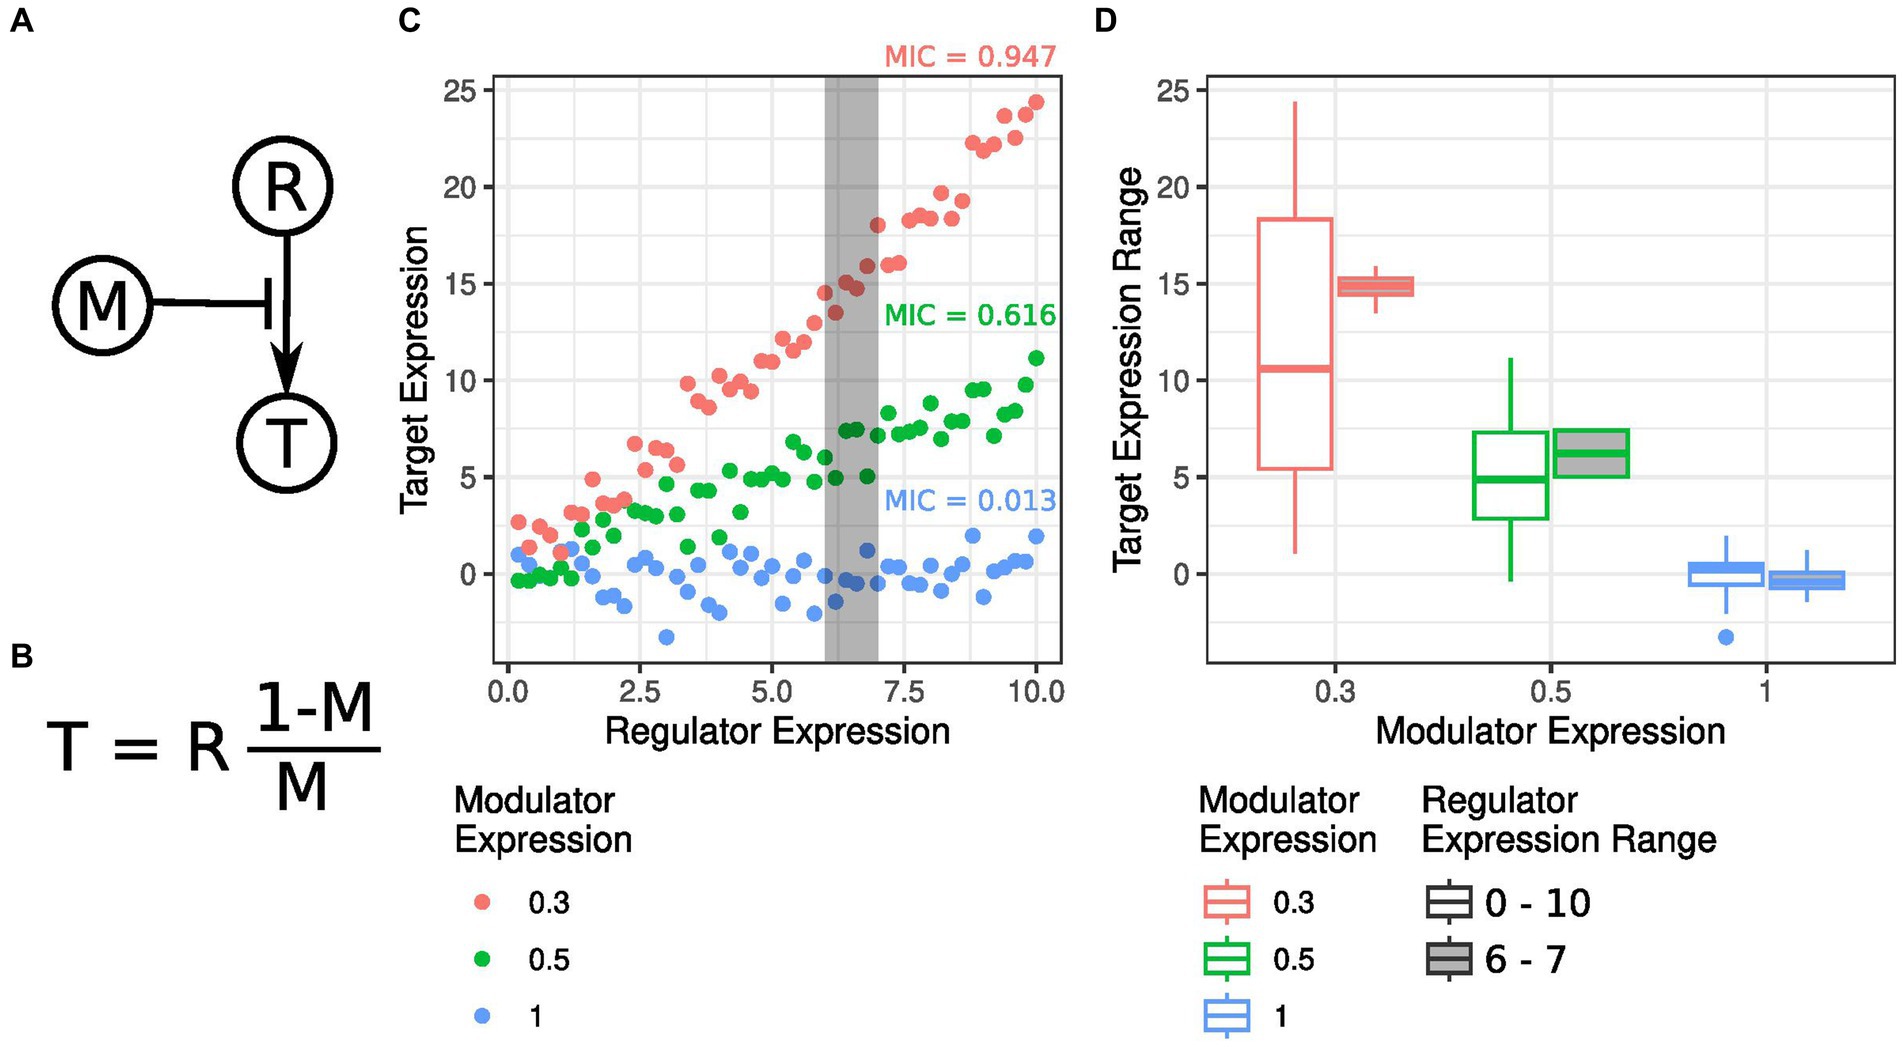
Figure 2. Mutual information strategies to identify modulatory interactions. (A) Gene regulatory network (GRN) showing how regulator gene R stimulates the activity of target gene T, which is controlled by the modulator gene M in a non-linear way. (B) Equation determining T levels as a function of R and M. T linearly increases as R is expressed, and the fraction of M determines the coefficient of this linear relationship compared to its maximum levels. (C) T gene expression changes as a function of R levels for various M activity levels. The Mutual Information Coefficient (MIC) between R and T for each M activity level is shown. (D) Comparison of T expression values for different R gene expression levels, sorted by M activity levels. The gray-filled boxplots represent the expression distribution of T for a specific range of R values shown in panel (C). A higher T expression distribution for a particular set of R values suggests a stronger interaction between the regulator and the target. The strength of the interaction, known as the Maximum Information Coefficient (MIC), is dependent on the modulator level and hence highlights the need for non-linear methods for Gene Regulatory Network (GRN) inference.
The ARACNE (Algorithm for the Reconstruction of Accurate Cellular Networks) algorithm, a widely used method in GRN reconstruction, relies on mutual information. Developed by Lachmann et al. (64), ARACNE finds applications in diverse research domains, from cardiomyopathy studies (65) to investigations into female fertility (66). Its ability to discern linear and nonlinear relationships renders ARACNE a robust tool for deciphering complex molecular dependencies.
Expanding on ARACNE, the MINDy (Modeling Interactions using Nonlinear Differential Equations) algorithm, conceived by Wang et al. (67), identifies higher-order interactions between molecules. Analyzing mutual information in samples with varying modulator levels, MINDy unveils modulators, proving invaluable for pinpointing nonlinear dependencies and ascertaining interaction directions in GRNs.
Okada et al. (68) have employed mutual information to craft a DNA methylation aging clock, gauging the correlation between DNA methylation patterns and age and offering a means to estimate an individual’s biological age.
While mutual information approaches excel in detecting molecular dependencies, the computational intensity escalates when considering numerous molecular entities due to the requisite discrete classification of variable values.
2.7 Ordinary differential equations
Ordinary Differential Equations (ODEs) serve as mathematical models for scrutinizing dynamic systems, particularly applicable in biology to capture gene expression changes in response to diverse stimuli. The versatility of ODEs allows the representation of nonlinear relationships among genes through various mathematical functions. Figure 3A portrays an example of GRN where the target gene T displays a self-regulatory loop that causes it to follow the expression values assumed by its regulator R. The ODE in Figure 3B represents this behavior, where the variation in T transcription is a parabolic function of T absolute gene expression. Figure 3C depicts this parabolic profile for distinct R values. This representation summarizes multiple GRN dynamical features, notably the potential presence of attractor states. Attractor states are characterized by a null velocity, i.e., the transcriptomic state is in equilibrium and will only change when the system is subjected to external stimuli (19). These states can be stable if the system converges back to the attractor state when perturbed or unstable when the system diverges from the attractor state. An unstable attractor is also known as a “tipping point.” Figure 3D illustrates how distinct initial states converge to the stable attractor at T = R.
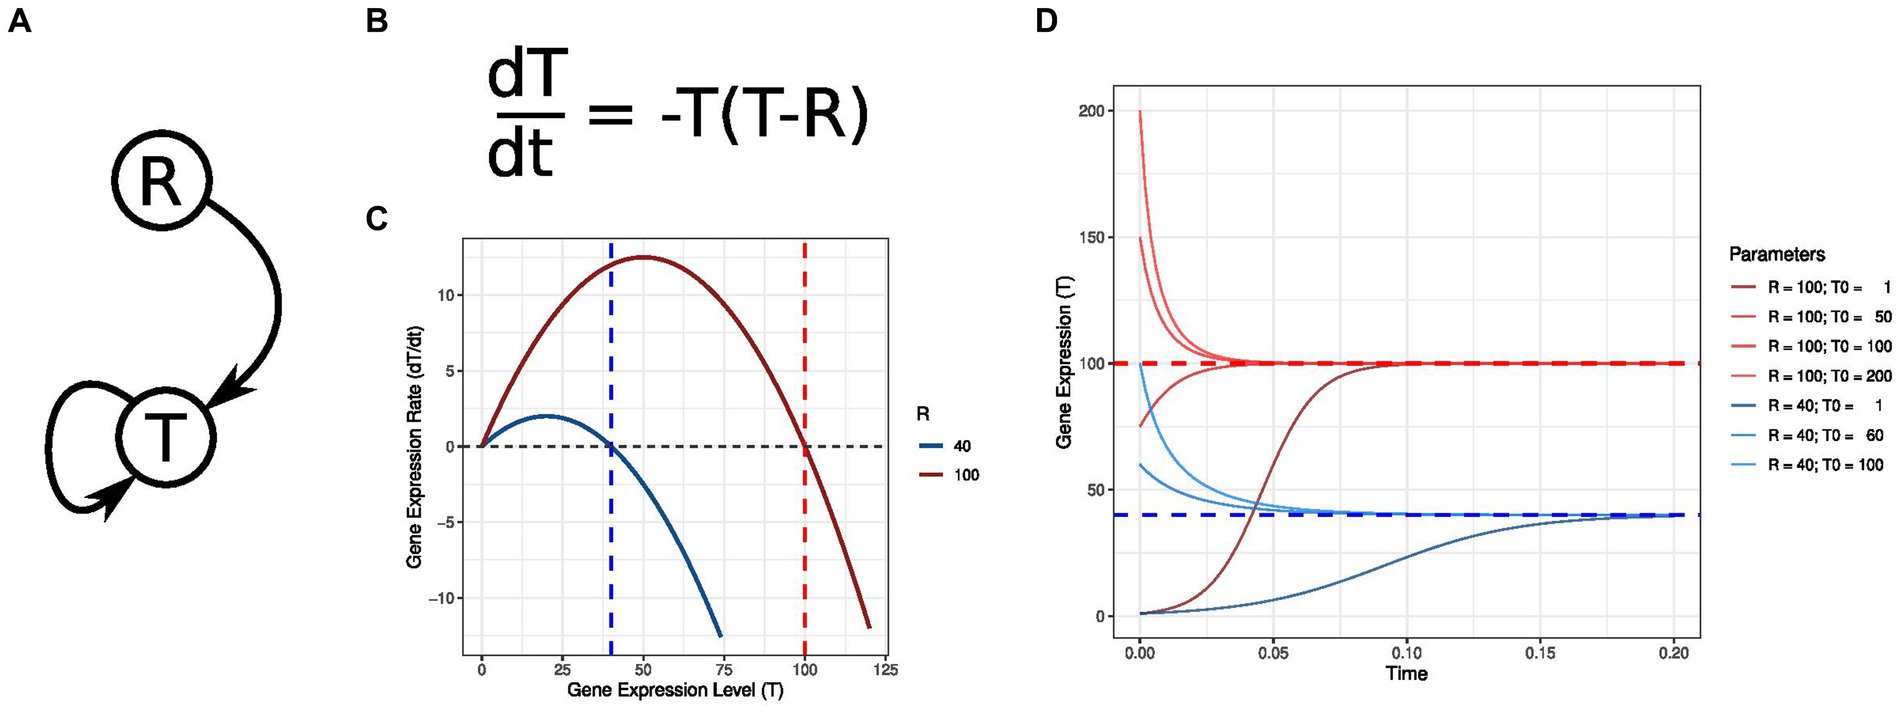
Figure 3. Differential equations modeling nonlinear molecular interactions. (A) Gene regulatory network (GRN) depicting a logistic growth where the regulator R determines the stable expression level of its target T. The self-regulatory T edge ensures that its expression will follow R levels. (B) Differential equation describing the change in T expression concerning its value and R transcription levels. (C) Graphic representation of T expression rate for distinct R values. When T is expressed at the same levels as R, its transcription rate is zero, and the GRN is in equilibrium. These states are termed attractors. (D) Temporal T expression for the same R values depicted in the previous panel. The dynamics are shown for distinct initial T expression values T0. T transcription levels tend to R, even if T initially displays higher expression than R.
In our investigations, we harnessed ODE systems to depict the transcriptomic landscape of cellular senescence, analyzing 802-time gene expression profiles from TF knock-down (KD) experiments (47). Through this approach, we also uncovered genes with potential hidden sources, which can be further explored in future iterations by integrating prior information, such as promoter-binding TFs or local epigenetic changes.
Konrath et al. (69) constructed an ODE system to elucidate the inflammatory response triggered by DNA damage via PARP1 and ATM. Conducting sensitivity analysis by altering coefficients governing gene regulation, they revealed the potential efficacy of PARP1 inhibition in mitigating inflammatory responses during irradiation treatment of cancer cells.
Li et al. (70) curated genes influencing aging-associated processes, formulating an ODE system grounded in sigmoid functions. Analyzing the system’s probability, they identified three distinct attractors, one marked by accelerated aging with mTOR activation and another representing a slow aging state with upregulated SIRT1, AMPK, and Ulk1.
In a comprehensive discussion, Shin and Cho (19) delved into the mathematical representation of systems and their potential landscapes to reverse cells undergoing malignant transformation. They proposed a two-step therapy involving rewiring the cellular internal network and destabilizing cancer-associated attractors in the first step. The second step focused on chronic microenvironment control to prevent cells from re-entering the attractor, which can be enhanced to leverage adaptive GRN motifs’ potential to reduce the need for prolonged microenvironment control in therapies.
2.7.1 Partial differential equations
ODEs are solved by integrating molecule evolution over one variable, typically time. At the same time, PDEs extend this integration to multiple variables, often spatial coordinates, allowing for incorporating spatial phenomena into simulations at the cellular and tissue levels (8, 71).
Dyson et al. (72) formulated a PDE system to model tumor growth, considering proliferating and quiescent cell populations, mutations, and cell migration influenced by extracellular nutrient gradients. In 2022, Son et al. expanded an ODE model of NF-kB dynamics, introducing a term for the spatial diffusion of TNF. Through experiments and simulations, they unveiled a gene expression response enabling cells to coordinate their reactions based on the dose, duration, and distance of tumor necrosis factor (TNF) signals.
Recent spatial transcriptomics studies have provided opportunities to explore tissue-level gene expression coordination and integrate spatiotemporal factors into model training. Kuppe et al. (73) profiled spatial gene expression in millimeter-sized cardiac tissue sections after infarction from multiple human patients. Interestingly, they could identify ANKRD1 and NPPB upregulation at the injured area, accompanied by an increase in TGFβ signaling-associated genes, detected by a pathway analysis performed in each spatial unit. Given that maximum spatial resolution can still be higher than the size of a cell, they combined this technique with scRNA-seq and were able to deconvolute cell types inside each spatial unit. This increased resolution led to the observation that ischemic samples have a higher proportion of macrophages expressing SPP1 and that these macrophages are associated with an increased myofibroblast presence in their surrounding area, supporting the hypothesis macrophages induce fibroblast differentiation into myofibroblasts. Yu et al. (57) review multiple studies profiling spatial gene expression in cancer, highlighting the role of distinct cell types in tumor microenvironment and treatment response. Notably, colorectal cancer is associated with the colocalization of fibroblasts and SPP1-positive macrophages, leading to increased TGFβ pathway activity. This mechanism leads to tissue fibrosis, eventually reducing immune infiltration and negatively impacting patient prognosis.
Despite a lack of studies performing GRN inference based on spatial transcriptomic data in age-related diseases, PDEs have been intensely studied in embryonic development and organ morphology. The Drosophila melanogaster embryo presents a concentration gradient for the bcd protein, activating downstream targets at distinct intensities and leading to increasingly sophisticated molecular patterns that define fly morphology (74). Interestingly, Mousavi and Lobo (75) have developed a tool that can identify GRN-originating spatial profiles from any arbitrary shape, given two genes regulate the network with gradients in two perpendicular dimensions. GRNs considering spatial information are usually modeled using reaction–diffusion networks, which are similar to ODEs and contain a term associated with the spatial variation of regulator levels (75, 76). This concept was formalized by Turing’s (77) early work on how simple rules generate complex spatial patterns, which, as discussed by Reinitz (78) and Maini et al. (79), has also gained renewed interest.
ODEs and PDEs prove powerful in modeling biological processes, understanding complex systems, and evaluating interventions through sensitivity analysis. Hidden sources analysis aids in identifying critical genes requiring attention, while identifying attractors in ODE systems offers insights into underlying mechanisms. Nevertheless, accurately representing GRNs via ODE inference demands substantial data and domain knowledge, and fitting noisy experimental data may lead to unstable dynamical systems.
2.8 Artificial networks
Artificial neural networks, a subset of nonlinear machine learning techniques (17, 27, 30, 80), excel in describing a wide range of processes with superior accuracy compared to linear models, although they require more data for precise identification. Figure 4A depicts a neural network implementing a high-order polynomial function with one input. It contains one hidden layer with 15 neurons. Each of these neurons outputs a value based on the function shown in Figure 4B, known as the “activation function.” In this example, the activation function is a Rectified Linear Unit (ReLU), which acts as an identity map for positive values and returns zero for all negative input values. Before being applied to the activation function, the input is linearly transformed by the weights wi, which are the parameters to be optimized during the network training. Figure 4C shows the impact of each neuron (blue curves) in the output and the cumulative effect of all previous neurons to compute the target polynomial function. The predicted and target functions are depicted in Figure 4D. Deep learning neural networks (DNN), consisting of multiple intermediate layers, have the property of modeling any mathematical function and revolutionizing image analysis and object recognition, showcasing unprecedented accuracy (81). In genomics and aging studies, DNNs have proven valuable for inferring GRNs, deconvoluting cell types, and constructing biological clocks.
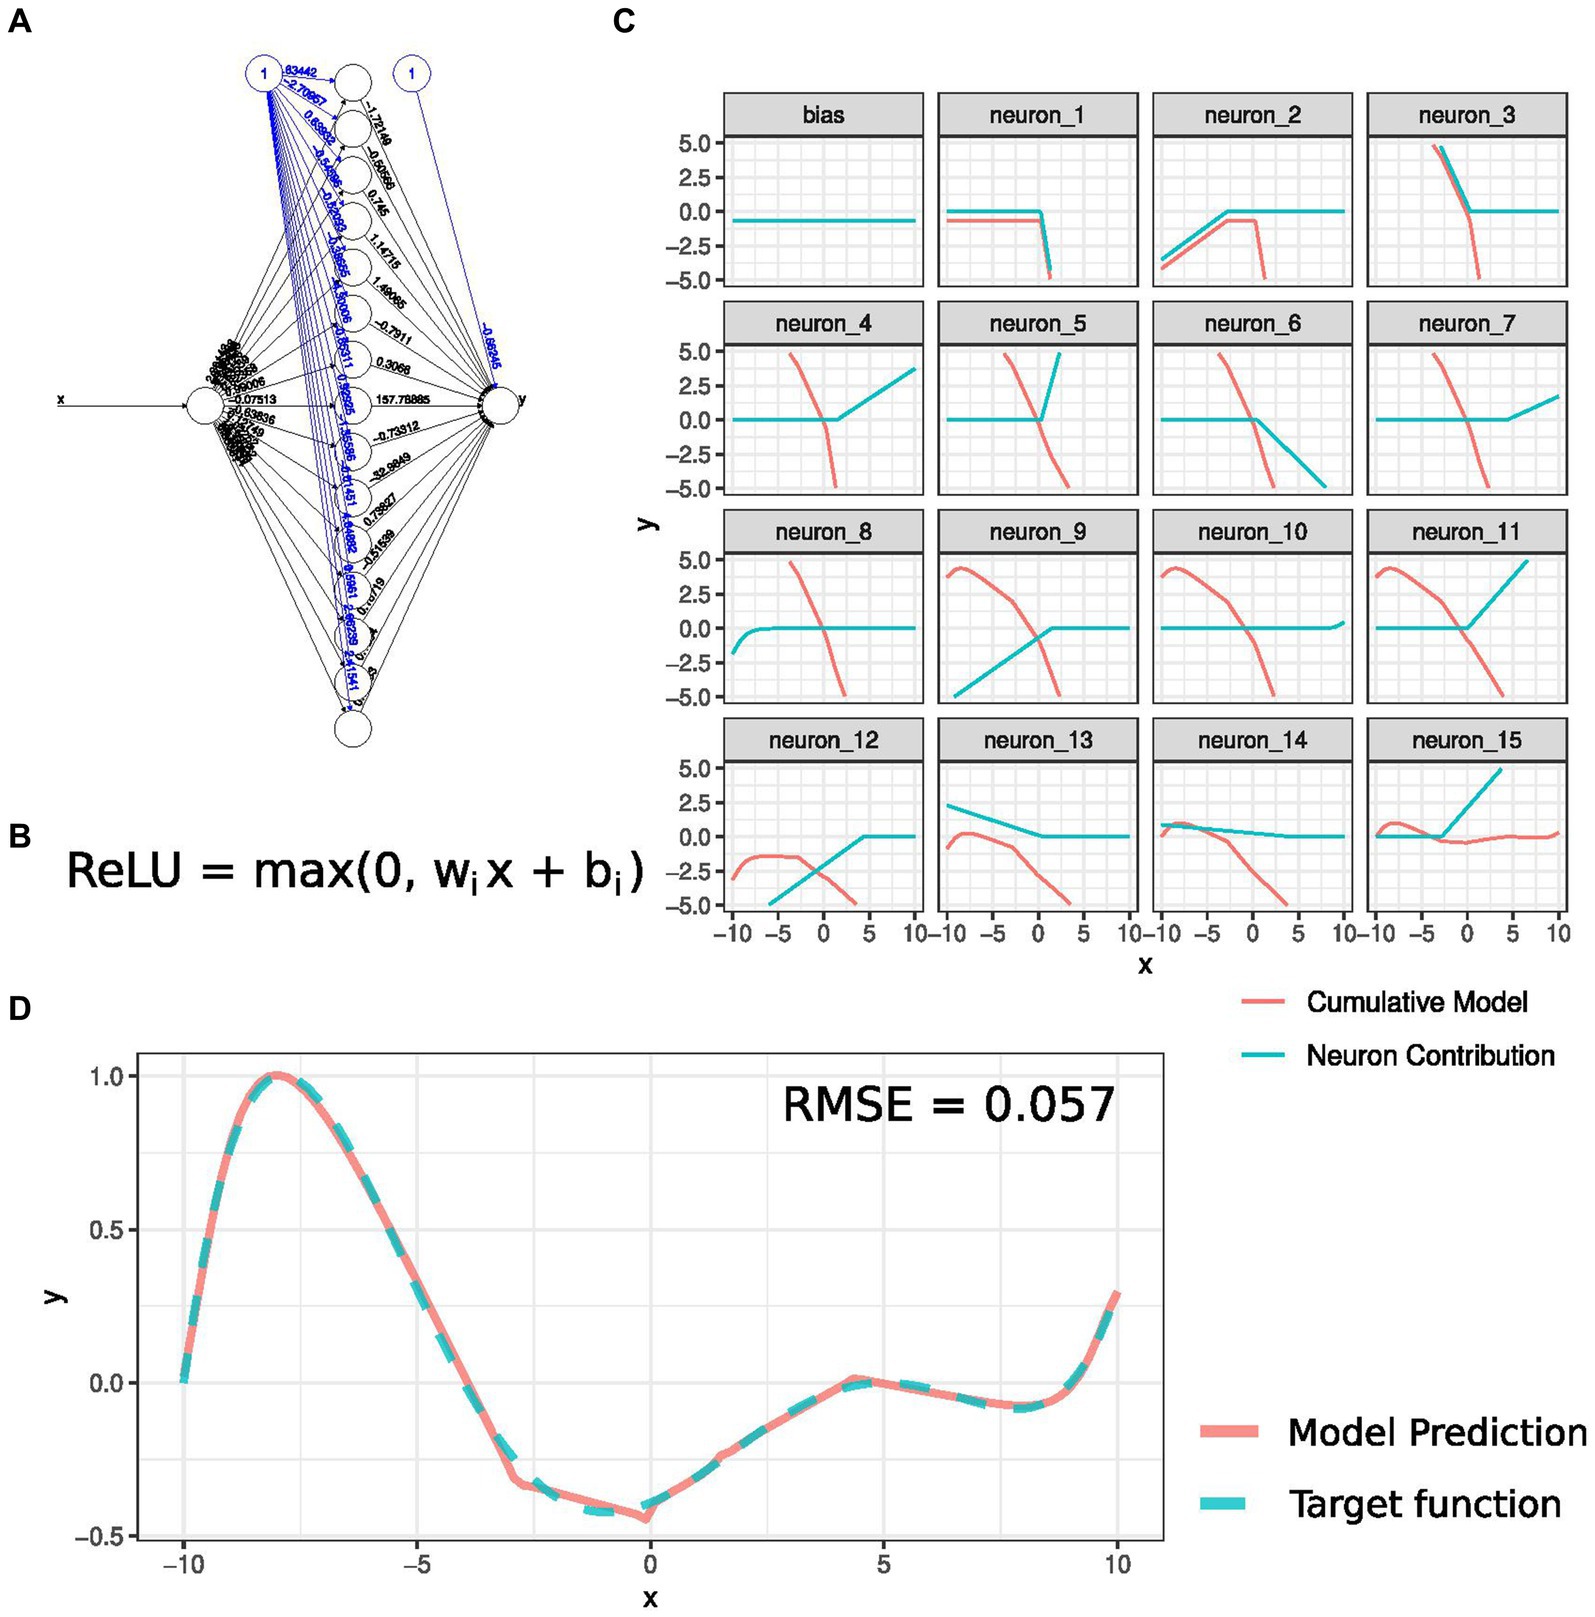
Figure 4. Neural networks as universal approximators. (A) Description of a neural network trained to approximate a target function. The network has one input, one hidden layer with 15 neurons, and one output. The black edges in the network represent the weights that determine the activation of each neuron based on the input value. The blue edges represent the independent terms that lead to the basal activation of each neuron, also known as biases. Each neuron applies an operation, determined by an activation function, to its input. (B) The Rectified Linear Unit (ReLU) function is the activation function for this example. (C) Contribution of each neuron to the final model prediction. As more neurons are considered, the model prediction approaches the target function. (D) Neural network model output and target function comparison, with a Root Means Squared Error (RMSE) of 0.057.
Cancer GRN inference has been explored using DNNs, as seen in studies by Wysocka et al. (20) and Langeman et al. (80) on leukemia regulation. Autoencoder architecture, employed in Alzheimer’s research (82), aids in determining cell proportions. Jordan & Miska (34) applied autoencoders to nonlinearly separate C. elegans growth parameters based on diet or genotype. Qiu et al. (83) used decision trees to estimate biological age with higher interpretability than DNNs. Holzscheck et al. (84) designed a biological clock using a DNN with parallel subnetworks mimicking biological signaling, allowing the identification of active neurons and their functions during age inference. Tao et al. (85) benchmarked multiple artificial intelligence methods to classify proliferation and senescent cells and identified six transcriptomic signatures associated with distinct CS identities.
Despite the effectiveness of artificial intelligence (AI) methods, challenges persist in situations requiring high safety levels, like healthcare or autonomous driving. To address this, paradigms like Conformal Prediction (86) have emerged, providing metrics to quantify the certainty of model predictions. Conformal prediction offers insights into the reliability of AI models for specific use cases, emphasizing the importance of understanding prediction variations associated with confidence levels.
3 Perspectives
3.1 Potentially disruptive datasets
The field of systems biology and aging is poised to benefit significantly from advancements in AI, akin to the transformative impact witnessed in image processing breakthroughs. The ImageNet dataset revolutionized image processing by providing over 10 million images with a standardized set of labels (81); the GPT-3 large language model was trained using an unprecedented number of parameters and has exhibited superior accuracy across various language tasks compared to previous versions without annotated data (108). Therefore, achieving comparable breakthroughs in systems biology and aging necessitates the development of comprehensive expert-annotated datasets.
Fortuitously, global collaborative efforts have facilitated the integration of numerous high-throughput datasets into a unified framework (Table 1). Uyar et al. (55) enumerate studies characterizing age-related transcriptomic changes at the single-cell level in multiple organs. Furthermore, larger-scale initiatives are actively underway to delineate multi-tissue age-related pathophysiological changes. These initiatives involve databases consolidating raw data from projects investigating mechanisms related to the same diseases and international consortiums dedicated to comprehending and mapping the molecular features of both healthy individuals and pathological molecular trajectories. These initiatives significantly advance our understanding of the fundamental mechanisms underlying aging and disease by aggregating findings from diverse studies into a cohesive format.

Table 1. Large-scale initiatives mapping human healthy and pathological molecular states.
Exploring different species holds promise for therapeutic development (Table 2). Tejada-Martinez et al. (109) uncovered 71 duplicated tumor-suppressor genes in cetaceans, potentially explaining their extended lifespan. These genes offer a valuable avenue for investigating cancer growth reduction and delaying tumor relapse in humans. Wang et al. (56) probed scRNA-seq data across mice, zebrafish, and flies, revealing age-associated immune response activation and diminished mitochondrial activity. Mah and Dunn (110) constructed a multi-species phylogenetic tree from scRNA-seq data, pinpointing common, evolutionarily conserved pathways and quantifying transcriptomic response similarity across species. Intriguingly, Jiang et al. (102) noted a significant correlation between the transcriptomes of zebrafish swim bladder epithelial cells and mice alveolar type 1 cells, in line with their specialized functions in gas exchange—Table 2 catalogs single-cell datasets from diverse species, offering potential targets for delaying age-related pathologies. Additional pertinent studies by Wang et al. (111) and Fei et al. (101) contribute to this comprehensive exploration.
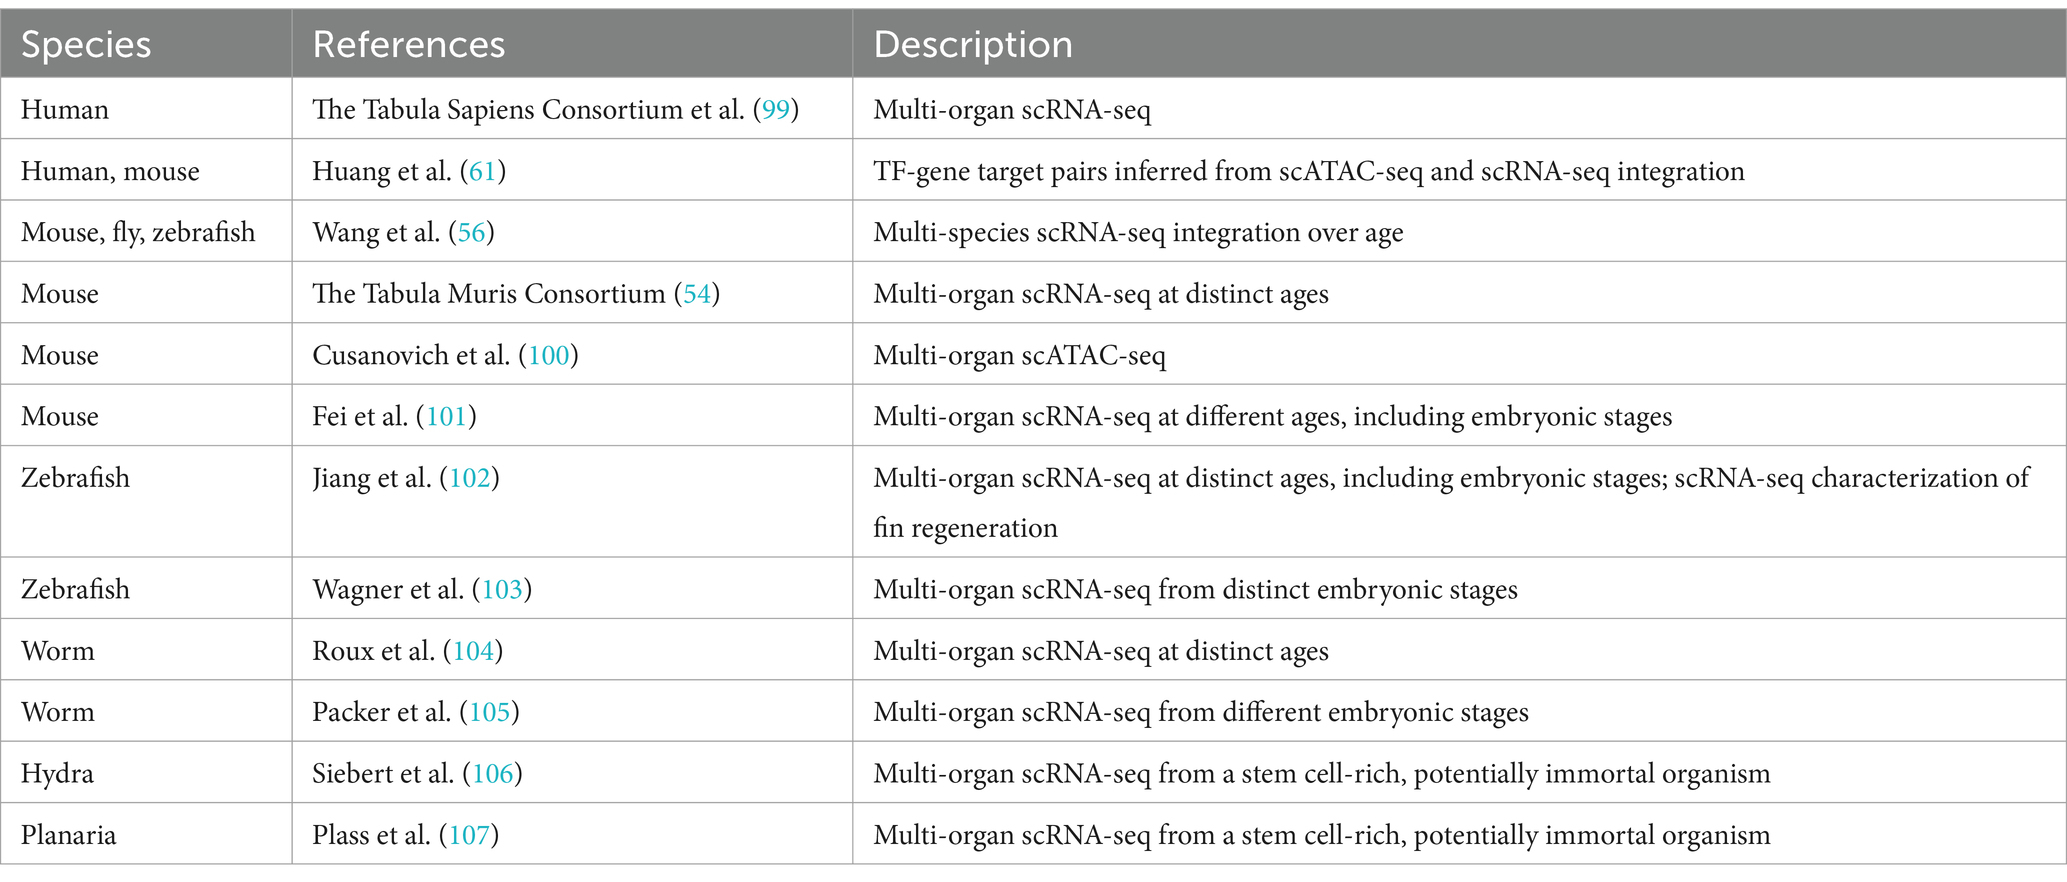
Table 2. Single-cell OMICS datasets describing multi-organ age-associated molecular changes.
3.2 Potentially disruptive methods
Aging research is constantly evolving, and new data analysis methods are emerging. In addition to producing high-quality, comprehensive datasets, deep neural networks (DNNs) have achieved unparalleled accuracy. While the field is still under active research, DNN architectures can better estimate data from different domains with specific distributions (112, 113). DNN architecture is critical as it can bridge the gap between formal models based on fixed principles and virtually unbounded approaches. The literature provides a detailed description of the properties associated with each architecture (114). We have highlighted specific DNN architectures that have the potential to enhance our understanding of gene regulatory networks (GRN) that regulate age-associated processes. Combining these architectures with the datasets in Table 2 can significantly improve our understanding of aging.
3.2.1 Dimensionality reduction: autoencoders and Kohonen networks
Autoencoders are a class of deep neural networks that utilize two sub-networks connected in series: an encoder and a decoder. The encoder maps the input data to an intermediate layer with fewer neurons. At the same time, the decoder reconstructs the input data from the information available in this layer with reduced degrees of freedom. As a result, the network generates a low-dimensional data representation. Due to the non-linear activation function of neurons, this representation can also map non-linear functions. Previous research has shown that this lower-dimensional representation can represent transcriptional profiles of distinct cell types in a biological sample, which can be used in other samples to estimate subpopulation proportions (82). This tool can also separate potential sources of transcriptional variability, which can be later mapped to genetic or environmental conditions (34).
Another technique that identifies a low-dimensional data representation is the Kohonen Network, known as “self-organizing maps” (115). Despite not following the conventional neural network representation, Kohonen Networks associate each input with a cell in a grid so that inputs with closer dynamics will be closer to the map. In addition to determining a low-dimensional data representation, it effectively functions as a clustering technique.
3.2.2 Residual neural networks
Residual networks, also known as ResNets, are a type of neural network that includes “shortcut connections” that start at neurons in one layer and end at neurons in layers several steps ahead (116). This unique feature allows intermediate layers to model only the difference between the output of the layer at the beginning of the shortcut and the expected training output. This leads to greater network robustness and faster training convergence, which allows networks to stack hundreds of layers. Recent studies have shown that ResNets are effective in various applications. For example, Cao et al. (117) used a DNN with a ResNet submodule to detect and localize myocardial infarction sites from a 12-lead electrocardiogram signal. Additionally, Habijan et al. (118) used ResNet as an autoencoder network to design intermediary layers for segmenting heart chambers from computer tomography (CT) and magnetic resonance imaging (MRI) data. This led to higher similarity between predictions and expert-annotated data.
3.2.3 Transformers
Transformers have significantly impacted artificial intelligence due to their application in large language models. However, their implementation has raised ethical and cultural concerns (119). Initially introduced by Vaswani et al. (120) for language translation, transformers are now widely used in text generation to predict the next word in a sentence. The transformer architecture’s main innovation is the “attention mechanism,” which enables it to associate words that refer to the same concept. Three matrices, Key (K), Query (Q), and Value (V), are used for this mechanism, with each word in the input associated with a K matrix. This matrix calculates the KQ product for each word in the sequence, with Q depending on the meaning of each input word. As a result, words referring to the same idea will have higher KQ product values. The V matrix determines the most probable word to continue the sequence, resulting in the model output.
Interestingly, the KQV layers are located within a ResNet submodule, and the transformer network includes numerous attention modules. Li et al. (121) have extended this paradigm to image analysis and accurately classified AD patients by training the attention submodule to identify brain features that maximize patient disease status.
It is worth noting that large-language models can be trained using only ternary values (−1, 0, and 1) instead of 16-bit floating-point numbers, according to Ma et al. (122). This technique is more precise than converting weights to ternary values after training, resulting in smaller memory footprints and faster response times. This approach is expected to yield better results when applied to healthcare-related solutions.
3.2.4 Graph neural networks
Graph Neural Networks (GNNs) consider the interactions between modeled entities and the topological information in those interactions. They can be used to predict the state of a node based on an input that specifies the state of other nodes and the state of unknown edges. They can also be used to generate new subgraphs in a given network. GNNs can be combined with autoencoder architectures, where the input is first encoded into a low-dimensional graph that performs predictions and then decoded back into the original input representation. Additionally, GNNs can implement the attention mechanism from transformer architectures by learning a weight vector that selects which neighbors to consider during prediction. Truong-Quoc et al. (123) used the contextual information used by GNNs to infer 3D spatial DNA conformation despite a scarcity of experimental DNA spatial configuration data. In the field of biological clocks, Inácio et al. (124) modeled cardiac shape as a 3D mesh and trained a GNN to infer the biological age from the mesh dynamic motion. Furthermore, Gao et al. (125) predicted brain age from MRI data, which was used to compute connectivity maps input into a DNN combining GNN with a transformer.
Remarkably, exploring interactions among multiple entities simultaneously has spurred the creation of novel neural network architectures (126). In the realm of Topological Neural Networks, the focus lies in capturing higher-order relational structures, exemplified by edges with multiple sources. These structures unveil intricate interactions within the training data. Considering that biological processes hinge on reactions involving multiple substrates and catalysts (67), topological neural networks are poised to provide more effective modeling capabilities for such scenarios.
3.2.5 Ensemble techniques and distributed artificial intelligence
Ensemble techniques allow the creation of comprehensive models by combining multiple application-specific prediction models. For instance, Shah et al. (127) could predict biological heart age from MRI by merging the outputs of hundreds of distinct segmentation models to identify cardiac features. Similarly, Huang et al. (128) used two parallel networks to extract brain imaging features from MRI and positron-emission tomography (PET), whose outputs were combined to predict patient AD status.
These ensemble techniques offer the opportunity to generate all-inclusive models by integrating multi-modality patient data. However, this integration should respect patient privacy and security and not infringe on intellectual property rights over a dataset. Wassan et al. (113), Acosta et al. (129), and Wang et al. (111) have highlighted these concerns. Federated Learning (FL) approaches have been developed to address these issues. FL formalizes a set of protocols independent collaborators can follow to train a prediction model while keeping their datasets private.
FL generally involves a centralized party coordinating model training by sharing the Deep Neural Network (DNN) weights with each collaborator. The collaborators update the weights based on the data locally available (56, 129, 130). Decentralized FL approaches, such as the one proposed by Kalra et al. (131), are also possible. Collaborators communicate a proxy model trained with individual private models in this protocol. The training is designed in a way that the predictions of the proxy model are also considered in the private model training (132). The private model updates its weights considering the datasets used during proxy model training. Conversely, the proxy model is refined with new information from the local dataset before being sent to the next collaborator.
3.3 Modeling nonlinear phenomena
The surge in nonlinear methods for GRN reconstruction is driven by the abundance of available data (19, 30, 68, 133–135), offers a versatile framework. This nonlinear description enables the synthesis of diverse findings in the literature (32, 51, 57, 58). Notably, studies across tissues or the same tissue under various treatments occupy different regions in the gene expression state space, forming trajectories (133). These trajectories reflect the response to specific treatments and are approximated by linear planes with distinct inclinations tangent to the epigenetic landscape (Figures 5A,B). The overall epigenetic landscape can be locally described through a combination of linear approaches, even if results from different experiments yield planes with different inclinations, also represented by correlation GRNs with a distinct set of edges (Figures 5A,C,D).
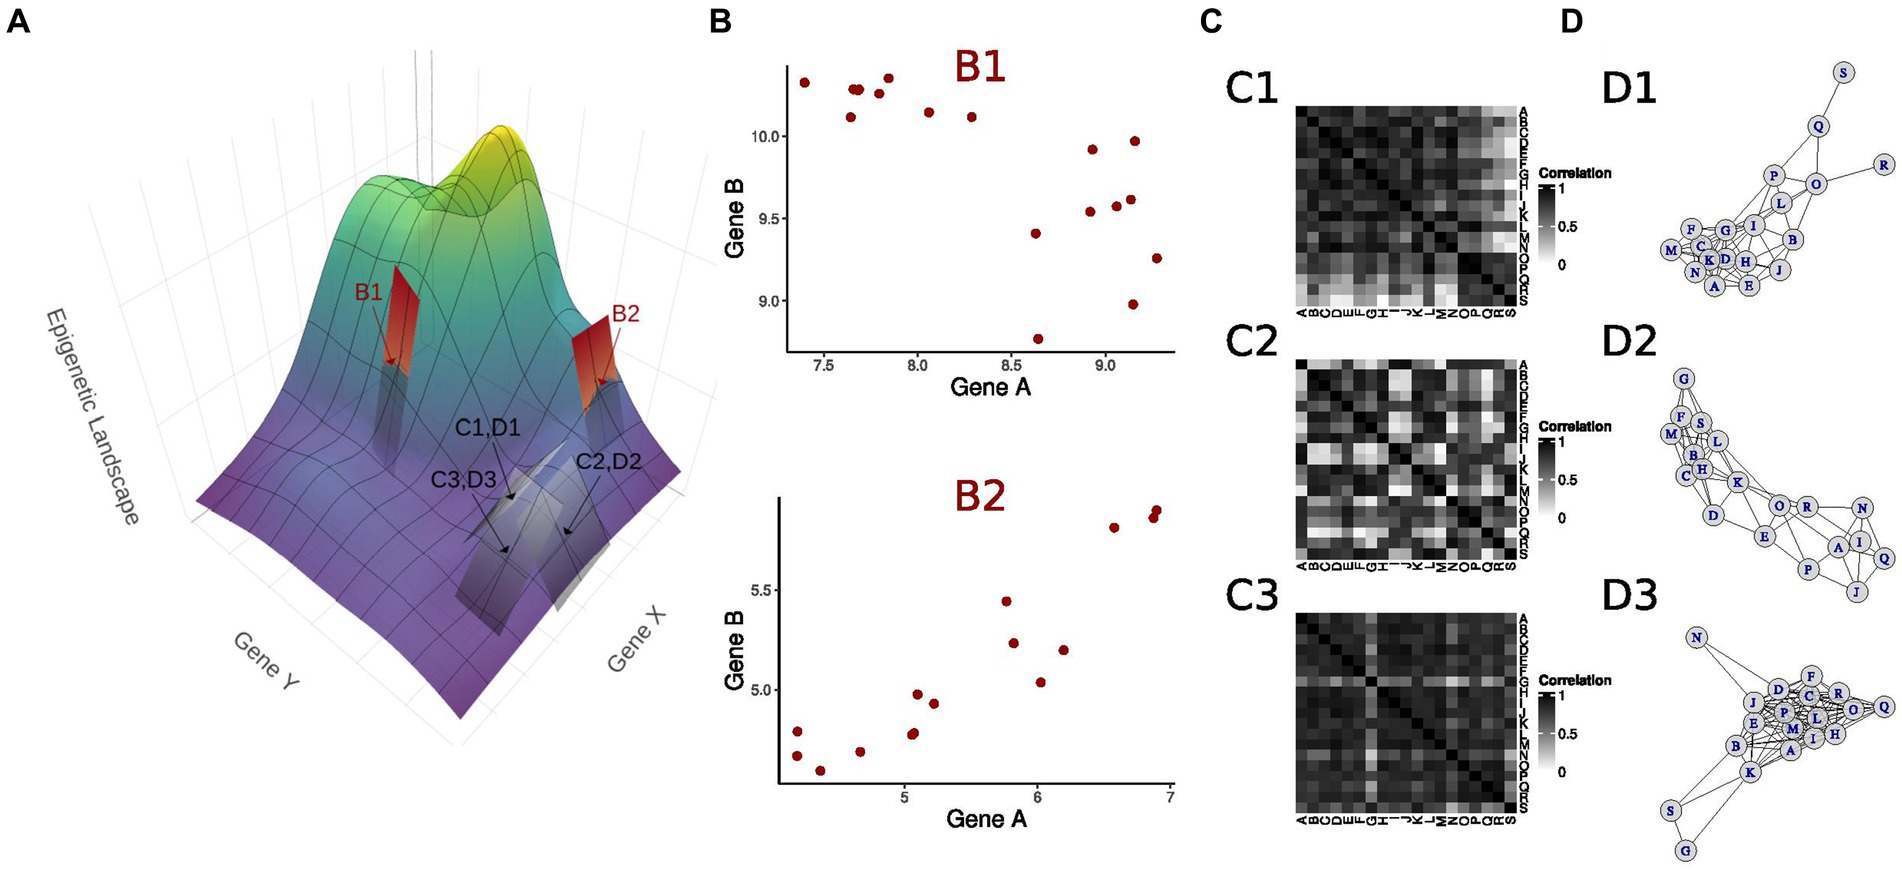
Figure 5. Integrating multiple linear approaches to unravel a nonlinear landscape. (A) The epigenetic landscape as a function of the expression level of two master regulator genes X and Y. Experiments analyzing linear relationships in genes responding to a particular treatment unravel the underlying landscape by finding linear approximations, illustrated by planes tangent to the landscape at the indicated points. Each point is associated with an experimental model, presenting specific X and Y basal expression values. (B) At points B1 and B2, genes A and B, downstream to X and Y, show distinct correlations. (C) Correlation matrices depicting pairwise correlations for genes downstream of X and Y at points C1, D1; C2, D2; and C3, D3. The different correlation matrices associated with planes with distinct inclinations at each point approximate the landscape curvature. (D) Correlation networks corresponding to each correlation matrix in C. As pairwise gene correlations assume different values depending on the expression levels of X and Y, i.e., depending on the position in the landscape, the gene correlation network contains a distinct set of edges.
Within a single experiment, linear correlations determine the plane inclination at each state, leading to varied regression coefficients or pairwise correlations across different experiments in distinct conditions. Alternatively, the linear regression coefficient between two molecules can be viewed as dependent on the expression of a specific regulator (67). Modulating the regulator expression mirrors sensitivity analysis (69), visualized by rearranging the epigenetic landscape, akin to Li et al.’s (70) landscape analysis for distinct SIRT levels. Existing GRN descriptions can be perceived as a comprehensive piece-wise linear model, accommodating batch effects from measurement collection in diverse laboratories.
Considering the cellular ability to dedifferentiate and transdifferentiate, allowing access to the entire epigenetic landscape even in differentiated cells, Shin and Cho (19) emphasize the importance of gathering data on intermediate states to enhance the accuracy of GRN evolution models. Echoing this, our group’s prior work illustrates how dynamic datasets contribute to a more thorough comprehension of cell fate decisions (51, 52).
3.4 Higher-order dynamic representations
ODE approaches commonly express a species’ rate of change as a function of its current state, a concept that can be extended to higher-order systems where acceleration is tied to the system’s state. Schwanhäusser et al. (14) emphasized the importance of considering gene expression levels proportional to the protein translation rate for accurate protein level inference from transcriptome data. In a study on monocyte differentiation during heart failure, Ni et al. (136) discovered the Cd72 gene’s expression derivative peaked when its transcriptional regulator RelA was maximally expressed.
RNA velocity, distinguishing spliced and unspliced RNA molecules, is increasingly employed in single-cell transcriptome analysis (15, 137), using ratios to infer gene expression rates. However, the appropriate dynamic order for modeling biological systems remains to be determined due to the complexity of signaling pathways and regulatory layers (16, 17). Speculating on effective comparisons, it might be advantageous to model histone mark modification and transcription factor binding as a second-order dynamic system (138). Alternatively, comparing enzyme levels instead of metabolite production requires accurate measurement of all implicated regulation layers, acknowledging the challenge posed by the inherent variability in protein levels despite consistent RNA molecule counts.
Theoretically, second-order systems offer robustness, allowing a broader range of dynamic processes. Networks with self-regulatory loops described by first-order systems can only exhibit exponential decay or unbounded increase (Figure 4D). In contrast, equivalent networks involving proteins regulating their genes can display these two behaviors with the addition of oscillations (139). Figure 6A illustrates an extension of the example GRN in Figure 4A, where the expression of the target gene T considers both freshly transcribed unspliced mRNA (TU) and mature spliced mRNA levels (TS). TS is increasingly synthesized with higher TU levels and is regulated by temporal degradation. The equation governing this dynamic is depicted in Figure 6B, which, after some algebraic manipulation, is equivalent to the second-order ODE shown in Figure 6C.
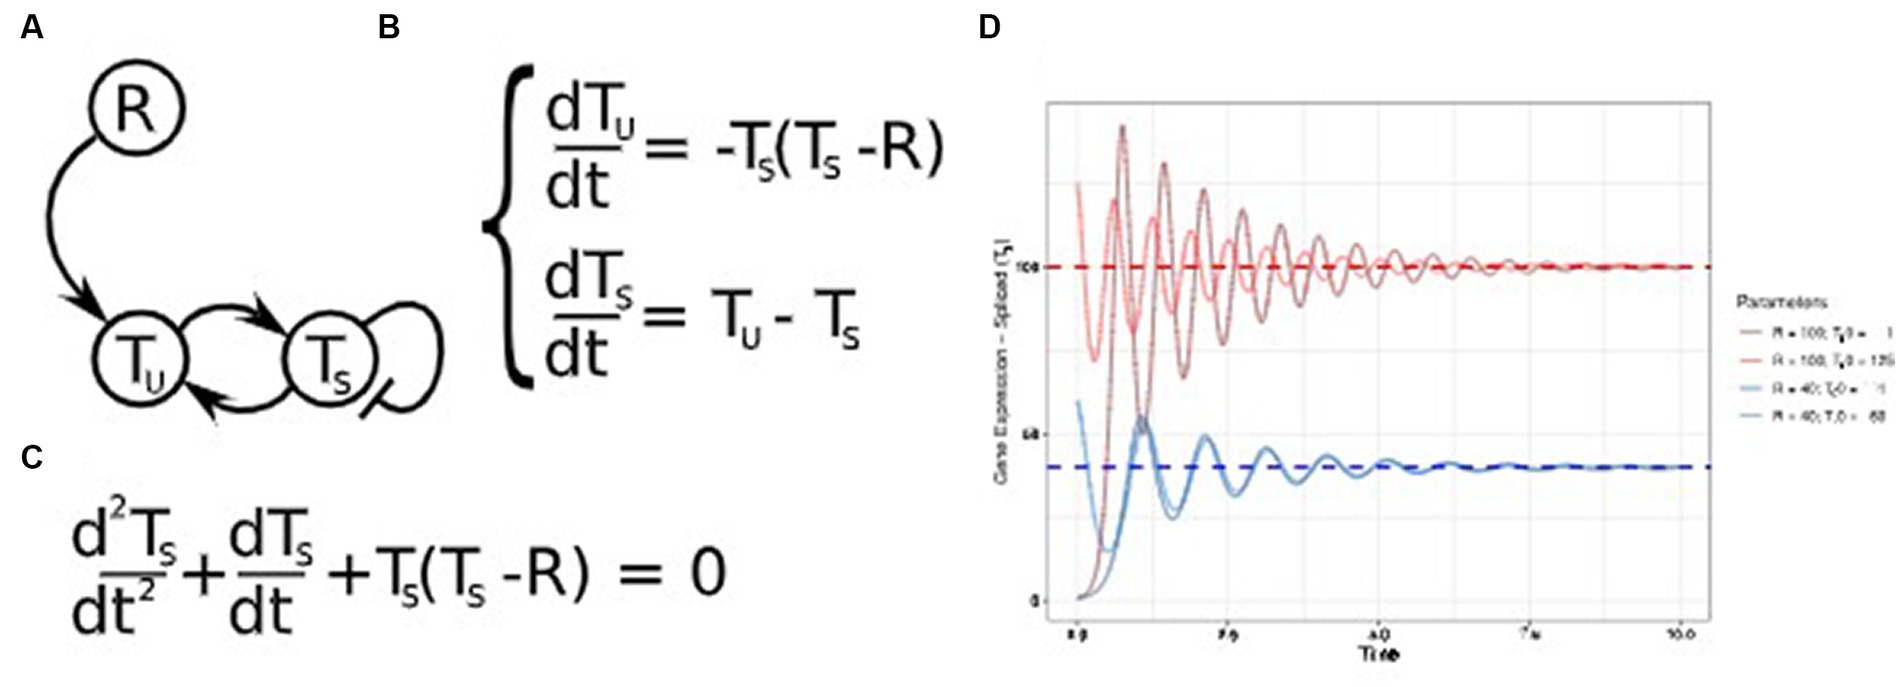
Figure 6. Higher-order differential equations. (A) Gene regulatory network (GRN) portraying a dynamic transcription model, where a target gene T produces unspliced mRNA fragments (TU), which are spliced into mature mRNA (TS). The regulator R determines the stable expression level of its target TS. (B) Differential equations describing TU production for mature mRNA TS and R transcription levels. Ts is produced proportionally to TU abundance and decays over time. (C) A second-order differential equation equivalent to the equations system shown in panel (B). (D) Temporal Ts expression for the same R values depicted in Figure 3D. The dynamics are shown for distinct initial Ts expression values Ts0. In regime, Ts transcription levels tend to R, which are reached after a transient oscillatory activity. Oscillation frequency is also dependent on R expression levels.
Similarly to Figure 3D, which demonstrates the system convergence to the attractor T = R, Figure 6D shows that the second-order ODE also leads to equivalent attractors in the long term. Nonetheless, this state is achieved only after oscillatory behavior. Interestingly, R values determine the system’s final state and the oscillation frequency.
Given that enough samples are available, higher-order modeling has the potential to implicitly consider layers of regulation that are not present in the training data. This process is analogous to the equation derivation in Figure 6C, which does not include TU. Nonetheless, TS expression numeric simulations still require an initial value for its derivative, equivalent to assuming TU initial values. This shortcoming can be overcome by performing multiple simulations with distinct initial values for unknown variables at the cost of additional computing resources or by estimating these values based on data from a similar cell type (e.g., using the atlases depicted in Table 2 as potential sources). Altogether, the versatility of higher-order dynamic models has great potential to increase the predictive power for GRN inference.
4 Conclusion
The study of aging has achieved notable advancements, unveiling shared processes and biomarkers across species. Despite this progress, a comprehensive understanding of the interconnectedness of age-related molecular processes still needs to be discovered. ARDs likely result from a combination of these processes, inducing pathophysiological shifts. Exploring strategies mapping the epigenetic landscape of age-related cellular abnormalities has become more refined with recent breakthroughs in single-cell data acquisition and integrating diverse biochemical regulation layers. These advancements present an unprecedented opportunity to unravel the molecular intricacies of aging, offering the potential for therapies employing dynamic systems concepts to redirect pathological trajectories toward a healthier course.
Identifying shared aging mechanisms across multiple animal species and tissue types has unveiled that interactions among genes, proteins, metabolites, and epigenetic marks form a complex, intricate network spanning processes from molecular to organismal levels. Hence, these processes are characterized by many parameters, requiring an equally extensive amount of data to distinguish GRNs that generalize results from multiple independent experiments.
Recent advances in experimental techniques and data analysis poise the aging field to disruptive breakthroughs in identifying age-associated trajectories and the delay in the onset of age-related pathologies. The solidification of the FAIR principles (findability, accessibility, interoperability, and reusability) in data sharing has paved the way to integrating comprehensive datasets that are impossible through multiple isolated studies. These include the identification of cellular heterogeneity and dynamics in aging processes through integrating multi-layered networks, including GRNs and PPI networks, single-cell sequencing experiments, and spatial molecular profiling assays. We believe that the knowledge gained from systems pharmacology will contribute to the widespread use of computational models in healthcare. These models will help in identifying and prioritizing potential interventions to modify the pathways related to aging in a personalized way. This approach will take into account an individual’s genetic background, lifestyle factors, and environmental exposures and will be crucial in developing effective anti-aging therapies.
Author contributions
JF: Conceptualization, Funding acquisition, Resources, Visualization, Writing – original draft, Writing – review & editing. OB: Conceptualization, Funding acquisition, Resources, Supervision, Writing – original draft, Writing – review & editing.
Funding
The author(s) declare financial support was received for the research, authorship, and/or publication of this article. This work was supported by grants from the INSERM AGEMED program and ANR-19-CE13-0017 S-ENCODE to OB. JF was supported by the “MATURATION Jeunes chercheurs de la Faculté de Santé Paris Est Créteil” grant.
Acknowledgments
We are grateful to the members of INSERM-U955 for their support, critical reading of the manuscript, and helpful discussions.
Conflict of interest
The authors declare that the research was conducted in the absence of any commercial or financial relationships that could be construed as a potential conflict of interest.
Publisher’s note
All claims expressed in this article are solely those of the authors and do not necessarily represent those of their affiliated organizations, or those of the publisher, the editors and the reviewers. Any product that may be evaluated in this article, or claim that may be made by its manufacturer, is not guaranteed or endorsed by the publisher.
References
1. Jones, OR, Scheuerlein, A, Salguero-Gómez, R, Camarda, CG, Schaible, R, Casper, BB, et al. Diversity of ageing across the tree of life. Nature. (2014) 505:169–73. doi: 10.1038/nature12789
2. Santiago, E, Moreno, DF, and Acar, M. Modeling aging and its impact on cellular function and organismal behavior. Exp Gerontol. (2021) 155:111577. doi: 10.1016/j.exger.2021.111577
3. Gompertz, B . XXIV. On the nature of the function expressive of the law of human mortality, and on a new mode of determining the value of life contingencies. In a letter to Francis baily, Esq. FRS &c. Philos Trans R Soc Lond. (1825) 115:513–83. doi: 10.1098/rstl.1825.0026
4. Kappeler, L, Filho, CDM, Dupont, J, Leneuve, P, Cervera, P, Périn, L, et al. Brain IGF-1 receptors control mammalian growth and lifespan through a neuroendocrine mechanism. PLoS Biol. (2008) 6:e254. doi: 10.1371/journal.pbio.0060254
5. Kenyon, C, Chang, J, Gensch, E, Rudner, A, and Tabtiang, R. A C. elegans mutant that lives twice as long as wild type. Nature. (1993) 366:461–4. doi: 10.1038/366461a0
7. Kenyon, C . The first long-lived mutants: discovery of the insulin/IGF-1 pathway for ageing. Phil Trans R Soc B: Biol Sci. (2011) 366:9–16. doi: 10.1098/rstb.2010.0276
8. Mc Auley, MT, Guimera, AM, Hodgson, D, Mcdonald, N, Mooney, KM, Morgan, AE, et al. Modelling the molecular mechanisms of aging. Biosci Rep. (2017) 37:BSR20160177. doi: 10.1042/BSR20160177
9. McCormick, MA, and Promislow, DE. Recent advances in the systems biology of aging. Antioxid Redox Signal. (2018) 29:973–84. doi: 10.1089/ars.2017.7367
10. Melzer, D, Pilling, LC, and Ferrucci, L. The genetics of human ageing. Nat Rev Genet. (2020) 21:88–101. doi: 10.1038/s41576-019-0183-6
11. Tacutu, R, Thornton, D, Johnson, E, Budovsky, A, Barardo, D, Craig, T, et al. Human ageing genomic resources: new and updated databases. Nucleic Acids Res. (2018) 46:D1083–90. doi: 10.1093/nar/gkx1042
12. López-Otín, C, Blasco, MA, Partridge, L, Serrano, M, and Kroemer, G. The hallmarks of aging. Cell. (2013) 153:1194–217. doi: 10.1016/j.cell.2013.05.039
13. López-Otín, C, Blasco, MA, Partridge, L, Serrano, M, and Kroemer, G. Hallmarks of aging: an expanding universe. Cell. (2023) 186:243–78. doi: 10.1016/j.cell.2022.11.001
14. Schwanhäusser, B, Busse, D, Li, N, Dittmar, G, Schuchhardt, J, Wolf, J, et al. Global quantification of mammalian gene expression control. Nature. (2011) 473:337–42. doi: 10.1038/nature10098
15. La Manno, G, Soldatov, R, Zeisel, A, Braun, E, Hochgerner, H, Petukhov, V, et al. RNA velocity of single cells. Nature. (2018) 560:494–8. doi: 10.1038/s41586-018-0414-6
16. Hoffmann, M, Fröhner, C, and Noé, F. Reactive SINDy: discovering governing reactions from concentration data. J Chem Phys. (2019) 150:025101. doi: 10.1063/1.5066099
17. Badia-i-Mompel, P, Wessels, L, Müller-Dott, S, Trimbour, R, Ramirez Flores, RO, Argelaguet, R, et al. Gene regulatory network inference in the era of single-cell multi-omics. Nat Rev Genet. (2023) 24:739–54. doi: 10.1038/s41576-023-00618-5
18. Chuang, HY, Hofree, M, and Ideker, T. A decade of systems biology. Annu Rev Cell Dev Biol. (2010) 26:721–44. doi: 10.1146/annurev-cellbio-100109-104122
19. Shin, D, and Cho, KH. Critical transition and reversion of tumorigenesis. Exp Mol Med. (2023) 55:692–705. doi: 10.1038/s12276-023-00969-3
20. Wysocka, M, Wysocki, O, Zufferey, M, Landers, D, and Freitas, A. A systematic review of biologically-informed deep learning models for cancer: fundamental trends for encoding and interpreting oncology data. BMC Bioinf. (2023) 24:198–31. doi: 10.1186/s12859-023-05262-8
21. Kogan, V, Molodtsov, I, Menshikov, LI, Reis, RJS, and Fedichev, P. Stability analysis of a model gene network links aging, stress resistance and negligible senescence. Sci Rep. (2015) 5:13589. doi: 10.1038/srep13589
22. Galvis, D, Walsh, D, Harries, LW, Latorre, E, and Rankin, J. A dynamical systems model for the measurement of cellular senescence. J R Soc Interface. (2019) 16:20190311. doi: 10.1098/rsif.2019.0311
23. Choo, SM, Ban, B, Joo, JI, and Cho, KH. The phenotype control kernel of a biomolecular regulatory network. BMC Syst Biol. (2018) 12:49–15. doi: 10.1186/s12918-018-0576-8
24. Schwab, JD, Siegle, L, Kühlwein, SD, Kühl, M, and Kestler, HA. Stability of signaling pathways during aging—a Boolean network approach. Biology. (2017) 6:46. doi: 10.3390/biology6040046
25. Schwab, JD, Ikonomi, N, Werle, SD, Weidner, FM, Geiger, H, and Kestler, HA. Reconstructing Boolean network ensembles from single-cell data for unraveling dynamics in the aging of human hematopoietic stem cells. Comput Struct Biotechnol J. (2021) 19:5321–32. doi: 10.1016/j.csbj.2021.09.012
26. Al Qazlan, TA, Hamdi-Cherif, A, and Kara-Mohamed, C. State of the art of fuzzy methods for gene regulatory networks inference. Sci World J. (2015) 2015:1–11. doi: 10.1155/2015/148010
27. Raza, K . Fuzzy logic-based approaches for gene regulatory network inference. Artif Intell Med. (2019) 97:189–203. doi: 10.1016/j.artmed.2018.12.004
28. Aldridge, BB, Saez-Rodriguez, J, Muhlich, JL, Sorger, PK, and Lauffenburger, DA. Fuzzy logic analysis of kinase pathway crosstalk in TNF/EGF/insulin-induced signaling. PLoS Comput Biol. (2009) 5:e1000340. doi: 10.1371/journal.pcbi.1000340
29. Poblete, CM, Parra, FV, Gomez, JB, Saldias, MC, Garrido, SS, and Vargas, HM. Fuzzy logic in genetic regulatory network models. Int. J. Comput. Commun. Control. (2009) 4:363–73. doi: 10.15837/ijccc.2009.4.2453
30. Linde, J, Schulze, S, Henkel, SG, and Guthke, R. Data-and knowledge-based modeling of gene regulatory networks: an update. EXCLI J. (2015) 14:346. doi: 10.17179/excli2015-168
31. Hackett, SR, Baltz, EA, Coram, M, Wranik, BJ, Kim, G, Baker, A, et al. Learning causal networks using inducible transcription factors and transcriptome-wide time series. Mol Syst Biol. (2020) 16:e9174. doi: 10.15252/msb.20199174
32. Li, CW, Wang, WH, and Chen, BS. Investigating the specific core genetic-and-epigenetic networks of cellular mechanisms involved in human aging in peripheral blood mononuclear cells. Oncotarget. (2016) 7:8556–79. doi: 10.18632/oncotarget.7388
33. Zhang, XM, Liang, L, Liu, L, and Tang, MJ. Graph neural networks and their current applications in bioinformatics. Front Genet. (2021) 12:690049. doi: 10.3389/fgene.2021.690049
34. Jordan, DJ, and Miska, EA. Canalisation and plasticity on the developmental manifold of Caenorhabditis elegans. Mol Syst Biol. (2023) 19:e11835. doi: 10.15252/msb.202311835
35. Salameh, Y, Bejaoui, Y, and El Hajj, N. DNA methylation biomarkers in aging and age-related diseases. Front Genet. (2020) 11:171. doi: 10.3389/fgene.2020.00171
36. Hannum, G, Guinney, J, Zhao, L, Zhang, LI, Hughes, G, Sadda, S, et al. Genome-wide methylation profiles reveal quantitative views of human aging rates. Mol Cell. (2013) 49:359–67. doi: 10.1016/j.molcel.2012.10.016
37. Horvath, S . DNA methylation age of human tissues and cell types. Genome Biol. (2013) 14:R115–20. doi: 10.1186/gb-2013-14-10-r115
38. Levine, ME, Lu, AT, Quach, A, Chen, BH, Assimes, TL, Bandinelli, S, et al. An epigenetic biomarker of aging for lifespan and healthspan. Aging (Albany NY). (2018) 10:573–91. doi: 10.18632/aging.101414
39. Belsky, DW, Caspi, A, Corcoran, DL, Sugden, K, Poulton, R, Arseneault, L, et al. DunedinPACE, a DNA methylation biomarker of the pace of aging. eLife. (2022) 11:e73420. doi: 10.7554/eLife.73420
40. Rappoport, N, and Shamir, R. Multi-omic and multi-view clustering algorithms: review and cancer benchmark. Nucleic Acids Res. (2018) 46:10546–62. doi: 10.1093/nar/gky889
41. Rohart, F, Gautier, B, Singh, A, and Lê Cao, K-A. mixOMICS: an R package for 'OMICS feature selection and multiple data integration. PLoS Comput Biol. (2017) 13:e1005752. doi: 10.1371/journal.pcbi.1005752
42. Thévenot, EA, Roux, A, Xu, Y, Ezan, E, and Junot, C. Analysis of the human adult urinary metabolome variations with age, body mass index, and gender by implementing a comprehensive workflow for univariate and OPLS statistical analyses. J Proteome Res. (2015) 14:3322–35. doi: 10.1021/acs.jproteome.5b00354
43. Argelaguet, R, Velten, B, Arnol, D, Dietrich, S, Zenz, T, Marioni, JC, et al. Multi-omics factor analysis—a framework for unsupervised integration of multi-omics data sets. Mol Syst Biol. (2018) 14:e8124. doi: 10.15252/msb.20178124
44. Picard, M, Scott-Boyer, MP, Bodein, A, Périn, O, and Droit, A. Integration strategies of multi-omics data for machine learning analysis. Comput Struct Biotechnol J. (2021) 19:3735–46. doi: 10.1016/j.csbj.2021.06.030
45. Argelaguet, R, Arnol, D, Bredikhin, D, Deloro, Y, Velten, B, Marioni, JC, et al. MOFA+: a statistical framework for comprehensive integration of multi-modal single-cell data. Genome Biol. (2020) 21:111–7. doi: 10.1186/s13059-020-02015-1
46. Koutrouli, M, Karatzas, E, Paez-Espino, D, and Pavlopoulos, GA. A guide to conquer the biological network era using graph theory. Front Bioeng Biotechnol. (2020) 8:34. doi: 10.3389/fbioe.2020.00034
47. Freitas, JANLF, and Bischof, O. Dynamic modeling of the cellular senescence gene regulatory network. Heliyon. (2023) 9:e14007. doi: 10.1016/j.heliyon.2023.e14007
48. Froese, N, Cordero, J, Abouissa, A, Trogisch, FA, Grein, S, Szaroszyk, M, et al. Analysis of myocardial cellular gene expression during pressure overload reveals matrix based functional intercellular communication. iScience. (2022) 25:103965. doi: 10.1016/j.isci.2022.103965
49. Malod-Dognin, N, Petschnigg, J, Windels, SF, Povh, J, Hemingway, H, Ketteler, R, et al. Towards a data-integrated cell. Nat Commun. (2019) 10:805. doi: 10.1038/s41467-019-08797-8
50. Son, M, Frank, T, Holst-Hansen, T, Wang, AG, Junkin, M, Kashaf, SS, et al. Spatiotemporal NF-κB dynamics encodes the position, amplitude, and duration of local immune inputs. Sci Adv. (2022) 8:eabn6240. doi: 10.1126/sciadv.abn6240
51. Martínez-Zamudio, RI, Roux, PF, de Freitas, JAN, Robinson, L, Doré, G, Sun, B, et al. AP-1 imprints a reversible transcriptional programme of senescent cells. Nat Cell Biol. (2020) 22:842–55. doi: 10.1038/s41556-020-0529-5
52. Martínez-Zamudio, RI, Stefa, A, Freitas, JANLF, Vasilopoulos, T, Simpson, M, Doré, G, et al. Escape from oncogene-induced senescence is controlled by POU2F2 and memorized by chromatin scars. Cell Genomics. (2023) 3:100293–30. doi: 10.1016/j.xgen.2023.100293
53. Thigamine, K, Freitas, JANLF, Nemazanyy, I, Bankolé, A, Benarroch-Popivker, D, Brodesser, S, et al. A homeostatic switch causing glycerol-3-phosphate and phosphoethanolamine accumulation triggers senescence by rewiring lipid metabolism. Nat Metab. (2024) 6:323–42. doi: 10.1038/s42255-023-00972-y
54. The Tabula Muris Consortium . A single-cell transcriptomic atlas characterizes ageing tissues in the mouse. Nature. (2020) 583:590–5. doi: 10.1038/s41586-020-2496-1
55. Uyar, B, Palmer, D, Kowald, A, Escobar, HM, Barrantes, I, Möller, S, et al. Single-cell analyses of aging, inflammation and senescence. Ageing Res Rev. (2020) 64:101156. doi: 10.1016/j.arr.2020.101156
56. Wang, R, Zhang, P, Wang, J, Ma, L, Weigao, E, Suo, S, et al. Construction of a cross-species cell landscape at single-cell level. Nucleic Acids Res. (2023) 51:501–16. doi: 10.1093/nar/gkac633
57. Yu, Q, Jiang, M, and Wu, L. Spatial transcriptomics technology in cancer research. Front Oncol. (2022) 12:1019111. doi: 10.3389/fonc.2022.1019111
58. Klaus, VS, Schriever, SC, Kuhn, JMM, Peter, A, Irmler, M, Tokarz, J, et al. Correlation guided network integration (CoNI) reveals novel genes affecting hepatic metabolism. Mol Metab. (2021) 53:101295. doi: 10.1016/j.molmet.2021.101295
59. Huang, X, Bajpai, AK, Sun, J, Xu, F, Lu, L, and Yousefi, S. A new gene-scoring method for uncovering novel glaucoma-related genes using non-negative matrix factorization based on RNA-seq data. Front Genet. (2023a) 14:1204909. doi: 10.3389/fgene.2023.1204909
60. Zeng, Z, Vo, AH, Mao, C, Clare, SE, Khan, SA, and Luo, Y. Cancer classification and pathway discovery using non-negative matrix factorization. J Biomed Inform. (2019) 96:103247. doi: 10.1016/j.jbi.2019.103247
61. Huang, X, Song, C, Zhang, G, Li, Y, Zhao, Y, Zhang, Q, et al. scGRN: a comprehensive single-cell gene regulatory network platform of human and mouse. Nucleic Acids Res. (2023b) 52:D293–303. doi: 10.1093/nar/gkad885
62. Ren, X, and Kuan, PF. RNAAgeCalc: A multi-tissue transcriptional age calculator. PLoS One. (2020) 15:e0237006. doi: 10.1371/journal.pone.0237006
63. Sachs, K, Perez, O, Pe'er, D, Lauffenburger, DA, and Nolan, GP. Causal protein-signaling networks derived from multiparameter single-cell data. Science. (2005) 308:523–9. doi: 10.1126/science.1105809
64. Lachmann, A, Giorgi, FM, Lopez, G, and Califano, A. ARACNe-AP: gene network reverse engineering through adaptive partitioning inference of mutual information. Bioinformatics. (2016) 32:2233–5. doi: 10.1093/bioinformatics/btw216
65. Rao, M, Wang, X, Guo, G, Wang, L, Chen, S, Yin, P, et al. Resolving the intertwining of inflammation and fibrosis in human heart failure at single-cell level. Basic Res Cardiol. (2021) 116:55–19. doi: 10.1007/s00395-021-00897-1
66. Wang, W, Vilella, F, Alama, P, Moreno, I, Mignardi, M, Isakova, A, et al. Single-cell transcriptomic atlas of the human endometrium during the menstrual cycle. Nat Med. (2020) 26:1644–53. doi: 10.1038/s41591-020-1040-z
67. Wang, K, Saito, M, Bisikirska, BC, Alvarez, MJ, Lim, WK, Rajbhandari, P, et al. Genome-wide identification of post-translational modulators of transcription factor activity in human B cells. Nat Biotechnol. (2009) 27:829–37. doi: 10.1038/nbt.1563
68. Okada, D, Cheng, JH, Zheng, C, Kumaki, T, and Yamada, R. Data-driven identification and classification of nonlinear aging patterns reveals the landscape of associations between DNA methylation and aging. Hum Genomics. (2023) 17:8. doi: 10.1186/s40246-023-00453-z
69. Konrath, F, Willenbrock, M, Busse, D, Scheidereit, C, and Wolf, J. A computational model of the DNA damage-induced IKK/NF-κB pathway reveals a critical dependence on irradiation dose and PARP-1. BioRxiv. (2023) 26:107917. doi: 10.1016/j.isci.2023.107917
70. Li, W, Zhao, L, and Wang, J. Searching for the mechanisms of mammalian cellular aging through underlying gene regulatory networks. Front Genet. (2020) 11:593. doi: 10.3389/fgene.2020.00593
71. Kurata, H, Maeda, K, Onaka, T, and Takata, T. BioFNet: biological functional network database for analysis and synthesis of biological systems. Brief Bioinform. (2014) 15:699–709. doi: 10.1093/bib/bbt048
72. Dyson, J, Villella-Bressan, R, and Webb, G. A spatial model of tumor growth with cell age, cell size, and mutation of cell phenotypes. Math Modell Nat Phenom. (2007) 2:69–100. doi: 10.1051/mmnp:2007004
73. Kuppe, C, Ramirez Flores, RO, Li, Z, Hayat, S, Levinson, RT, Liao, X, et al. Spatial multi-omic map of human myocardial infarction. Nature. (2022) 608:766–77. doi: 10.1038/s41586-022-05060-x
74. Driever, W, and Nüsslein-Volhard, C. The bicoid protein determines the position in the Drosophila embryo in a concentration-dependent manner. Cell. (1988) 54:95–104. doi: 10.1016/0092-8674(88)90183-3
75. Mousavi, R, and Lobo, D. Automatic design of gene regulatory mechanisms for spatial pattern formation. NPJ Syst Biol Appl. (2024) 10:35. doi: 10.1038/s41540-024-00361-5
76. Grodstein, J, McMillen, P, and Levin, M. Closing the loop on morphogenesis: a mathematical model of morphogenesis by closed-loop reaction-diffusion. Front Cell Dev Biol. (2023) 11:1087650. doi: 10.3389/fcell.2023.1087650
77. Turing, AM . The chemical basis of morphogenesis. Phil Trans R Soc Lond B. (1952) 237:37–72. doi: 10.1098/rstb.1952.0012
79. Maini, PK, Woolley, TE, Baker, RE, Gaffney, EA, and Lee, SS. Turing's model for biological pattern formation and the robustness problem. Interface Focus. (2012) 2:487–96. doi: 10.1098/rsfs.2011.0113
80. Lagemann, K, Lagemann, C, Taschler, B, and Mukherjee, S. Deep learning of causal structures in high dimensions under data limitations. Nat Mach Intell. (2023) 5:1306–16. doi: 10.1038/s42256-023-00744-z
81. Russakovsky, O, Deng, J, Su, H, Krause, J, Satheesh, S, Ma, S, et al. Imagenet large scale visual recognition challenge. Int J Comput Vis. (2015) 115:211–52. doi: 10.1007/s11263-015-0816-y
82. Chen, Y, Wang, Y, Chen, Y, Cheng, Y, Wei, Y, Li, Y, et al., Deep autoencoder for interpretable tissue-adaptive deconvolution and cell-type-specific gene analysis. Nat. Commun. (2022) 13, 6735. doi: 10.1038/s41467-022-34550-9
83. Qiu, W, Chen, H, Kaeberlein, M, and Lee, S. I. ExplaiNAble BioLogical Age (ENABL Age): an artificial intelligence framework for interpretable biological age. The Lancet Healthy Longevity. (2023) 4, e711–e723. doi: 10.1016/S2666-7568(23)00189-7
84. Holzscheck, N, Falckenhayn, C, Söhle, J, Kristof, B, Siegner, R, Werner, A, et al. Modeling transcriptomic age using knowledge-rimed artificial neural networks. npj Aging and Mechanisms of Disease. (2021) 7, 15. doi: 10.1038/s41514-021-00068-5
85. Tao, W, Yu, Z, and Han, JDJ. Single-cell senescence identification reveals senescence heterogeneity, trajectory, and modulators. Cell Metab. (2024) 36:1126–1143. doi: 10.1016/j.cmet.2024.03.009
86. Vazquez, J, and Facelli, J. C., Conformal prediction in clinical medical sciences. J. Healthc. Inform. Res. (2022) 6, 241–252. doi: 10.1007/s41666-021-00113-8
87. Sanchez-Vega, F, Mina, M, Armenia, J, Chatila, WK, Luna, A, La, KC, et al. Oncogenic signaling pathways in the cancer genome atlas. Cell. (2018) 173:321–337.e10. doi: 10.1016/j.cell.2018.03.035
88. Ding, L, Bailey, MH, Porta-Pardo, E, Thorsson, V, Colaprico, A, Bertrand, D, et al. Perspective on oncogenic processes at the end of the beginning of cancer genomics. Cell. (2018) 173:305–320.e10. doi: 10.1016/j.cell.2018.03.033
89. Hoadley, KA, Yau, C, Hinoue, T, Wolf, DM, Lazar, AJ, Drill, E, et al. Cell-of-origin patterns dominate the molecular classification of 10,000 tumors from 33 types of cancer. Cell. (2018) 173:291–304.e6. doi: 10.1016/j.cell.2018.03.022
90. Costanzo, MC, von Grotthuss, M, Massung, J, Jang, D, Caulkins, L, Koesterer, R, et al. The type 2 diabetes knowledge portal: an open access genetic resource dedicated to type 2 diabetes and related traits. Cell Metab. (2023a) 35:695–710.e6. doi: 10.1016/j.cmet.2023.03.001
91. Costanzo, MC, Roselli, C, Brandes, M, Duby, M, Hoang, Q, Jang, D, et al. Cardiovascular disease knowledge portal: a community resource for cardiovascular disease research. Circ Genomic Precis Med. (2023b) 16:e004181. doi: 10.1161/CIRCGEN.123.004181
92. Rafikova, E, Nemirovich-Danchenko, N, Ogmen, A, Parfenenkova, A, Velikanova, A, Tikhonov, S, et al. Open genes—a new comprehensive database of human genes associated with aging and longevity. Nucleic Acids Res. (2024) 52:D950–62. doi: 10.1093/nar/gkad712
93. Zappia, L, Phipson, B, and Oshlack, A. Exploring the single-cell RNA-seq analysis landscape with the scRNA-tools database. PLoS Comput Biol. (2018) 14:e1006245. doi: 10.1371/journal.pcbi.1006245
94. Rajewsky, N, Almouzni, G, Gorski, SA, Aerts, S, Amit, I, Bertero, MG, et al. LifeTime and improving European healthcare through cell-based interceptive medicine. Nature. (2020) 587:377–86. doi: 10.1038/s41586-020-2715-9
95. Regev, A, Teichmann, SA, Lander, ES, Amit, I, Benoist, C, Birney, E, et al. The human cell atlas. eLife. (2017) 6:e27041. doi: 10.7554/eLife.27041
96. Thul, PJ, and Lindskog, C. The human protein atlas: a spatial map of the human proteome. Protein Sci. (2017) 27:233–44. doi: 10.1002/pro.3307
97. Karlsson, M, Zhang, C, Méar, L, Zhong, W, Digre, A, Katona, B, et al. A single–cell type transcriptomics map of human tissues. Sci Adv. (2021) 7:eabh2169. doi: 10.1126/sciadv.abh2169
98. Roadmap EpigenOMICS ConsortiumKundaje, A, Meuleman, W, Ernst, J, Bilenky, M, Yen, A, et al. Integrative analysis of 111 reference human epigenomes. Nature. (2015) 518:317–30. doi: 10.1038/nature14248
99. The Tabula Sapiens Consortium*Jones, RC, Karkanias, J, Krasnow, MA, Pisco, AO, Quake, SR, et al. The tabula sapiens: A multiple-organ, single-cell transcriptomic atlas of humans. Science. (2022) 376:eabl4896. doi: 10.1126/science.abl4896
100. Cusanovich, DA, Hill, AJ, Aghamirzaie, D, Daza, RM, Pliner, HA, Berletch, JB, et al. A single-cell atlas of in vivo mammalian chromatin accessibility. Cell. (2018) 174:1309–1324.e18. doi: 10.1016/j.cell.2018.06.052
101. Fei, L, Chen, H, Ma, L, E, W, Wang, R, Fang, X, et al. Systematic identification of cell-fate regulatory programs using a single-cell atlas of mouse development. Nat Genet. (2022) 54:1051–61. doi: 10.1038/s41588-022-01118-8
102. Jiang, M, Xiao, Y, Ma, L, Wang, J, Chen, H, Gao, C, et al. Characterization of the zebrafish cell landscape at single-cell resolution. Front Cell Dev Biol. (2021) 9:743421. doi: 10.3389/fcell.2021.743421
103. Wagner, DE, Weinreb, C, Collins, ZM, Briggs, JA, Megason, SG, and Klein, AM. Single-cell mapping of gene expression landscapes and lineage in the zebrafish embryo. Science. (2018) 360:981–7. doi: 10.1126/science.aar4362
104. Roux, AE, Yuan, H, Podshivalova, K, Hendrickson, D, Kerr, R, Kenyon, C, et al. Individual cell types in C. elegans age differently and activate distinct cell-protective responses. Cell Rep. (2023) 42:112902. doi: 10.1016/j.celrep.2023.112902
105. Packer, JS, Zhu, Q, Huynh, C, Sivaramakrishnan, P, Preston, E, Dueck, H, et al. A lineage-resolved molecular atlas of C. elegans embryogenesis at single-cell resolution. Science. (2019) 365:eaax1971. doi: 10.1126/science.aax1971
106. Siebert, S, Farrell, JA, Cazet, JF, Abeykoon, Y, Primack, AS, Schnitzler, CE, et al. Stem cell differentiation trajectories in Hydra resolved at single-cell resolution. Science. (2019) 365:eaav9314. doi: 10.1126/science.aav9314
107. Plass, M, Solana, J, Wolf, FA, Ayoub, S, Misios, A, Glažar, P, et al. Cell type atlas and lineage tree of a whole complex animal by single-cell transcriptomics. Science. (2018) 360:eaaq1723. doi: 10.1126/science.aaq1723
108. Brown, T, Mann, B, Ryder, N, Subbiah, M, Kaplan, JD, Dhariwal, P, et al.,. Language models are few-shot learners. Adv. Neural Inf. Process. Syst. (2020) 33, 1877–1901.
109. Tejada-Martinez, D, De Magalhães, JP, and Opazo, JC. Positive selection and gene duplications in tumour suppressor genes reveal clues about how cetaceans resist cancer. Proc R Soc B. (2021) 288:20202592. doi: 10.1098/rspb.2020.2592
110. Mah, JL, and Dunn, CW. Cell type evolution reconstruction across species through cell phylogenies of single-cell RNA sequencing data. Nature Ecology & Evolution. (2024) 1–14. doi: 10.1038/s41559-023-02281-9
111. Wang, T, Du, Y, Gong, Y, Choo, KKR, and Guo, Y. Applications of federated learning in mobile health: scoping review. J Med Internet Res. (2023) 25:e43006. doi: 10.2196/43006
112. Brunton, S. L., and Kutz, J. N. (2022). “The diversity of neural networks”, in Data-driven science and engineering: machine learning, dynamical systems, and control (Cambridge: Cambridge University Press), 291–299. Available at: https://web.archive.org/web/20230621143644/https://faculty.washington.edu/sbrunton/DataBookV2.pdf (Accessed April 18, 2024).
113. Wassan, JT, Zheng, H, and Wang, H. Role of deep learning in predicting aging-related diseases: a scoping review. Cells. (2021) 10:2924. doi: 10.3390/cells10112924
114. Zhang, MJ, Pisco, AO, Darmanis, S, and Zou, J. Mouse aging cell atlas analysis reveals global and cell type-specific aging signatures. eLife. (2021) 10:e62293. doi: 10.7554/eLife.62293
116. He, K., Zhang, X., Ren, S., and Sun, J. Deep residual learning for image recognition. In 2016 IEEE conference on computer vision and pattern recognition (CVPR) (pp. 770–778). IEEE; (2016).
117. Cao, Y, Liu, W, Zhang, S, Xu, L, Zhu, B, Cui, H, et al. Detection and localization of myocardial infarction based on multi-scale resnet and attention mechanism. Front Physiol. (2022) 13:783184. doi: 10.3389/fphys.2022.783184
118. Habijan, M, Galić, I, Leventić, H, and Romić, K. Whole heart segmentation using 3d fm-pre-resnet encoder–decoder based architecture with variational autoencoder regularization. Appl Sci. (2021) 11:3912. doi: 10.3390/app11093912
119. Harrer, S . Attention is not all you need: the complicated case of ethically using large language models in healthcare and medicine. EBioMedicine. (2023) 90:104512. doi: 10.1016/j.ebiom.2023.104512
120. Vaswani, A, Shazeer, N, Parmar, N, Uszkoreit, J, Jones, L, Gomez, AN, et al. Attention is all you need. Adv Neural Inf Proces Syst. (2017) 30. doi: 10.48550/arXiv.1706.03762
121. Li, C, Wang, Q, Liu, X, and Hu, B. An attention-based CoT-ResNet with channel shuffle mechanism for classification of alzheimers disease levels. Frontiers in Aging Neuroscience. (2022) 14, 930584. doi: 10.3389/fnagi.2022.930584
122. Ma, S, Wang, H, Ma, L, Wang, L, Wang, W, Huang, S, et al. The era of 1-bit LLMs: all large language models are in 1.58 bits. arXiv [Preprint]. (2024). doi: 10.48550/arXiv.2402.17764
123. Truong-Quoc, C, Lee, JY, Kim, KS, and Kim, DN. Prediction of DNA origami shape using graph neural network. Nat Mater. (2024):1–9. doi: 10.1038/s41563-024-01846-8
124. Inácio, MHDA, Shah, M, Jafari, M, Shehata, N, Meng, Q, Bai, W, et al. Cardiac age prediction using graph neural networks. MedRxiv [Preprint]. (2023). doi: 10.1101/2023.04.19.23287590
125. Gao, J, Liu, J, Xu, Y, Peng, D, and Wang, Z. Brain age prediction using the graph neural network based on resting-state functional MRI in Alzheimer's disease. Front Neurosci. (2023) 17:1222751. doi: 10.3389/fnins.2023.1222751
126. Papillon, M, Sanborn, S, Hajij, M, and Miolane, N. Architectures of topological deep learning: A survey on topological neural networks. arXiv [preprint]. (2023). doi: 10.48550/arXiv.2304.10031
127. Shah, M, de A Inácio, MH, Lu, C, Schiratti, PR, Zheng, SL, Clement, A, et al. Environmental and genetic predictors of human cardiovascular ageing. Nat Commun. (2023) 14:4941. doi: 10.1038/s41467-023-40566-6
128. Huang, Y, Xu, J, Zhou, Y, Tong, T, and Zhuang, XAlzheimer’s Disease Neuroimaging Initiative (ADNI). Diagnosis of Alzheimer’s disease via multi-modality 3D convolutional neural network. Front Neurosci. (2019) 13:509. doi: 10.3389/fnins.2019.00509
129. Acosta, JN, Falcone, GJ, Rajpurkar, P, and Topol, EJ. Multimodal biomedical AI. Nat Med. (2022) 28:1773–84. doi: 10.1038/s41591-022-01981-2
130. Casella, B, Riviera, W, Aldinucci, M, and Menegaz, G. MERGE: A model for multi-input biomedical federated learning. Patterns. (2023) 4:100856. doi: 10.1016/j.patter.2023.100856
131. Kalra, S, Wen, J, Cresswell, JC, Volkovs, M, and Tizhoosh, HR. Decentralized federated learning through proxy model sharing. Nat Commun. (2023) 14:2899. doi: 10.1038/s41467-023-38569-4
132. Zhang, Y., Xiang, T., Hospedales, T. M., and Lu, H. (2018). Deep mutual learning. In Proc IEEE Conference on Computer Vision and Pattern Recognition, 4320–4328. doi: 10.1109/CVPR.2018.00454
133. Huang, S . The molecular and mathematical basis of Waddington's epigenetic landscape: a framework for post-Darwinian biology? BioEssays. (2012) 34:149–57. doi: 10.1002/bies.201100031
134. Mc Auley, MT, and Mooney, KM. Computational systems biology for aging research. Interdiscip Top Gerontol. (2015) 40:35–48. doi: 10.1159/000364928
135. Tyson, JJ, and Novak, B. A dynamical paradigm for molecular cell biology. Trends Cell Biol. (2020) 30:504–15. doi: 10.1016/j.tcb.2020.04.002
136. Ni, SH, Xu, JD, Sun, SN, Li, Y, Zhou, Z, Li, H, et al. Single-cell transcriptomic analyses of cardiac immune cells reveal that Rel-driven CD72-positive macrophages induce cardiomyocyte injury. Cardiovasc Res. (2022) 118:1303–20. doi: 10.1093/cvr/cvab193
137. Bergen, V, Soldatov, RA, Kharchenko, PV, and Theis, FJ. RNA velocity—current challenges and future perspectives. Mol Syst Biol. (2021) 17:e10282. doi: 10.15252/msb.202110282
138. Sinha, KK, Bilokapic, S, Du, Y, Malik, D, and Halic, M. Histone modifications regulate pioneer transcription factor cooperativity. Nature. (2023) 619:378–84. doi: 10.1038/s41586-023-06112-6
Keywords: aging, cellular senescence, gene-regulatory network, systems biology, computational modeling
Citation: Freitas JANLF and Bischof O (2024) Computational modeling of aging-related gene networks: a review. Front. Appl. Math. Stat. 10:1380996. doi: 10.3389/fams.2024.1380996
Edited by:
Felix Sadyrbaev, University of Latvia, LatviaReviewed by:
Jiajia Liu, University of Texas Health Science Center at Houston, United StatesAmartya Singh, The State University of New Jersey, United States
Copyright © 2024 Freitas and Bischof. This is an open-access article distributed under the terms of the Creative Commons Attribution License (CC BY). The use, distribution or reproduction in other forums is permitted, provided the original author(s) and the copyright owner(s) are credited and that the original publication in this journal is cited, in accordance with accepted academic practice. No use, distribution or reproduction is permitted which does not comply with these terms.
*Correspondence: José Américo Nabuco Leva Ferreira Freitas, am9zZS1hbWVyaWNvLm5hYnVjby1sZXZhQGluc2VybS5mcg==; Oliver Bischof, b2xpdmVyLmJpc2Nob2ZAY25ycy5mcg==