
94% of researchers rate our articles as excellent or good
Learn more about the work of our research integrity team to safeguard the quality of each article we publish.
Find out more
ORIGINAL RESEARCH article
Front. Appl. Math. Stat. , 12 January 2024
Sec. Statistical and Computational Physics
Volume 9 - 2023 | https://doi.org/10.3389/fams.2023.1266739
This article is part of the Research Topic Advances in Computational Relativity View all 5 articles
 Lorenzo Speri1*
 Michael L. Katz1,2
 Alvin J. K. Chua3,4*Scott A. Hughes5Niels Warburton6Jonathan E. Thompson7Christian E. A. Chapman-Bird8Jonathan R. Gair1
Extreme Mass Ratio Inspirals (EMRIs) are one of the key sources for future space-based gravitational wave interferometers. Measurements of EMRI gravitational waves are expected to determine the characteristics of their sources with sub-percent precision. However, their waveform generation is challenging due to the long duration of the signal and the high harmonic content. Here, we present the first ready-to-use Schwarzschild eccentric EMRI waveform implementation in the frequency domain for use with either graphics processing units (GPUs) or central processing units (CPUs). We present the overall waveform implementation and test the accuracy and performance of the frequency domain waveforms against the time domain implementation. On GPUs, the frequency domain waveform takes in median 0.044 s to generate and is twice as fast to compute as its time domain counterpart when considering massive black hole masses and initial eccentricities e0 > 0.2. On CPUs, the median waveform evaluation time is 5 s, and it is five times faster in the frequency domain than in the time domain. Using a sparser frequency array can further speed up the waveform generation, reaching up to 0.3 s. This enables us to perform, for the first time, EMRI parameter inference with fully relativistic waveforms on CPUs. Future EMRI models, which encompass wider source characteristics (particularly black hole spin and generic orbit geometries), will require significantly more harmonics. Frequency domain models will be essential analysis tools for these astrophysically realistic and important signals.
The future space-based Laser Interferometer Space Antenna (LISA) will observe gravitational waves in the millihertz regime [1, 2]. This region of the gravitational wave spectrum is rich in sources, including Galactic double white dwarf (WD) binaries [3], massive black hole (MBH) binaries [4], and stellar origin black hole (SOBH) binaries early in their evolution [4, 5]. Another key source class is extreme mass-ratio inspirals (EMRIs) [6]. These are compact binaries with a mass ratio μ/M ≃ 10−4 − 10−6, where μ ~ 1 − 100M⊙ is the mass of the orbiting secondary and is the mass of the MBH. EMRIs are expected to form in dense stellar clusters of galactic nuclei [7, 8], where their detection rate ranges from ~ 1 to 104 per year with observable signal-to-noise ratios (SNR) expected to be ~20 − 1000 over the duration of the signal [9–11]. The details depend on the precise formation mechanism [12–15], but it is anticipated that the majority of EMRIs are expected to have eccentricities at plunge in the range 0 < ep ≲ 0.2, with a long tail extending to larger ep [9]. This is why high-eccentricity EMRIs have some of the richest and most complicated gravitational waveforms of any compact binary system. The small mass ratio of EMRIs also means that they evolve slowly, typically completing ~ 104–105 orbits over years while in the LISA band. The long-lasting, complex waveforms of EMRIs present a substantial challenge for both the modeling of these binaries and the LISA data analysis task [14–21].
Modeling and extracting EMRI signals from the LISA data stream will provide binary system measurements with sub-percent level precision [9]. This precision will enable precise tests of general relativity [22–26]. Additionally, studying EMRIs will enhance our understanding of the mass function of MBHs [27], the dense stellar environments in galactic cores [10], and the gas disks surrounding MBHs [28–34]. Furthermore, gravitational wave signals from EMRIs could be used to constrain cosmological parameters [35, 36] or measure phase calibration errors [37].
Extracting this wealth of information from EMRIs in the LISA data stream poses two significant challenges: accuracy and speed. The former is limited by the waveform modeling accuracy, whereas the latter is limited by the combined computational cost of the waveform generation, the discrete Fourier transform (DFT), and the inner product necessary to compute the likelihood function or any detection statistic. The first attempt to address these problems was presented in the release of the FASTEMRIWAVEFORMS (FEW) computational framework [38, 39], which can compute fully relativistic waveforms rapidly. This package combines a set of standalone modules to create EMRI waveforms on both graphics processing unit (GPU) and central processing unit (CPU) hardware. It was shown that the GPU version is ≈ 2500 times faster than its CPU counterpart for Schwarzschild spacetimes. GPUs are designed with a large number of cores and specialized hardware that allows them to perform multiple tasks simultaneously, making them highly efficient in handling parallel processing tasks. Compared with CPUs, which typically have fewer cores, GPUs can process a much larger number of tasks concurrently, resulting in significantly improved performance for certain applications. GPUs are particularly well suited to efficient EMRI waveform generation because these signals consist of a large number of harmonic modes that are summed in parallel.
The waveform generation in FEW is currently performed in the time domain (TD), with typical speeds using GPUs and CPUs on the order of tens of milliseconds and tens of seconds, respectively. For GPUs, the computational costs of the likelihood are negligible (less than a millisecond), therefore making the waveform generation the bottleneck of the computations. However, for CPUs, all of the aforementioned operations contribute significantly to the overall data analysis cost. We expect that a frequency domain implementation of EMRI waveforms would reduce the likelihood evaluation cost. However, it is not immediately clear how the frequency domain implementation of the EMRI waveforms would comparatively perform on GPUs and CPUs.
In this study, we expand upon the FEW package by implementing a frequency domain (FD) EMRI waveform based on Hughes et al. [40]. We provide a module that can compute EMRI waveforms for eccentric inspirals into a non-rotating black hole at adiabatic order [40, 41]. The implementation supports use with both CPUs and GPUs, and its accuracy and performance are explored. This study is fully reproducible using the software provided at https://github.com/lorenzsp/EMRI_FrequencyDomainWaveforms.
The study is organized as follows. We review the general construction of EMRI waveforms in Section 2.1, and we discuss the frequency domain implementation in Section 2.2. In Section 2.3, we present the data analysis tools that are used to test the accuracy of the waveform generation. Finally, in Section 3, we present the results for the performance and accuracy tests of the frequency domain implementation.
The gravitational waves emitted by an EMRI are among the most complicated compact binary signals due to their long duration and rich harmonic content. This complexity stems from the dynamics of the secondary object inspiralling into the central MBH. Such orbits are characterized by three degrees of freedom associated with the dimensionless fundamental frequencies of Kerr geodesic orbits Ωr, θ, ϕ [42, 43]. These quantities are determined by the dimensionless spin magnitude of the MBH a and the quasi-Keplerian orbital parameters of p (semi-latus rectum or separation in units of M), e (eccentricity), and xI ≡ cosI (cosine of the angle I which describes the inclination of the orbit from the equatorial plane). At adiabatic order, for a given system with primary mass M, secondary mass μ, initial orbital parameters (p0, e0, xI0), and initial phases Φφ0, Φθ0, Φr0, the orbital evolution can be determined by solving the following system of ordinary differential equations:
The orbital-element fluxes fp, e,xI account for the gravitational wave emission and are interpolated from pre-computed grids. In the FEW package, the system of ordinary differential equations is solved using an explicit embedded Runge-Kutta Prince-Dormand (8, 9) method with adaptive step size [see gsl_odeiv2_step_rk8pd in Galassi [44]], resulting in sparse orbital trajectories of ~ 100 data points in length.
Once the trajectory is fully specified by {p(t), e(t), xI(t), Φφ(t), Φθ(t), Φr(t)}, we compute the complex gravitational-wave amplitudes Almkn(p(t), e(t), xI(t)). Each amplitude mode is associated with the multipole l of the radiation and the harmonic {m, n, k} of the fundamental orbital frequencies, where m, k, and n label the azimuthal, polar, and radial modes, respectively. In the FEW package, the amplitudes and phases are interpolated using a “not-a-knot” cubic spline to handle the large number of modes using a sparse number of points. Cubic splines are the simplest polynomial basis spline suitable for our purposes because they provide an approximation of the second derivative of frequency with respect to time. Higher order spline functions are more expensive and might overfit data as sparsely evaluated as our trajectory information. Additionally, the root-finding procedure that will be used in constructing the time-frequency correspondence in Eq. 6 is significantly more expensive for higher order polynomials due to the need to perform this task numerically. In the interest of computational efficiency, we control the number of harmonic modes with a further mode-selection step. The mode-selection step is defined by the threshold ϵ of the total power emitted by all modes. Within each time step of the sparse array, we take and sort the individual modes in descending order and compute a cumulative summation. From this sorted array, we check whether the additional power contributed to an individual mode falls below the threshold ϵ related to the total power emitted. This gives a set of contributing modes within each time step. The selected modes are given by the union of all contributing modes across all time steps. This ensures to maintain continuity across time. Only the modes that pass this threshold are included in the waveform computation [see Katz et al. [39] for further details].
The gravitational wave signal at a large distance from the source can be represented in terms of the complex time-domain dimensionless strain [40]:
where t is the time of arrival of the gravitational wave at the Solar System barycenter, θ is the source-frame polar viewing angle, ϕ is the source-frame azimuthal viewing angle, and dL is the luminosity distance of the source. The functions Slmkn(t, θ) are spin-weighted spheroidal harmonics. For inspiral into a Schwarzschild black hole (the focus of this analysis), these functions are identical to the spin-weighted spherical harmonics. For the general Kerr case, they differ from the spherical harmonics (though they can be very usefully expanded into spherical harmonics [45]), and in particular, they depend on the orbital frequencies. Because the orbital frequencies evolve with time, the spheroidal harmonics evolve as well [40], complicating the description of the waveform. Future studies will describe how we handle this complication. In any case, the usual transverse-traceless gravitational wave polarizations can be obtained from the real and imaginary parts of the complex conjugate of h.
A key element to be noted in Eq. 1 is that the EMRI waveform can be viewed as a sum of simple “voices”, where each voice corresponds to a mode (l, m, k, n). The time-domain waveform can thus be rewritten in terms of a sum over voices V:
where each voice is characterized by a complex amplitude HV(t) and a phase ΦV(t). The voice-by-voice decomposition was suggested to one of the present authors by L. S. Finn and first presented in Hughes [46].1 In this study, we provide the first ready-to-use implementation of this decomposition for frequency-domain EMRI waveforms.
EMRI waveforms can be represented in the frequency domain by using the stationary phase approximation. Because amplitude, phase, and frequency in an EMRI evolve slowly (as long as the two-timescale approximation is valid [48]), we expect the stationary phase approximation (SPA) to provide a high-quality approximation to the Fourier transform of the signal [49]. Here, we review the computation of the Fourier transform of an EMRI waveform in the frequency domain presented in the study by Hughes et al. [40]. We begin by taking the Fourier transform of each voice of Eq. 2 as follows:
where we have not written the subscript for ease of notation. To compute the stationary phase approximation to the signal, it is necessary to expand the phase evolution, written as
where
We have introduced the instantaneous frequency of the signal and the instantaneous first and second derivatives of the frequency at the stationary time t = tS for which F = f. We expanded up to third order in the phase evolution because for some voices, the frequency evolution is not monotonic. If the frequency derivative vanishes (Ḟ = 0), the standard SPA Fourier transform is singular and cannot be used [50]. This is highly relevant to EMRI signals because the frequency associated with many voices rises to a maximum and then decreases. In particular, this occurs for EMRI voices which involve harmonics of the radial frequency. This is because Ωr becomes very small (approaching |Ωϕ|) in the weak-field limit and goes to zero as systems approach the last stable orbit; a maximum of Ωr exists between these two “small” limits.
We now use Eq. 4 to obtain the time-frequency correspondence for each voice, i.e., we find the time t such that F(t) = f. The frequency evolution of each voice F(t) = (mΩφ(t)+kΩθ(t)+nΩr(t))/(2πM) is directly obtained from the trajectory evolution of each of the fundamental frequencies. During the waveform production process, the fundamental frequency evolution is interpolated with a cubic spline, allowing for a good approximation using a third-order polynomial. Doing so, the condition f = F(t) between two knots can be rewritten as:
where A, B, C, and D are real numbers given by the sum of the spline coefficients of three frequencies multiplied by their mode number, and ti is the time at the beginning of the spline segment.
The fundamental frequency, fundamental phase, and amplitude spline coefficients are determined along the sparse trajectory prior to the final waveform summation phase [see Katz et al. [39] for more information]. Additionally, using all values of f and each set of frequencies found along the sparse trajectory for each voice, the spline segment, in which each value of f falls, is predetermined before the summation. Once in the summation, the goal is to determine t(f) as efficiently as possible. This is difficult in cases where the voice is not monotonic because t(f) is not a bijective mapping for this case: two values of t can be represented by the same value of f. To address this issue, we solve for the cubic roots of Eq. 6 within each segment, where f is found (one or two segments per voice depending on f). We take the real-valued roots and determine which one or two actually exist between the bounds of the segment, and we are currently examining (it can be two only for the segment in which the turnover occurs). Since the frequency evolution is slowly varying within each segment, the condition Ḟ = 0 cannot occur more than one time per segment. These time values occurring within our segment are then used to determine all necessary quantities for waveform building because all informative splines are fit as a function of t.
We define tj(f) to be the jth time (first or second) at which F(t) = f, and write Ḟj ≡ Ḟ[tj(f)], . These higher order derivatives are also computed using the fundamental frequency spline information. With that, for each value of f for each voice, the Fourier transform can be represented as:
where N ∈ {1, 2} is the number of time values associated with each value of f. To perform this integral, we set α = γ + 2πiḞ, with γ real and positive, define , and use
where Kn(z) is the modified Bessel function of the second type. Taking the limit γ → 0, we find
This result defines our frequency domain waveform. Expanding about “small” , it can be shown that this yields the standard SPA when and N = 1 [see Hughes et al. [40]]. For computational efficiency, we approximate the term with two polynomial expansions in , valid for |X| < 7 and |X| > 7. The largest relative error occurs around the transition region |X| ≈ 7 and is ≈ 10−3. We did not explore the potential of applying this method for calculating other oscillatory integrals [51].
As previously mentioned, this waveform is built into the framework of FEW. All parts of the waveform generation prior to the “waveform summation module” are identical to the original time-domain implementation [39]. The waveform summation described above is implemented for both CPUs and GPUs. For the purposes of GPU parallelization, the summation is grouped by harmonic voice and segment of the splines defined in time. This creates a rectangular computation grid because all spline information occurs on the same sparse time evolution returned from the trajectory integrator yielding a constant number of segments across all spline constituents. On the GPU, we place each segment within each voice on a separate GPU block (larger parallelization unit). Within each block, we use the parallel threads (smaller parallelization unit) to evaluate all values of interest in frequency for that specific voice and segment. The waveform is then constructed by “atomically” adding from each of these blocks and threads to an overall waveform vector stored in GPU global memory.
An EMRI waveform for non-rotating black holes is uniquely determined in the reference frame of the Solar System barycenter by setting the following parameters:
where θS and ϕS are the polar and azimuthal sky location angles given in the Solar System barycenter reference frame, and θK and ϕK are the azimuthal and polar angles describing the orientation of the orbital angular momentum. The relation to the source frame angles θ, ϕ can be found in the study by Katz et al. [39]. We do not include the effect of the detector response function, but we leave this to future studies [52].
We check the performance and accuracy of the FD waveform over the EMRI parameter space confined to , log(μ/M) ∈ [log10−6, log10−4), e0 ∈ [0.001, 0.7), and Φφ0, Φr0 ∈ [0, 2π) by uniformly drawing 5,000 parameter realizations. The initial semi-latus rectum is fixed to obtain an inspiral with a time duration of 0.99T, where T is the duration of the observation. We consider h+ and h× in the Solar System barycenter as our two channels, and we fix {dL = 1Gpc, θS = π/3, ϕS = π/3, θK = π/3, ϕK = π/3} throughout this study. To check our implementation, we quantify how similar two waveforms are using the mismatch2
where we have introduced the inner product ·· of each channel α,
where fi = i/T, with i from 1 up to the total number of frequency bins Nf = N/2 with N number of time points. Notably, we will also consider frequency arrays with spacing different from the one previously mentioned. The tilde indicates the Fourier transform, and Sn(f) is the one-sided noise spectral density for the LISA data streams, which we take from the study by Babak et al. [53]. We use the mismatch to compare the frequency domain implementation with the DFT of the time-domain implementation sampled with a time interval Δt = T/N. The conversion from continuous to discrete samples changes the underlying Fourier transform into the discrete Fourier transform. This leads to a type of distortion called aliasing. The choice of an appropriate time sampling Δt is the key to minimizing such distortion. The Nyquist rate is the maximum resolvable frequency for the DFT of a discrete-time signal, and its value equals 1/(2Δt). When the signal is digitized, we need to make sure that the Nyquist frequency is larger than the largest harmonic frequency FV(t) of the signal, i.e. maxVF(t) < 1/(2Δt), where V = (l, m, n, k). By ensuring this condition, the resulting discrete-time sequence is free of aliasing. Similarly, the conversion from a very long (or infinite) sequence to a manageable size entails a type of distortion called leakage, which is manifested as a loss of resolution in the DFT. We mitigate this effect by applying the Hann window to the time domain waveform [54]. To account for the effect of windowing in the FD waveform, we perform a convolution of the FD signal with the DFT of the window function. We do not maximize over the phase since the initial conditions of the frequency and phase evolution of the TD and FD waveforms are the same by construction. Global relative time and phase shifts are not observable parameters, so by not optimizing over them, we are being conservative with the model and folding data processing into the model comparison.
We show the impact of windowing and spectral leakage in Figure 1 for a system with μ = 10M⊙, , e0 = 0.6, p0 = 9.56 for an observation of T = 1 year, a mode content threshold ϵ = 10−2, and a sampling interval of Δt = 10 s. We show the amplitude squared, , of the frequency domain waveform (dashed orange line) and DFT of the time domain waveform (solid blue line) for the plus polarization in the upper panel of Figure 1. For reference, we also show the LISA sensitivity curve used to calculate the inner products. In the upper panel of Figure 1, we do not apply any windowing, and therefore, the FD waveform is zero only where there is no mode content. Conversely, the DFT of the TD waveform is affected by spectral leakage, especially for frequencies larger than 10−2Hz. If we apply the Hann window consistently to both the FD and TD signals as previously described, we obtain the spectrum shown in the lower panel of Figure 1. The effect of windowing reduces the total power but improves the agreement between the waveforms such that the mismatch decreases from 8 × 10⁻⁴ to 4 × 10⁻⁶.
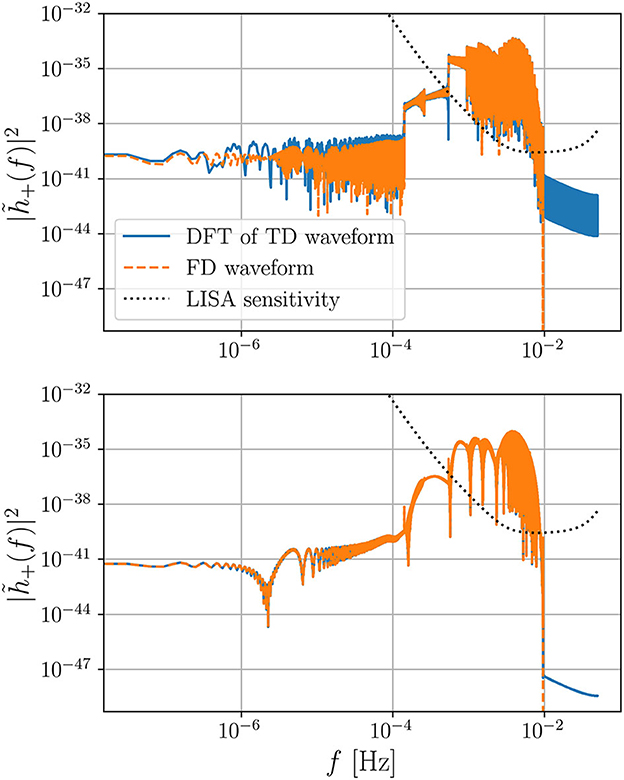
Figure 1. Spectrum of the frequency domain (FD) waveform compared with the spectrum of the discrete Fourier transform (DFT) of the time domain (TD) waveform. In the upper plot, we show the amplitude squared when we do not include any windowing when computing the spectrum of the waveforms. In the lower panel, we apply the Hann window to both the TD and FD waveforms. Note how the windowing helps to resolve the harmonics in the low-frequency region f < 10−4 Hz and reduce the power of the leakage at frequencies f > 10−2 Hz. We consider an EMRI system composed of a secondary object with mass μ = 10M⊙ orbiting around a non-rotating black hole of mass with initial eccentricity e0 = 0.6 and semi-latus rectum p0 = 9.56 fixed such that the inspiral plunges after 1 year of observation.
It is often quoted that the average mismatch for a waveform needs to be 1 − 0.91/3 ≈ 1 − 0.965 to recover 90% of the signals in an experiment [55, 56]. However, the requirements on the mismatch for parameter estimation (PE) studies are not as straightforward to characterize, primarily as there is no one-to-one relationship between the level of mismatch and the level of bias that is incurred during inference. A sensible requirement for a PE study is to ask that the systematic (or mismodeling) error coming from an approximate waveform is lower than the statistical error coming from the noise in the data. While the former is independent of the signal-to-noise ratio (), the latter depends on the SNR, and therefore the mismatch requirement on a waveform for a PE study is SNR-dependent. The mismatch times the SNR2 is approximately half the model waveform error: [57]. Therefore, we perform PE on the system that yields the largest value of .
In particular, we check that the posterior distribution obtained with an FD waveform is equivalent to the one obtained with a TD waveform. To do this, we use the likelihood given by [58]:
where we ignored the normalization factor that needs to be included when fitting for the shape of the noise spectral density Sn. We do not inject any noise in the datastream since we want to check whether any waveform systematic arises due to the difference between the FD and TD implementations. Notably, if we apply a window to our data, we should take into account its effects in the likelihood. In fact, the expectation value of the inner product of the noise n(t) = s(t)−h(t) is different if a window is applied
We do not take into account the effect of windowing in the likelihood because this would lead to a non-diagonal noise covariance matrix and an increase in the computational cost of the inner product. This is not a problem for the purpose of our study because we are consistently neglecting the effect of windowing in the likelihood when analyzing the data with different waveform models (FD or TD) [59]. We remind the reader that we apply the windowing solely because the two waveforms (FD and TD) are in two different domains and we perform the parameter estimation only to check the presence of waveform systematics. However, we remark that the effect of windowing (and gaps) in LISA data is an important issue that remains to be addressed, but it is beyond the scope of this study. To deal with the data gaps expected in LISA, it would be worth investigating the usage of non-uniform DFT.
The frequency and time domain waveforms are built using the same trajectory and amplitude modules. However, the final signal output is obtained using different mode summations and prescriptions. Therefore, any waveform difference might be attributed to the stationary phase approximation and/or spectral leakage. However, any difference in the speed of the waveform generation is due to the mode summation algorithm of the two domains. In the following, we investigate the waveform mismatch and speed by comparing the time and frequency domain implementations over the parameter space for different observation time-spans T, sampling intervals Δt, and mode content thresholds ϵ. We consider as our fiducial values an observation time-span of T = 4 years (yrs), a sampling interval of Δt = 5 s, and a threshold ϵ = 10−5, and we vary each of these one at a time.
We calculate the mismatch between the frequency and time domain waveforms as described in Section 2.3. The mismatches obtained over the parameter space are shown in the upper part of Figure 2. The median of the mismatch distributions are between 4 × 10⁻⁶ and 10−5, whereas the largest 95% quantile of the mismatch is 9.7 × 10⁻⁵.
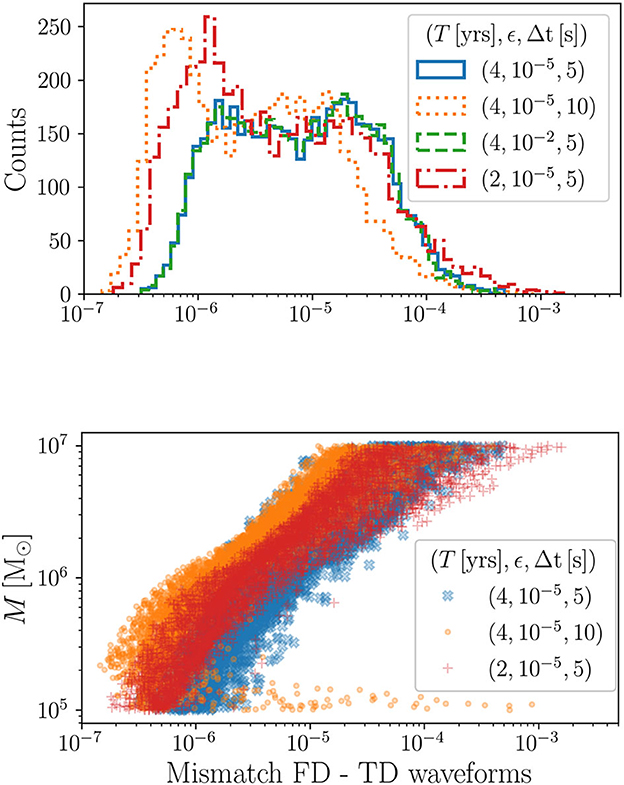
Figure 2. Upper panel: Mismatch between the frequency domain (FD) and time domain (TD) waveforms over the parameter space of EMRI systems and for different observation time-spans, T, sampling intervals, Δt, and mode content thresholds, ϵ. The different parameter realizations are drawn uniformly from the following ranges: , log(μ/M) ∈ [log10−6, log10−4) , e0 ∈ [0.001, 0.7), and Φφ0, Φr0 ∈ [0, 2π). Lower panel: Dependence of the mismatch on the central black hole mass M. The points that abruptly rise to larger mismatches for the orange dots are caused by the fact that, for some low-mass systems, the sampling interval Δt = 10 s is not small enough to resolve the largest frequency.
The distributions obtained with a different mode content ϵ = 10−5 (solid blue histogram) and ϵ = 10−2 (dashed green histogram) are almost identical. This is expected since these systems are affected in the same way by spectral leakage. When comparing the mismatches obtained with different sampling intervals Δt = 5 s (solid blue histogram) and Δt = 10 s (dotted orange histogram), we obtain lower mismatches for larger sampling intervals. We attribute this difference to the fact that the total number of points T/Δt contributing to the mismatch is different. For the systems with lower T/Δt, the spectral leakage is weaker since the total power is lower. To confirm this, we take the ratio of the mismatches and we find it to be approximately constant as a function of the mass. For the same reason, the mismatches obtained for T = 2 years (dashed-dotted red histogram) are slightly lower than the ones obtain for the fiducial value T = 4 years (solid blue histogram). However, the mismatches obtained for (T, Δt) = (2yrs, 5s) (dashed-dotted red histogram) are slightly larger than the ones obtained for (T, Δt) = (4yrs, 10s)(dotted orange histogram). This is probably due to the fact that we fix p0 for a given inspiral duration, and the maximum p0 allowed by the current implementation is p0 ≈ 16.
In the lower panel of Figure 2, we show the behavior of the mismatch as a function of the central black hole mass M. The correlation coefficients between the mass M and the mismatch are approximately ~ 0.6. This is caused by the shape of the LISA sensitivity curve and the fact that for larger M systems, the spectrum shifts to lower frequencies, and the spectral leakage present at the high frequencies becomes more dominant. For large M, the fiducial distribution of mismatches (blue crosses) is wider than the one obtained with Δt = 10 s, but both distributions reach approximately the same mismatches of ~ 10−5 for M ~ 107. This is no longer the case when M becomes smaller. For M ~ 105, the mismatches of Δt = 10 s are generally smaller than the ones obtained from Δt = 5 s.3 This confirms that for larger masses, the spectral leakage dominates, whereas for smaller masses, the mismatch is more affected by the total power in the signal. This behavior is also confirmed for systems with T = 2 years (red crosses). In fact, if we compare the systems with (T, Δt) = (4yrs, 10s) and (T, Δt) = (2yrs, 5s) that have the same power, the distribution for the latter system reaches larger values than the distribution for the former system at all masses because the maximum resolvable frequency, 1/(2Δt), is higher. We note that for lower masses, the distribution for (T, Δt) = (2yrs, 5s) has lower mismatches than the distribution for (T, Δt) = (4yrs, 5s) because the total power T/Δt is smaller.
We use Bayesian parameter estimation to assess whether the FD waveforms are affected by systematic errors. We use the Eryn package [60] to perform a Markov chain Monte Carlo analysis to estimate the posterior distribution of the EMRI intrinsic parameters. Since this analysis is computationally expensive and cannot be performed over the 5000 realizations considered in the mismatch analysis, we decided to focus on the EMRI parameters that yield the largest . For the values of T = 4 yrs, Δt = 5 s or Δt = 10 s, ϵ = 10−5 (blue solid and dotted orange histograms), we find that the largest value of is reached by the system with parameters shown in Table 1. The posterior distribution of this system is shown in Figure 3 for the three scenarios in which the FD and TD are used as injections or templates. The Kullback–Leibler divergences [61] between each pair of posteriors are of order 10−4 for all the considered parameters. Therefore, we conclude that we do not find any significant loss of accuracy or precision for the worst point in parameter space.
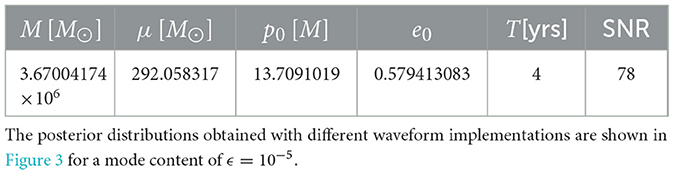
Table 1. EMRI parameters of the source with largest , where is the mismatch between the frequency and time domain waveforms.
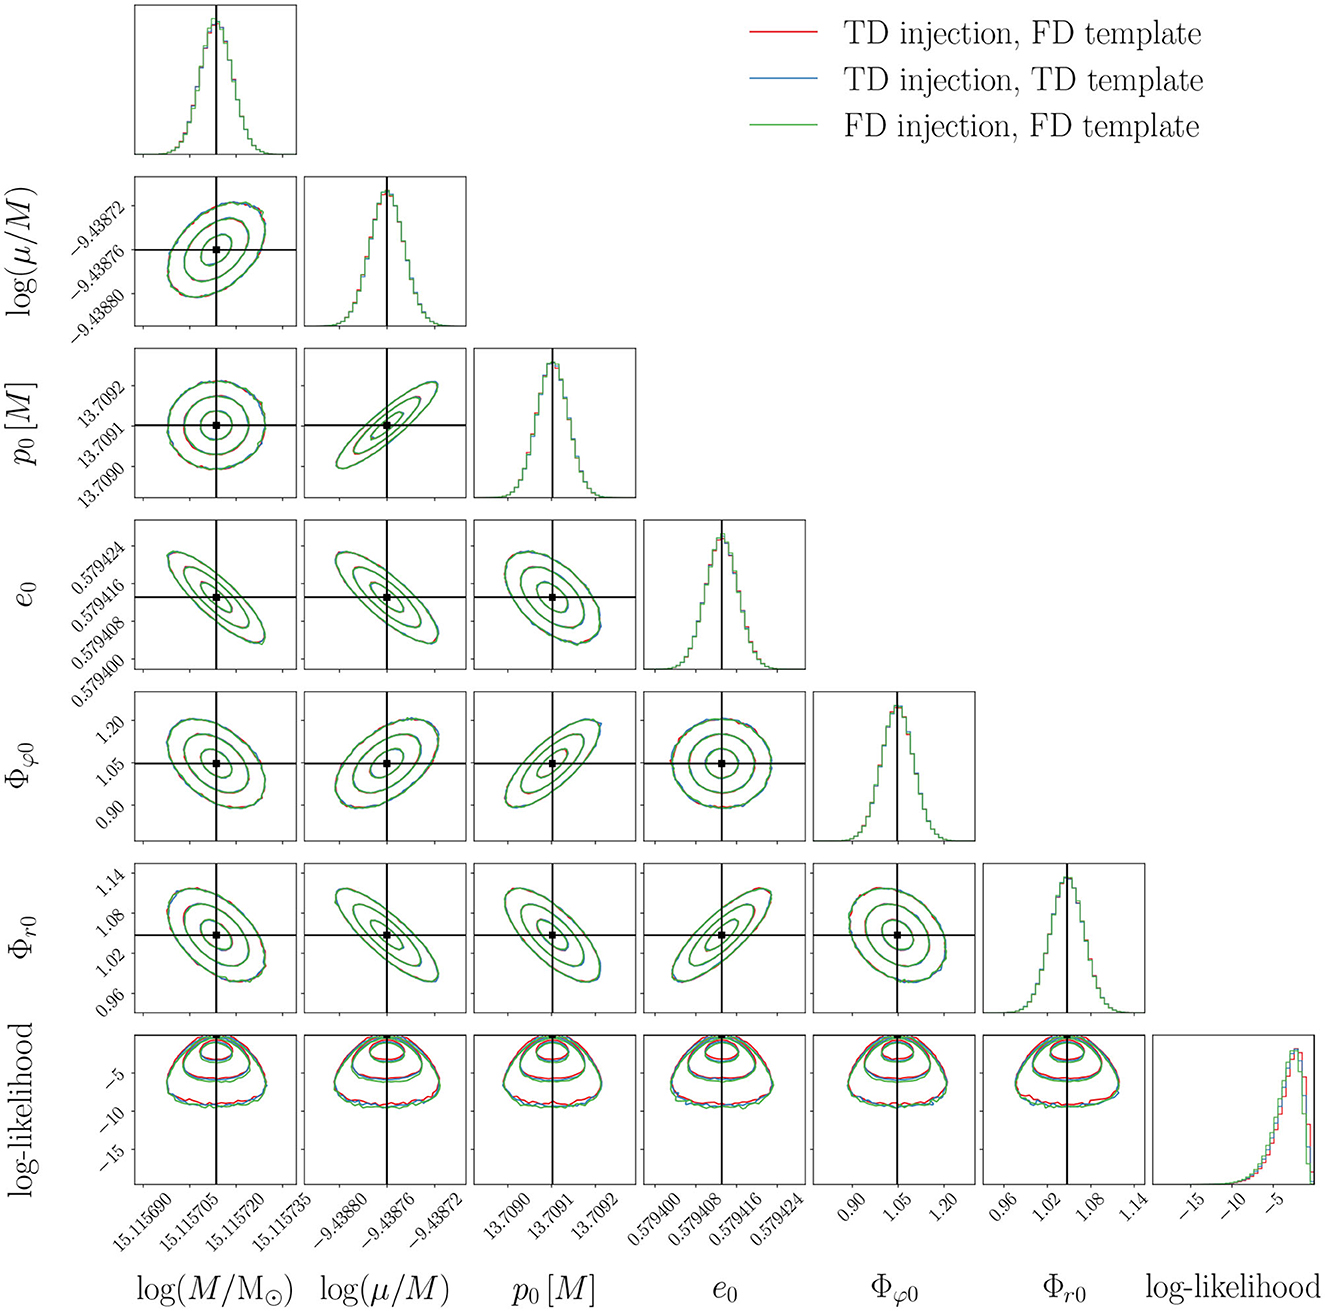
Figure 3. Posterior distributions obtained with different waveform implementations for an EMRI system with parameters given in Table 1. In red, we show the posterior distribution obtained using a frequency domain (FD) template to recover an injected waveform generated in the time domain (TD). The red distribution matches the posteriors obtained when the injected and template waveforms are in the same domain (blue and green posteriors). The observation time, the sampling interval, and mode content are (T, Δt, ϵ) = (4yrs, 10s, 10−5). The Kullback–Leibler divergences between each pair of marginal posteriors are of order 10−4 for all the considered parameters.
The computational cost of the time and frequency domain implementations differ only in the final waveform summation and output domain. Here, we compare the waveform speeds without including the DFT cost. We make this choice to highlight the difference in the waveform generation cost, and we provide the speed of the DFT for a reference system. The speed of the waveform is evaluated using the NVIDIA A100 GPU and the computer cluster Hypatia.4 for GPU and CPU timings reported below. We warn the reader that the computational cost of the waveform can vary depending on the computing resources used.
By drawing 5,000 realizations from the parameter space as discussed in the previous section, we show the speed-up factor given by the ratio of the TD and FD waveform evaluation speeds per realization. The results for the GPU speed-up factor are shown in Figure 4. The upper panel shows the speed-up as a function of sampling interval, observation time, and mode content, while the lower panel shows the dependence on eccentricity and central mass for the fiducial system. Notably the median speeds of all considered configurations are 0.044 and 0.055 s for the FD and TD waveforms, respectively. The distributions shown in the upper panel of Figure 4 depend on the priors chosen for the parameter space.
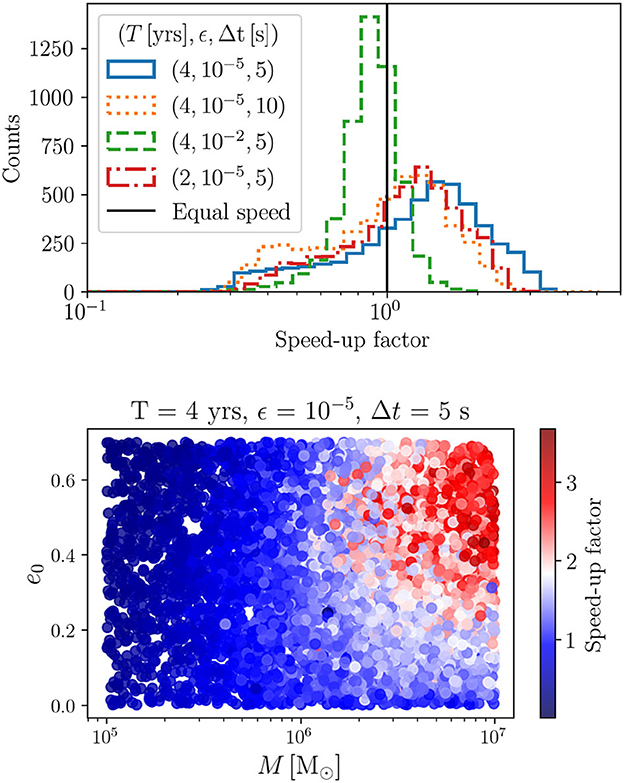
Figure 4. Upper panel: Speed-up factor of the GPU waveform generation in the time domain (TD) vs. frequency domain (FD) over the parameter space of EMRI systems and for different observation time-spans T, sampling interval Δt, and mode content ϵ. The speed-up factor is given by the ratio of the TD generation speed divided by the FD generation speed per parameter realization. The different parameter realizations are drawn uniformly from the following ranges: , log(μ/M) ∈ [log10−6, log10−4) , e0 ∈ [0.001, 0.7), Φφ0, Φr0 ∈ [0, 2π). Lower panel: Speed-up factor as a function of central black hole mass M and initial eccentricities e0 for T = 4 years, Δt = 5 s, and mode content ϵ = 10−5.
Since the mode threshold ϵ controls the mode content, we can deduce that the FD waveform generation is faster than the TD one when the harmonic content is larger, i.e., ϵ is smaller (see solid blue and dashed green histograms). This is a key result because future expansion of the FEW package will implement EMRI systems with a central rotating black hole, where the number of harmonics is expected to increase by an order of magnitude.
As shown by the solid blue and red dashed-dotted histograms in the upper panel of Figure 4, the FD waveform creation is faster than the TD one for longer signals. This is expected since the TD generation increases with the number of time points. Instead, the FD generation slows down with an increasing frequency resolution. This is confirmed by comparing the orange and blue histograms, which differ only by the time sampling interval Δt. The FD generation for our fiducial case is two times faster for systems with M > 2 × 10⁶ and e0 > 0.2. The performance of the FD waveform compared with the TD one improves with increasing eccentricity and central mass M. However, the speed-up trend shown in the lower panel of Figure 4 moves to higher eccentricities and higher masses when T = 2 years, resulting in a smaller speed-up region. In the limit of short signal durations, we expect the TD generation to be faster than the FD one, and contrary in the long duration regime.
The CPU waveform generation can take up to hundreds of seconds depending on (T, ϵ, Δt). Due to the significantly higher computational cost, we do not present the full scan of the parameter space, but from 10 parameter realizations, we conclude that for (T, ϵ, Δt) = (4yrs, 10−2, 10s), the FD waveform generation is on average five times faster than the TD one on CPUs and takes 5 s in median. For reference, we also report that in Table 2, the main findings after timing the FD and TD speeds for the system of Table 1 with (T, ϵ, Δt) = (4yrs, 10−5, 10s). The FD waveform is seven times faster than the TD waveform on CPUs but only 1.3 times faster on GPUs. The DFT operation is particularly expensive on CPUs taking 7 s compared with the 0.4 milliseconds on a GPU.
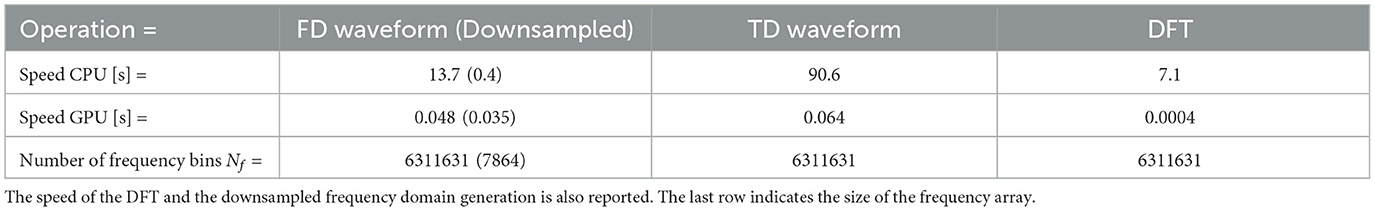
Table 2. Computational cost of the waveform generation in frequency and time domain on GPU and CPU obtained from an EMRI system with parameters given in Table 1 and (T, ϵ, Δt) = (4yrs, 10−5, 10s).
One of the main advantages of the FD generation is that we can evaluate the waveform on a sparser frequency array than the one imposed by the frequency resolution 1/T. We use an evenly-spaced frequency array that spans only the region where the injected waveform is non-zero f ∈ [0, fmax]. We change the frequency spacing to downsample the array, and we define the total number of frequency bins to be Nf = fmax/Δf. We show that in Table 2, the computational cost of the waveform generation in frequency and time domain on GPU and CPU obtained for an EMRI system with the parameters specified in Table 1 and (T, ϵ, Δt) = (4yrs, 10−5, 10s). As shown in Table 2, the frequency downsampling strongly affects the CPU speed-up factors, reducing the cost by a factor of 34. For GPUs, instead, the frequency downsampling mildly affects the speed-up factor between FD and TD generation since the GPU timing is already of the order of tens of milliseconds.
One of the downsides of reducing the frequency resolution is the loss of accuracy in the inner product calculation, with a possible impact on parameter inference. Here, we study the loss of accuracy as a function of the number of frequency bins. As a proof of concept, we consider the source with the parameters reported in Table 1 and obtain the posterior distributions using the FD waveform with different input frequencies and with (T, ϵ, Δt) = (4yrs, 10−2, 10s). In this analysis, we did not include windowing since the injected and template waveforms are in the same domain. The absence of windowing also affects the total SNR, so we rescaled the distance to keep the SNR reported in Table 1 for the finest frequency resolution. The input array is given by evenly spaced frequencies between zero and a maximum frequency fmax. The spacing is set by selecting the total number of frequency bins Nf.
In Figure 5, we show the posteriors obtained with different levels of downsampling and report the CPU and GPU likelihood speeds. The solid blue posterior is obtained using a frequency array defined by the DFT resolution fmax = 1/(2Δt) and Nf = 6311631, whereas the maximum frequency of the dashed orange and dash-dotted green posteriors is set by the maximum harmonic frequency present in the signal fmax = 2.8 mHz. The only difference between the three cases is due to the approximation of the innner product in calculating the likelihood. Even using only 0.05% of the frequencies, the downsampled analysis with Nf = 3554 (dashed orange histograms) provides a posterior indistinguishable from the one of the full frequency array (solid blue). When further decreasing Nf to 35, the downsampling starts to affect the obtained posteriors. The frequency downsampling leads to a faster likelihood evaluation which drops from 4.26 s for the full array to 0.34 for CPUs. Further reducing the number of frequency bins does not significantly improve the speed, highlighting that the bottleneck of the likelihood computation might be due to other waveform computation steps, such as mode selection [39]. The GPU likelihood timing is reduced by a factor of two when using downsampling.
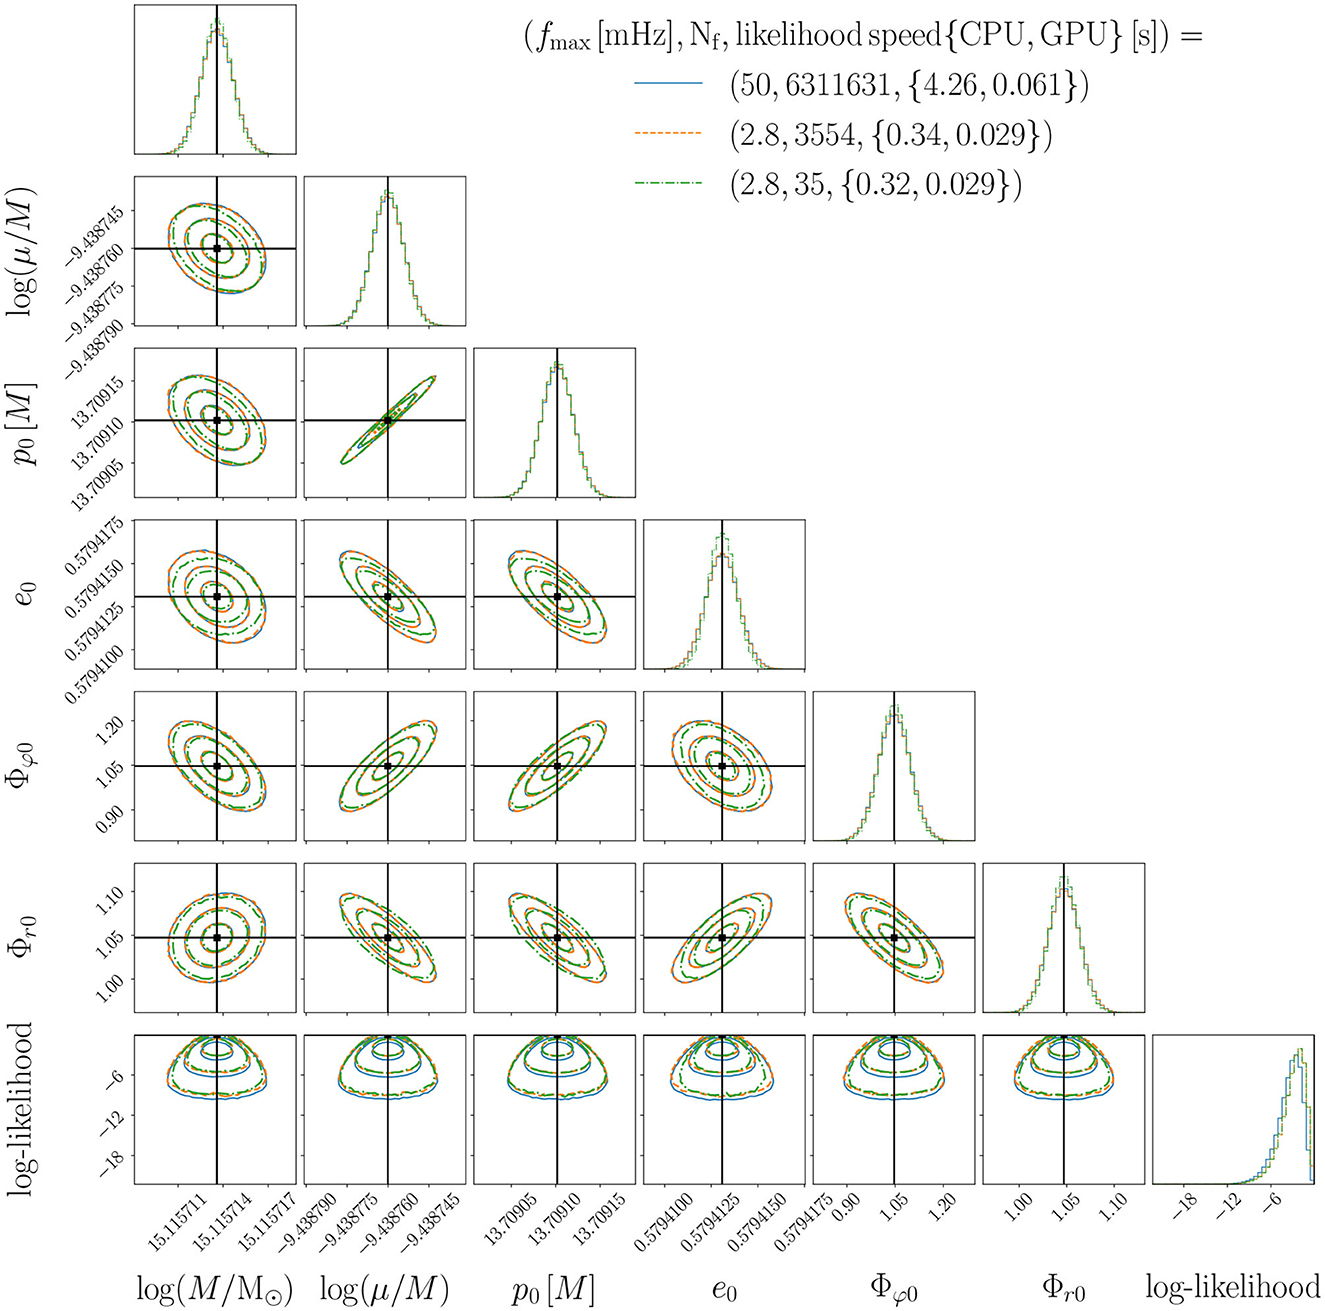
Figure 5. Posterior distributions for an EMRI system with parameters given in Table 1. The posteriors are obtained using the frequency domain waveform with a specified frequency array f ∈ [0, fmax] with Nf number of frequency bins. The solid blue posterior considers a maximum frequency set by fmax = 1/(2Δt), whereas the maximum frequency of the dashed orange and dash-dotted green posteriors is set by the maximum frequency present in the signal. The computational cost of the likelihood evaluation is reported in seconds for GPU and CPU. The mode content is fixed to ϵ = 10−2, and the injected waveforms are shown in Figure 6.
The reason for the deviation in the posteriors can be explained by looking at the absolute square of the characteristic strain , as shown in Figure 6. The FD waveform spectrum obtained with Nf = 3554 (dashed orange line) well represents the spectrum obtained with the full array Nf = 6311631 (solid blue line) in the frequency range, where the signal is above the LISA sensitivity. Instead, the spectrum obtained with Nf = 35 (dotted green line) has a very sparse frequency array that cannot describe all the features present in the EMRI signal. We conclude that the usage of frequency downsampling can be an important tool for exploratory studies of EMRI parameter inference on CPUs. This motivates the FD implementation as an alternative to the TD one for CPU facilities. However, we stress that it is essential to check the validity of the downsampling before using it.
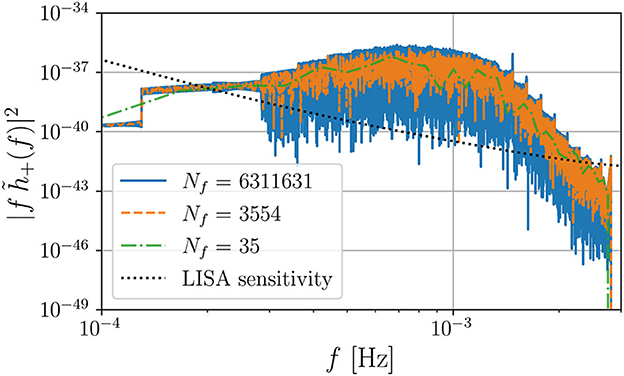
Figure 6. Characteristic strain spectrum obtained with the frequency domain waveform evaluated on different frequency arrays with Nf frequencies. The solid blue spectrum considers a maximum frequency set by fmax = 1/(2Δt) = 50 mHz, whereas the maximum frequency of the dashed orange and dash-dotted green spectrum is set by the maximum frequency present in the signal fmax = 2.8 mHz. The parameters of the EMRI system are shown in Table 1, and the posteriors for these different levels of frequency downsampling are shown in Figure 5.
In this study, we presented a ready-to-use implementation of an EMRI frequency domain waveform, and we compared its accuracy and performance against its time domain counterpart. We found the largest mismatch to be at 3 × 10⁻³, and 95% of the generated waveforms over the EMRI parameter space have a mismatch below 10−4. We further investigated the accuracy with a Bayesian analysis of the worst point in the parameter space and found no visible bias in the recovered parameters.
The computational cost of the frequency domain on GPUs is lower than the time domain cost for central MBH masses of > 106 and for initial eccentricities > 0.2 and high numbers of harmonic modes. This suggests that the frequency domain model might be more suitable when including a large number of harmonics and we expect the FD implementation to be an important alternative to the TD one when extending the waveform model to Kerr spacetimes, where the number of modes is expected to increase by an order of magnitude. Due to the modularity of the FD implementation, the current model can be extended to Kerr spacetimes once amplitude and trajectories are available. These results also have implications for the data analysis applications of the FD waveform model. If we expect the search phase of EMRIs to be conducted using the fastest model, for instance, with a lower mode content, the TD generation may be preferable. However, including all the modes might be important when performing tests of general relativity, and therefore, the FD waveform could be used in this scenario.
The speed-up factor of the waveform model on CPUs is ≈ 7 times faster than the time domain version for the considered system and, in median, 5 times faster for different configurations. However, the waveform evaluation still takes order of 10 s, making the FD waveform not fast enough to perform EMRI parameter inference on CPUs. The frequency domain formulation allows us to choose the input frequency array giving the possibility of downsampling. This was explored for an EMRI system in which we found that the CPU likelihood evaluation can be reduced to 0.3 s when reducing the number of frequency bins to be evaluated. This allows users without GPU resources to run EMRI parameter inference with a fully relativistic waveform for the first time. Frequency downsampling can be used for exploratory studies aimed at assessing the uncertainties that might be realized in parameter estimation. However, this must be done carefully, especially when injecting noise. The noise must be scaled appropriately to avoid obtaining misleading results, and the possible downsampling will depend on the EMRI parameters. Downsampling will in general not be possible when analyzing real data, but it can be used as a tool for understanding EMRI parameter estimation.
In the current setup, the CPU evaluation time converges to values determined by the mode selection. In future studies, we plan to improve this module, therefore enhancing the performance of the CPU FD implementation. Other approaches that use the sparsity of the frequency array to speed up have already been presented in the study by Cornish [62] and Zackay et al. [63]. However, the non-monotonic modes and the large number of harmonics pose challenges in applying such techniques to EMRI waveforms. It is not clear yet whether relative binning or heterodyning will significantly speed up the parameter estimation of EMRI sources.
In this study, we did not include the effect of the LISA response function. This is crucial in using the FD waveforms for realistic data analysis studies. A frequency domain response was already presented in Marsat and Baker [52]. However, it still needs to be assessed whether the approximations used in the study by Marsat and Baker [52] apply to EMRIs. This should be investigated in future studies.
Looking to future, we note that post-adiabatic corrections to the waveform phase are important for precision science with EMRIs. These corrections are known for quasi-circular inspirals [64], and the path to eccentric orbit calculations was laid out in the study by [65]. Although the necessary offline second-order self-force calculations are computationally demanding, the online generation of the inspiral is structurally the same and as fast as the adiabatic model [48]. With the modular FD implementation presented in this study, the FD post-adiabatic waveform will be available as soon as the post-adiabatic corrections to the inspiral phases are known.
Finally, a full realistic data analysis pipeline has not been developed for EMRIs yet [see, however, Babak et al. [14] and Cornish [15]]. We stress the importance of developing waveform models in the time, frequency, and time-frequency domains in order to explore the advantages and disadvantages of each domain [66].
This study is fully reproducible using the publicly available scripts at: https://github.com/lorenzsp/EMRI_FrequencyDomainWaveforms.
LS: Conceptualization, Data curation, Formal analysis, Investigation, Methodology, Project administration, Resources, Software, Supervision, Validation, Visualization, Writing – original draft. MK: Conceptualization, Data curation, Formal analysis, Investigation, Methodology, Resources, Software, Supervision, Validation, Writing – review & editing. AC: Conceptualization, Methodology, Project administration, Supervision, Writing – review & editing. SH: Conceptualization, Formal analysis, Funding acquisition, Writing – review & editing. NW: Conceptualization, Data curation, Formal analysis, Software, Writing – review & editing. JT: Writing – review & editing. CC-B: Writing – review & editing. JG: Writing – review & editing.
The author(s) declare financial support was received for the research, authorship, and/or publication of this article. AC and JT acknowledge support from the NASA LISA Preparatory Science grant 20-LPS20-0005. NW acknowledges support from a Royal Society–Science Foundation Ireland University Research Fellowship. SH gratefully acknowledges support from US National Science Foundation Grant PHY-2110384 and past support from NASA Astrophysics Theory Program Grant 80NSSC18K109. This publication has emanated from research conducted with the financial support of Science Foundation Ireland under Grant numbers 16/RS-URF/3428, 17/RS-URF-RG/3490, and URF/R/221054. CC-B was supported by STFC studentship 2446638.
LS acknowledges Ollie Burke for the very helpful discussions on the impact of windowing in LISA data analysis. AC thanks Gabriel Piovano for useful comments on the manuscript. This work makes use of the Black Hole Perturbation Toolkit [67].
The authors declare that the research was conducted in the absence of any commercial or financial relationships that could be construed as a potential conflict of interest.
All claims expressed in this article are solely those of the authors and do not necessarily represent those of their affiliated organizations, or those of the publisher, the editors and the reviewers. Any product that may be evaluated in this article, or claim that may be made by its manufacturer, is not guaranteed or endorsed by the publisher.
1. ^Notably, a frequency domain waveform implementation was also presented in the study by Piovano et al. [47] with the limitation to circular Kerr orbits.
2. ^In the literature this is also denoted unfaithfulness.
3. ^The points that abruptly rise to larger mismatches for the orange distribution are caused by the fact that, for some low mass systems, the sampling interval Δt = 10 s is not small enough to resolve the largest frequency.
4. ^Hypatia consists of 262 GIGABYTE compute nodes (dual-socket, sixteen-core, SMT-enabled AMD EPYC (Naples) 7351 (2.40 GHz), of which 14 provide 8 GB RAM per core (4 GB per core otherwise).
1. Amaro-Seoane P, Audley H, Babak S, Baker J, Barausse E, Bender P, et al. Laser Interferometer Space Antenna. ArXiv. (2017).
2. Gair JR, Hewitson M, Petiteau A, Mueller G. Space-based Gravitational Wave Observatories. Singapore (2022). doi: 10.1007/978-981-16-4306-4_3
3. Seto N. Proposal for determining the total masses of eccentric binaries using signature of periastron advance in gravitational waves. Phys Rev Lett. (2001) 87:251101. doi: 10.1103/PhysRevLett.87.251101
4. Klein A, Barausse E, Sesana A, Petiteau A, Berti E, Babak S, et al. Science with the space-based interferometer eLISA: supermassive black hole binaries. Phys Rev D. (2016) 93:024003. doi: 10.1103/PhysRevD.93.024003
5. Moore CJ, Gerosa D, Klein A. Are stellar-mass black-hole binaries too quiet for LISA? Mon Not Roy Astron Soc. (2019) 488:L94–8. doi: 10.1093/mnrasl/slz104
6. Babak S, Fang H, Gair JR, Glampedakis K, Hughes SA. “Kludge” gravitational waveforms for a test-body orbiting a Kerr black hole. Phys Rev D. (2007) 75:4005. doi: 10.1103/PhysRevD.75.024005
7. Amaro-Seoane P. Relativistic dynamics and extreme mass ratio inspirals. Living Rev Rel. (2018) 21:4. doi: 10.1007/s41114-018-0013-8
8. Pan Z, Yang H. Formation Rate of Extreme Mass Ratio Inspirals in Active Galactic Nucleus. arXiv. doi: 10.1103/PhysRevD.103.103018
9. Babak S, Gair J, Sesana A, Barausse E, Sopuerta CF, Berry CPL, et al. Science with the space-based interferometer LISA. V Extreme mass-ratio inspirals. Phys Rev D. (2017) 95:3012. doi: 10.1103/PhysRevD.95.103012
10. Amaro-Seoane P, Gair JR, Freitag M, Miller MC, Mandel I, Cutler CJ, et al. Topical Review: Intermediate and extreme mass-ratio inspiralstextemdash, science applications and detection using LISA. Class Quantum Gravity. (2007) 24:R113–R169. doi: 10.1088/0264-9381/24/17/R01
11. Berry CPL, Hughes SA, Sopuerta CF, Chua AJK, Heffernan A, Holley-Bockelmann K, et al. The Unique Potential of Extreme Mass-Ratio Inspirals for Gravitational-Wave Astronomy. (2019). arXiv. doi: 10.48550/arXiv.1903.03686
12. Arca-Sedda M, Capuzzo-Dolcetta R. The MEGaN project II. Gravitational waves from intermediate-mass and binary black holes around a supermassive black hole. Monthly Notices Royal Astron Soc. (2019) 483:152–71. doi: 10.1093/mnras/sty3096
13. Gair JR, Barack L, Creighton T, Cutler C, Larson SL, Phinney ES, et al. Event rate estimates for LISA extreme mass ratio capture sources. Class Quant Gravity. (2004) 21:S1595–606. doi: 10.1088/0264-9381/21/20/003
14. Babak S, Gair JR, Porter EK. An algorithm for the detection of extreme mass ratio inspirals in LISA data. Class Quant Gravity. (2009) 26:135004. doi: 10.1088/0264-9381/26/13/135004
15. Cornish NJ. Detection strategies for extreme mass ratio inspirals. Class Quant Gravity. (2011) 28:094016. doi: 10.1088/0264-9381/28/9/094016
16. Babak S, Baker J, BenacquistaMJ, Cornish NJ, Larson SL, Mandel I, et al. The mock LISA data challenges: from challenge 3 to challenge 4. Class Quant Grav. (2010) 27:084009. doi: 10.1088/0264-9381/27/8/084009
17. Babak S, Baker J, BenacquistaMJ, Cornish NJ, Crowder J, Cutler C, et al. Report on the second mock LISA data challenge. Class Quant Grav. (2008) 25:114037. doi: 10.1088/0264-9381/25/11/114037
18. Arnaud KA, Babak S, Baker JG, Benacquista MJ, Cornish NJ, Cutler C, et al. A how-to for the mock LISA data challenges. AIP. Conf Proc. (2006) 873:625–32. arXiv. doi: 10.1063/1.2405109
19. Barack L, Pound A. Self-force and radiation reaction in general relativity. Reports on Progress in Physics. (2018) 82:16904. doi: 10.1088/1361-6633/aae552
20. Chua AJK, Cutler CJ. Nonlocal parameter degeneracy in the intrinsic space of gravitational-wave signals from extreme-mass-ratio inspirals. Phys Rev D. (2022) 106:124046. doi: 10.1103/PhysRevD.106.124046
21. Speri L, Karnesis N, Renzini AI, Gair JR. A roadmap of gravitational wave data analysis. Nature Astron. (2022) 6:1356–63. doi: 10.1038/s41550-022-01849-y
22. Barack L, Cutler C. Using LISA extreme-mass-ratio inspiral sources to test off-Kerr deviations in the geometry of massive black holes. Phys Rev D. (2007) 75:42003. doi: 10.1103/PhysRevD.75.042003
23. Gair JR, Vallisneri M, Larson SL, Baker JG. Testing general relativity with low-frequency, space-based gravitational-wave detectors. Living Rev Relativ. (2013) 16:7. doi: 10.12942/lrr-2013-7
24. Maselli A, Franchini N, Gualtieri L, Sotiriou TP. Detecting scalar fields with extreme mass ratio inspirals. Phys Rev Lett. (2020) 125:141101. doi: 10.1103/PhysRevLett.125.141101
25. Maselli A, Franchini N, Gualtieri L, Sotiriou TP, Barsanti S, Pani P. Detecting fundamental fields with LISA observations of gravitational waves from extreme mass-ratio inspirals. Nature Astron. (2022) 6:464–70. doi: 10.1038/s41550-021-01589-5
26. Barsanti S, Franchini N, Gualtieri L, Maselli A, Sotiriou TP. Extreme Mass-Ratio Inspirals as Probes of Scalar Fields: Eccentric Equatorial Orbits Around Kerr Black Holes. (2022).
27. Gair JR, Tang C, Volonteri M. LISA extreme-mass-ratio inspiral events as probes of the black hole mass function. Phys Rev D. (2010) 81:104014. doi: 10.1103/PhysRevD.81.104014
28. Barausse E, Rezzolla L, Petroff D, Ansorg M. Gravitational waves from extreme mass ratio inspirals in nonpure Kerr spacetimes. Phys Rev D. (2007) 75:64026. doi: 10.1103/PhysRevD.75.064026
29. Barausse E, Rezzolla L. Influence of the hydrodynamic drag from an accretion torus on extreme mass-ratio inspirals. Phys Rev D. (2008) 77:104027. doi: 10.1103/PhysRevD.77.104027
30. Gair JR, Flanagan EE, Drasco S, Hinderer T, Babak S. Forced motion near black holes. Phys Rev D. (2011) 83:44037. doi: 10.1103/PhysRevD.83.044037
31. Yunes N, Kocsis B, Loeb A, Haiman Z. Imprint of accretion disk-induced migration on gravitational waves from extreme mass ratio inspirals. Phys Rev D. (2011) 107:171103. doi: 10.1103/PhysRevLett.107.171103
32. Barausse E, Cardoso V, Pani P. Can environmental effects spoil precision gravitational-wave astrophysics? Phys Rev D. (2014) 89:104059. doi: 10.1103/PhysRevD.89.104059
33. Barausse E, Cardoso V, Pani P. Environmental Effects for gravitational-wave astrophysics. J Phys Conf Ser. 10:12044. doi: 10.1088/1742-6596/610/1/012044
34. Speri L, Antonelli A, Sberna L, Babak S, Barausse E, Gair JR, et al. Probing accretion physics with gravitational waves. Phys Rev X. (2023) 13:021035. doi: 10.1103/PhysRevX.13.021035
35. MacLeod CL, Hogan CJ. Precision of Hubble constant derived using black hole binary absolute distances and statistical redshift information. Phys Rev D. (2008) 77:043512. doi: 10.1103/PhysRevD.77.043512
36. Laghi D, Tamanini N, Del Pozzo W, Sesana A, Gair J, Babak S. Gravitational wave cosmology with extreme mass-ratio inspirals. arXiv. doi: 10.1093/mnras/stab2741
37. Savalle E, Gair J, Speri L, Babak S. Assessing the impact of instrumental calibration uncertainty on LISA science. Phys Rev D. (2022) 106:022003. doi: 10.1103/PhysRevD.106.022003
38. Chua AJK, Katz ML, Warburton N, Hughes SA. Rapid generation of fully relativistic extreme-mass-ratio-inspiral waveform templates for LISA data analysis. Phys Rev Lett. (2021) 126:051102. doi: 10.1103/PhysRevLett.126.051102
39. Katz ML, Chua AJK, Speri L, Warburton N, Hughes SA. Fast extreme-mass-ratio-inspiral waveforms: New tools for millihertz gravitational-wave data analysis. Phys Rev D. (2021) 104:064047. doi: 10.1103/PhysRevD.104.064047
40. Hughes SA, Warburton N, Khanna G, Chua AJK, Katz ML. Adiabatic waveforms for extreme mass-ratio inspirals via multivoice decomposition in time and frequency. Phys Rev D. (2021) 103:104014. doi: 10.1103/PhysRevD.103.104014
41. Hinderer T, Flanagan EE. Two-timescale analysis of extreme mass ratio inspirals in Kerr spacetime: Orbital motion. Phys Rev D. (2008) 78:64028. doi: 10.1103/PhysRevD.78.064028
42. Fujita R, Hikida W. Analytical solutions of bound timelike geodesic orbits in Kerr spacetime. Class Quant Grav. (2009) 26:135002. doi: 10.1088/0264-9381/26/13/135002
43. Schmidt W. Celestial mechanics in Kerr space-time. Class Quant Grav. (2002) 19:2743. doi: 10.1088/0264-9381/19/10/314
44. Galassi Mea. GNU Scientific Library Reference Manual. (2018). Available online at: https://www.gnu.org/software/gsl/
45. Hughes SA. Evolution of circular, nonequatorial orbits of Kerr black holes due to gravitational-wave emission. Phys Rev D. (2000) 61:084004. doi: 10.1103/PhysRevD.61.084004
46. Hughes SA. Evolution of circular, nonequatorial orbits of Kerr black holes due to gravitational wave emission. II. Inspiral trajectories and gravitational wave forms. Phys Rev D. (2001) 64:064004. doi: 10.1103/PhysRevD.64.064004
47. Piovano GA, Maselli A, Pani P. Constraining the tidal deformability of supermassive objects with extreme mass ratio inspirals and semianalytical frequency-domain waveforms. Phys Rev D. (2023) 107:024021. doi: 10.1103/PhysRevD.107.024021
48. Miller J, Pound A. Two-timescale evolution of extreme-mass-ratio inspirals: waveform generation scheme for quasicircular orbits in Schwarzschild spacetime. Phys Rev D. (2021) 103:064048. doi: 10.1103/PhysRevD.103.064048
49. Droz S, Knapp DJ, Poisson E, Owen BJ. Gravitational waves from inspiraling compact binaries: validity of the stationary phase approximation to the Fourier transform. Phys Rev D. (1999) 59:124016. doi: 10.1103/PhysRevD.59.124016
50. Klein A, Cornish N, Yunes N. Fast frequency-domain waveforms for spin-precessing binary inspirals. Phys Rev D. (2014) 90:124029. doi: 10.1103/PhysRevD.90.124029
51. Candès E, Demanet L, Ying L. Fast computation of fourier integral operators. SIAM J Scient Comput. (2007) 29:2464–93. doi: 10.1137/060671139
52. Marsat S, Baker JG. Fourier-Domain Modulations and Delays of Gravitational-Wave Signals. (2018) p. 6.
54. Virtanen P, Gommers R, Oliphant TE, Haberland M, Reddy T, Cournapeau D, et al. SciPy 1. 0: fundamental algorithms for scientific computing in Python. Nature Methods. (2020) 17:261–72. doi: 10.1038/s41592-020-0772-5
55. Owen BJ, Sathyaprakash BS. Matched filtering of gravitational waves from inspiraling compact binaries: computational cost and template placement. Phys Rev D. (1999) 60:022002. doi: 10.1103/PhysRevD.60.022002
56. Apostolatos TA. Search templates for gravitational waves from precessing, inspiraling binaries. Phys Rev D. (1995) 52:605–20. doi: 10.1103/PhysRevD.52.605
57. Lindblom L, Owen BJ, Brown DA. Model waveform accuracy standards for gravitational wave data analysis. Phys Rev D. (2008) 78:124020. doi: 10.1103/PhysRevD.78.124020
58. Whittle P. The analysis of multiple stationary time series. J Royal Stat Soc Series B (Methodological). (1953) 15:125–39. doi: 10.1111/j.2517-6161.1953.tb00131.x
59. Burke O. Extreme Precision and Extreme Complexity: Source Modelling and Data Analysis Development for the Laser Interferometer Space Antenna. Edinburgh: The University of Edinburgh. (2021).
60. Karnesis N, Katz ML, Korsakova N, Gair JR, Stergioulas N. Eryn: A Multi-Purpose Sampler for Bayesian Inference. (2023) p. 3.
61. Kullback S, Leibler RA. On information and sufficiency. Ann Mathemat Stat. (1951) 22:79–86. doi: 10.1214/aoms/1177729694
62. Cornish NJ. Heterodyned likelihood for rapid gravitational wave parameter inference. Phys Rev D. (2021) 104:104054. doi: 10.1103/PhysRevD.104.104054
63. Zackay B, Dai L, Venumadhav T. Relative Binning and Fast Likelihood Evaluation for Gravitational Wave Parameter Estimation. (2018) p. 6.
64. Wardell B, Pound A, Warburton N, Miller J, Durkan L, Le Tiec A. Gravitational waveforms for compact binaries from second-order self-force theory. Phys Rev Lett. (2023) 130:241402. doi: 10.1103/PhysRevLett.130.241402
65. Leather B, Warburton N. Applying the Effective-Source Approach to Frequency-Domain Self-Force Calculations for Eccentric Orbits. (2023) 6.
66. Cornish NJ. Time-frequency analysis of gravitational wave data. Phys Rev D. (2020) 102:124038. doi: 10.1103/PhysRevD.102.124038
67. Black Hole Perturbation Toolkit. Black Hole Perturbation Toolkit. (2017). Available online at: http://bhptoolkit.org/bhptoolkit.org
Keywords: gravitational wave, LISA, EMRI, data analysis, frequency domain
Citation: Speri L, Katz ML, Chua AJK, Hughes SA, Warburton N, Thompson JE, Chapman-Bird CEA and Gair JR (2024) Fast and Fourier: extreme mass ratio inspiral waveforms in the frequency domain. Front. Appl. Math. Stat. 9:1266739. doi: 10.3389/fams.2023.1266739
Received: 25 July 2023; Accepted: 11 December 2023;
Published: 12 January 2024.
Edited by:
Sigal Gottlieb, University of Massachusetts Dartmouth, United StatesReviewed by:
Alfa Heryudono, University of Massachusetts Dartmouth, United StatesCopyright © 2024 Speri, Katz, Chua, Hughes, Warburton, Thompson, Chapman-Bird and Gair. This is an open-access article distributed under the terms of the Creative Commons Attribution License (CC BY). The use, distribution or reproduction in other forums is permitted, provided the original author(s) and the copyright owner(s) are credited and that the original publication in this journal is cited, in accordance with accepted academic practice. No use, distribution or reproduction is permitted which does not comply with these terms.
*Correspondence: Lorenzo Speri, bG9yZW56by5zcGVyaUBhZWkubXBnLmRl; Alvin J. K. Chua, YWx2aW5jamtAbnVzLmVkdS5zZw==
Disclaimer: All claims expressed in this article are solely those of the authors and do not necessarily represent those of their affiliated organizations, or those of the publisher, the editors and the reviewers. Any product that may be evaluated in this article or claim that may be made by its manufacturer is not guaranteed or endorsed by the publisher.
Research integrity at Frontiers
Learn more about the work of our research integrity team to safeguard the quality of each article we publish.