 Giulia Chiari
 Giada Fiandaca
 Marcello Edoardo Delitala
- 1Department of Mathematical Sciences “G. L. Lagrange”, Politecnico di Torino, Torino, Italy
- 2Department of Mathematics “G. Peano”, Università di Torino, Torino, Italy
- 3Department of Mathematics, Swinburne University of Technology, Hawthorn, VIC, Australia
- 4Department of Cellular, Computational and Integrative Biology - CIBIO, Università degli Studi di Trento, Trento, Italy
Introduction: In the study of therapeutic strategies for the treatment of cancer, eco-evolutionary dynamics are of particular interest, since characteristics of the tumor population, interaction with the environment and effects of the treatment, influence the geometric and epigenetic characterization of the tumor with direct consequences on the efficacy of the therapy and possible relapses. In particular, when considering radiotherapy, oxygen concentration plays a central role both in determining the effectiveness of the treatment and the selective pressure due to hypoxia.
Methods: We propose a mathematical model, settled in the framework of epigenetically structured population dynamics and formulated in terms of systems of coupled non-linear integro-differential equations that aims to catch these phenomena and to provide a predictive tool for the tumor mass evolution and therapeutic effects.
Results: The outcomes of the simulations show how the model is able to explain the impact of environmental selection and therapies on the evolution of the mass, motivating observed dynamics such as relapses and therapeutic failures.
Discussion: This novel modeling framework, together with the experimental results obtained so far, offers a first hint for the development of therapies which can be adapted to overcome problems of resistance and relapses. Further studies, based on a quantification of medical data, could include the development of a mathematical tool for medical support in optimizing therapeutic protocols.
1. Introduction
Since the recognition of the malignancy, the objective of cancer research was to discover novel methods of quality treatment approaches to eradicate it. Presently, due to its high diffusion, over 60% of all ongoing medical quality treatment trials worldwide are concentrating on it [1]. Because of its high cytotoxic potential, radiation therapy is a standard of care in many solid tumors [2]. Its main goal was to deprive cancer cells of their multiplication potential damaging their genetic material and thus blocking their ability to divide and proliferate further via high-energy radiation. Although both cancer and normal cells bear its action, tumor cells are in general not as efficient as normal cells in repairing the damage caused by radiation resulting in differential cell killing. For this reason, radiotherapy is mainly delivered through fractionated schemes to maximize the radiation effects to abnormal cancer cells while minimizing exposure to normal ones [3]. Prediction of tumor response after irradiation has been a challenge at the very beginning since it became rapidly clear that the biological effect of irradiation is a complex phenomenon non-uniquely determined by the total dose, but also by the characteristics of the treatment protocol (such as fraction dose and dose schedule) as well as by physiological conditions in which it is applied that can widely range between patients [4]. The success of radiotherapy depends indeed on multiple sub-cellular, cellular, and microenvironmental parameters, together referred to as the “6Rs of radiation therapy”: repair of irradiation-induced DNA damages, redistribution of cells within the cell cycle, repopulation of mass after radiation, reoxygenation of the tumor microenvironment, intrinsic radiosensitivity of different cell subpopulations, and reactivation of the anti-tumor immune response [5].
A crucial factor that impacts on all these aspects is tumor heterogeneity in terms of both microenvironmental conditions and cancer cell populations. In particular, it has been observed that the local oxygen concentration can significantly influence radiation-induced cell death, with well-oxygenated regions being shown to exhibit up to three-fold greater radiosensitivity than hypoxic tumor populations [6].
Hypoxia is a consequence of the high tumor cell proliferation rate and the abnormal structure of the tumor vasculature. Oxygenation level is generally reduced and heterogeneous within malignant masses, compared to the oxygenation found in associated healthy tissues; this oxygen lack is a critical features in tumors promoting their progression. It is indeed clinically observed that, in solid tumors, oxygen tissue deprivation acts as an environmental stressor, promoting a long series of genetic, but especially, epigenetic mutations that strongly impact the tumor eco-evolutionary dynamics. Cancer cells are indeed able to adjust their cellular physiology and metabolism via the upregulation of different genes as p53, HIF-α, or GLUT-1 or IAP-2 acquiring the ability to grow in hypoxic microenvironments and to evade apoptosis [7].
The reason for which low oxygen tensions are associated with radio-resistance relies on the mechanism of cell killing by ionizing radiation. It is indeed experimentally shown that oxygen plays a fundamental role in fixing the damage on cancer cells induced by radiotherapy that leads to their death [8].
In fact, it is observed that hypoxia can cause topographically defined cellular subpopulations protected at the time of radiation without being killed by severe oxygen starvation; the oxygen tension for hypoxic cells could be indeed high enough to allow for clonogenic survival but low enough to protect them from the effects of ionizing radiation [9].
In this view, it is clear that hypoxia impacts all the 6Rs mentioned before, becoming a fundamental factor to be consider to a successful treatment protocol. In particular, we are interested in investigating its effects on three of them: (i) radiosensitivity, (ii) repopulation, and (iii) reoxygenation. Radiosensitivity defines the intrinsic sensitivity of tumor cells to the therapy; it is influenced by hypoxia at two levels: a direct one since, as underlined before, oxygen is responsible for the enhancement of the detrimental effect of ionizing radiation which implies that radiotherapy is less efficient in the areas in which a lack of oxygen is observed; an inverse one by the fact that hypoxia selects for cells equipped by high resistance to hostile environments and low proliferative rates. Repopulation defines instead the renewal and the proliferation of surviving cancer cells following irradiation and it is affected by hypoxia since it promotes treatment-resistant hypoxic cells that serve as a nidus for subsequent tumor regrowth and repopulation. Finally, reoxygenation defines the fact that, between radiotherapy fractions, well-oxygenated cell death leads to oxygen release, reduction of oxygen demand, and tumor bulk shrinkage allowing better oxygen diffusion turning back initially refractory hypoxic areas to a more radiosensitive state [5].
The emergence of a resistant population can be described in terms of tumor evolution and stems from its intrinsic heterogeneity. In an eco-evolutionary perspective, a tumor can be indeed interpreted as a cell population characterized by an accumulation, via natural selection, of genetic and epigenetic alterations that appear both due to intrinsic cell variability and to their mutual interactions with the surrounding microenvironment. In this light, all the treatment procedures could act as a environmental stressor on tumor cells inducing strong modifications of tumor ecology and, consequently, of the fitness landscape of tumor cells promoting variation tumor composition. The resulting strong selective bottleneck enriches for resistant phenotypes within cancer cells as mirror of the evolutionary capacity of cancer phenotypes to adapt to therapeutic perturbations as well as of the modifications of the temporal and spatial heterogeneity of the tumor microenvironment [10–12]. In this view, ecologically informed therapeutic strategies can potentially define and use novel treatment approaches that could vary among patients whose landscapes could be completely different. Such an adaptive approach implies that each patient therapeutic protocol is strictly personalized on the basis of the tumor state and response rather than a one-size-fits-all fixed treatment regime [13, 14].
Mathematical models constitute a good investigation instrument in this sense since they can allow to test different environmental conditions, different tumor compositions, as well as different therapeutic protocols. They can be seen as in silico laboratories to evaluate the mutual interactions between the above mentioned aspects and their consequences on tumor development. In this respect, the effect of tumor–host interaction, in particular considering tissue oxygenation and its role on shaping the phenotypic composition of tumor masses and their double impact on radiotherapy efficacy, has been deeply investigated via a wide range of modeling techniques [15–21]. As example, in Celora et al. [22], the authors presented a mathematical model that describes how tumor heterogeneity in terms of stemness evolves in a tissue slice oxygenated by a single blood vessel, determining the proliferative capacity, the apoptosis propensity, and the response to radiotherapy protocols. A similar dynamics is investigated in Hamis et al. [23] via a hybrid cellular automaton in which the authors analyzed the spatio-temporal dynamics and the evolution of the intratumoral heterogeneity of a mass under the action of radiotherapy, showing how the treatment results more effective in well-oxygenated tumors than in the poorly oxygenated ones. In the same veins but with a particular attention to tumor cell repopulation, reoxygenation, and redistribution of proliferative states, in Kuznetsov and Kolobov [24], it is proposed a spatially distributed continuous matematical model of solid tumor growth treated by fractionated RT. Other interesting results are collected in Lewin et al. [25] in which numerical and analytical techniques are developed to investigate radiation response of tumors with different intratumoral oxygen distribution profile. Finally, without an explicit description of tumor oxygenation but in a more general framework of tumor–host interaction in terms of competition for space and resources and tumor heterogeneity, in Poleszczuk et al. [26] the authors proposed a prognostic factor for personalized radiotherapy, named Proliferation Saturation Index (PSI), to identify the best fractionation scheme.
Following this research line, a particularly promising treatment modality is the Intensity-Modulated RadioTherapy (IMRT), which has the potential to be an effective method for delivering customized radiation therapy to small, specific regions of a tumor based on its oxygenation level [27, 28]. This approach is called dose painting and involves selectively boosting doses to regions of the tumor that are known to be particularly resistant to treatment [29]. To fully exploit this technique, however, additional information about the tumor composition, specifically in terms of its resistance to hypoxia, is necessary to define the most effective radiation dosimetry plan.
Motivated from the above considerations, in this study, we are interested in investigating how low oxygen levels and hypoxia-associated tumor cell adaptions affect radiotherapy efficiency in the specific case of solid tumors. We aim, in this sense, to develop a tool which could adapt to patient-specific characteristics, in line with the innovative personalized medicine approach [30].
In our previous study presented in Chiari et al. [31], we deeply investigated how the mutual interactions between the tumor mass and oxygen distribution (i) can result in a geometric characterization of tumor niches in terms of masses spatial extension, how this characterization could affect the phenotypic composition in terms of survival and invasive abilities, and finally how both these two aspects in synergy affect the mass growth. This approach naturally laid the groundwork to investigate how the pre-therapeutic history of a tumor dictated by oxygen distribution could determine therapeutic failures thanks to the possibility to take into account the differences in tumor conformation and invasive ability coupled with the emergence of treatment-resistant hypoxic cells that result from this dynamics. It indeed perfectly matches with the necessity to take into account two crucial events: (i) hypoxia selects for cells equipped by high resistance to hostile environments and low proliferative rates; (ii) these cells are intrinsically less exposed to treatment action with respect the normal cells being the power of radiotherapy to be able to block the replication process. This setting clearly results to be particularly suitable to investigate radiosensitivity development dictated by hypoxia since we can naturally map cell mitotic potential with their intrinsic resistance ability. A low proliferant cell is indeed intrinsically more resistant to the action of radiotherapy in light of what we previously observed. Moreover, the eco-evolutionary approach that we there adopted allows also to investigate the effects on tumor growth and regrowth of therapeutic perturbations coupled with the spatial and temporal variations observed in tumor microenvironment leading to investigate also the dynamics that governs the repopulation of a tumor mass after the treatment. Finally, considering the interaction between the tumor mass and the microenvironment in which it lives, it allows also to focus on the dynamics of oxygen and to evaluate the impact of reoxygenation phenomena.
In this study, we present an extension of the model in Chiari et al. [31] to take into account how the effects of radiotherapy differ according to the heterogeneity faced at the instant and the location at which the therapy is applied (from both a physical and a phenotypical point of view) investigating how a divergent response could be observed within and among patients. In this perspective, we consider a specific formulation for the survival fraction of the already treated tumor cells, able to capture both parameters directly associated with clinical data and specific mortality rates with respect to different doses and treatment timings. This new modeling structure of radiotherapy gives the possibility to explore the tumor–therapy interaction in two mutual directions, i.e., (i) the impact of tumor developmental dynamics on the efficacy of therapy and (ii) the impact of therapy on the spatial and epigenetic characteristics of the tumor mass.
Moreover, the action of the environmental selection is taken into account to characterize the spatial heterogeneity of proliferative potential and to identify the tumor regions composed by cell with low proliferative rate and to study how their evolution could strongly influence treatment success.
Since the terms phenotypic and epigenetic (both already introduced in this study) are often used in the literature with the same meaning, we specify that in the sequel of this study, we refer to epigenetic trait (and the relative mutation) when we intend to refer to the molecular imprint on the genotype which determines the degree of activation of the genes, keeping unaltered their sequence. Instead, we refer to the phenotype as the observable actualization of interactions between its genome, epigenome, and local environment.
The rest of the study is organized at it follows: In Section 2, we present the proposed model with the underlying assumptions (see Subsection 2.1); details on the parameters estimate and on its numerical implementation as well as on the indices that quantity tumor progression are given in Subsection 2.2 and Subsection 2.3, respectively. We then turn on describing the model results in Section 3. Specifically, we simulate the growth of the malignancy in two specific settings, referred as Case 1—highly oxygenated tissue (see Subsection 3.1) and Case 2—poorly oxygenated tissue (see Subsection 3.2) that differ with respect to the oxygenation level of the tissue. We compare them applying the same radiotherapy protocol to highlight the differences that could be observed in tumor response due to tumor–host interaction. Subsection 3.3 is instead devoted to investigate possible variations of radiotherapy efficacy varying the total dose amount delivered in the two experimental setting toward tailored radiotherapy protocols. Finally, in Subsection 3.4, we analyze the effect of spatially heterogeneous distributions of the intratumoral oxygen sources to highlight their role in the creation of ecological niches, due to the relative blood vessels dispersal that influence the treatment response. The article ends in Section 4 with a summary of the main results with hints for possible developments.
2. Materials and methods
2.1. Mathematical model
As mentioned in the introduction, building upon our previous study [31], we extend the model to include the effects of radiotherapy. To this aim, we set a spatial bi-dimensional domain in which the mass can expand assuming to observe a tumor evolving in a tissue slice. In particular, in our setting: (i) oxygen is the main environmental actor to affect tumor evolution, and in the determination of the different areas of therapeutic efficacy; (ii) tumor cell behavior will be influenced by the epigenetic characteristics of individuals in terms of their double resistance to hypoxia and radiotherapy, the environmental conditions faced and the mutual interaction between these two aspects. In this respect, the virtual tumor mass is differentiated in metabolically active (i.e., viable) and necrotic individuals. The necrotic subpopulation is assumed to be undifferentiated, with number density given by the function . The viable tumor portion is instead structured with respect to the epigenetic trait u∈Ωp = [0, 1] that describes the double resistance level of malignant cells, i.e., w.r.t. both the ability to survive in hypoxic tumor areas and their radiosensitivity. A choice of this type allows to take into account a continuum spectrum of possible cell states characterized by intermediate levels of both survival and proliferation in such a way that an increasing epigenetic expression denotes an higher survival ability and a lower duplication rate. In particular, the epigenetic state u = 0 will characterize the cells that show the highest mitotic potential and, relatively, the highest sensibility to both oxygen lack and radiotherapy action (proliferation promoting or sensible cells); the epigenetic state u = 1, instead, is linked to cells that show the potentially highest survival ability but the lowest duplication capacity (survival promoting or resistant cells).
The tumor mass distribution on the spatial and epigenetic space is identified with the function that reflects the epigenetic composition of the tumor mass located at time t in the domain point x. Its evolution is modeled via the following trait-structured integro-differential equation (IDE):
in which represents the oxygen concentration and ρ(t, x) denotes the local number density of the non-necrotic tumor area, computed considering all the individuals present in the mass regardless of their epigenetic trait:
In this respect, metabolically active cells (i) undergo to random phenotypic transitions, (ii) randomly move, (iii) either proliferate, being subjected to selective pressures by environmental conditions or acquire an irreversible necrotic fate due to both oxygen lack or radiotherapy action. The reaction term in Eq. (1) expresses local variations in the mass of viable cells due to proliferation, the action of the natural selection and necrosis phenomena due to oxygen lack or radiotherapy action. The rates at which these phenomena take place are given by the functions P, S, N, and T respectively:
In details, the proliferation rate p is assumed to depend on (i) the individual actual epigenetic trait, (ii) the resources availability, and (iii) the physical limitations determined by the available space. In this respect, we factorize p as follows:
where p1 represents the duplication law and takes into account the variability in cell proliferation w.r.t. their epigenetic trait in light of the proliferation-survival trade-off . Individuals characterized by epigenetic state u = 0 correspond to the cell variant with the highest proliferation rate, denoted as γmax; whereas individuals characterized by epigenetic state u = 1 correspond to the cell clone which poorly undergo to mitotic events, as quantified by the lowest proliferation rate γmin. We assume a linear trend between the epigenetic firm and the mitotic potential:
The term p2 represents the relation between cell duplication rate and available chemical, i.e., cell ability to exploit resources. Its expression is modeled considering a classical Michaelis-Menten law:
Finally, the term p3 models the growth inhibition due to over-crowding by means of a logistic-like law:
where k>0 is the local tumor tissue carrying capacity considering both viable and necrotic individuals in space competition.
The term S(u, O(t, x)) in Eq. (5) represents instead the death rate induced by oxygen-driven natural selection. In details, it models the experimentally observed trade-off between maximizing cell survival in oxygen deprived tissue and maximizing cell mitotic potential [32]. The chosen proliferation-survival trade-off results as follows: a lower level of gene expression correlates with a lower resistance to hypoxia and thus a higher death rate; a higher level of gene expression correlates with a larger fitness cost and thus a lower proliferation rate. In this respect, we virtually identify different regions in which the spatial domain could be divided with respect to the level of oxygenation observed based on the experimental data presented in Korolev et al. [33] and Vaupel et al. [34]. Naming OM, Om, and On the oxygen level that bound from below normoxic, hypoxic, and necrotic areas, we assume that (i) in normoxic environments (i.e. when O≥OM), the fittest level of gene expression is the minimal one (i.e., u = 0); (ii) in hypoxic environments (i.e., when O ≤ Om), the fittest level of gene expression is the maximal one (i.e., u = 1); (iii) in moderately oxygenated environments (i.e. when Om<O<OM), the fittest level of gene expression is a monotonically decreasing function of the oxygen concentration (i.e., it decreases from u = 1 to u = 0 when the oxygen concentration increases); (iv) in necrotic areas (i.e., when O ≤ On), the oxygen availability is insufficient to guarantee cell survival so cells undergo to apoptosis. Under these assumptions and coherently with our previous study [31], we define the death rate induced by oxygen-driven selection S(u, O(t, x)) as follows:
where (i) the parameter ηO>0 is named the selection gradient and quantifies the intensity of oxygen-driven selection; (ii) the function φO(O(t, x)) represents the fittest level of expression of the hypoxia/therapy-resistant gene under specific oxygen concentrations, where the fittest epigenetic expression with respect to the oxygen concentration is as follows:
The term N(O(t, x)) represents instead necrosis phenomena: viable cells indeed irreversibly acquire a necrotic fate when they experience a drop in the available oxygen concentration below to the basal level On. In this respect, N in Eq. (3) reads as follows:
where H is again the Heaviside function, and η represents a transition rate.
Finally, the term T(u, O(t, x)) represents the radiobiological response of cells under the action of the treatment. To define it, we rely on the standard linear-quadratic (LQ) model [35], which describes the surviving fraction (SF) of cells in response to a single radiation dose. In our setting, cells mortality is defined following an innovative approach in light of what we mentioned before, i.e., in function of both (i) oxygenation of the tissue and (ii) intrinsic radiosensitivity of cell clones with respect to their epigenetic firm. Generally, the main parameters of LQ model α and β are tissue-specific coefficients, and we introduce variability in the action of radiotherapy according to the biological situations in which the therapy is applied [36]. Specifically, we consider that the effectiveness of radiotherapy is related to hypoxia that affects therapeutic efficacy in a two-fold way. A direct one by the fact that, as underlined before, oxygen is responsible for the enhancement of the detrimental effect of ionizing radiation which implies that radiotherapy is less efficient in the areas in which a lack of oxygen is observed. An inverse one by the fact that hypoxia selects for cells equipped by high resistance to hostile environments and low proliferative rates; this second characteristic makes cells, as already mentioned, intrinsically less exposed to radiotherapy action with respect the normal cells since the power of radiotherapy is to be able to damage the DNA consequently blocking the replication process. In this light, we assume that the coefficients α and β coefficients depend on an introduced variable z which takes into account both the oxygen concentration (to simulate that the treatment is less effective in hypoxic areas) and the epigenetic characterization of cells (to simulate that hypoxia-resistant cells are even less sensitive to radiotherapy). This concept is formalized describing z as a product of two weights: (i) the former, here named wu, which depends on the epigenetic trait of the cell u and (ii) the second, here named wO, from the oxygen concentration O(t, s):
to highlight the relation that exists between proliferation and survival (proliferation-survival trade-off ). In this light, inspired from the study presented in Celora et al. [37], we model the increasing dependence of α and β parameters on the eco-evolutionary variable z as:
and
where αmin, αmax, βmin, andβmax are non-negative constants with αmin < αmax and βmin < βmax which represent the maximum and minimum sensitivity to treatment (estimations of their values can be found in Joiner and Van Der Kogel [38]). Finally, we characterize cell mortality under the action of radiotherapy as follows:
where (i) , being δ the Dirac-delta, models the fact that the death factor due to therapy is only present during the administration time of the chosen protocol and (i) d is the administered dose. To complete the model, the viable cells turned into necrotic fate due to lack of oxygen, already described in Eq. 10, are collected in the necrotic population, whose dynamic is described by the following equation:
Switching on the molecular scale, in the same setting presented in Chiari et al. [31], the local concentration of oxygen is governed by a parabolic PDE where the spatially heterogeneous source term V(x) captures the presence of intratumoral oxygen sources. Moreover, oxygen diffuses within the tissue and naturally decays, and it is consumed by viable cells. Its kinetics is described as follows:
where λO, μO, and ζO are constant coefficients. We denote with the set of oxygen sources present in the tissue, where the i-th source is defined by a couple in which the first element vi provides its the geometrical position and the second element Ii is the rate of inflow of oxygen in the tissue via it. Thus, the oxygen inflow can be described as a geometric source given by the equation:
with σV < < 1 to simulate a quasi point-wise source, coherently with the model presented in Villa et al. [20]. In this respect, we specify that, in this modeling arrangement, oxygen source characteristics, in time and geometry, are time-independent. We underline that the diffusion of oxygen within multicellular tumor spheroids typically occurs within a time frame of seconds. Consequently, employing a steady-state approximation is deemed acceptable, see for instance [39]. In our specific study, our objective was to investigate the success of radiotherapy, which, as previously mentioned, is strictly linked to the reoxygenation of the tumor microenvironment. Accordingly, we focused on the temporal changes in oxygen concentration within the same time window as cellular oxygen consumption.
2.2. Simulation details
The spatial domain Ωs represents a bi-dimensional section of a 4 cm-large tissue, i.e., cm. The final observation time is denoted by tF and varies among simulations in correspondence of the relapse, identified as the time at which the total cell count reaches again the detection threshold (2.5·106) after the radiotherapy administration.
2.2.1. Initial and boundary conditions
Equation (1) that establishes cell dynamics is equipped by the following initial condition:
with . The geometric point around which the cancer cell population is located at the initial time is denoted by xC; without loss of generality, we consider the case in which it is fixed at the center of the domain xC = (0, 0). Biologically, this setting reproduces, at the beginning of the numerical realizations, a node of malignant viable cells already present within the tissue, with the following characteristics: (i) each cell epigenetic state has a full Gaussian profile along the spatial dimension, centered at the starting point xC and with a variance of and (ii) the cell mass has a half-normal distribution in the trait space, with peak at uC = 0 (to capture the predominantly proliferative behavior that characterizes early-stage tumors) and with variance . The initial cell configuration has a maximum value of A = 89.20 cell/cm2. In this respect, at t = 0, the overall density ρ of active individuals is symmetrically disposed w.r.t. xC and, in normoxic condition, it is mainly composed of proliferative promoting cell variants with only a small fraction of survival promoting agents.
Equation (1) has zero-flux conditions at the boundary of the epigenetic domain, i.e., ∂ua(·, ·, 0) = ∂ua(·, ·, 1) = 0. This is consistent with the fact that malignant cells cannot be characterized by a trait smaller than 0 or higher than 1. The same holds on the domain Ωs under the assumption of considering the growth of the mass in a tissue slice where physical barriers as for instance bones, bounds of breast ducts or the lack of extra-cellular matrix, prevent the expansion of the mass out of them.
Turning on chemical kinetics, Eq. (16) is completed with initial condition O(0, x) that represents the steady-state of oxygen distribution in the tissue in absence of tumor cells with respect to different oxygen source intensity whose value is specified case by case. We couple Eq. (16) with zero-Dirichlet conditions at the boundary of the spatial domain Ωs under the assumption of considering a sufficiently large tissue in which anoxic areas at the boundaries of the domain. In this respect, two geometrical layouts for oxygen sources are adopted in this study (i) one with an oxygen source at the center of the domain, considering two inflow cases; we refer to them as ΥFV = {((0, 0), Ĩ)} (well-oxygenated tissue, corresponding to a Full Vascularized layout - FV ) and ΥHV = {((0, 0), 0.5Ĩ)} (poorly oxygenated tissue corresponding to a Half Vascularized layout - HV) ; (ii) the other is a three (oxygen source) layout, where all the sources are around the antibisector in the configuration Υ3V = {((−0.9, 0.9), 0.6Ĩ), (1.0, −0.8), 0.6Ĩ), (0.8, −1.0), 0.6Ĩ)}. In the sequel, we set the reference oxygen inflow Ĩ = 1.57μ mol/(cm2 day). This value is estimated to ensure tissue oxygenation at physiological levels consistent with those observed in various tumor tissues [40]. Specifically, it guarantees a distribution that ranges from sufficiently vascularized regions where oxygen levels are over the normoxic threshold (8 mmHg, as reported in Brown and Wilson [40]), to areas characterized by a significantly limited nutrient supply (below the maximum tolerated level of 1.5 mmHg, as described in Brown and Wilson [40]).
2.2.2. Parameters estimate
The majority of model coefficients has a clear and direct biological meaning, and therefore, a proper estimate has been done taking advantage of the empirical literature. In this respect, we have referred to experimental works dealing with a wide spectrum of diseases since we here account for a generic tumor. From this perspective, the model configuration maintains a general nature. However, it is certainly feasible to parameterize the model for a specific tumor type if relevant data are available. The full parameter set up is listed in Table 1.
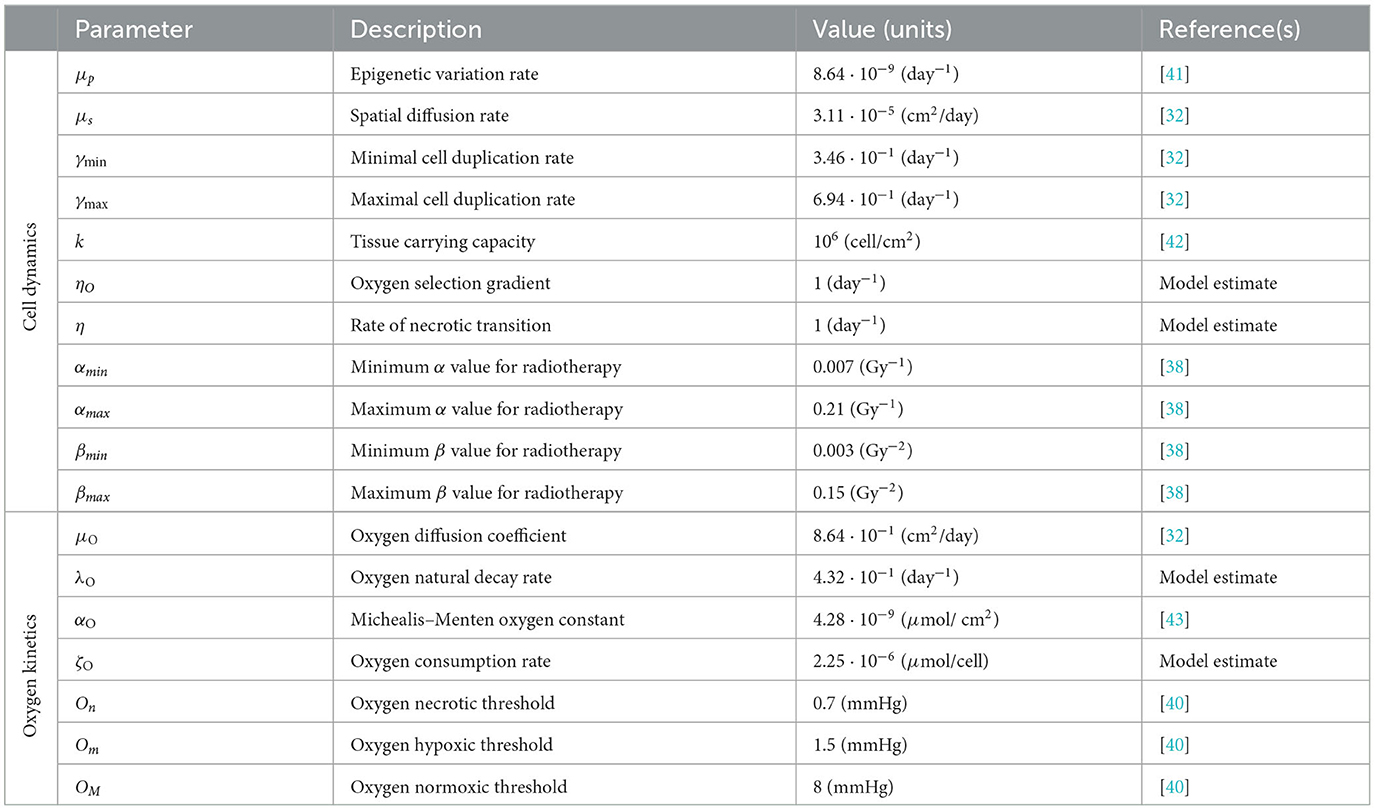
Table 1. Reference parameters setting.
2.2.3. Numerical method
For the domain mesh and the implementation of the numerical resolution algorithm, a Python code is developed, using FEniCSx and Dolfinx packages [44]. Specifically, we adopt an uniform discretization for the temporal and epigenetic domains and a triangular mesh with radial symmetry for the two-dimensional geometric domain. The system of partial differential equations is solved via a mixed solution scheme. We couple an explicit Euler method for the one-dimensional components of the domain (time and epigenetic trait) and a Galerkin finite element method for the dynamics on the geometric domain. In the latter case, we employ a weak formulation and consider an approximation with piecewise polynomials of first degree on the mesh elements and continuous over the whole domain. At each time step, we evaluate the reaction term R in Eq. 1 and the consumption term ζO in Eq. 16 based on the previous time step. This linearizes the numerical problems and allows us to treat them symmetrically in the weak formulation. These constraints enable the code to simulate the problem with adequate accuracy, eliminating the need for extensive mesh refinements while maintaining reasonable execution times (in the order of minutes on a standard laptop).
2.3. Quantification of model results
Following our previous approach [31], to provide some qualitative indicators of tumor evolution and a more quantitative description of epigenetic trait distribution inside the mass, we divide the epigenetic domain Ωp in three epigenetic bands, denoted with L (low), M (medium), and H (high): with , , . We link the epigenetic bands to the tissue regions in which they are the “optimal” ones in term of environmental selection via the function φo(O(t, x)), Eq. (9). We obtain a time-dependent partition of the spatial domain where L, M, and H superscripts correspond to the areas of the domain where the fittest epigenetic trait belongs to the correspondent epigenetic band and is the necrotic area (oxigen below On).
To analyze the results of our simulations, we use local and global indicators.
To spatially characterize the tumor mass, we take into account the local number density ρ(t, x) already presented in Section 2 and we introduce the band-specific local number densities:
To give some global indicators and analyze their evolution in time, we introduce:
• the total cell count, providing the size of the tumor population:
• the average epigenetic trait, providing a representation of the epigenetic spectrum present in the mass:
• the average radiosensitivity index:
With respect to the radiotherapy parameters, we here use α as a qualitative indicator since we are interested in the relative variation with respect to minimum and maximum values and β has the same dependence on the z function, just rescaled in its range, Eqs (12), (13).
Finally, we introduce a global index for the environment description, which is the oxygen total amount
3. Results
The rationale of this study was to investigate how differences in the tumor radiotherapy response could be related to the spatially heterogeneous distribution of intratumoral blood vessels in tumor tissues. One of the factor that may lead to therapeutic failures is the development of intra- and inter-patients resistance. Different ecological niches, in terms of vessels potency and relative dispersal, lead to the selection of cells with different characteristics that may pave the way to the emergence of therapeutic resistance. In these veins, the resulting heterogeneous tumor microenvironment is of clinical interest to find the optimum patient-specific protocol.
To investigate this phenomenon, according with the approach settled in our previous study [31], we first focus on studying these evolutionary dynamics in a relatively simple setting choosing a mass formed by tumor cells that grows close to an oxygen source. Specifically, we are interested in two different environmental conditions, designed to represent an high and low efficient vascular network, respectively, finally comparing them in terms of therapy efficacy.
In both cases, we assume that the treatment is applied only in presence of a sufficient highly concentrated tumor mass, to reflect that, to be treated, masses have to be visible via diagnostic imaging. Specifically, we set a detecting threshold in correspondence of masses constituted by 2.5·106 cells. With respect to the applied protocol, we focus on one of the most common in conventional clinical practice, according to which patients receive the same radiation dose in all the different subregions of the tumor volume, following a fractionation schedule that provides, for a dose of ~2 Gy (Gray) delivered once a day, Monday to Friday, up to a total of 50–70 Gy. Specifically, in our case, the therapy ends up in 6 weeks for a total dose amount of 60 Gy. The mass evolution is described in terms of numerosity, morphology, and epigenetic characterization, investigating the relation between these different aspects in repopulation phenomena. Moreover, special emphasis is devoted to tumor–host interaction, looking to oxygen dynamics in relation to the radiosensitivity of the mass considered.
3.1. Case 1—Well-oxygenated tissue
In the first simulation setting, Figure 1, we observe the growth of a tumor mass in a sufficiently oxygenated environment provided by ΥFV layout. Looking at the evolution of its total cell count Γ(t), panel (Figure 1A), the efficient vasculature of the tissue provides a sufficient nutrient supply, leading to a rapid evolution of the mass. The malignant cell number shows a Gompertz-like profile, coherently with the biological evidences, see for instance [45, 46]. Assuming to be able to diagnose the tumor burden, as soon as, the mass approaches the detection threshold, radiotherapy is applied, according to the abovementioned protocol, leading to a tumor reduction of nearly the 90% of its volume at the diagnosis. The shape of the curve, week by week, fits the decreasing strength of the treatment in time, showing a strong efficacy in the first phases that gradually reduces in correspondence of a smaller portion of cells that could be hit. As it can be observed, once that the treatment protocol is completed, the failed eradication allows to a quick relapse of the mass that restarts to grow even faster than the settlement phase; a restored bulk of the same dimension of the one before the clinical intervention could be observed at the end of the simulation.
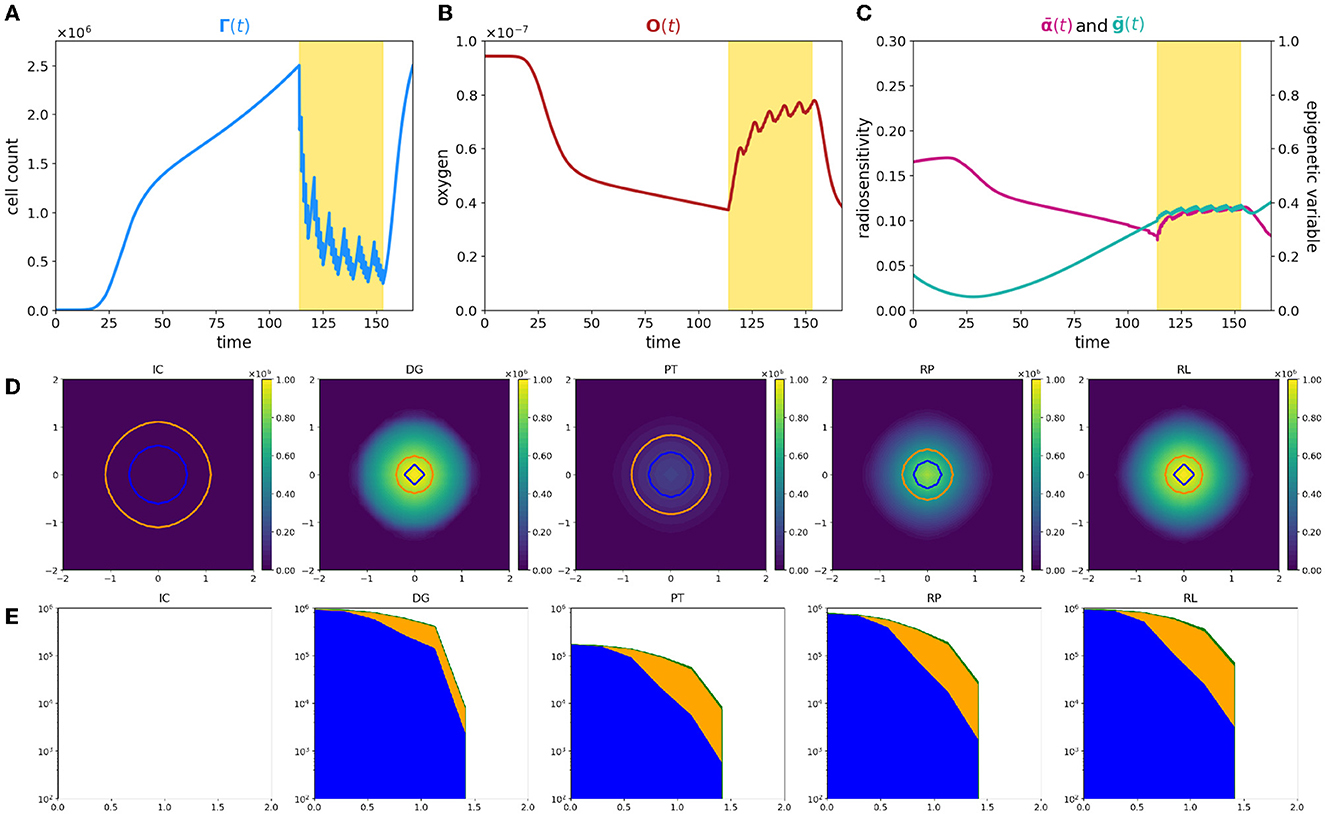
Figure 1. Simulation of tumor mass, growing from the center of the domain, in the case of a well-oxygenated tissue, ΥFV layout. (A) Global cell count evolution. (B) Total oxygen amount evolution. (C) Average radiosensitivity index and average epigenetic trait evolution. (D) ρ(t, x) for t correspondent to tumor onset (IC), diagnosis (DG), post-treatment (PT), repopulation (RP), and relapse (RL) times. Contour lines detect the optimal areas for high (green), medium (orange), and low (blue) epigenetic bands (note that here green line is not present as it would divide the optimal area for high epigenetic band from the necrotic area, which is not present with this oxygen inflow). (E) Slice of ρ(t, x) taken on the positive bisector in logarithmic scale. The edge represents the total amount ρ(t, x) while the edges of colored areas represent the incremental densities, providing a visual indicator for the geometrical characterization of the epigenetic composition of the mass (blue for low, orange for medium, and green for high epigenetic band).
The three-phase expansion–contraction–expansion dynamics is even more highlighted looking at the evolution of the local density ρ(t, x), represented in Figure 1D. Specifically, we focus on observing its profile at five representative time points: (i) the mass onset (IC), (ii) the tumor detection (DG, diagnosis), (iii) the end of the treatment (PT, post-treatment), (iv) during the tumor regrowth (RP, repopulation), and (v) the final configuration (RL, relapse). As it can be observed, the mass develops almost-radially around the more oxygenated area and no differences in terms of shape could be highlighted comparing the second and the last panel. This is coherent with the fact that the tumor invasion is the result of the proliferative and the diffusive potential, with respect the environmental conditions faced. Interestingly, at the end of radiotherapy administration, the cell density of the mass is underneath the detection threshold, see panel PT of Figure 1D. However, looking to the corresponding DG and PT panels in Figure 1E, where the tumor densities of the three different epigenetic bands ρjforj = L, M, H are locally summed in space, the radiotherapy reduction corresponds to approximately the 80% of the tumor bulk, switching in number from 106 to 2·105 while the edges remain almost constant in number. The remaining small node of cells, constituted by the 10% of the total original mass, is the responsible of tumor relapse, in accordance with the repopulation phenomena. The rapid growth of the mass observed could be reasonably linked to tumor–host interaction and in particular to the reoxygenation after the radiotherapy. From a local point of view, this can be seen analyzing the contour lines at different time steps in Figure 1D that detect the extension of the optimal areas for the three epigenetic bands. Blue circle indicates the area in which more proliferative epigenetic traits are favorite to colonize the tissue, the orange the one for the medium-resistant cells, and the green (here not represented) for the high-resistant cells ones. Notice that the absence of a boundary of the optimal area for more hypoxic cells denotes the fact that in the entire tumor tissue, the amount of oxygen is sufficiently high to avoid necrosis so high hypoxic-resistant cells could potentially fully colonize the tissue slice. The areas enclosed by the contour are wider after therapy (PT plot), due to the lowering of oxygen consumption as a consequence of the elimination of the tumor mass by the radiation administration.
From a global point of view, looking indeed to the evolution in time of total oxygen amount available in the tissue slice, Figure 1B, an increase in terms of its concentration occurs during the treatment administration. The rationale, as already anticipated in the Introduction, is that the reduction in number of tumor cells during the treatment is reflected in a minor consumption of the available nutrients, leading to restored oxygen delivery in the tissue that was, in the early development phases, compromised due to the high metabolic requirement. As we can see, at the end of the radiotherapy protocol, the survived tumor cells could completely exploit the available oxygen, leveraging all their duplication potential and leading to a quick mass regrowth.
In eco-evolutionary terms, it is interesting to investigate how the cooperation and/or out-competition phenomena could potentially influence this dynamics. In particular, as shown in our previous study [31], the selection dynamics occurring in the tumor–host interaction could carry out a crucial role in terms of tumor aggressiveness and treatments could act, in terms of environmental stressors, as bottlenecks that fuel this dynamics. Three aspects are of particular interest from our point of view: (i) how the pre-treatment history of a tumor could impact on the radiosensitivity of the mass at the beginning of treatment delivery; (ii) the effect of radiotherapy as a bottleneck selecting for resistant epigenetic traits; and finally (iii) how the consequences of the treatment action on tumor microenvironment could impact in the future of tumor mass.
In this direction, we focus on investigating the evolution in time of the global average epigenetic expression of the mass ḡ(t), Eq. (23) and the corresponding one of the radiosensitivity index , Eq. (22). Analyzing the ḡ profile in time, we can observe that the high oxygenated environment that characterizes the early phases of tumor growth leads to an initial deflection of the average epigenetic expression. Indeed in proximity of the more oxygenated area, proliferating cells have a strong evolutionary advantage with respect to all the other epigenetic traits present in the mass, out-competing them and becoming the predominant ones in the mass. As the mass expands, conquering less oxygenated regions, the action of natural selection slowly leads to the emergence of more resistant epigenetic traits, mildly shifting the tumor toward resistance to hypoxia development. However, a strong epigenetic switch in terms of average composition of the mass, during and after the treatment, is not remarkably highlighted. Indeed, under these specific environmental conditions, the growth of the mass is only slightly affected by natural selection in the short time interval before detection, and thus, it is mainly composed by proliferating cells and a minor part of medium-resistant cells. Reoxigenation after the treatment gives a further advantage to the proliferating cells. This is confirmed looking at the epigenetic composition in terms of specific epigenetic bands densities represented in Figure 1E. In this light, ḡ(t), coherently, remains pretty constant with only small fluctuations, during the treatment. The jagged ḡ(t) profile is due to the fact that: on the one hand, during the resting days of the treatment, in accordance with resources availability, proliferating cells quickly repopulate the tumor mass; on the other hand, during the effective treatment days, the higher effect of radiotherapy on proliferating cells leads to their decrease.
A more dynamic profile characterizes the evolution in time of the radiosensitivity of our mass. As we can observe, in the early expansion phases, despite the promising tumor composition in terms of radiotherapy efficacy, the radiotherapy index rapidly decreases. This is due to the fact that the growing mass approaches less oxygenated regions due to both an increased oxygen consumption by the mass and the further distance from the high oxygenated area and thus the tumor results to be less sensible to radiotherapy administration, independently by its epigenetic characterization. In contrast, the reoxygenation phenomenon observed during the radiotherapy leads instead to an increasing responsiveness of mass to the treatment. The jagged profile of is less regular with respect to the one observed for the average epigenetic index ḡ(t), and, in this respect, our results suggest that the heterogeneity in terms of radiotherapy efficacy is mostly oxygen-driven with a minor role of epigenetic mass composition. Unfortunately, coherently with the experimental evidence [47], the benefits of radiotherapy in terms of reoxigenation and thus, the increase of radiosensitivity of the mass has only a temporary effect: In a quick time window, the tumor mass re-acquires its scarce sensibility, being able to conquer and to survive in hypoxic regions where oxygen concentration is high enough to allow for clonogenic survival, but it is low enough to protect tumor cells from the effects of ionizing radiation.
3.2. Case 2—Poorly oxygenated tissue
In the second simulation setting, we observe the growth of a tumor mass in a harsher environment as consequence of an inefficient nutrients supply. In this perspective, we consider a tissue slice in which the oxygen inflow by the micro-vasculature is halved with respect to the previous case and we analyze the same eco-evolutionary features. Looking at the results shown in Figure 2, marked differences can be observed on tumor evolution with respect to the previous case.
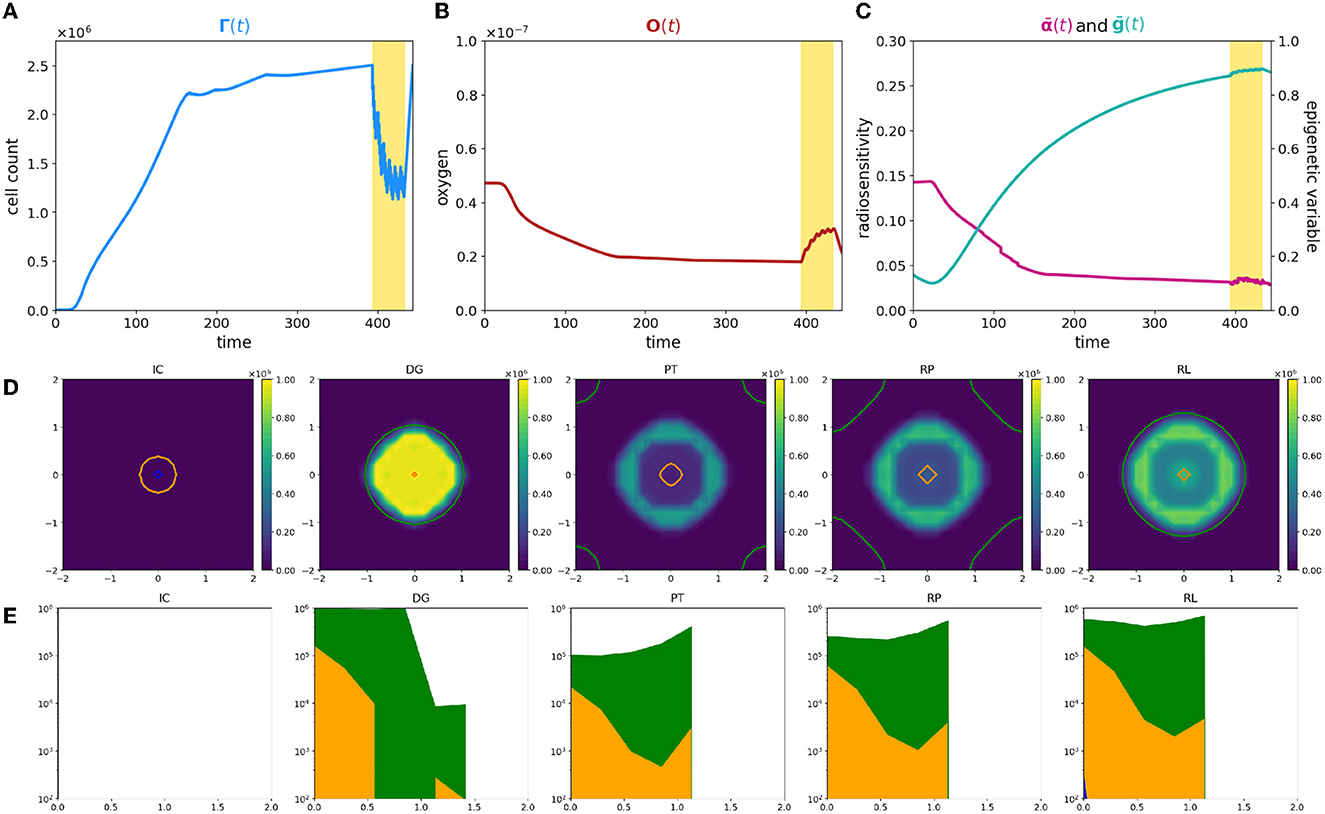
Figure 2. Simulation of tumor mass, growing from the center of the domain, with oxygen levels in accordance with the ΥHV layout. Plot description as in caption of Figure 1.
First of all, the evolution of tumor cells total count Γ(t) is significantly different (Figure 2A); the smaller amount of available resources slows down the tumor development, leading to a mass that needs approximately more than three times more to reach the detecting threshold. Its profile moreover reveals that the radiotherapy protocol is less effective with respect to the previous case; the mass reduces again, but a more dense nidus of resistant cells, that amounts to over the 40% of the total volume, is not eradicated. Additionally, once that the treatment protocol is completed, the failed eradication allows to a quick relapse of the mass; the restored bulk at the end of the simulation is indeed morphologically identical to the one before the clinical intervention but it reaches the same volume, in a shorter time window with respect the early stages of the mass growth. The characteristic three-phase expansion–contraction–expansion dynamics is again observed; however, it is affected by completely different mechanisms with respect to the previous case as it is shown by the rest of the eco-evolutionary dynamics.
The evolution in time of the tumor density ρ reveals, in contrast with the previous scenario, a moderate dense ring of resistant cells still present at the end of treatment protocol. Its presence naturally affects the regrowth of the mass, and, as it could be observed in panel RP of Figure 2D, two simultaneous dynamics could be detected: (i) a repopulation of the tumor region that starts from the center of the mass in proximity of the more oxygenated tissue area, suggesting that, also in this case, a silent mass is not eradicated coupled with (ii) an uninterrupted expansion of the rim of resistant cells.
This macroscopic difference between the two cases strongly depends on the different interactions between the tumor and the microenvironment that lead to completely different radiosensitivity and, consequently, different repopulation and reoxygenation dynamics in the mass. In particular, two are the aspects that have to be considered to identify the underpinning dynamics: (i) a less oxygenated environment could lead to the emergence of intrinsically more resistant epigenetic traits; (ii) an inefficient tissue oxygenation naturally suppresses the radiotherapy efficacy.
Focusing on the first aspect, coherently with what we showed in our previous study [31], in the early stages of mass development, the tissue colonization results from the cooperative relations between different specialized cell variants, enhancing the importance of epigenetic composition on tumor development. Analyzing the local number densities of the different sub-groups ρj for j = L, M, H, it can be noticed that the tumor composition is affected by the spatial variability of oxygen concentration and environmental gradients lead to the selection for cells with epigenetic characteristics that vary in accordance with the oxygen gradient. In particular, cells characterized by medium and high resistance colonize the mass in percentages that increase moving far away from the nutrient source. This emerging dynamics suggests the development of the classical ring structure that characterizes spheroids; in this specific case, the mass is evolving developing an inner core of medium-resistant epigenetic traits surrounded by a rim of high-resistant cells. A mixed composition of this type shapes the radiosensitivity of the mass and results in an heterogeneous response with respect the cellular subtypes involved. The reduction in tumor burden provided by the action of the therapy is comparable with respect the previous case. Differently, the tumor edges remain almost insensible to the treatment, increasing in number. These results highlight how in tumor–host interaction, the selection dynamics could carry out a crucial role in terms of tumor aggressiveness and that treatments could act, as environmental stressors and bottlenecks that fuel this dynamics. In particular, looking at panels DG and PT of Figure 2D, two aspects of particular interest naturally emerge: (i) the impact of pre-treatment history of a tumor could impact on the radiosensitivity of the mass; (ii) the role of radiotherapy as a bottleneck selecting for resistant epigenetic traits.
In this perspective, the residual ring that emerges at the end of the treatment is the result of the presence, in the region of interest, of pre-existing more resistant epigenetic traits. This is perfectly in line with the biological hypothesis that the action of radiotherapy is affected by the tissue oxygenation level in a two-fold way: (i) low oxygenation levels promote the emergence of radio-resistant cells, and we will refer to it as epigenetic-driven resistance; (ii) oxygen is fundamental to fix on DNA of the cells the damage induced by radiation, and we will refer to it as purely oxygen-driven resistance.
Notably, also in this second case, reoxygenation could be observed as a consequence of tumor cell killing by radiotherapy, but its restoring dynamics is characterized by a slower slope with respect to the previous case being. The underpinning reason relays in tumor mass composition: the presence of an heterogeneous mass with medium- and high-resistant cells implies that not all the viable cells are killed by the treatment and, thus that the oxygen consumption does not stop during the treatment. Despite the slower dynamics, reoxygentation fuels more remarkably the tumor repopulation. The larger nidus of survived cells are indeed strongly advantaged by the presence of new available resources, favoring their proliferation. It is interesting to notice how the repopulation of the mass is the result of cooperation phenomena in which medium proliferating cells colonizing the inner region of the tumor tissue; as well as harsher regions are instead repopulated by increasing resistant epigenetic traits. This phenomenon is highlighted in panel (RL) of Figure 2D in which the ring structure, previously sketched, definitively emerges; an entire rim predominantly constituted by high-resistant epigenetic traits bounds indeed the tumor mass.
The eco-evolutionary indexes that we are considering, the average epigenetic trait, Eq. (22), and the radio-sensitivity index, Eq. (12), are able to reveal additional interesting information. Looking at the average epigenetic trait evolution, the interaction with an harsh environment strongly forces the hypoxia-resistance development trend. The epigenetic shift that is observed rapidly converges toward resistant epigenetic traits in the class of medium- and high-resistant cells, and thus, the mass is constituted in higher percentage by these cellular subtypes. Its profile moreover highlights (i) the strength of the selective bottleneck induced by the action of the treatment that provides a further shift toward an increasing radio-resistance and (ii) the effect of reoxygenation on radiosensivity of the mass as confirmed by the deflection in the immediate time window after the treatment. The last information could be exploited from the therapeutic point of view being a mass sensible to proliferation targeting approaches. In the same veins, the evolution of the radiosensitivity index shows a decreasing profile during all the time window of observation. This sharp trend is due to the harsh environment in terms of oxygenation: hypoxia, already by itself, constitutes a valid element to decrease radiosensitivity of the mass which is affected by oxygen deprivation also in an indirect way via the selection of resistant epigenetic traits. Moreover, the radiosensitivity index shows a more irregular dynamics with respect the previous case, coherently with the fact that in this case the radiotherapy response is guided by both the oxygenation levels and its epigenetic characterization.
To summarize, a comparison of the dynamics is plotted in Figure 3; bold and thin lines refer, respectively, to low and high oxygenated microenvironment. Interestingly, our results suggest that nominal tumor size alone is insufficient to predict growth dynamics and that the definition of personalized indexes is needed to define an efficient therapeutic plan. In fact, the time evolution of the total cell counts, (Figure 3A), reveals how two patients with a similar tumor volume could have a distinct tumor–host co-evolution history, which results in different responses to the same radiotherapy protocol, coherently with the clinically observed inter-patient variability in terms of therapy response. Furthermore, a particular behavior is highlighted: tumor volumes close to their carrying capacity, in terms of the maximum tumor extension that can be reached with respect to the available resources, result to be less sensitive to radiation-induced damage (low oxygen case); on the other hand, tumors far from their carrying capacity are instead more sensitive to the radiation (high oxygen case). In this light, our results are interestingly in line with the ones presented in Poleszczuk et al. [26], in which a patient-specific index, named the Proliferation Saturation Index (PSI), estimated on patient data, is introduced as predictive tool of the radiotherapy response. In their study, the authors hypothesize that tumor characterized by an high PSI, i.e., close to their carrying capacity, is composed by only a small proportion of proliferating cells highly sensitive to radiation-induced damage and thus, a less effective therapeutic impact could be expected. Our results confirm this hypothesis, further revealing the dynamics that determine the differences in tumor composition as result of the heterogeneity from patient to patient in tumor microenvironment. In this respect, see Figure 3B, our findings moreover suggest that, even if the restoring oxygenation is, in percentage terms, the same in the two cases (close to the 50%), a completely different dynamics is observed. Indeed, in the first case (high oxygen level), looking at the in-time evolution of the radiosensitivity in Figure 3C, the radio-induced reoxygenation is sufficient to prompt the mass toward a higher sensibility to the treatment; at the contrary, in the case of low oxygenation, a degenerating dynamics toward a more resistant mass is observed, even in presence of higher quantity of available oxygen. In this view, our approach enriches the number of information that can be harvested, providing a platform that target both the microenvironment and the epigenetic characteristics of the mass. Therefore, it can potentially used to make predictions based on the state of the mass once discovered and to guide the protocol choice. Indeed introducing a mathematical framework which describes the cell behavior through phenotypic characterization gives the chance to use theoretical information about non-observable phenomena to explain the emergence of dynamics observed at the macroscopic level in terms of tumor expansion or reduction in the presence of treatment. Quantitative comparisons could be performed using data such as the ones reported in Zakelj et al. [48], where the number of cells in each epigenetic band is computed and the tumor mass composition is identified in terms of percentage. Nevertheless, although there is increasing evidence of the existence of a continuum spectrum of phenotypes [49], it is more challenging to obtain data in this regard.
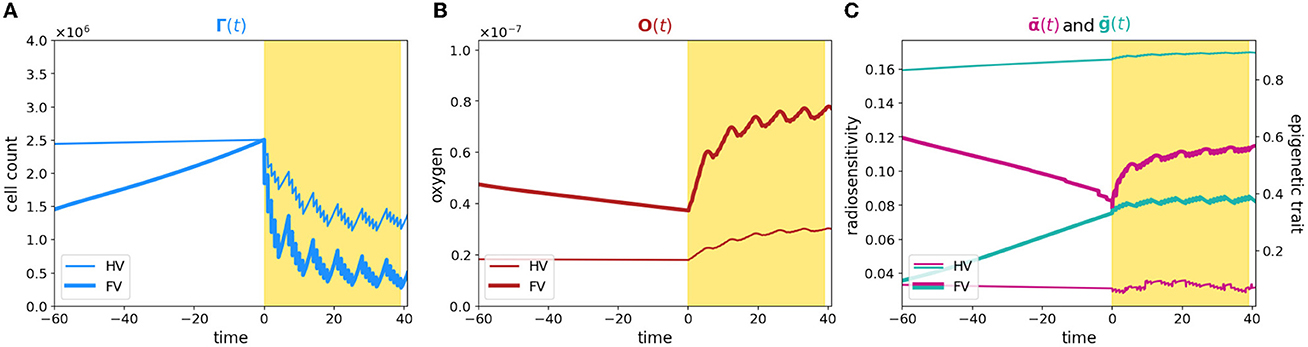
Figure 3. Comparison between case 1 and case 2. The figure shows an overlap of (A–C) plots presented in Figures 1, 2. The time axis has been rescaled so that time zero coincides with the begin of the therapy for both the experiments and plots are zoomed around it.
3.3. Tailored radiotherapy protocols
In conventional clinical practice, most patients treated with radiotherapy receive a similar dose and fractionation scheme. In particular, at present, the same radiation dose is delivered to all subregions of the tumor volume, regardless of their individual biology and radiosensitivity. As shown, oxygen concentration can greatly modify the patient response; in this light, new treatment modalities such as Intensity-Modulated RadioTherapy (IMRT) have emerged, aiming to modulate the delivered dose over small volumes that are distinguished with respect the oxygenation level, see, e.g., [27, 28]. This customization of radiotherapy, based on spatial information drawn from hypoxia imaging, is generally known as dose painting and, in principle, it consists in delivery selective boosting dose to radio-resistant regions [29]. However, to fully exploit the strength of these new techniques, hypoxia level information needs to be coupled with the knowledge of tumor composition in terms of therapy resistance that, as mentioned, strongly impacts treatment efficacy. Thus, detailed information about the internal structure of the tumor in terms of epigenetic traits and phenotypes is required to define the best radiation dosimetry plan.
In these veins, we handle our modeling approach to investigate the dose–efficacy relationship with dose escalation, to suggest the optimal total dosage while reducing treatment-induced toxicity; specifically, our aim was to explore how a different prescription of radiation in regions characterized by higher hypoxia may or may not affect the success of treatment. To do this, we compare our previous results with two additional radiotherapy protocols that differ from the previous one in terms of the total radiation dose administered; in particular, we study the effect of a lower and a higher dosage compared to the previous case (46 total Gy and 74 total Gy vs. 60 Gy, respectively) while maintaining once-daily administration from Monday to Friday for 6 weeks. Figure 4 shows a representative indication of the differences in efficacy for the three different scenarios, in relation to tumor microenvironment oxygenation and epigenetic composition of the mass. The results of the experiment in terms of repopulation, reoxygenation, and radiosensitivity are shown in Figure 5: the first row (FV) refers to the case of high oxygenation, while the second row (HV) refers to the case of low oxygenation. The color code indicates that lighter colors correspond to higher total doses.
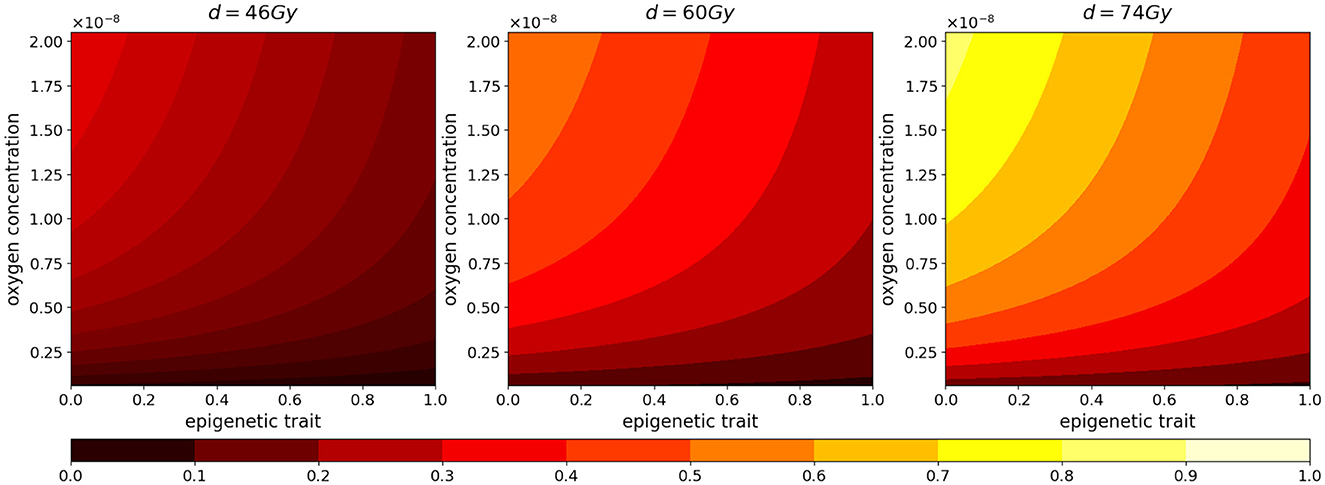
Figure 4. Normalized radiotherapy effectiveness depending on epigenetic trait (x-axis) and oxygen density (y-axis) in the cases of a total dose of 46, 60, 74 Gy.
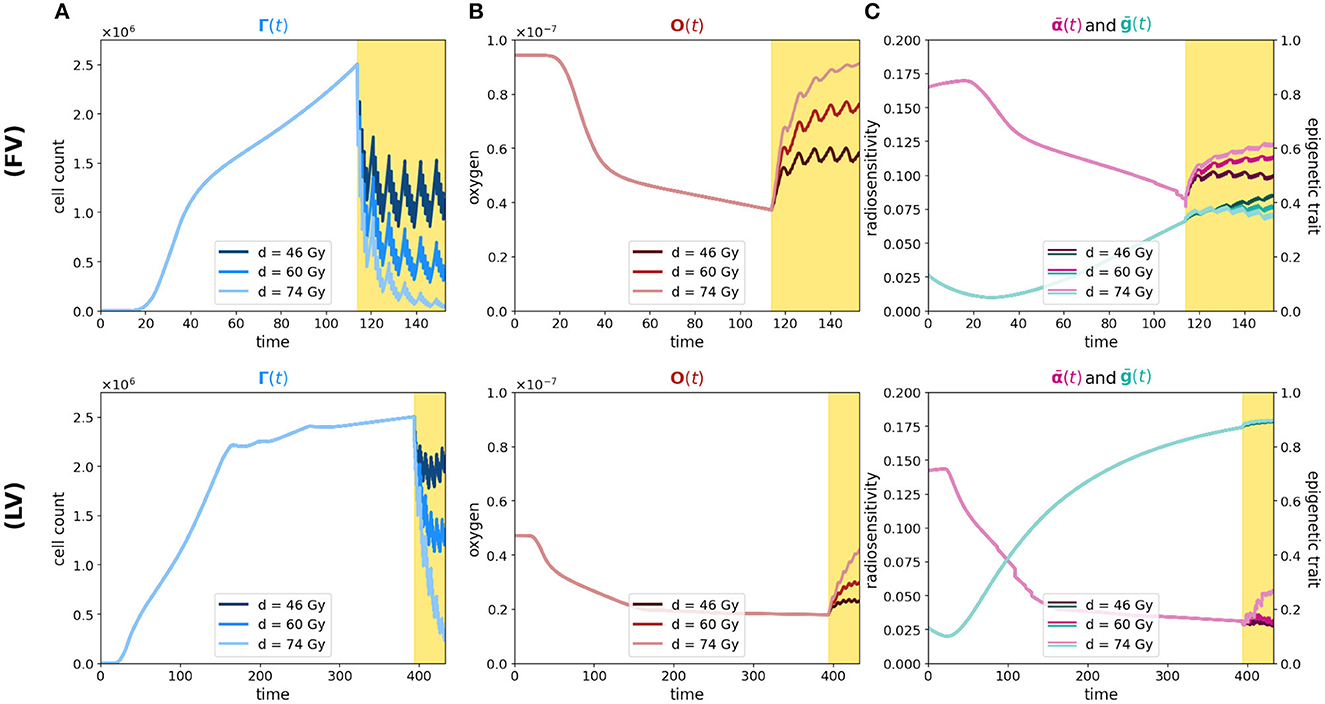
Figure 5. Simulation of tumor mass, growing starting from the center of the domain, in the two oxygenation conditions, the well and the poorly oxygenated tissue slices which correspond to the ΥFV layout (first row) and ΥHV layout ΥHV (second row). In each row, plot descriptions follow Figure 1 caption. Different colors depict experiments in which different total amounts of radiation are used (46, 60, and 74 Gy as indicated in legends).
As we can see in both cases, the effectiveness of the treatment is strictly dependent on the dose administered. In fact, higher doses correspond to smaller portions of the tumor that can survive, although, as previously mentioned, it is observed that, at the same dosage, radiation therapy is less efficient in the case of low oxygenation, compare panels (FV) and (HV) of Figure 5A.
Regarding reoxygenation phenomenon, both panels (FV) and (HV) of Figure 5B reveal that, in both low and high hypoxia case, the higher is the dosage, the more effective is the tissue reoxygenation. In the case of high oxygenated tissues, the epigenetic composition that characterizes a mass under this condition, shown in Figure 1E, is mainly composed of proliferating cells at the time of treatment administration; therefore, as expected, a lower dosage of radiotherapy implies a lower percentage of destruction of highly sensitive cells. Comparing the two cases with different oxygenation, (FV) and (HV), the different speed at which the tissue reoxygenates in all three tested dosages is consistent with the selection phenomenon mentioned above. We indeed expect that, as indicated by the radiosensitivity index and by the average epigenetic composition in the case of low oxygenation [shown in plots (FV) and (HV) of Figure 5C], there will be a smaller portion of radiosensitive cells, therefore a smaller portion of cells killed and consequently a slower reoxygenation, due to higher oxygen consumption.
The dynamics revealed by the model in terms of radiosensitivity and epigenetic composition of the mass, as a function of the dose amount, are interesting from a therapeutic point of view. Indeed, looking at the results shown in Figure 5C, in the presence of high oxygenation, it is evident that at higher doses, the likelihood of killing resistant cells becomes more pronounced. This dynamic, combined with reoxygenation, which reactivates the highly proliferative behavior of cells in the low epigenetic band, leads to a slight decrease in the average phenotypic trait. However, this change is not stable, as we can infer from previous analyses, and there are two potential drawbacks. The first concern is that, initially, reoxygenation and the availability of space, facilitated by the high kill rate, create conditions for rapid tumor regrowth. The second concern arises from the rapid overpopulation, which causes the oxygen profile to rapidly decline and, as a result, selection of resistant cells, and formation of necrotic areas.
In the same veins, the dynamics observed in the case of low oxygenation are even more interesting in terms of tailored radiotherapy protocols. As we can observe, the impact of the treatment's selective pressure is less evident. In fact, we notice variations of lower intensity compared to the previous scenario as the dosage increases in terms of both radiosensitivity and epigenetic firmness [see panels (FV) and (HV) in Figure 3C]. The only noticeable effect is seen on radiosensitivity for a dose of 74 Gy, which can be primarily attributed to the intensity of reoxygenation. This particular case is evidently more challenging in terms of treatment effectiveness. The dose of 46 Gy has almost no impact on cell killing, and the dose of 60 Gy proves to be ineffective as well. The only dose that can effectively eliminate a substantial number of cells is 72 Gy, but it also carries potential risks. Even in the presence of reoxygenation, the optimal epigenetic signature tends to be the high one across most of the domain (as we saw in Figure 1) . This supports the idea to target hypoxic areas with higher doses since no stronger selection with respect treatment resistance is observed; however, we pay special attention to the possibility of critical and highly resistant relapse in cases where complete eradication is not achieved. From this perspective, we hypothesize that the model's sensitivity in capturing these dynamics lays the groundwork for investigating various therapeutic protocols using this modeling approach. For instance, we can explore scenarios involving innovative techniques such as Stereotactic Body Radiation Therapy (SBRT) which involves delivering a small number of high radiation doses to a specific target volume using highly accurate equipment with the goal to optimize cancer control while minimizing adverse effects on healthy tissues (see e.g., [50]).
3.4. Heterogeneous tissue oxygenation
In this last experiment, we focus on a heterogeneous tissue oxygenation considering three oxygen sources in the Υ3V configuration. With such a layout, the most oxygenated areas are concentrated at the ends of the domain antibisector, leaving a condition of low oxygenation between them and along the bisector [see plot (IC) of Figure 6D where the optimal oxygenation areas are outlined]. Thus, keeping the starting point of the tumor unchanged at the center of the domain, the optimal trait, determined by the initial condition of the oxygen, is in the high epigenetic band. Consequently, the highly proliferative epigenetic characteristic that defines the initial tumor mass is suboptimal in terms of selection. This becomes evident when analyzing (Figure 6C) in comparison with the cell count evolution shown in Figure 6A. Initially, the average epigenetic trait is very low, but it gradually increases during the first phase due to selective pressure. During this period, the cell count experiences slow growth. Subsequently, cancer cells reach more oxygenated areas where lower epigenetic traits are favored. Around day 50, the average epigenetic trait reaches a local minimum, and the cell count starts to rapidly increase. This leads to a significant oxygen consumption until the moment of diagnosis. By comparing plots (IC) and (DG) in Figure 6D, we observe that at the initial time, there are optimal areas for all epigenetic traits and no necrotic regions. However, at the time of diagnosis, the oxygen has been consumed by cancer cells [consistently with plot (B)], resulting in a wide area of optimality only for high epigenetic traits, accompanied by some necrotic areas around the corner of the bisector. Then, when therapy is applied, despite an initial high mortality rate due to radiotherapy, its effectiveness decreases significantly in the second phase of administration (see Figure 6A). The low level of oxygenation in the central area of the domain maintains an important effect both of direct reduction of the therapeutic efficacy in this area and of selection of treatment-resistant epigenetic traits, plot PR of Figure 6D. Thus, therapy speeds up and assists the same dynamic that occurs due to environmental selection.
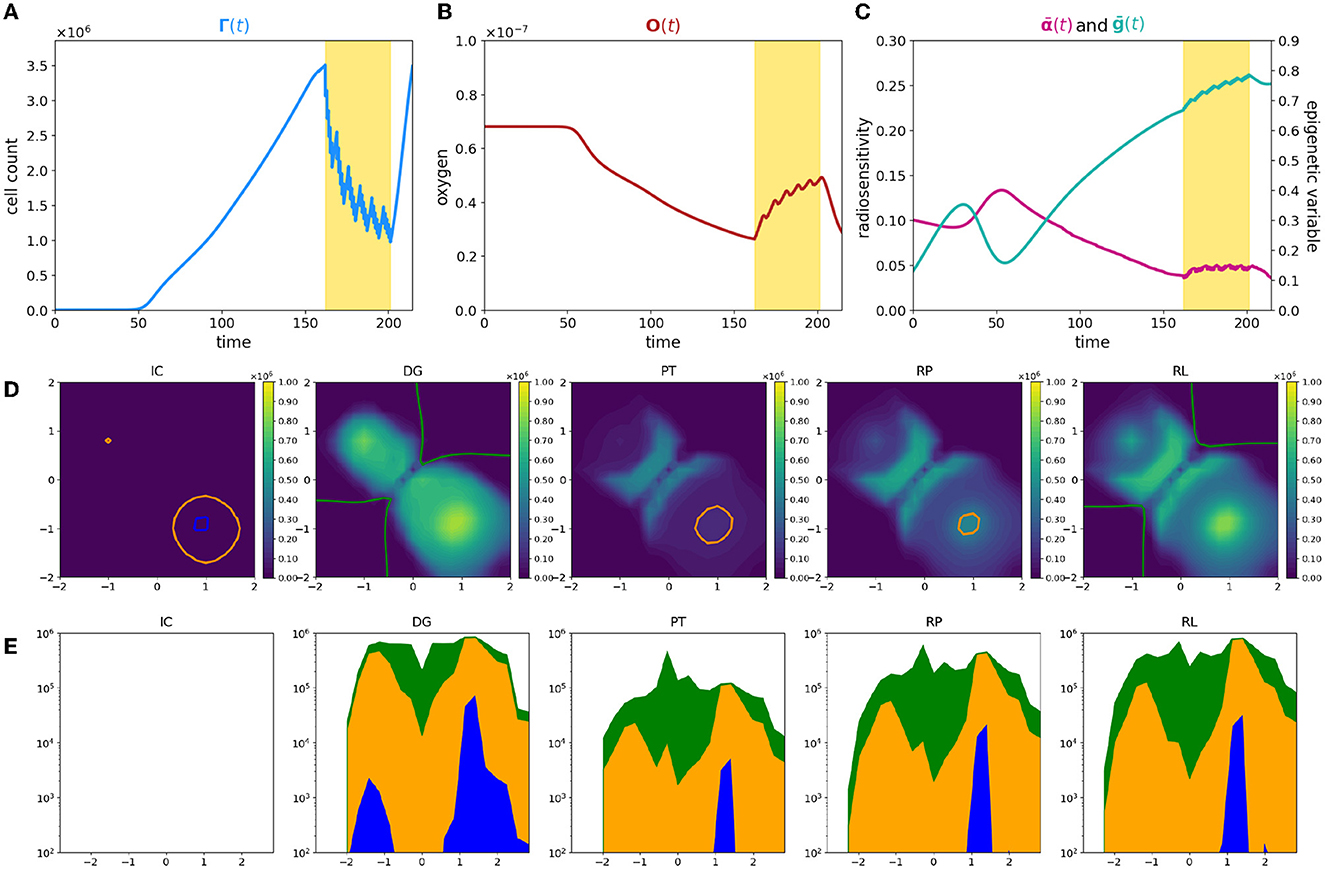
Figure 6. Simulation of tumor mass, growing from the center of the domain, with oxygen provided by the three source layout Υ3V. Plot description as in caption of Figure 1.
In the areas close to the oxygen sources, cells exhibit low epigenetic traits, leading to higher mortality rates. The significant death of these cells [as depicted in Figure 6D, panel PT, where two big holes appear corresponding to the higher density zone in Figure 6D, panel DG] triggers tissue reoxygenation, coherently with the oxygen profile during therapy in Figure 6B. This phenomenon is illustrated in Figure 6C by the observation that, despite the increase in average epigenetic traits, the radiosensitivity fluctuates around a constant value during therapy administration, counterbalanced by the rise in oxygen levels.
Analyzing the temporal phases of each epigenetic band, (Figures 6D, 6E) it is clear how the overlap of selective dynamics and therapy can modify the conformation of the tumor mass. In fact, comparing the second and last image, which refer to the moment of diagnosis (DG column) and to the moment of relapse (RL column), while the tumor has the same size in terms of numerosity, it shows many differences both from the point of view of the shape of the tumor and of the composition. Indeed, in a first phase (until diagnosis time), high epigenetic band has the selective fitness advantage (except from the small areas contoured in orange and blue), but it suffers from the proliferative dominance of lower epigenetic signatures. During therapy, the overlap of therapeutic resistance and environmental selection gives high epigenetic band an advantage, which is largely maintained in the repopulation phase, with the only exception of the lower right corner, where the fitness of low epigenetic band promotes an accumulation of highly proliferative cells, plot RP of Figure 6E. When the relapse occurs, from an epigenetic composition point of view, low epigenetic band cells kept a peak nearby the two oxygen sources close together, but are almost absent at the center of the domain and near the other source, differently from the previous times.
The above results highlight how a heterogeneous vasculature may lead to profound differences between the epigenetic composition of the tumor and its geometric characterization at the time of diagnosis and relapse. In conclusion, this experiment, therefore, shows the deep impact of therapy on the environment and on the characteristics of the tumor and it highlights, even more than the previous experiments, the potential of the model as a basis for therapeutic optimization strategies based on knowledge and predictive ability of the development of the mass.
4. Conclusion
In this study, we presented a mathematical approach to explore how low oxygen levels and hypoxia-associated tumor cell adaptions affect radiotherapy efficiency in the specific case of solid tumors. Specifically, we compared the effect of tumor microenvironment in the case of an efficient or inefficient tumor vasculature evaluating (i) how it can influence the heterogeneity in terms of proliferative potential of tumor cells and (ii) how its evolution could strongly influence the treatment success. The rationale of the work was (i) to identify the tumor regions composed by cells with low proliferative rate that are intrinsically more resistant to radiotherapy action, (ii) to study the consequences of the treatment in influencing their geometrical characterization, and (iii) to investigate if and how they can be potentially separately treated to maximize the tumor response, toward a tailoring of radiotherapy protocols and dose painting perspective [29].
The results show how the proposed approach is, first of all, able to reproduce the biological effect of irradiation as the result of both the total dose delivered and the physiological conditions in which it is applied. Moreover, the findings support the ability of the model to mirror specific eco-evolutionary features of different tumor masses, making predictions based on conditions that can widely range between patients.
Specifically, our tool suggests how three of the 6R that characterize tumor response after radiotherapy administration, namely repopulation, reoxygenation, and radiosensitivity, could display different dynamics in dependence on tumor oxygenation and the consequent distinct tumor–host interaction [5]. Summarizing, two relevant dynamics from a clinical point of view are kept by the model. First, coherently with the clinically observed inter-patient variability in terms of therapy response, the nominal tumor size alone is insufficient to predict growth dynamics and that the definition of personalized indexes is needed to define an efficient therapeutic plan. In this respect, the model results suggest that two patients that present a similar tumor volume could have a distinct tumor–host co-evolution history, which results in different responses to the same radiotherapy protocol [26]. In this respect, in the two cases analyzed, it is significantly distinct the in-time evolution of the radiosensitivity of the mass, guided by both the different radio-induced reoxygenation and epigenetic composition. Our predictions show indeed that, in the case of high oxygenation, reoxygenation is sufficient to prompt the mass toward an higher sensibility to the treatment; at the contrary, in the case of low oxygenation, a degenerating dynamics toward a more resistant mass can be observed, even in presence of higher quantity of available oxygen, highlighting the central role of epigenetic heterogeneity in tumor therapy response. Second, to maximize the effect of the treatment in terms of a balance between the portion killed and the selective bottleneck induced, the choice of the dose amount administrated turns out to be necessary related to tumor oxygenation. The model results suggest indeed that, under oxygenation conditions that do not strongly affect the effectiveness of therapy, the heterogeneity of the mass plays a crucial role in the development of treatment resistance; at the highest radiation dosage, a marked epigenetic shift toward resistant epigenetic traits and a rapid decrease in the radiosensitivity of the mass are indeed observe. At the contrary, in strongly hypoxic conditions, the predictions reveal a greater reduction in mass for higher doses but, at the same time, not an equally large variation in terms of composition and radiosensitivity compared to those observed at lower doses, supporting the idea of tailoring radiotherapy protocols and dose painting that consists in delivery selective boosting dose to radio-resistant (in this specific case hypoxic) regions.
Supported by the results, we speculate that the sensibility of the model in catching these dynamics potentially paves the way to investigate, via this modeling approach, different administration scenarios in the case of, for example, innovative techniques as Stereotactic Body Radiation Therapy (SBRT) in which a small number of high doses of radiation are delivered to a target volume using highly accurate equipment to maximize cancer control [29]. As natural evolution, future studies will focus on the model outcomes varying the total dosage, the target regions but additionally the fractionation scheme. There is indeed biological evidence that alternative radiation fractionation protocols sometimes improve the outcome while worsen in others cases; altered schemes, such as hyperfractionation, accelerated fractionation, and hypofractionation, have been suggested as alternatives for certain indications [51, 52].
This, in addition to the already shown results, potentially allows to exploit our tool to investigate possible therapeutic strategies to optimize the radiotherapy outcome in light of the epigenetic and geometric inhomogeneities, considering the inter-patient variability experimentally observed.
Finally, an intriguing perspective arises when interpreting the results of our study in relation to the concept of “cancer oncospace”, as introduced in Aguadé-Gorgorió et al. [53]. This concept encompasses a multidimensional space that captures the intricate and shared characteristics of cancer heterogeneity. Specifically, the oncospace framework aims to investigate the underlying mechanisms contributing to tumor development and progression, encompassing ecological, evolutionary, and developmental factors.
Our study findings provide valuable insights into the dynamics of tumor response to radiotherapy, taking into account factors such as tumor oxygenation and epigenetic composition. They reveal distinct co-evolution histories and responses to the same treatment protocol among different tumor masses. These findings underscore the significance of personalized indices and the consideration of inter-patient variability when designing efficient therapeutic plans. Overall, these results align with the principles of cancer oncospace by emphasizing the importance of comprehending the multidimensional nature of cancer, including factors like tumor microenvironment, heterogeneity, and personalized treatment approaches, to optimize therapy outcomes.
Data availability statement
The original contributions presented in the study are included in the article/supplementary material, further inquiries can be directed to the corresponding author.
Author contributions
GC: conceptualization, methodology, software, writing, and visualization. GF: conceptualization, methodology, writing, and visualization. MD: conceptualization, methodology, writing, visualization, and supervision. All authors contributed to the article and approved the submitted version.
Funding
This research was partially supported by the Italian Ministry of Education, University and Research (MIUR) through the Dipartimenti di Eccellenza Programme (2018-2022)—Dipartimento di Scienze Matematiche G. L. Lagrange, Politecnico di Torino (CUP: E11G18000350001).
Acknowledgments
GC and MD are members of GNFM (Gruppo Nazionale per la Fisica Matematica) of INdAM (Istituto Nazionale di Alta Matematica).
Conflict of interest
The authors declare that the research was conducted in the absence of any commercial or financial relationships that could be construed as a potential conflict of interest.
Publisher's note
All claims expressed in this article are solely those of the authors and do not necessarily represent those of their affiliated organizations, or those of the publisher, the editors and the reviewers. Any product that may be evaluated in this article, or claim that may be made by its manufacturer, is not guaranteed or endorsed by the publisher.
References
1. Abbas Z, Rehman S. An overview of cancer treatment modalities. Neoplasm. (2018) 1:139–57. doi: 10.5772/intechopen.76558
2. Baskar R, Lee KA, Yeo R, Yeoh KW. Cancer and radiation therapy: current advances and future directions. Int J Med Sci. (2012) 9:193. doi: 10.7150/ijms.3635
3. Baskar R, Yap SP, Chua KLM, Itahana K. The diverse and complex roles of radiation on cancer treatment: therapeutic target and genome maintenance. Am J Cancer Res. (2012) 2:372.
4. Demaria S, Formenti SC. Radiation as an immunological adjuvant: current evidence on dose and fractionation. Front Oncol. (2012) 2:153. doi: 10.3389/fonc.2012.00153
5. Rakotomalala A, Escande A, Furlan A, Meignan S, Lartigau E. Hypoxia in solid tumors: how low oxygenation impacts the “Six Rs” of radiotherapy. Front Endocrinol. (2021) 12:742215. doi: 10.3389/fendo.2021.742215
6. Horsman MR, Mortensen LS, Petersen JB, Busk M, Overgaard J. Imaging hypoxia to improve radiotherapy outcome. Nat Rev Clin Oncol. (2012) 9:674–87. doi: 10.1038/nrclinonc.2012.171
7. Fukumura D, Jain RK. Tumor microenvironment abnormalities: causes, consequences, and strategies to normalize. J Cell Biochem. (2007) 101:937–49. doi: 10.1002/jcb.21187
8. Kim W, Lee S, Seo D, Kim D, Kim K, Kim E, et al. Cellular stress responses in radiotherapy. Cells. (2019) 8:1105. doi: 10.3390/cells8091105
9. Rockwell S, Dobrucki IT, Kim EY, Marrison ST, Vu VT. Hypoxia and radiation therapy: past history, ongoing research, and future promise. Curr Mol Med. (2009) 9:442–58. doi: 10.2174/156652409788167087
10. Gatenby RA, Brown JS. Integrating evolutionary dynamics into cancer therapy. Nat Rev Clin Oncol. (2020) 17:675–86. doi: 10.1038/s41571-020-0411-1
11. Burrell RA, Swanton C. Tumour heterogeneity and the evolution of polyclonal drug resistance. Mol Oncol. (2014) 8:1095–111. doi: 10.1016/j.molonc.2014.06.005
12. Dujon AM, Aktipis A, Alix-Panabières C, Amend SR, Boddy AM, Brown JS, et al. Identifying key questions in the ecology and evolution of cancer. Evol Appl. (2021) 14:877–92. doi: 10.1111/eva.13190
13. Brady-Nicholls R, Zhang J, Zhang T, Wang AZ, Butler R, Gatenby RA, et al. Predicting patient-specific response to adaptive therapy in metastatic castration-resistant prostate cancer using prostate-specific antigen dynamics. Neoplasia. (2021) 23:851–8. doi: 10.1016/j.neo.2021.06.013
14. Corwin D, Holdsworth C, Rockne RC, Trister AD, Mrugala MM, Rockhill JK, et al. Toward patient-specific, biologically optimized radiation therapy plans for the treatment of glioblastoma. PLoS ONE. (2013) 8:e79115. doi: 10.1371/journal.pone.0079115
15. Ardaševa A, Gatenby RA, Anderson AR, Byrne HM, Maini PK, Lorenzi T. A mathematical dissection of the adaptation of cell populations to fluctuating oxygen levels. Bull Math Biol. (2020) 82:81. doi: 10.1007/s11538-020-00754-7
16. Strobl MA, Krause AL, Damaghi M, Gillies R, Anderson AR, Maini PK. Mix and match: phenotypic coexistence as a key facilitator of cancer invasion. Bull Math Biol. (2020) 82:15. doi: 10.1007/s11538-019-00675-0
17. Villa C, Chaplain MA, Lorenzi T. Evolutionary dynamics in vascularised tumours under chemotherapy: mathematical modelling, asymptotic analysis and numerical simulations. Vietnam J Math. (2021) 49:143. doi: 10.1007/s10013-020-00445-9
18. Lorenzi T, Venkataraman C, Lorz A, Chaplain MA. The role of spatial variations of abiotic factors in mediating intratumour phenotypic heterogeneity. J Theor Biol. (2018) 451:101–10. doi: 10.1016/j.jtbi.2018.05.002
19. Lorz A, Lorenzi T, Clairambault J, Escargueil A, Perthame B. Modeling the effects of space structure and combination therapies on phenotypic heterogeneity and drug resistance in solid tumors. Bull Math Biol. (2015) 77:1–22. doi: 10.1007/s11538-014-0046-4
20. Villa C, Chaplain MA, Lorenzi T. Modeling the emergence of phenotypic heterogeneity in vascularized tumors. SIAM J Appl Math. (2021) 81:434–53. doi: 10.1137/19M1293971
21. Fiandaca G, Delitala M, Lorenzi T. A mathematical study of the influence of hypoxia and acidity on the evolutionary dynamics of cancer. arXiv. (2020). [preprint]. doi: 10.48550/arXiv.2009.00251
22. Celora GL, Byrne HM, Kevrekidis P. Spatio-temporal modelling of phenotypic heterogeneity in tumour tissues and its impact on radiotherapy treatment. J Theor Biol. (2023) 556:111248. doi: 10.1016/j.jtbi.2022.111248
23. Hamis S, Powathil GG, Chaplain MA. Blackboard to bedside: a mathematical modeling bottom-up approach toward personalized cancer treatments. JCO Clin Cancer Inf . (2019) 3:1–11. doi: 10.1200/CCI.18.00068
24. Kuznetsov M, Kolobov A. Optimization of dose fractionation for radiotherapy of a solid tumor with account of oxygen effect and proliferative heterogeneity. Mathematics. (2020) 8:1204. doi: 10.3390/math8081204
25. Lewin TD, Maini PK, Moros EG, Enderling H, Byrne HM. The evolution of tumour composition during fractionated radiotherapy: implications for outcome. Bull Math Biol. (2018) 80:1207–35. doi: 10.1007/s11538-018-0391-9
26. Poleszczuk J, Walker R, Moros EG, Latifi K, Caudell JJ, Enderling H. Predicting patient-specific radiotherapy protocols based on mathematical model choice for proliferation saturation index. Bull Math Biol. (2018) 80:1195–206. doi: 10.1007/s11538-017-0279-0
27. Ling CC, Humm J, Larson S, Amols H, Fuks Z, Leibel S, et al. Towards multidimensional radiotherapy (MD-CRT): biological imaging and biological conformality. Int J Radiat Oncol Biol Phys. (2000) 47:551–60. doi: 10.1016/S0360-3016(00)00467-3
28. Baumann M, Krause M, Overgaard J, Debus J, Bentzen SM, Daartz J, et al. Radiation oncology in the era of precision medicine. Nat Rev Cancer. (2016) 16:234–49. doi: 10.1038/nrc.2016.18
29. Grimes DR, Warren DR, Warren S. Hypoxia imaging and radiotherapy: bridging the resolution gap. Br J Radiol. (2017) 90:20160939. doi: 10.1259/bjr.20160939
30. Flashner-Abramson E, Vasudevan S, Adejumobi IA, Sonnenblick A, Kravchenko-Balasha N. Decoding cancer heterogeneity: studying patient-specific signaling signatures towards personalized cancer therapy. Theranostics. (2019) 9:5149–65. doi: 10.7150/thno.31657
31. Chiari G, Fiandaca G, Delitala ME. Hypoxia-resistance heterogeneity in tumours: the impact of geometrical characterization of environmental niches and evolutionary trade-offs. A mathematical approach. arXiV. (2023). [preprint]. doi: 10.48550/arXiv.2306.01793
32. Martínez-González A, Calvo GF, Pérez Romasanta LA, Pérez-García VM. Hypoxic cell waves around necrotic cores in glioblastoma: a biomathematical model and its therapeutic implications. Bull Math Biol. (2012) 74:2875–96. doi: 10.1007/s11538-012-9786-1
33. Korolev KS, Xavier JB, Gore J. Turning ecology and evolution against cancer. Nat Rev Cancer. (2014) 14:371–80. doi: 10.1038/nrc3712
34. Vaupel P, Thews O, Hoeckel M. Treatment resistance of solid tumors. Med Oncol. (2001) 18:243–59. doi: 10.1385/MO:18:4:243
35. Jones L, Hoban P, Metcalfe P. The use of the linear quadratic model in radiotherapy: a review. Australas Phys Eng Sci Med. (2001) 24:132–46. doi: 10.1007/BF03178355
36. Van Leeuwen C, Oei A, Crezee J, Bel A, Franken N, Stalpers L, et al. The alfa and beta of tumours: a review of parameters of the linear-quadratic model, derived from clinical radiotherapy studies. Radiat Oncol. (2018) 13:1–11. doi: 10.1186/s13014-018-1040-z
37. Celora GL, Byrne HM, Zois CE, Kevrekidis PG. Phenotypic variation modulates the growth dynamics and response to radiotherapy of solid tumours under normoxia and hypoxia. J Theor Biol. (2021) 527:110792. doi: 10.1016/j.jtbi.2021.110792
38. Joiner MC, Van Der Kogel AJ. Basic Clinical Radiobiology, Vol 5. Boca Raton, FL: CRC Press (2018). doi: 10.1201/9780429490606
39. Grimes DR, Fletcher AG, Partridge M. Oxygen consumption dynamics in steady-state tumour models. R Soc Open Sci. (2014) 1:140080. doi: 10.1098/rsos.140080
40. Brown JM, Wilson WR. Exploiting tumour hypoxia in cancer treatment. Nat Rev Cancer. (2004) 4:437–47. doi: 10.1038/nrc1367
41. Doerfler W, Böhm P. DNA Methylation: Development, Genetic Disease and Cancer, Vol. 310. Berlin: Springer Science & Business Media (2006). doi: 10.1007/3-540-31181-5
42. Shashni B, Ariyasu S, Takeda R, Suzuki T, Shiina S, Akimoto K, et al. Size-based differentiation of cancer and normal cells by a particle size analyzer assisted by a cell-recognition PC software. Biol Pharm Bull. (2018) 41:487–503. doi: 10.1248/bpb.b17-00776
43. Daşu A, Toma-Daşu I, Karlsson M. Theoretical simulation of tumour oxygenation and results from acute and chronic hypoxia. Phys Med Biol. (2003) 48:2829–42. doi: 10.1088/0031-9155/48/17/307
44. Langtangen HP, Logg A. Solving PDEs in Python. Berlin: Springer (2017). doi: 10.1007/978-3-319-52462-7
45. Folkman J, Hochberg M. Self-regulation of growth in three dimensions. J Exp Med. (1973) 138:745–53. doi: 10.1084/jem.138.4.745
46. Oraiopoulou ME, Tzamali E, Tzedakis G, Vakis A, Papamatheakis J, Sakkalis V. In vitro/in silico study on the role of doubling time heterogeneity among primary glioblastoma cell lines. BioMed Res Int. (2017) 2017:8569328. doi: 10.1155/2017/8569328
47. Hong BJ, Kim J, Jeong H, Bok S, Kim YE, Ahn GO. Tumor hypoxia and reoxygenation: the yin and yang for radiotherapy. Radiat Oncol J. (2016) 34:239. doi: 10.3857/roj.2016.02012
48. Zakelj MN, Prevc A, Kranjc S, Cemazar M, Todorovic V, Savarin M, et al. Electrochemotherapy of radioresistant head and neck squamous cell carcinoma cells and tumor xenografts. Oncol Rep. (2019) 41:1658–68. doi: 10.3892/or.2019.6960
49. Alfonso J, Berk L. Modeling the effect of intratumoral heterogeneity of radiosensitivity on tumor response over the course of fractionated radiation therapy. Radiat Oncol. (2019) 14:1–12. doi: 10.1186/s13014-019-1288-y
50. Lo SS, Fakiris AJ, Chang EL, Mayr NA, Wang JZ, Papiez L, et al. Stereotactic body radiation therapy: a novel treatment modality. Nat Rev Clin Oncol. (2010) 7:44–54. doi: 10.1038/nrclinonc.2009.188
51. Kåver G, Lind BK, Löf J, Liander A, Brahme A. Stochastic optimization of intensity modulated radiotherapy to account for uncertainties in patient sensitivity. Phys Med Biol. (1999) 44:2955. doi: 10.1088/0031-9155/44/12/308
52. Tucker SL, Thames Jr HD. The effect, of patient-to-patient variability on the accuracy of predictive assays of tumor response to radiotherapy: a theoretical evaluation. Int J Radiat Oncol Biol Phys. (1989) 17:145–57. doi: 10.1016/0360-3016(89)90382-9
Keywords: radiotherapy resistance, hypoxia, tumor phenotypic heterogeneity, tumor-microenvironment interaction, niche construction, continuous structured models, tailored radiotherapy protocols
Citation: Chiari G, Fiandaca G and Delitala ME (2023) Hypoxia-related radiotherapy resistance in tumors: treatment efficacy investigation in an eco-evolutionary perspective. Front. Appl. Math. Stat. 9:1193191. doi: 10.3389/fams.2023.1193191
Received: 24 March 2023; Accepted: 21 June 2023;
Published: 13 July 2023.
Edited by:
Jean Clairambault, Institut National de Recherche en Informatique et en Automatique (INRIA), FranceReviewed by:
Paolo Zunino, Polytechnic University of Milan, ItalyHaralampos Hatzikirou, Khalifa University, United Arab Emirates
Copyright © 2023 Chiari, Fiandaca and Delitala. This is an open-access article distributed under the terms of the Creative Commons Attribution License (CC BY). The use, distribution or reproduction in other forums is permitted, provided the original author(s) and the copyright owner(s) are credited and that the original publication in this journal is cited, in accordance with accepted academic practice. No use, distribution or reproduction is permitted which does not comply with these terms.
*Correspondence: Giulia Chiari, giulia.chiari@polito.it