 Shane Sanders
 Justin Ehrlich1
 James Boudreau
94% of researchers rate our articles as excellent or good
Learn more about the work of our research integrity team to safeguard the quality of each article we publish.
Find out more
ORIGINAL RESEARCH article
Front. Appl. Math. Stat., 27 March 2023
Sec. Statistics and Probability
Volume 9 - 2023 | https://doi.org/10.3389/fams.2023.1169164
This article is part of the Research TopicTheoretical and Empirical Approaches to Public ChoiceView all 4 articles
This study establishes sufficient conditions for observing instances of Simpson's (data aggregation) Paradox under rank sum scoring (RSS), as used, e.g., in the Wilcoxon-Mann-Whitney (WMW) rank sum test. The WMW test is a primary nonparametric statistical test in FDA drug product evaluation and other prominent medical settings. Using computational nonparametric statistical methods, we also establish the relative frequency with which paradox-generating Simpson Reversals occur under RSS when an initial data sequence is pooled with its ordinal replicate. For each 2-sample, n-element per sample or 2 x n case of RSS considered, strict Reversals occurred for between 0% and 1.74% of data poolings across the whole sample space, roughly similar to that observed for 2 x 2 x 2 contingency tables and considerably less than that observed for path models. The Reversal rate conditional on observed initial sequence is highly variable. Despite a mode at 0%, this rate exceeds 20% for some initial sequences. Our empirical application identifies clusters of Simpson Reversal susceptibility for publicly-released mobile phone radiofrequency exposure data. Simpson Reversals under RSS are not simply a theoretical concern but can reverse nonparametric or parametric biostatistical results even in vitally important public health settings. Conceptually, Paradox incidence can be viewed as a robustness check on a given WMW statistical test result. When an instance of Paradox occurs, results constituting this instance are found to be data-scale dependent. Given that the rate of Reversal can vary substantially by initial sequence, the practice of calculating this rate conditional on observed initial sequence represents a potentially important robustness check upon a result.
Simpson's Aggregation Paradox, also known as the Yule-Simpson Aggregation Paradox, represents an anomaly in statistics whereby two qualitatively equivalent statistical test results—each arising from one of two qualitatively equivalent statistical test results—reverse when the same statistical test is applied to the pooled data. The Paradox was first put forth by Yule [1] and later developed by Simpson [2]. While first analyzed for the domain of parametric testing, its presence in non-parametric statistical results has recently been studied [3–5]. Of particular importance to the present study, Haunsperger and Saari [5] find conditions for Simpson Reversal in rank sum statistical testing, where the term Simpson Reversal is used synonymously with the term instances of Simpson's Aggregation Paradox herein. In general, the Paradox has been found to affect statistical results in many important scientific domains, including pharmaceutical drug testing, environmental research, and related medical and scientific research (see, e.g., Allison and Goldberg [6], Huang et al. [7], and Pineiro et al. [8]). Chipman and Braun [9] identify and characterize the Paradox for integrated discrimination improvement comparisons of two prediction models. In studying global temperature over time, Foster and Rahmstorf [10] note that the scale of date (time scale of study) can influence the statistical results of a study. [11] note the importance of the Paradox when analyzing geospatial data, while Tran and Waller [12] note that the Paradox can explain variability in results of environmental data analysis. Berger et al. [13] find evidence of aggregation paradox instances in randomized clinical trial data. Evidence of aggregation paradox has also been found in the settings of large-scale registry data [14], meta-analyzes of an academic literature [15], and clinical risk reclassification [16].
In one respect, the Paradox can be viewed as a robustness check on a given statistical result. When the Paradox occurs, it follows that a given result is at least partly a function of data scale or sample size. As noted, the Paradox has been shown to occur for the Wilcoxon-Mann-Whitney (WMW) Rank Sum Test. However, there exists no computational or empirical evidence as to the frequency with which instances of the Paradox occur for the WMW Rank Sum Test and little such evidence for non-parametric statistical tests overall. Are Simpson Reversals pervasive or only a marginal concern for the WMW Test? Even previuos research as to the incidence of the Paradox for parametric statistical tests is scarce and provides somewhat contrasting conclusions. There are two studies that directly estimate the incidence of Simpson's Paradox for parametric tests: one pertaining to contingency tables and the other pertaining to path models. Specifically, [17] find that a Simpson Reversal occurs for one-sixtieth (1.67%) of all 2 x 2 x 2 contingency tables. Kock [18] estimates the likelihood of a Simpson Reversal in path models as approximately 12.8%.
Hammond [19] considers the aggregation of cross-country running individual positions via rank sum scoring, as do Mixon and King [20]. Both studies find evidence of major social choice violations in rank sum scoring. Mixon and King conclude that these violations are expected to create noise in the allocation of coaching positions and salaries for the sport. Similarly, Sanders et al. [21] find that variation in outcome by aggregation rule is fairly common for rank sum scoring and other aggregation common aggregation rules. For nonparametric statistical testing, Nagaraja and Sanders [22] consider a case in which a data set is ordinally replicated and then pooled with the replicate data set. In such an environment, the authors prove that Simpson Reversals cannot occur if the sign test for matched pairs is applied to the primitive and pooled data sets. They also show evidence of Simpson Reversals for the WMW Test. The authors further discuss the advantage of such a pooled replicate approach to studying Simpson Reversals in nonparametric settings. By introducing and pooling an observed data set with its ordinal replicate, one introduces no additional information to the comparison between two or more groups (e.g., between groups A and B). As such, instances of Simpson Reversal that occur when an ordinal data is pooled with its ordinal replicate act as a pure robustness check upon a statistical result. Given only iterations of this data sequence and the statistical test, we can obtain alternative results by varying the scale of the data. As such, the original result can be viewed as scale-dependent. Moreover, a data sequence's ordinal replicate is always accessible such that this robustness check can be applied to every nonparametric statistical result. Given these advantages, we will adopt a pooled replicate approach to studying Simpson Reversals in the present study.
Despite important theoretical contributions by Haunsperger and Saari [5] and Nagaraja and Sanders [22], there have been no computational studies that assess the incidence of Simpson Reversals in the case of nonparametric tests. Though we know the WMW Test yields instances of the Paradox, we cannot ascertain without computational support if these instances are fairly frequent, as in the case of path models, or somewhat rare, as in the case of contingency tables. The answer to this question has potentially important implications. The WMW Test is a leading nonparametric statistical test across the medical sciences (see, e.g., Lin et al. [23]). For example, this test is routinely used to assess drug efficacy in FDA clinical trials, as well as in EPA data evaluation (see, e.g., Boudreau et al. [24] for a discussion of FDA use of this test in the Statstical Review and Evaluations of products such as Novantrone, Memantine, Cologuard, Pitressin, SPD485, Oxaliplatin, Oxcarbazepine, Berinert, Novartis, Vascepa, Trileptal, and many others). Results as to incidence of Simpson Reversals for the WMW Test can effectively assess the general robustness of WMW Test results to data scale changes. As Simpson Reversals cast ambiguity on a given original result, incidence of Simpson Reversal for a test shares similarities to the concept of a hypothesis test p-value. In the same way that a p-value assesses the proportion of significance results that are, in fact, non-robust due to sample variation, incidence of Simpson Reversal assesses the proportion of statistical test results that are non-robust due to data scale dependence. In this sense, the proportional incidence of Simpson Reversal might be thought of as loosely analogous to a hypothesis test p-value (e.g., when considering the magnitude of the proportion).
In general, the study of aggregation paradoxes and public choice outcomes has received substantial treatment. Klein [25], March [26], Sobel [27], and Tabarrok [28, 29], and Leeson and Thompson [30] each consider the role of the FDA in public health outcomes. Each of these studies finds government failures stemming from the FDA's decision-making criteria, where the FDA depends heavily on non-parametric efficacy tests that are subject to aggregation paradoxes.
Herein, we consider all 2-group, k-element per group cases of RSS for k ∈ {2, 3, 4, 5, 6, 7, 8}. For each case up to k = 7, we enumerate every possible rank outcome sequence in that case. For each given sequence, we then ordinally replicate the sequence and consider all possible poolings of the sequence with its ordinal replicate. For each case, we then compute the relative frequency with which a strict Simpson Reversal occurs. We find that strict instances of the Paradox cannot occur for 2-group, k-element per group cases of RSS where k ∈ {1, 2} but that instances occur for approximately 1.7 percent of sequence poolings in the 2-group, 5-element and 2-group, 7-element cases. Given the computational complexity of the problem—for the 2-group, 8-element case, there are 7.74 trillion possible poolings of two rank data sequences—we are not able to extend the results beyond the k = 7 case at present. However, we use a simulation approach to characterize the 2-group, 8-element case herein. We conclude from our computational results that the incidence of Simpson Reversals in this setting is lower than a standard, allowable Type I error rate (α-value) for a statistical test. Given conceptual similarities between a test's p-value and its Simpson Reversal rate, as discussed previously, we might then characterize the incidence of Simpson Reversal for considered cases of rank sum testing as “tolerable” from the perspective of statistical sensitivity. For certain initial data sequences, however, Reversals are found to be much more prevalent, occurring as frequently as roughly once in five poolings for certain initial sequences. As such, incidence of Simpson Reversals should ideally be considered conditional upon both the test and data under consideration.
Let us formally define 2-group rank sum scoring. Consider two groups, A and B. Each group is defined as a rank-ordered sequence of n individual elements, where n is some integer greater than 1 (n ∈ Z+). For example, A is defined as A = (a1, a2, a3, …, an), where the element ai represents the ith ranked element in A. We define an event as an objective process of comparison that generates a complete rank-order sequence of individuals across more than one group (i.e., both within and between groups). An event might be defined as a competition or as a statistical test. Consider an event in which elements of A and B are compared. If A and B are each composed of n elements, for example, then the event generates a rank-ordered outcome sequence of 2n elements. One possible outcome sequence for the case in which n = 3 is FAB = (a1, b1, b2, a2, b3, a3). If ai precedes bj in the outcome sequence, we say ai ≻ bj (ai ranks higher than bj). For simplicity, we assume that rank-order equality between two elements is not possible, an outcome that would obtain given continuous measurement of underlying parameter values. For any ai ∈ A and bj ∈ B, that is, we have that ai ≻ bj ⊕ bj ≻ ai is a tautology.
Formally, we represent the rank of an element ai ∈ A in the outcome sequence FAB as r(ai ∣ FAB). Let be the set of elements in FAB that rank better than ai. Then, . From elemental rankings, we generate a rank sum score for each group as follows. The respective scores for A and B for outcome sequence FAB are S(A ∣ FAB) = Σaj ∈ A r(aj ∣ FAB) and S(B ∣ FAB) = Σbj ∈ B r(bj ∣ FAB), where it must be that . That is, the sum of ranks for a 2n element sequence simply equals the sum of integers from 1 to 2n. We map from group scores to group rankings to obtain the following outcomes.
We consider an environment in which a data set yields a given aggregate or group rank-ordering result under RSS (e.g., A ≻ B). We then ordinally replicate the data. By necessity, the ordinal replicate data will yield the same group rank result under RSS. As RSS is a nonparametric form of scoring, only the order of elements influences the group ranking. We then aggregate the original data set with its ordinal replicate as in Nagaraja and Sanders [22] and consider whether (under what conditions) the pooled data yields a different group rank result under RSS than do its two constituent data sets. That is, we consider the conditions for strict Simpson Reversal, whereby the outcome in 1 (3) is obtained for each constituent data sequence, but outcome 3 (1) is obtained for the pooled sequence. It is important to note that an ordinal-replicate data sequence can have starkly different parametric values than the original data sequence that it ordinally replicates. Ordinal replication simply implies the same ordering of elements across the two sequences.
Let FAB represent the original data sequence, its ordinal replicate, and the sequence whereby FAB and are pooled by comparing the underlying parametric value of each element. Formally, we define a Simpson Reversal as follows.
Definition 1. Simpson Reversal: When FAB and are pooled, a strict Simpson Reversal occurs if Equivalently, a strict Simpson Reversal occurs if These conditions yield the group rank result that A ≻F B and , but (i.e., that A ranks strictly higher than B in F and F′, but B ranks strictly higher than A in FF′) or that B ≻F A and , but (i.e., that B ranks strictly higher than A in F and F′, but A ranks strictly higher than B in FF′).
We now derive sufficient conditions for the presence and absence of Simpson Reversal in RSS.
Theorem 1. (Sufficient Condition for Simpson Reversal in Rank Sum Scoring)
For any two groups, A and B, such that A ≻ B in pairwise comparison for a given outcome sequence, FAB (i.e., A ≻FAB B), let ζ be the largest integer such that bi+ζ−1 ≻ ai in FAB (). When FAB and are pooled, a strict Simpson Reversal occurs for at least one pooling of A and B if S(B ∣ FAB) − S(A ∣ FAB) < nζ.
Proof: Note that the maximum differential impact toward a reversal that has when pooled with FAB is if all n elements of are pooled with FAB in a way that they are placed between bi+ζ−1 and ai of FAB. In this case, the pooling effect of upon FAB is to raise the score of A by 2nζ more rank sum units than the score of B. If the 2n elements of are pooled with FAB at this position, then ζ more elements of A in FAB than B in FAB each lose 2n rank positions (gain 2n additional rank sum points) to the elements of . Regardless of the reciprocal pooling effect of FAB upon , then, we are assured of at least this stated differential pooling effect for some pooling of FAB and .
As a countervailing effect, A has a lower score than B by S(B ∣ FAB) − S(A ∣ FAB) units in FAB (by definition) and by the same margin in , as ) due to FAB and being ordinal replicates. Then, relative to depends upon the magnitude of the pooling effect in comparison to the magnitudes of [S(B ∣ FAB) − S(A ∣ FAB)] and , where the latter two terms are equal to each other. For a sequence, FAB, and its ordinal replicate, then, a Simpson Reversal is certain to occur if 2 · [S(B ∣ FAB) − S(A ∣ FAB)] < 2nζ. That is, a Simpson Reversal is certain to occur if [S(B ∣ FAB) − S(A ∣ FAB)] < nζ■.
Theorem 2. (Sufficient Condition for Impossibility of Simpson Reversal in Rank Sum Scoring)
For any two groups, A and B, such that A ≻ B, in pairwise comparison for a given outcome sequence, FAB (i.e., A ≻FAB B), let ζ be the largest integer such that bi+ζ−1 ≻ ai in F (F′). A strict Simpson Reversal cannot occur for any pooling of FAB and if S(B ∣ FAB) − S(A ∣ FAB) ≥ 2nζ.
Proof: Note that the maximum differential impact toward a reversal that can have when pooled with FAB is if all n elements of are pooled with FAB in a way that they are placed between bi+ζ−1 and ai of FAB. Reciprocally, the maximum differential that FAB can have when pooled with is if all n elements of FAB are pooled with in a way that they are placed between bi+ζ−1 and ai of Thus, the maximum achievable two-way pooling effect of FAB cannot exceed 4nζ. If 4nζ is not greater than the primitive score differentials between A and B in FAB and , then a strict Reversal is not possible. That is, if 2 · [S(B ∣ FAB) − S(A ∣ FAB] ≥ 4nζ, then a strict Reversal is not possible ■.
Interestingly, this condition is similar to the condition for a violation of Independence from Irrelevant Alternatives (IIA) found in Boudreau et al. [31]. This equivalence is not coincidental. Rather, Simpson Reversals share important properties with IIA violations. In each case, a pairwise group ranking is overturned by the inclusion of additional data, where the imposed data is not expected to overturn the original ranking. Like an IIA violation, a Simpson Reversal requires the additional data to impose a sufficiently differential effect upon the respective rank sum scores of the two groups being compared. The conditions for that differential effect are similar for IIA violations and for Simpson Reversals.
The following computational results tables further demonstrate that Theorems 1 and 2 each represent respective sufficient conditions for both the 2 x 5 and 2 x 6 cases. While these computations are not strictly needed given the previous general proofs, they are useful in that they demonstrate the utility of the sufficient conditions in practice (i.e., how frequently sequences, FAB, that generate these conditions are observed).
Of the 252 initial sequences, FAB, Table 1 tells us that the sufficient condition for presence of at least one Reversal across all poolings of FAB and holds for 78 of those sequences. Empirically, we observe at least one Reversal for each of those sequences. Table 2 shows that for a distinct 78 of the 252 initial 2 x 5 sequences, FAB, the sufficient condition for absence of Reversals across all poolings of FAB and holds. Empirically, we do not observe a Reversal in any of those sequences. For the 2 x 5 case, then, the sufficient conditions from Theorems 1 and 2 assure us whether or not Reversal is possible for 156 of the 252 initial sequences (61.9%).
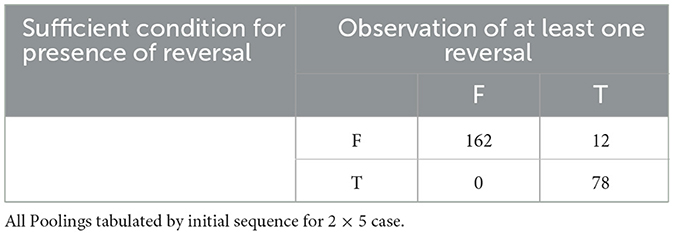
Table 1. Sufficient condition for presence of reversal observation of at least one reversal.
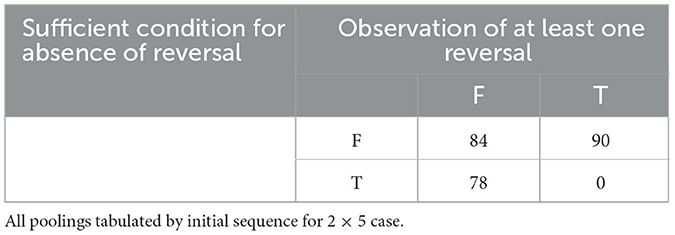
Table 2. Sufficient condition for absence of reversal and observation of at least one reversal.
Tables 3, 4 deal with sufficient conditions for the 2 x 6 case. Of the 924 initial sequences, FAB, for the 2 x 6 case, Table 3 shows that the sufficient condition for presence of at least one Reversal across all possible poolings of FAB and holds for 220 of those sequences. Empirically, we observe at least one Reversal for each of those sequences. Table 4 shows that for a distinct 364 of the 924 initial 2 x 6 sequences, FAB, the sufficient condition for absence of Reversals across all poolings of FAB and holds. Empirically, we do not observe a Reversals for any of those sequences. For the 2 x 6 case, then, the sufficient conditions from Theorems 1 and 2 assure us whether or not Reversal is possible for 584 of the 924 initial sequences (63.2%). In each observed case, the sufficient conditions determine unambiguously whether an initial sequence is susceptible to Reversal in more than three-fifths of cases. Therefore, we can usually assess the general robustness of a rank sum result in terms of susceptibility to Simpson Reversals. As such an assessment can determine whether a given result is scale-variant, we conclude that Theorems 1 and 2 can usually combine to offer a “quick and dirty” robustness check on a rank sum result.
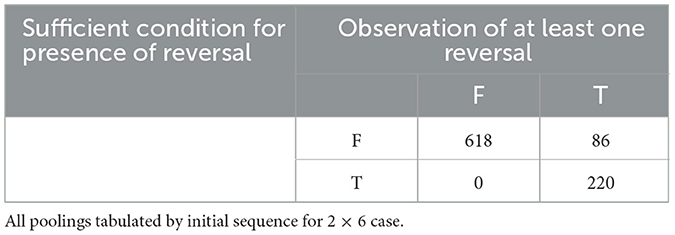
Table 3. Sufficient condition for presence of reversal and observation of at least one reversal.
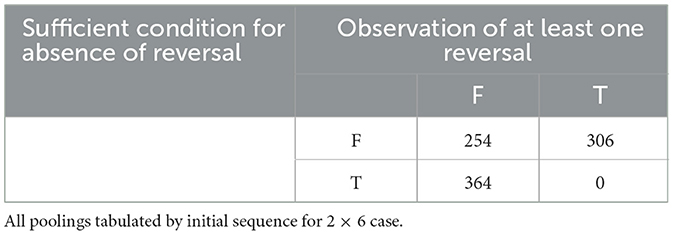
Table 4. Sufficient condition for absence of reversal and observation of at least one reversal.
For the 2 x n case, there are initial sequences, F. We are arranging 2n elements—n elements from each of 2 groups—where we do not distinguish between respective objects of a given group. For each initial sequence, we then ask in how many ways F can be pooled with its ordinal replicate, F′. This is equivalent to a “stars and bars” combinatorial problem, in which we are placing 2n “stars” or elements from F′ into 2n “bars” or potential pooling positions amongst the elements of F. From this characterization, there are poolings for each initial sequence and initial sequences. The number of poolings for a given 2 x n case equals the product of the number of initial sequences and the number of poolings per initial sequence, or , for each case, 2 x n. For example, in the 2 x 7 case, there are initial sequences, F. Moreover, there are poolings per initial sequence. As such, there are 3,432 · 40,116,600 or approximately 137.68 billion possible poolings for the 2 x 7 case. We provide the sample space for each 2 x n case in Table 5 of the subsequent section.
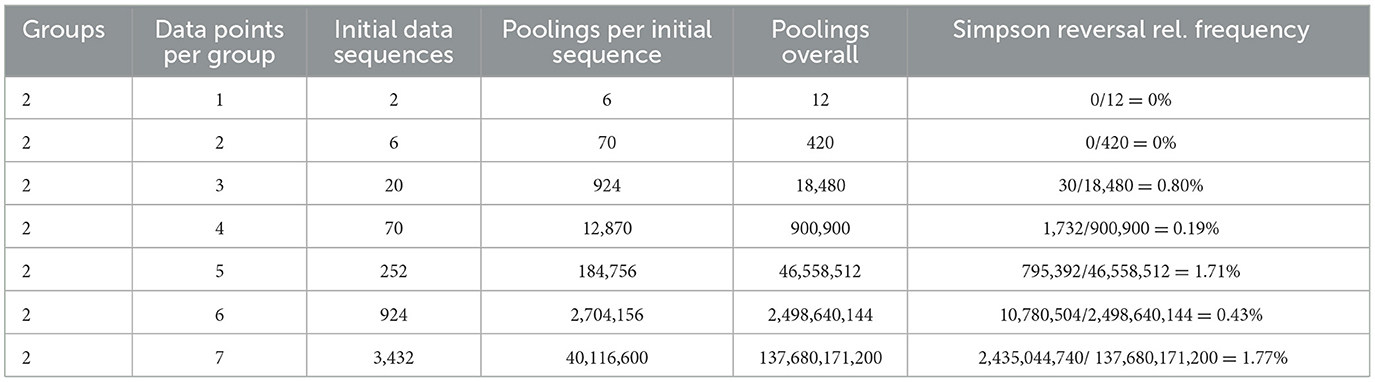
Table 5. Relative frequency of Simpson reversal by case.
We wrote a computational algorithm in Java by which to search the sample space of each case where 0 < n(∈ Z+) < 7. It systematically generates all possible initial sequences, FAB , for a case, then creates all possible pooled sequences, for each initial sequence. For each initial sequence, rank sum scores for A and B are computed. This scoring task is then repeated for each pooling of FAB and and iteratively for each pooling of each initial sequence. Then, instances of Simpson Reversal are checked using the condition obtained in Theorem 1. This brute force, enumerative approach is extended later in the paper using a simulation approach. The full algorithmic code is provided in Appendix 1 of the paper, but here we provide an illustrative example and pseudo code to illustrate the process.
Example 1. Consider the case of n = 7 with the original data sequence
Let
be the ordinal replicate of FAB, and the sequence whereby FAB and are pooled by comparing the underlying parametric value of each element.
In Example 1, S(A ∣ FAB) = 50 and S(B ∣ FAB) = 55, so A ≻F B (and since is an ordinal replicate). ζ = 2 in this case, so the sufficiency condition S(B ∣ FAB) − S(A ∣ FAB) < nζ outlined in Theorem 1 is satisfied, meaning a Simpson reversal will occur for at least one pooling of the two sequences. Reversals may occur for more than one pooling, however, and will not occur for all poolings. In the simplest pooling, for example, where the full original FAB is succeeded by , and , so ; no reversal.
If, instead,
and , so ; a reversal. But note that a reversal could also occur for an alternate pooling such that
We again have a reversal, since and .
For our application, we consider mobile phone Specific Absorption Rate (SAR) radiofrequency exposure data. The Federal Communications Commission (FCC) requires that mobile phones sold in the U.S. undergo manufacturer SAR testing while the phone is operating at highest power. FCC regulation requires that each cell phone test at a SAR level of no greater than 1.6 watts per kilogram. Utilizing compiled data on FCC cell phone radiation ratings by model/brand,1 we compare iPhone 3 / 4 phones with Nokia E Series phones. We chose this comparison for a few reasons. Namely, these two series of phones were manufactured during roughly the same time frame, where new versions in each series were released with similar frequency. Moreover, each type of phone achieved a high level of market popularity. Lastly, each series features 8 different phone versions in the source dataset such that the empirical application can align with our computational results in terms of case coverage.
Computational results are given in Table 1 as follows.
We observe that Simpson Reversals are not possible for sufficiently small n (i.e., n < 3). In the context of Theorem 1, the largest possible ζ is not sufficiently large to motivate a strict Simpson Reversal in these cases. For the 2 x 1 and 2 x 2 cases, a group that is strictly outranked in FAB cannot have a positive ζ, and therefore a strict Simpson Reversal is not possible for these cases. We can also consider computed cases where n > 2. From even to odd case, the results suggest a wavelike movement in the likelihood of a Simpson Reversal. In general, there is a lower likelihood of strict Simpson Reversal in even cases than in neighboring odd cases due to the possibility of ties for n-even cases of pairwise rank sum scoring (but not for n-odd cases). With some probability mass allowing for a pairwise tie in the n-even case, strict Simpson Reversals are less likely. This result also holds for other social choice violations (e.g., violations of Transitivity and of IIA; see [31]). To evaluate the marginal effect of increases in n, as distinct from the effect of changes from even to odd case, one should compare the iterative trend between n and n + 2 rather than that between n and n + 1. We do this for the even and odd cases, respectively, in Figure 1.
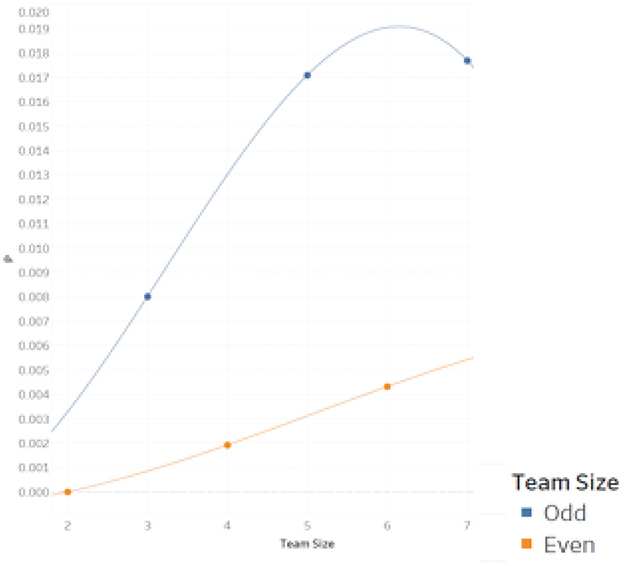
Figure 1. Frequency of simpson reversal by case.
Over the set of cases computed, the relative frequency of Reversal rises for both the even and odd sets of cases. For the 2 x 8 case, we run a simulation to estimate whether this trend might continue. Specifically, we randomly select and generate one-quarter of all possible initial sequences, FAB, (without replacement) for this case and then replicate each selected initial sequence. For each selected initial sequence and its replicate, we then randomly select approximately 0.1% of all possible poolings, or a little more than 600,000 poolings per sampled initial sequence. For each pooling, we check for Reversals as in the main algorithm. Doing so, we estimate that 0.63% of all poolings result in reversal for the 2 x 8 case. In proportion terms, this represents a substantial increase from the 2 x 6 case. As such, this estimate suggests that our trend of rising relative frequency of Reversal from n to (n + 2) is maintained for the 2 x 8 case.
We find that strict instances of the Paradox cannot occur for 2-group, k-element per group cases of rank sum scoring where k ∈ {1, 2} but that instances occur for as many as roughly 1.7 percent of sequence poolings in the 2-group, 5-element and 2-group, 7-element cases. We conclude from our computational results that the incidence of Simpson Reversal for small sample cases of rank sum scoring is (not) roughly similar to previous results on 2 x 2 x 2 contingency tables (path models). Moreover, the computed rate of Simpson Reversals in this setting is generally lower than a standard, allowable Type I error rate (α-value) for a statistical test. Given conceptual similarities between a test's p-value and its Simpson Reversal rate, as discussed previously, we might then characterize the incidence of Simpson Reversals for considered cases of rank sum testing as being typically “tolerable” from the perspective of statistical sensitivity. Next, we consider how likelihood of Simpson Reversal relates to rank sum score for A and B in FAB. We do this sub-analysis for the 2 x 5 case and visualize the results in the heat map and scatter plot of Figure 2.
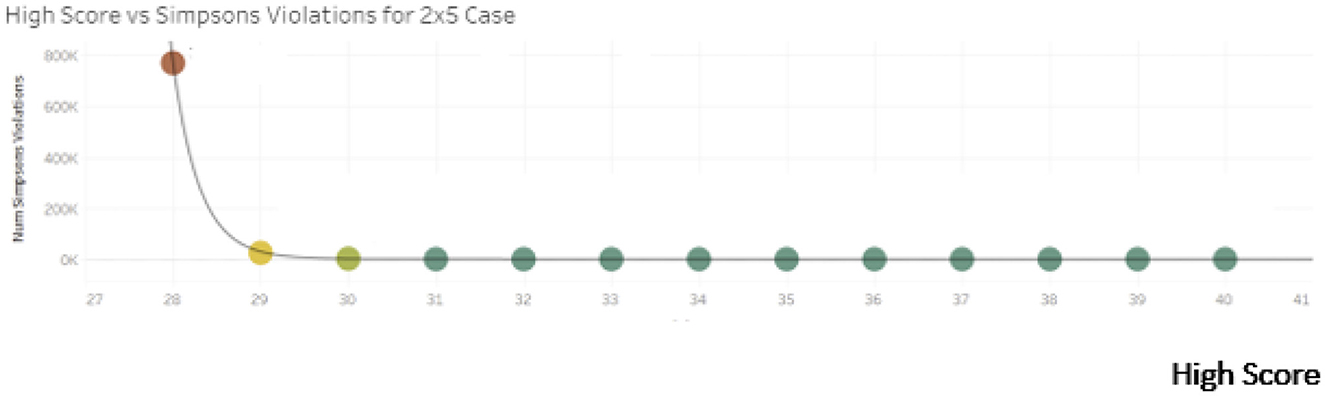
Figure 2. Heat map and scatter plot relating rank sum scores to likelihood of reversal.
For the 2 x 5 case, Reversals are most likely when the rank sum score margin in FAB is closest (i.e., where one group scores 27 and the other scores 28). A Reversal is more likely if the original score margin is close due to the relative ease with which a Reversal can be obtained in such a case. As the score margin increases, the relative frequency of Reversals declines quickly. This observed relationship between match “closeness” and likelihood of violation mirrors earlier results for violations of Transitivity and IIA under rank sum scoring (see [24]). We also find that Reversals cannot occur if the rank sum score margin in FAB is equal to 7 or more for the 2 x 5 case. If the score margin is 7 or more, then it must be that ζ ≤ 1. As such, we know that S(B ∣ FAB) − S(A ∣ FAB) > nζ for this range of score margins in the 2 x 5 case, and a Reversal cannot occur.
While the overall likelihood of Reversal is relatively low for small sample cases of rank sum scoring (e.g., relative to a standard α-value), there is evidence that certain types of sequences are problematic. For example, sequences that yield closer scores are shown to be more productive of Reversals. As such, we compute the relative frequency of Reversal for each initial sequence in each case and then identify the initial sequence for each case that yields the highest such relative frequency, as well as the relative frequency itself. In Figure 3, we plot the highest relative frequency of Reversal at the initial sequence level for each computed case. These same results are represented with greater detail in Table 6.
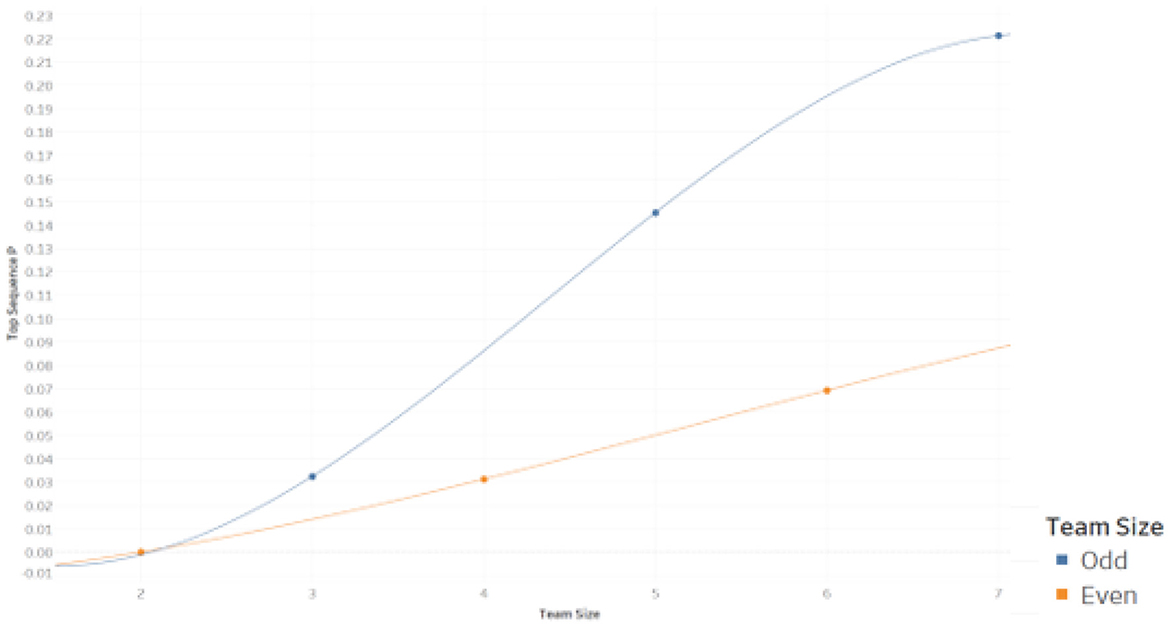
Figure 3. Highest initial sequence level reversal likelihood by case.
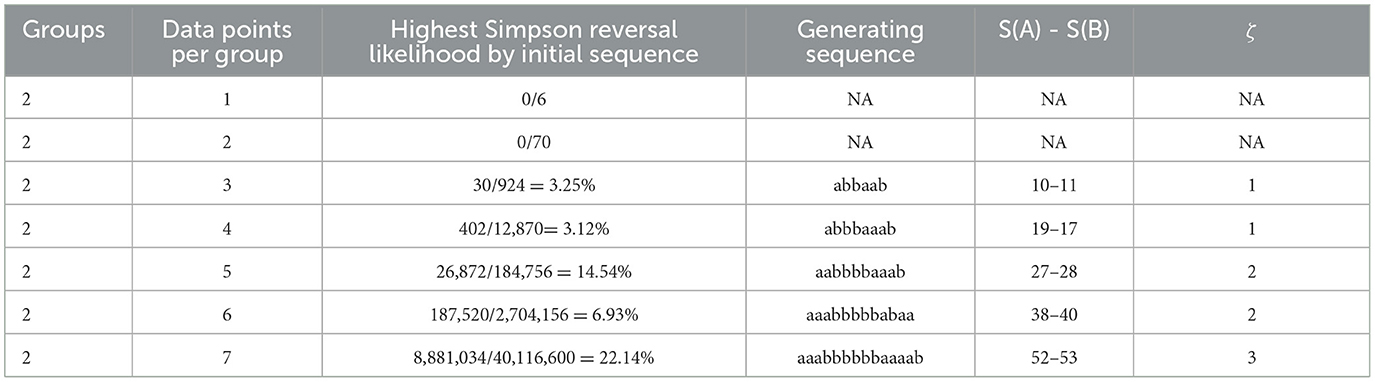
Table 6. Highest initial sequence level reversal likelihood by case.
Table 6 shows that reversals are more likely given sequences that feature both close rank sum scores and uninterrupted clusters of one group and then of the other within the rank sequence. Note that the maximum Reversal likelihood generating sequence for each case is not unique. In each case, one could transpose the elements ‘a’ and the elements ‘b’ to obtain the same Reversal likelihood. We find that the maximum Reversal likelihood generating sequence also generates the closest margin of victory in each case (i.e., 1 rank sum unit for n-odd cases and 2 rank sum units for n-even cases). While the overall likelihood of Reversal is consistently below 0.02 for computed cases, Reversals are found to be much more prevalent for certain initial sequences. In the 2 x 7 case, the maximum initial sequence conditional likelihood of Reversal is approximately 0.22, for example. The results of Figure 3 suggest that it is important to consider not only the statistical test but also the particular data (sequence) of interest when assessing prevalence of Simpson Reversals. As with the overall likelihood of Reversal for computed cases, we find that the maximum likelihood of Reversal at the initial sequence level of the data strictly increases from the n to n + 2 case for the range of computed cases.
Table 7 provides parametric SAR value data for each phone under consideration. Unlike in our theoretical case, we note that SAR data is typically rounded to the nearest hundredth or thousandth unit such that several ties are observed in our data.
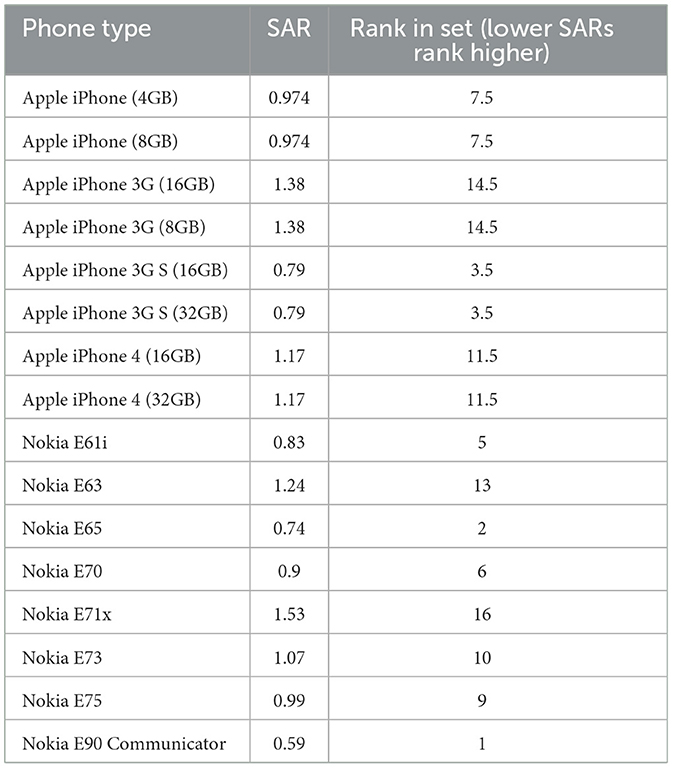
Table 7. Smart phone sar values and ranking.
From this data, we find that Nokia E Series phones from this time period rank higher than Apple iPhones in terms of emitting lower levels of radiation. The rank sum score for the 8 Nokia (Apple) phones is 62 (74). We also compare subsets of these two mobile phone series. For example, we compare the 7 (6, 5, 4, 3, 2, 1) most recently released Nokia E phones in the dataset with the 7 (6, 5, 4, 3, 2, 1) most recently released Apple iPhones. For each of these subsets, Nokia E Series phones also rank better than Apple iPhones under rank sum scoring. Given these subset results, we might expect Simpson Reversals to not occur in this application data.
In this application setting, there are two main ways in which to think of Simpson Reversals. One can think of them in the specific: Is there an alternative set of data comparing the two phone series such that, when pooled with the original data, yields a Reversal? Alternatively, one can think of them generally: For what proportion of poolings of this data and its ordinal replicate does a strict Reversal arise? Though the specific question dominates applications in the previous literature on Simpson Reversals, the general question has certain conceptual advantages. Under the general question, one can determine how globally robust a given data is against Reversal when pooled with an ordinal data that individually generates an identical test result. When one ordinally replicates a data set, no new information is introduced by which to evaluate the two groups. By definition, the original data and its ordinal replicate yield the very same rank sum test result. By considering incidence of Reversal under pooling of the two data sets, one can determine the general robustness of the original result by considering to what extent that result relies upon the interaction of the test itself with scale-variant features of the data. In the present application, therefore, we consider the general question as a means to determine the general robustness of the data against (susceptibility to) Reversal. In so doing, one can characterize the strength of the original result in terms of data scale invariance.
In the empirical exercise, we first consider the 2 groups and 8 phone types per group case (i.e., the 2 x 8 case). We sort the data from lowest to highest SAR level to obtain SAR rankings for each of the 16 phones. We then add the 8 rank positions of Apple iPhones and the 8 rank positions of Nokia E phones, respectively, to obtain each brand's empirically-observed rank sum score. We then consider each “most-recent sub-sample” of the data. That is, the 2 x 7 case is developed by rank sum scoring the 7 most recently marketed Apple iPhones in the sample against the 7 most recently marketed Nokia E phones. The same procedure was followed inductively to obtain the 2 x n case ∀ n ∈ {1, 2, 3, …, 6}. For each case, rank sum scores are shown in Table 8. In Table 9, incidence of empirically observed Reversal is reported for each case.
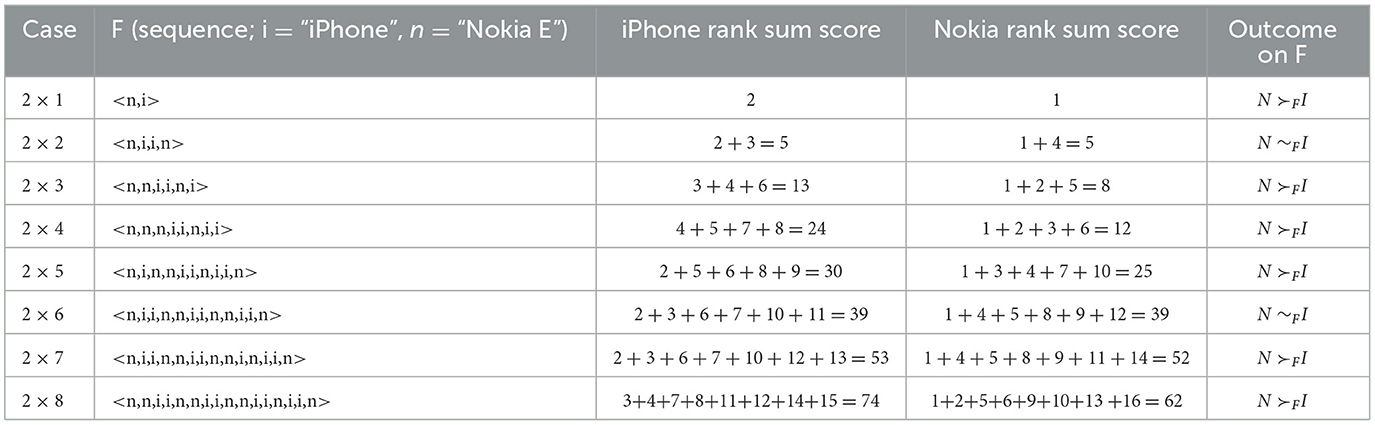
Table 8. Rank sum scoring of Apple iPhone v Nokia E SAR level.
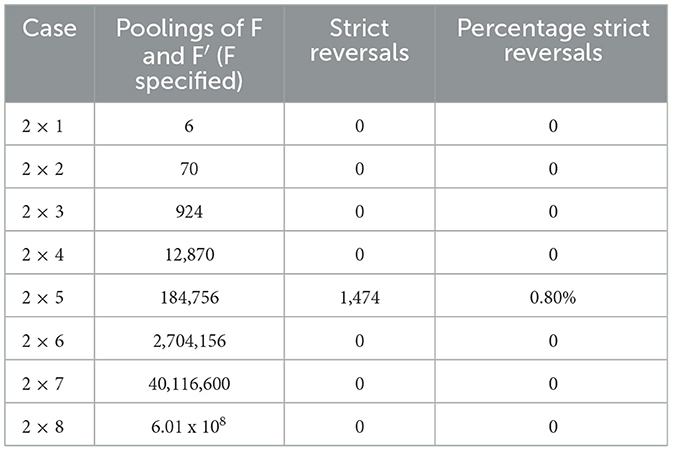
Table 9. Incidence of empirical reversal by case under rank sum scoring of Apple iPhone v Nokia E SAR level.
Unlike in our computational treatment, note that a single outcome for F is given (observed) in the empirical treatment. For the empirical application, then, we need only consider all possible poolings of the specified sequence, F, and its ordinal replicate, F′. In the computational section, we observed that the likelihood of a strict Reversal has a high degree of variability across initial sequences. As this application selects a single sequence F based solely on market characteristics of two cellular phone product series (e.g., similar market time period, status as a popular line of phones during that time period, and number of models in series) and not on parametric properties of the underlying data, there was no a priori reason to believe that instances of strict Reversal would occur at all in the application. For two of the 2 x n cases considered, the 2 x 1 and 2 x 2 cases, we have established that Reversals are not possible for any pooling of the data. However, we observe a cluster of Reversals occurring with moderate frequency, relative to the theoretical results, for the 2 x 5 case. For this case, we have that N ≻F I for F but that for 0.80% of poolings of F and F′. For this observed sequence, we have that n = 5, observed ζ = 2, and the score differential is 5 such that we are, in fact, assured the existence of Reversals in this case. For no other observed sequences do we obtain sufficient conditions for the existence of a Reversal. Given the results of the 2 x 5 case, we observe that data scale can influence one's comparison of radiofrequency exposure when comparing models from two types of mobile phone. In this case, Simpson Reversals are empirically present in the 2 x 5 case. This finding shows that the 2 x 5 empirical result for F is not robust against aggregation. Rather, that result is potentially data scale variant. While the incidence in this application is perhaps modest and “acceptable” (e.g., relative to a standard α-value) from an inferential statistical perspective, our computational section demonstrates that there exist data sequences for which Simpson Reversals are observed at substantially higher levels. Given that the rate of Reversal can vary substantially by initial sequence, the practice of calculating this rate, conditional on the observed F, can be seen as a potentially important robustness check.
This study establishes sufficient conditions for observing instances of Simpson's (data aggregation) Paradox under rank sum scoring (RSS), as used, e.g., in the Wilcoxon-Mann-Whitney (WMW) rank sum test. Using computational methods, we also establish the relative frequency with which paradox-generating Simpson Reversals occur under RSS when an initial data sequence is pooled with its ordinal replicate. For each 2 x n case of RSS considered, strict Reversals occurred for between 0% and 1.74% of data poolings across the whole sample space, roughly similar to that observed for 2 x 2 x 2 contingency tables and considerably less than the rate observed for path models. The rate of Reversal conditional on observed initial sequence was highly variable. Despite a mode at 0%, this rate exceeds 20% for some initial sequences. Further, our empirical application identifies empirical susceptibility to Simpson Reversals in the case of publicly-released mobile phone radiofrequency exposure data. Simpson Reversals under RSS are not simply a theoretical concern but can serve to flip nonparametric or parametric biostatistical results even in vitally important public health settings. Conceptually, incidence of the Paradox can be viewed as a robustness check on a given WMW statistical test result. When the Paradox occurs (is possible), it follows that a given result is at least partly a function of data scale or sample size. Given that the rate of Reversal can vary substantially by initial sequence, the practice of calculating this rate conditional on the observed F can be seen as a potentially important robustness check upon a result.
The original contributions presented in the study are included in the article/Supplementary material, further inquiries can be directed to the corresponding author.
SS contributed to the theoretical section, writing, and data selection for the work. JE led the computational analysis. JB contributed to the theoretical section and data selection for the work. All authors contributed to the article and approved the submitted version.
The authors declare that the research was conducted in the absence of any commercial or financial relationships that could be construed as a potential conflict of interest.
All claims expressed in this article are solely those of the authors and do not necessarily represent those of their affiliated organizations, or those of the publisher, the editors and the reviewers. Any product that may be evaluated in this article, or claim that may be made by its manufacturer, is not guaranteed or endorsed by the publisher.
The Supplementary Material for this article can be found online at: https://www.frontiersin.org/articles/10.3389/fams.2023.1169164/full#supplementary-material
1. Yule GU. notes on the theory of association of attributes in statistics. Biometrika. (1903) 2:121–34. doi: 10.1093/biomet/2.2.121
2. Simpson EH. The interpretation of interaction in contingency tables. J R Stat Soc B. (1951) 13:238–41. doi: 10.1111/j.2517-6161.1951.tb00088.x
3. Bargagliotti AE. Aggregation and decision making using ranked data. Math Soc Sci. (2009) 58:354–66. doi: 10.1016/j.mathsocsci.2009.07.006
4. Haunsperger DB. Aggregated statistical rankings are arbitrary. Soc Choice Welfare. (2003) 20:261–72. doi: 10.1007/s003550200179
5. Haunsperger DB, Saari DG. The lack of consistency for statistical decision procedures. Am Stat. (1991) 45:252–5. doi: 10.1080/00031305.1991.10475814
6. Allison VJ, Goldberg DE. Species-level versus community-level patterns of mycorrhizal dependence on phosphorus: an example of Simpson's paradox. Funct Ecol. (2002) 16:346–52. doi: 10.1046/j.1365-2435.2002.00627.x
7. Huang L, Zalkikar J, Tiwari R. Likelihood-ratio-test methods for drug safety signal detection from multiple clinical datasets. Comput Math Methods Med. (2019) 2019:1526290. doi: 10.1155/2019/1526290
8. Pineiro G, Paruelo JM, Oesterheld M. Potential long-term impacts of livestock introduction on carbon and nitrogen cycling in grasslands of Southern South America. Global Change Biol. (2006) 12:1267–84. doi: 10.1111/j.1365-2486.2006.01173.x
9. Chipman J, Braun D. Simpson's paradox in the integrated discrimination improvement. Stat Med. (2017) 36:4468–81. doi: 10.1002/sim.6862
10. Foster G, Rahmstorf S. Global temperature evolution 1979–2010. Environ Res Lett. (2011) 6:044022. doi: 10.1088/1748-9326/6/4/044022
11. Pordanjani SR, Kavousi A, Mirbagheri B, Shahsavani A, Etemad K. Spatial analysis and geoclimatic factors associated with the incidence of acute lymphoblastic leukemia in Iran during 2006–2014: an environmental epidemiological study. Environ Res. (2021) 202:111662. doi: 10.1016/j.envres.2021.111662
12. Tran P, Waller L. Variability in results from negative binomial models for lyme disease measured at different spatial scales. Environ Res. (2015) 136:373–80. doi: 10.1016/j.envres.2014.08.041
13. Berger VW, Bejleri K, Agnor R. Comparing MTI randomization procedures to blocked randomization. Stat Med. (2016) 35:685–94. doi: 10.1002/sim.6637
14. Grøn R, Gerds TA, Andersen PK. Misspecified poisson regression models for large-scale registry data: inference for ‘large n and small p.’ Stat Med. (2016)35:1117–29. doi: 10.1002/sim.6755
15. Kuss O. Statistical methods for meta-analyses including information from studies without any events-add nothing to nothing and succeed nevertheless. Stat Med. (2015) 34:1097–116. doi: 10.1002/sim.6383
16. Cook NR, Demler OV, Paynter NP. Clinical risk reclassification at 10 years. Stat Med. (2017) 36:4498–502. doi: 10.1002/sim.7340
17. Pavlides MG, Perlman MD. How likely is simpson's paradox? Am Stat. (2009) 63:226–33. doi: 10.1198/tast.2009.09007
18. Kock N. How Likely is Simpson's Paradox in Path Models?: Int J E-Collaboration. (2015) 11:1–7. doi: 10.4018/ijec.2015010101
19. Hammond TH. Rank injustice?: How the scoring method for cross-country running competitions violates major social choice principles. Public Choice. (2007) 133:359–75. doi: 10.1007/s11127-007-9193-6
20. Mixon Jr FG, King EW. Social choice theory in 10,000 meters: examining independence and transitivity in the NCAA cross-country championships. Am Econ. (2012) 57:32–41. doi: 10.1177/056943451205700103
21. Sanders S, Ehrlich J, Boudreau J. Rule selection invariance as a robustness check in collective choice and nonparametric statistical settings. Public Choice. (2022) 2022:1–20. doi: 10.1007/s11127-022-01027-8
22. Nagaraja HN, Sanders S. The aggregation paradox in statistical rankings. PLoS ONE. (2020) 15:e0228627. doi: 10.1371/journal.pone.0228627
23. Lin T, Chen T, Liu J, Tu XM. Extending the Mann-Whitney-Wilcoxon rank sum test to survey data for comparing mean ranks. Stat Med. (2021) 40:1705–17. doi: 10.1002/sim.8865
24. Boudreau J, Ehrlich J, Raza MF, Sanders S. The likelihood of social choice violations in rank sum scoring: algorithms and evidence from NCAA cross country running. Public Choice. (2018) 174:219–38. doi: 10.1007/s11127-017-0494-0
25. Klein DB. Colleagues, where is the market failure? Economists on the FDA. Econ J Watch. (2008) 5:316.
26. March RJ. The FDA and the COVID-19: a political economy perspective. Southern Econ J. (2021) 87:1210–28. doi: 10.1002/soej.12494
27. Sobel RS. Public health the placebo: the legacy of the 1906 pure food drugs act. Cato J. (2001) 21:463.
28. Tabarrok A. Discussion: the FDA is unprepared for personalized medicine. Biostatistics. (2017) 18:403–04. doi: 10.1093/biostatistics/kxx018
29. Tabarrok AT. Assessing the FDA via the anomaly of off-label drug prescribing. Independent Rev. (2000) 5:25–53.
30. Leeson PT, Thompson HA. Public choice and public health. Public Choice. (2021) 2021:1–37. doi: 10.1007/s11127-021-00900-2
31. Boudreau J, Ehrlich J, Sanders S, Winn A. Social choice violations in rank sum scoring: a formalization of conditions and corrective probability computations. Math Soc Sci. (2014) 71:20–9. doi: 10.1016/j.mathsocsci.2014.03.004
32. Winner L. Cell Phone Radiation Ratings by Model/Brand. (2021). Available online at: https://users.stat.ufl.edu/~winner/datasets.html
Keywords: Simpson's Aggregation Paradox, aggregation rules, collective choice, social choice theory, nonparametric statistical analysis, public choice
Citation: Sanders S, Ehrlich J and Boudreau J (2023) Simpson's aggregation paradox in nonparametric statistical analysis: Theory, computation, and susceptibility in public health data. Front. Appl. Math. Stat. 9:1169164. doi: 10.3389/fams.2023.1169164
Received: 18 February 2023; Accepted: 07 March 2023;
Published: 27 March 2023.
Edited by:
Franklin Mixon, Columbus State University, United StatesReviewed by:
Joshua Hall, West Virginia University, United StatesCopyright © 2023 Sanders, Ehrlich and Boudreau. This is an open-access article distributed under the terms of the Creative Commons Attribution License (CC BY). The use, distribution or reproduction in other forums is permitted, provided the original author(s) and the copyright owner(s) are credited and that the original publication in this journal is cited, in accordance with accepted academic practice. No use, distribution or reproduction is permitted which does not comply with these terms.
*Correspondence: Shane Sanders, c2RzYW5kZXJAc3lyLmVkdQ==
Disclaimer: All claims expressed in this article are solely those of the authors and do not necessarily represent those of their affiliated organizations, or those of the publisher, the editors and the reviewers. Any product that may be evaluated in this article or claim that may be made by its manufacturer is not guaranteed or endorsed by the publisher.
Research integrity at Frontiers
Learn more about the work of our research integrity team to safeguard the quality of each article we publish.