 Robert Müller
 Arthur Boutillon
 Diego Jahn
 Jörn Starruß1
 Nicolas B. David
 Lutz Brusch
94% of researchers rate our articles as excellent or good
Learn more about the work of our research integrity team to safeguard the quality of each article we publish.
Find out more
ORIGINAL RESEARCH article
Front. Appl. Math. Stat., 13 July 2023
Sec. Mathematical Biology
Volume 9 - 2023 | https://doi.org/10.3389/fams.2023.1163583
This article is part of the Research TopicDo individuals matter? - Individual-based versus population-based models applied to biology and healthView all 5 articles
Collective cell migration is an important process during biological development and tissue repair but may turn malignant during tumor invasion. Mathematical and computational models are essential to unravel the mechanisms of self-organization that underlie the emergence of collective migration from the interactions among individual cells. Recently, guidance-by-followers was identified as one such underlying mechanism of collective cell migration in the embryo of the zebrafish. This poses the question of how the guidance stimuli are integrated when multiple cells interact simultaneously. In this study, we extend a recent individual-based model by an integration step of the vectorial guidance stimuli and compare model predictions obtained for different variants of the mechanism (arithmetic mean of stimuli, dominance of stimulus with largest transmission interface, and dominance of most head-on stimulus). Simulations are carried out and quantified within the modeling and simulation framework Morpheus. Collective cell migration is found to be robust and qualitatively identical for all considered variants of stimulus integration. Moreover, this study highlights the role of individual-based modeling approaches for understanding collective phenomena at the population scale that emerge from cell-cell interactions.
Collective cell migration is an important process during biological development, such as the morphogenesis of tissues and organs in the embryo, as well as during wound healing and tissue repair in the adult, but collective behavior may also turn malignant during tumor invasion and metastasis [1–4]. Advances in live-cell imaging and precise perturbation experiments allow us to study individual cell trajectories and to quantify collective phenomena [5, 6]. Mathematical models and computational analysis are essential to unravel the mechanisms of self-organization that underlie the emergence of collective migration from the interactions among individual cells [7–10]. Using experimental and theoretical approaches, different interaction mechanisms between individual migrating cells have been identified. It includes chemotaxis during vasculogenesis [11, 12] and Dictyostelium aggregation and slug motion [2], self-generated gradients in the zebrafish posterior lateral line primordium [13, 14], contact inhibition of locomotion during neural crest streaming [15], axis alignment of polar/ferromagnetic or apolar/nematic type in local neighborhoods [16, 17], chase-and-run between different cell types such as neural crest and placodal cells [18], leader cell selection by Notch signaling, and guidance of follower cells in trunk neural crest migration in zebrafish [19], as well as the reverse of the previous mechanism, guidance by followers in polster cell migration toward the animal pole followed by posterior axial mesoderm during gastrulation in zebrafish [20], see Figure 1. An important question is how robustly a particular mechanism can self-organize collective cell migration given variable starting conditions, perturbations, and variability of individual cells. Moreover, the variability of individual cells may be a prerequisite for leader/follower cell segregation. To achieve robustness, multiple mechanisms need to coexist and synergize.
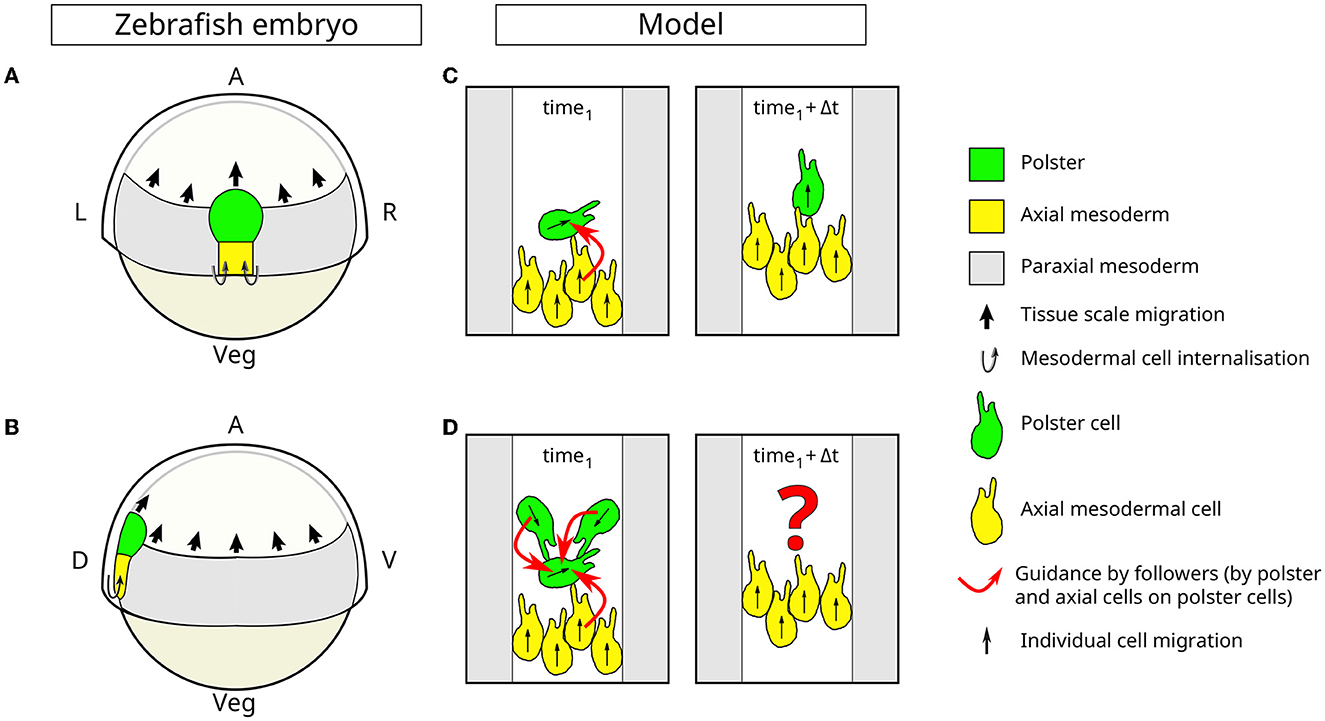
Figure 1. Collective cell migration due to guidance-by-followers during gastrulation in zebrafish. Schematic of the dorsal (A) and lateral (B) view of a zebrafish embryo during gastrulation, at 60% epiboly stage. The polster (green), the (posterior) axial mesoderm (yellow), and paraxial mesoderm (gray) are part of the inner layer of cells, and all move toward the animal pole of the embryo. Polster cells undergo a collective migration while axial mesoderm extends by the addition of new cells by internalization and by convergence and extension. These two tissues are made up of several layers of cells and constitute the body axis that elongates during gastrulation. The paraxial mesoderm is a flat monolayer of cells flanking the body axis, which also moves toward the animal pole. A, animal pole; Veg, vegetal pole; R, right; L, left, D, dorsal; V, ventral. (C, D) The schematic description of the cell migration model. The movement of axial mesodermal tissues is simulated in 2D, in a confined space, mimicking the presence of paraxial mesoderm (gray) on both sides. Polster cells (green) exhibit random, run-and-tumble movement and are sensitive to guidance-by-followers. Axial cells (yellow) display a directed motion oriented toward the top of the simulation and are not responsive to guidance-by-followers. Both cell types can trigger guidance-by-followers in polster cells. In (C), the direction of motion is transmitted from a moving cell to a polster cell (green) when it is hit by the moving cell (here, a yellow axial cell). When multiple cells interact simultaneously (D), competing input signals need to be processed to determine the direction of motion of each cell. In this study, we propose and compare hypotheses for such signal processing.
During gastrulation in zebrafish, the elongating body axis is composed of distinct cell populations. The axis is headed by the mesendodermal polster followed by the posterior axial mesoderm. The movement of both these tissues relies on different mechanisms. Individual polster cells undergo active random run-and-tumble migration but, as a group, they coordinate their movement to exhibit guided collective migration [21, 22]. Meanwhile, the posterior axial mesoderm elongates by undergoing convergence and extension [23]. Due to such movement, cell-to-cell variability and environmental perturbations risk to fragment the body axis. Surprisingly, none of the mutations affecting convergence and extension movements and slowing down follower cells (the posterior axial mesoderm) leads to axis fragmentation, but rather lead to a slowing of polster cells [20, 23, 24], suggesting that motility of polster cells is tightly regulated by axial cells. At the molecular level, it appears that each polster cell detects the movement of all contacting cells moving toward it (therefore called followers) through E-cadherin-dependent cell-cell contacts [22] and E-cadherin/α-catenin mechanotransduction. The cell then aligns its own migration polarity with that of its followers [20]. Thereby, the direction of motion can be transmitted from a moving cell to another cell as it is hit by the moving cell, see Figure 1C. This local mechanism has been described as “guidance-by-followers”. To date, only polster cells have been shown to respond to guidance-by-followers, although several cell types are capable of triggering such a reaction in polster cells, in particular, in physiological conditions, polster cells themselves and posterior axial cells [20]. At the collective level, the random cell motility of polster cells gets aligned to form a compact cell cluster in contact with the following posterior axial mesoderm cells. When contact to following posterior axial mesoderm cells gets lost, polster cells no longer receive guidance from the posterior axial mesoderm cells, and increased randomness of polster cell trajectories then reduces the polster's net velocity until the following posterior axial mesoderm catches up. Information about the advancement of the posterior axial mesoderm propagates faster than the movement of individual cells in the same direction. As a result, polster cells situated at the front of the axis can respond to disturbances at the rear by slowing down. This finding has been supported by experiments involving laser ablation and cell transplantation [20]. In the following, we will refer to the posterior axial mesoderm cells as axial cells and compare them with polster cells.
Collective cell migration has been theoretically studied both by individual-based models and continuum approaches [8, 25, 26]. Agent-based or individual-based models (IBM) explicitly describe the stochastic dynamics of individuals and their discrete interactions, in response to their individually differing and dynamic states such as current spatial location, movement direction, cell polarity, cell shape, or intracellular signaling [8, 27]. A particularly versatile model formalism among IBM is the cellular Potts model (CPM) [12, 28, 29]. Multiple open-source software frameworks allow to develop and simulate CPM in a user-friendly manner [30–32]. Various cell motility modes and all the abovementioned cell-cell interaction mechanisms have been implemented in CPM [10, 33, 34]. To study the robustness of collective cell migration to heterogeneity and fluctuations among cells, as well as test alternative model assumptions for a specific interaction mechanism, we will here consider the guidance-by-followers mechanism that coordinates two cell populations in the biological context of the early development in zebrafish, see Figure 1.
Here, our recently developed stochastic and spatially resolved IBM of polster and axial cell interactions, which is constructed based on CPM and accessible under MorpheusModelID:M0006 (https://identifiers.org/morpheus/M0006) in its previously published implementation [20], is tested against various perturbations. In both cell types, the number of cells, cell sizes, and therefore contact chances are varied; motility parameters of individual cells are considered heterogeneous, drawn from distributions, and are considered temporally fluctuating. In such simulations, polster cells are exposed to multiple follower contacts at the same time and need to integrate these multiple stimuli, see Figure 1D. How does the integration of potentially conflicting guidance information coming from different followers affect individual cell movement and could it lead to disruption of collective cell migration? Therefore, we extend this IBM by a processing step of the vectorial guidance stimuli and compare model predictions obtained for three variants of the guidance-by-followers mechanism, (1) the arithmetic mean of stimuli, (2) the dominance of stimulus with the largest transmission interface, and (3) the dominance of most head-on stimulus. Simulations are carried out and quantified within the modeling and simulation framework Morpheus [32]. Statistics over many repetitions of these stochastic simulations are evaluated. Overall, collective cell migration from guidance-by-followers is found to be robust and quantitatively identical for all considered variants of stimulus integration, corroborating earlier analysis. Moreover, this study highlights the role of individual-based modeling approaches for understanding collective phenomena at the population scale that emerge from spatially resolved cell-cell interactions.
We chose to implement the guidance-by-followers mechanism as a CPM in the modeling framework Morpheus [32]. Morpheus is an extensible open-source software framework that supports user-friendly declarative modeling. It offers a graphical user interface (GUI) and the domain-specific modeling language MorpheusML to easily compose and extend multicellular models. MorpheusML provides a bio-mathematical language in which symbolic identifiers in mathematical expressions describe the dynamics of and coupling between the various model components. It represents the spatial and mechanical aspects of interacting cells in terms of the CPM formalism and follows the software design rule of the separation of model from implementation, enabling model sharing, versioning, and archiving in public model repositories. A numerical simulation is then composed of parsing the MorpheusML model definition and automatic scheduling of predefined components in the simulator. Beyond its use in Morpheus, MorpheusML is a model definition standard that enables interoperability among multiple simulators, parameter estimation pipelines, and model repositories [35]. Therefore, the FitMultiCell toolbox (see https://gitlab.com/fitmulticell/fit) supports the estimation of parameters for stochastic Morpheus models [36, 37].
Our CPM Hamiltonian is composed of three main energy contributions: a contact energy, that applies to neighboring lattice sites of different cells σ, and a perimeter and a volume conservation constraint, that apply to all cells. Temporal evolution is sampled by introducing sequentially hypothetical updates (local spin flips) in a random manner. Based on the change of the Hamiltonian ΔH, these updates are either accepted or rejected (Metropolis kinetics as defined in Equation 3).
Here, Aσ is the cell's area, Pσ is the cell's perimeter, A0 is the target area, P0 is the target perimeter, and Jσ1, σ2 is the contact energy between cells σ1 and σ2.
In order to introduce active cell motion, the ΔH is altered by adding a term favoring updates that displace a cell into its preferred direction [33].
Here, is the cell's orientation, is the cell's center displacement due to the update, and λ1 is the motility strength.
The effective acceptance probability p now depends on ΔH′.
Our collective cell migration model is defined on a two-dimensional hexagonal lattice with periodic boundary conditions and a size of 500 × 1500 grid nodes. There are two static obstacles on either side, leaving a channel of 200 nodes in the middle for the cells to migrate. These obstacles are included to mimic the observed lateral confinement, which is attributed to the paraxial mesoderm, a tissue laterally lining the axial mesoderm and the polster, see Figures 1A, B [38, 39]. Each grid interval in the simulation represents 1 μm of space, and each time step represents 1 min. The Monte Carlo step (MCS) duration is set to 0.1 min, corresponding to 10 MCS per model time step and allowing for thousands of potential updates per lattice node over the simulated time period. The shape of the cells in the simulations is controlled using a target area of 326 μm2, which is an average of 360 experimental measurements on 30 different polster cells [20]. Cell sizes in the experiment are not significantly different between polster and axial cells (Wilcoxon test p = 0.25). The target circumference is taken from that of a circle with the chosen target area, giving preference to compact cell shapes. Both volume and surface constraints are included in the Hamiltonian with Lagrange multipliers of λP = λA = 1, see Equation (1). In addition, the posterior axial mesoderm cells (which are depicted as yellow in the simulations) display a directed motion oriented toward the animal pole (up). The speed of this motion can be adjusted by varying the strength λ1 of the “DirectedMotion” in the Hamiltonian in Equation (2).
To characterize the cell-autonomous behavior of polster cells (without guidance-by-followers), wild-type polster cells were transplanted to the animal pole of wild-type embryos, and the migration of isolated cells was tracked [20]. The tracks showed alternating phases of relatively straight migration and phases of slowed and poorly directed movement, indicating that mesendodermal cells exhibit run-and-tumble motion in agreement with earlier observations [21]. To model this behavior, we implemented a run-and-tumble motility with a uniform probability of reorienting (tumble) the target direction angle. In our two-dimensional lattice, the cell's orientation vector in Equation (2) is taken as the planar unit vector and hence, we directly updated its angle. Second, we use a scaling factor “run_duration_adjustment” for the probabilistic waiting times for reorientation (tumble) events, which are distributed according to a gamma distribution. Third, the adjustable Lagrange multiplier λ1 scales up the motion speed in Equation (2). The values of the scaling factor and the Lagrange multiplier were obtained via parameter estimation using experimental data of single-cell trajectories [20] as shown in Table 1.
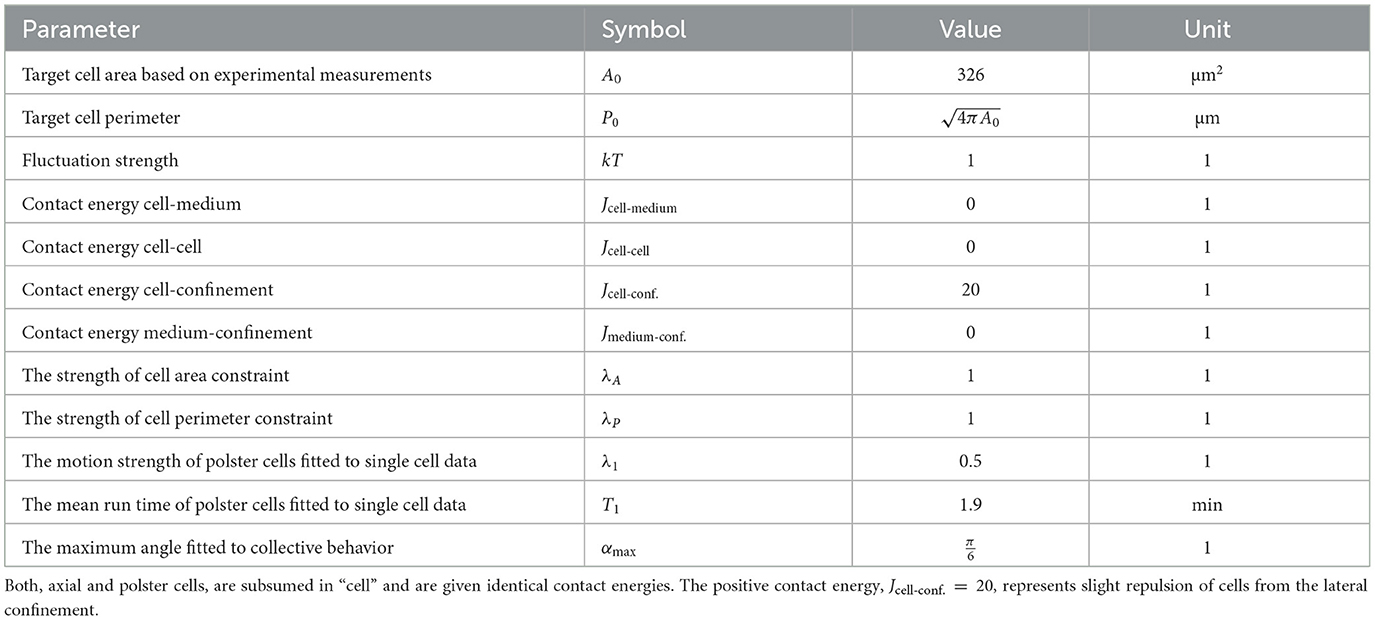
Table 1. Model parameters with values estimated by Boutillon et al. [20].
In the model and besides the run-and-tumble motion, the mechanical orientation of polster cells can be simulated using the “PyMapper” plugin of Morpheus as described below. For each cell, at fixed time steps of 1 min, the neighbors are detected on 50 membrane points of a “MembraneProperty” data structure (50 angular sectors) and using the “NeighborhoodReporter” in Morpheus. Each cell may possess such a “MembraneProperty”, which can be addressed in polar coordinates, that is automatically mapped onto the membrane of the cell and moved and deformed along with the changes of cell shape, and allows to execute dynamical models involving multiple “MembraneProperties”, as well as coupling to other cell properties. The dynamical model along the membrane may comprise algebraic rules, ordinary differential equations (ODEs) or partial differential equations (PDEs). An example of an activator-substrate-depletion pattern formation (two coupled PDEs) on the membrane of a moving cell is accessible from the Morpheus GUI under the menu item “Examples → Multiscale → CellPolarity.xml” and in the public model repository under MorpheusModelID:M0035 (https://identifiers.org/morpheus/M0035). Instead of PDEs, we will use here rule-based logic to integrate multiple potentially conflicting stimuli.
To implement guidance-by-followers, four scalar “MembraneProperties” store the x- and y-components of the position vector of the cell centroid and the velocity vector of each neighbor contact of a considered cell. Next, a direction vector toward the current cell is calculated for each neighbor from the pair of centroids of the cell. Finally, the angle between the velocity vector and the direction toward the current cell is then calculated for each neighbor. If this angle is below a threshold called “max_angle” (indicating that the neighbor is moving toward the current cell), then the velocity vector of the neighbor is used to update the direction of the considered cell in the “DirectedMotion” plugin, see Figure 2A.
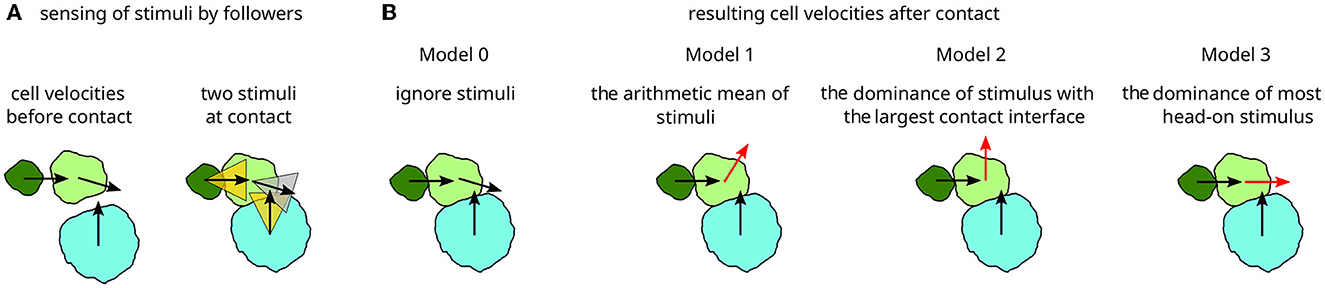
Figure 2. A schematic representation of cell-cell interactions upon contact. (A) Three cells, here of different sizes, move as indicated by their velocity vectors (left). Upon contact (right), sectors up to the angle αmax around each velocity vector indicate whether guidance is exerted (when the direction to the cell's center of mass falls within, yellow) or not (gray). (B) Four cell-cell interaction models and their resulting velocity vectors (black unchanged, red changed upon contact): Model 0 is considered as a baseline without velocity changes upon contact. Model 1 yields the mean of the impact velocities, weighted by cell-cell contact length. Model 2 yields the velocity vector of the impact with the largest cell-cell contact length. Model 3 yields the velocity vector of the impact that is oriented closest to the cell center. The sketches represent snapshots from such model simulations with just three polster cells. Full simulation time courses are shown in Supplementary Movie 1.
For tissue-scale simulations, a population of 400 cells is initialized and is given 20 min to settle and adjust their shapes and packing. Once this initial phase is over, two events are triggered by which the cells are assigned an identity based on their position along the anteroposterior (top-down) axis, and the appropriate motility characteristics are applied to them. Unless stated otherwise, we choose to split the population in a position such that one-third becomes polster and two-thirds become axial cells (see Figure 3 left). In the embryo, this cell number ratio is higher (with an order of five times more axial cells than polster cells) but this ratio also changes over time as the axis elongates. Our choice of axial to polster cell numbers of 2:1 is a compromise between a faster simulation runtime at a lower cell number and the observed insensitivity of model behavior to further added axial cells, i.e., saturation of a metric above a ratio of 2 as confirmed post hoc in Figure 8. The initial split of the overall cell population into two cell types establishes a front between polster and axial cells, and we will monitor the speed by which this front advances by measuring the average displacement of the first axial cell. The direction in which the front advances will be referred to as forward. Only polster cells can react to guidance-by-followers but both polster cells and axial cells can elicit this reaction in polster cells, as shown in Figure 1D and described by Boutillon et al. [20].
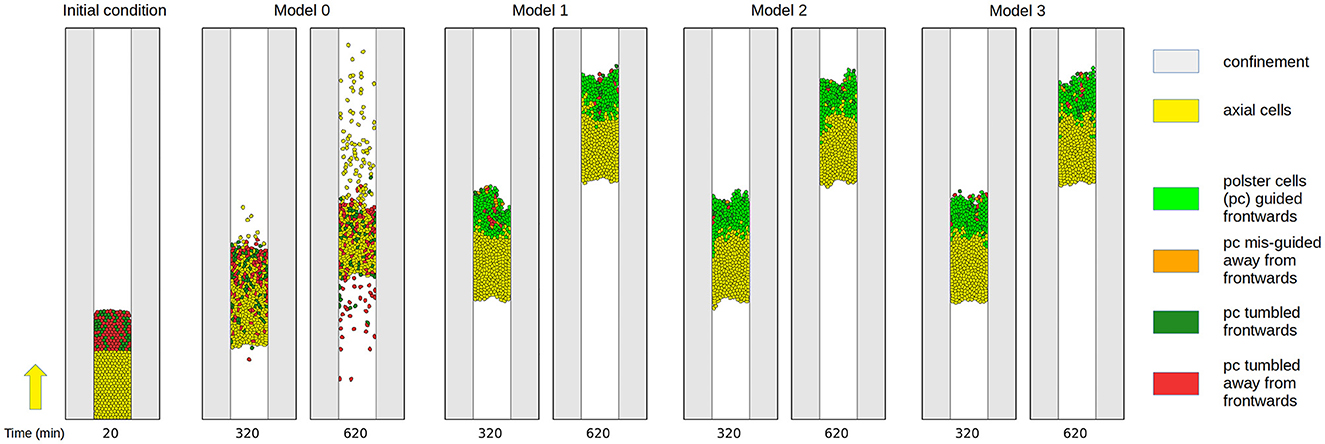
Figure 3. Snapshots of a simulation without the guidance-by-follower mechanism (model 0) and of three different realizations of the guidance-by-follower mechanism (models 1–3) at simulation times 20, 320, and 620 min. Cells are color-coded based on their identity, source of the velocity vector, and alignment. Yellow: Axial cells with motility as indicated by the yellow arrow on the left. Leading axial cells define the front speed. Light green: Polster cells guided by follower cells such that their orientation points to the same quadrant as the axial front velocity. Orange: Polster cells guided by follower cells away from the quadrant of the axial front velocity. Dark green: Polster cells with orientation into the same quadrant as the axial front velocity by chance due to run-and-tumble motion. Red: Polster cells with run-and-tumble motion away from the quadrant of the axial front velocity. Visually, all three coupling mechanisms in models 1–3 yield very similar results as opposed to model 0. Simulation time courses are shown in Supplementary Movie 2.
If there are multiple neighbor cells moving toward the considered cell, then an additional rule for integrating potentially multiple guidance-by-follower signals is needed, see Figure 2. To investigate the impact of such signal integration, we here consider and compare four hypothetical signal processing models. In the model implementation, this can be chosen by setting the constant “pushing_mode” to 0–3. The four signal processing models are defined as follows and are illustrated in Figure 2.
- Model 0 ignores the guidance-by-followers interaction and serves as a quantifiable baseline where cells will collide and squeeze past each other due to steric interactions.
- Model 1 sets the cell velocity to the arithmetic mean of neighbors' velocity vectors which fall within a max_angle sector, with the length of each cell-cell contact serving as the weighting factor.
- Model 2 sets the cell velocity to that of the neighbor which has the largest contact length given that its velocity vector falls within the “max_angle” sector around the contact vector, ignoring other candidates. If the largest contact does not fulfill the “max_angle” sector criterion because it strikes more tangential, then the next smaller contact is evaluated.
- Model 3 sets the cell velocity to that of the neighbor with the best aligned velocity vector, i.e., the smallest angle between velocity and contact vectors, ignoring other candidates.
These hypotheses serve as abstractions of the microscopic biochemical and biophysical mechanisms. They yield distinct behaviors for the test configuration in Figure 2, see also Supplementary Movie 1. The Morpheus model generated during this study was deposited in the public model repository under MorpheusModelID:M0008 (https://identifiers.org/morpheus/M0008).
The key model parameters and values as estimated by Boutillon et al. [20] are shown in Figure 8. Experimental data used for Figure 8 also come from Boutillon et al.'s study [20]. In control situations, where embryos were unmanipulated, we did not have access to the exact number of axial cells since this tissue is long and was partly out of the field of view in the movies used for quantification. As a result, in Figure 8, we arbitrarily set the axial vs. polster cell ratio to 5. To decrease this ratio, we used two different experimental approaches: 3D-constrained deep laser ablations and microsurgery [20, 40], see Figure 8. Laser ablation was used to destroy two rows of cells either at the interface between polster and axial cells (interface ablation) or further away from the polster (posterior ablation), leaving, respectively, no axial cell or some axial cells behind the polster. Microsurgery through aspiration by a micro needle was used to remove the posterior-most part of the axis, only leaving some axial cells behind the polster. In conditions where only a fraction of axial cells were left behind the polster, we could have access to their exact number and then compute a precise ratio of axial/polster cell number.
First, we demonstrate that multiple cells can collide simultaneously and that the direction signal is robustly transmitted from axial cells to polster cells and among polster cells for models 1–3, as shown in Figure 3 and Supplementary Movie 2. Qualitatively, snapshots of the simulations already suggest that all three coupling models 1–3 yield very similar results as opposed to the baseline model 0 that just possesses steric interactions. To analyze this in detail, we have varied the motion strength of axial cells between zero and the nominal value (Table 1) in five increments and ran 100 repetitions per parameter combination. For each run, we have quantified the angular coherence of polster cell orientation, which is defined as fraction of polster cells moving in the forward quadrant (±45° around the vertical front velocity of axial cells), and the speed of the axial cell front, which is defined by the anterior-most axial cell, as shown in Figure 4. The dependency of these two observables can be compared to our previously published experimental data from Boutillon et al.'s study [20]. For the experimental data points and for the simulation data, a linear regression was calculated, as shown in Table 2, and plotted along with the prediction error (68 % interval) in Figure 4. The differences between the coupling models 1-3 were found to be negligible compared to the baseline model 0. Within error margins, all three coupling models can explain the experimental data equally well (Figure 4). Individual data points of all simulation runs are shown in Supplementary Figure 1. Changing the system geometry to wider channels and maintaining the same cell density shows the same behavior. If a much narrower channel is studied, then boundary effects at the channel walls affect the behavior (starting at half the channel width that is used in all simulations shown here).

Figure 4. Quantification of angular coherence between guided and follower cells. All three coupling mechanisms yield very similar results and, considering the error margins, can explain the experimental data as opposed to Model 0 without guidance-by-followers. Lines show linear regression of the data and shaded bands are the 68 % intervals of the prediction error. Individual data points of all simulation runs are shown in Supplementary Figure 1.
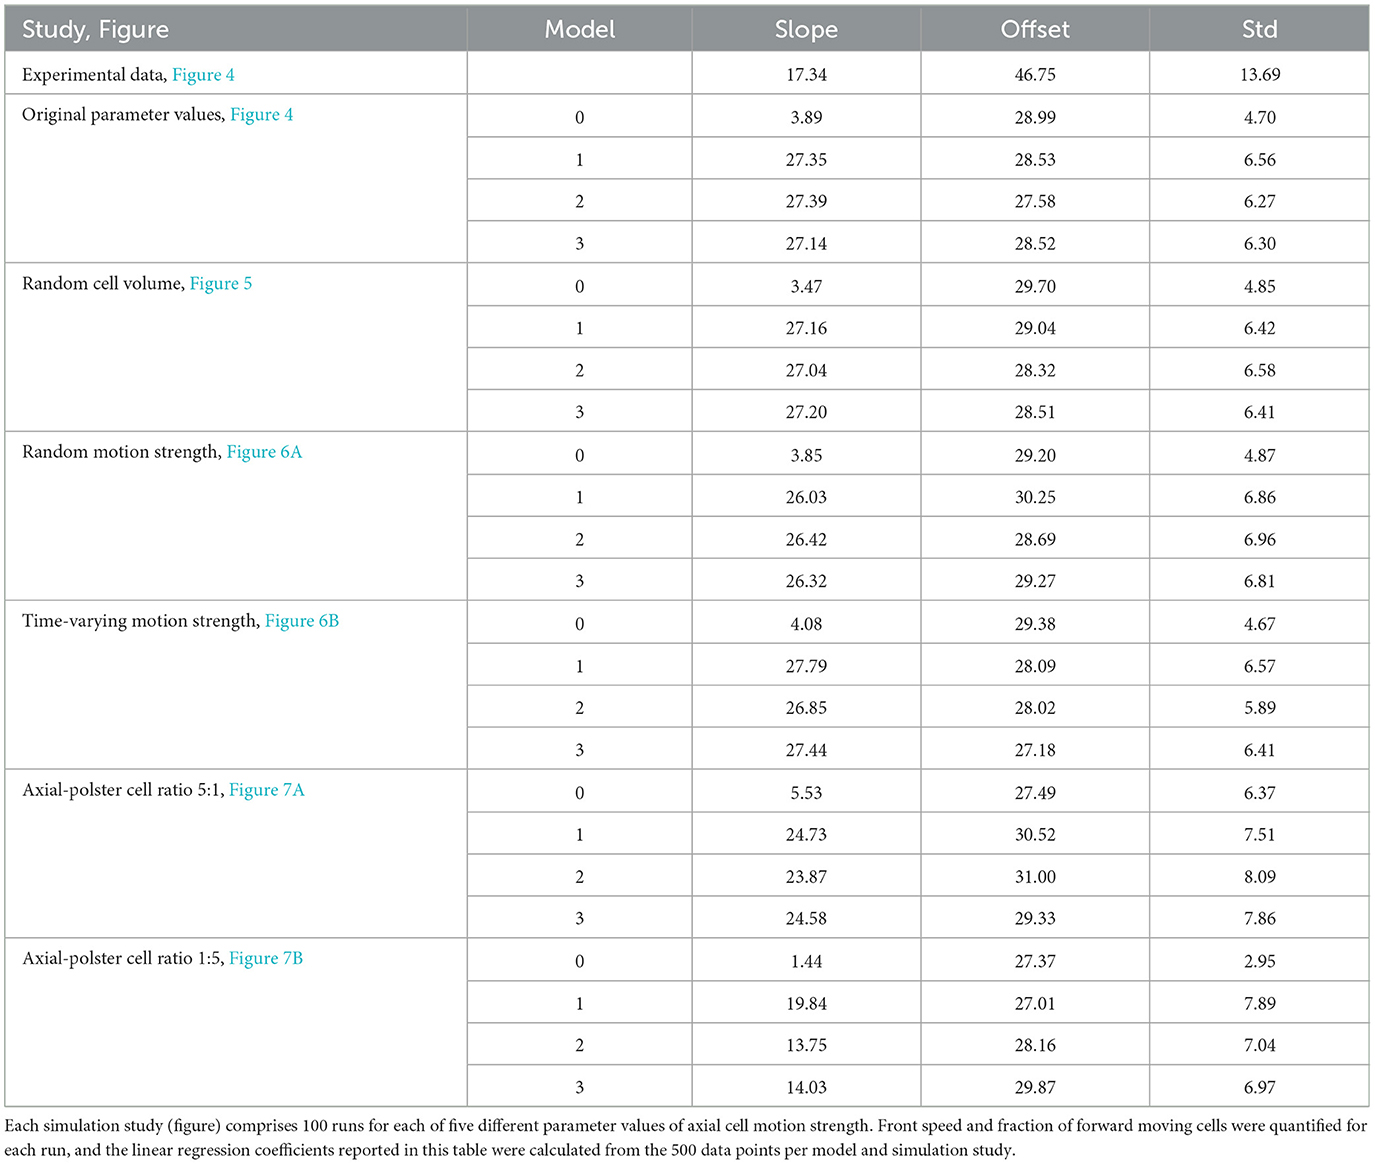
Table 2. The summary of simulation results compared to the experimental data by Boutillon et al. [20].
Since cell shape and cell size determine the arrangement of cell-cell interfaces and thereby may modulate guidance-by-followers signal transmission, we measured cell size variability in the experiment and then tested it in model simulations. We found that polster cells have an average area of 326 μm2 with an SD of 81 μm2 while axial cells have an average area of 349 μm2 and an SD of 113 μm2 (n = 30 and 22 cells, respectively), without a significant difference between the two cell populations (Wilcoxon test p = 0.25).
If cell sizes are no longer equal in the model, but distributed uniformly across a range for both cell types symmetrically around the originally identical cell area A0 and thereby even more variable than experimentally measured, then practically no deviation from the original behavior is observed (cf. Figures 4, 5). This shows that the collective cell migration behavior is very robust against variability and changes in cell size.
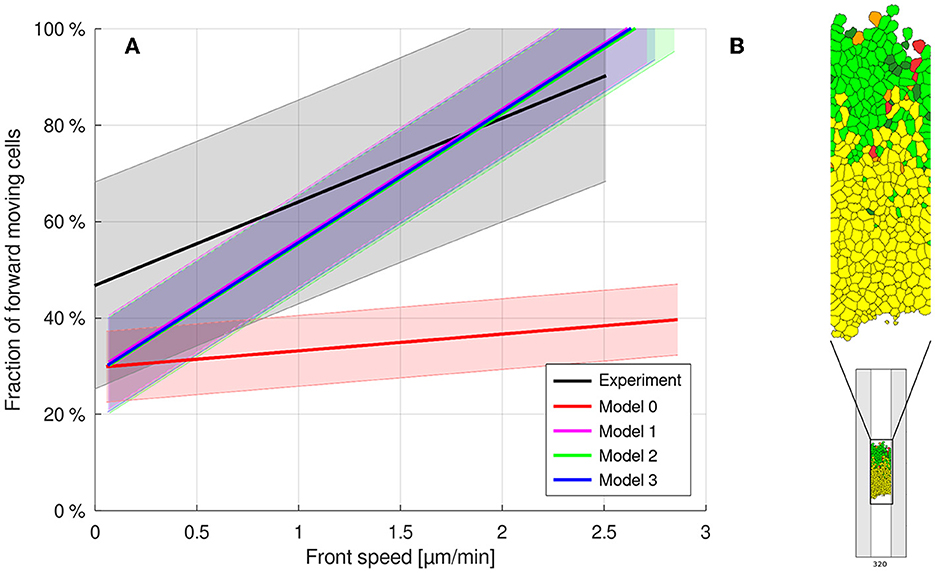
Figure 5. (A) Uniformly distributed cell areas do not disturb the guidance-by-follower mechanism. (B) Typical snapshot at time 320 MCS, model 2, illustrating the imposed cell size variability. Cells are color-coded based on their identity, source of the velocity vector, and alignment (cf. Figure 3).
For a uniform distribution of the polster cells' individual motility strength parameter symmetrically around the former strength parameter λ1, no significant difference was observed (Figure 6A). This shows that the mechanism is very robust against variation in the polster cells' motility. As each polster cell can, when not guided, perform an individual run-and-tumble motion with gamma-distributed run duration and uniformly random orientation reset at tumble events, we also let the individual motility strength parameter be drawn from a uniform distribution on the interval [0.5·λ1, 1.5·λ1] at gamma-distributed time points. However, no significant changes in cell movements could be found (cf. Figure 6B).
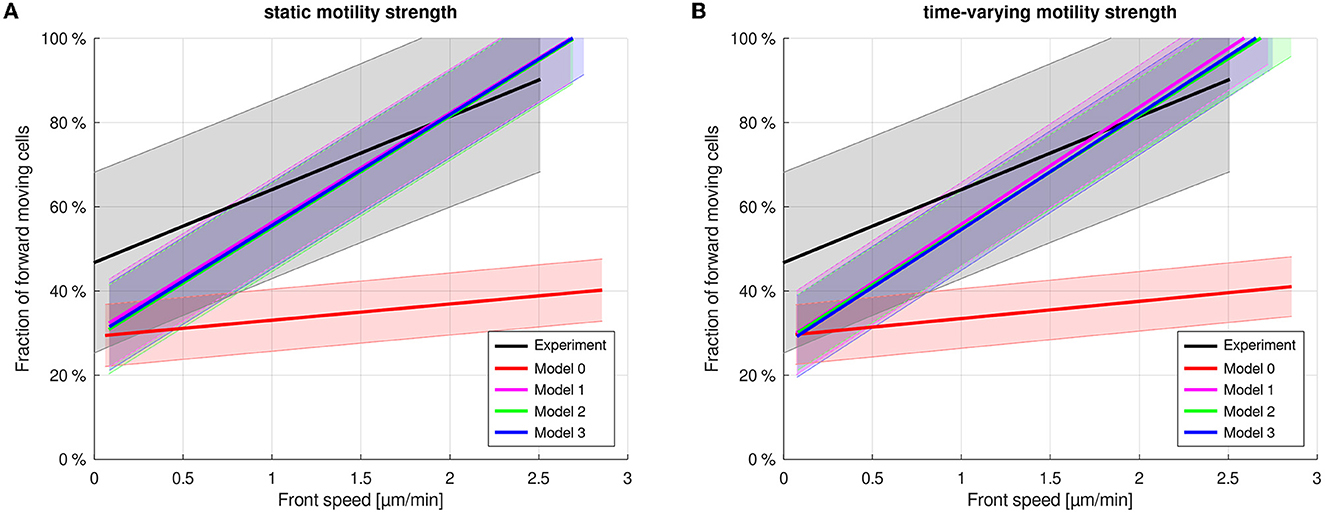
Figure 6. Uniformly distributed, static (A) and randomly time-varying (B) motility strengths for polster cells causes no significant changes in the simulations.
In order to test whether the coupling mechanisms are sensitive to the ratio of cell numbers, simulations with ratios between axial and polster cells of 5:1 and 1:5 were conducted for the same total number of 400 cells (Figure 7 and Table 2). In the case of 5:1 with abundant axial cells, the number of additional axial cells behind the front has no additional effect, and the front movement is unchanged (Figure 7A) compared to the above cases with a 2:1 ratio because only the axial cells near the front can exert their orienting effect on polster cells. In the case of 1:5 with few axial cells, simulations show increasing disorder of the front movement between axial and polster cells (Figure 7B). Movies of the simulations reveal that the abundant polster cells invade the group of axial cells and cause the disorder, thus disturbing the collective effect of guidance-by-followers. Simulation results for a systematic scan over cell number ratios with a constant total cell number of 400 and a fixed front speed of 2 μm/min are shown in Supplementary Figure 2. A range of slightly fewer axial cells than polster cells is identified where model behaviors are distinguishable as model 1 (with averaging over multiple stimuli) maintains higher order than models 2 and 3. The same effect is evident in Figure 7B at high front speed.
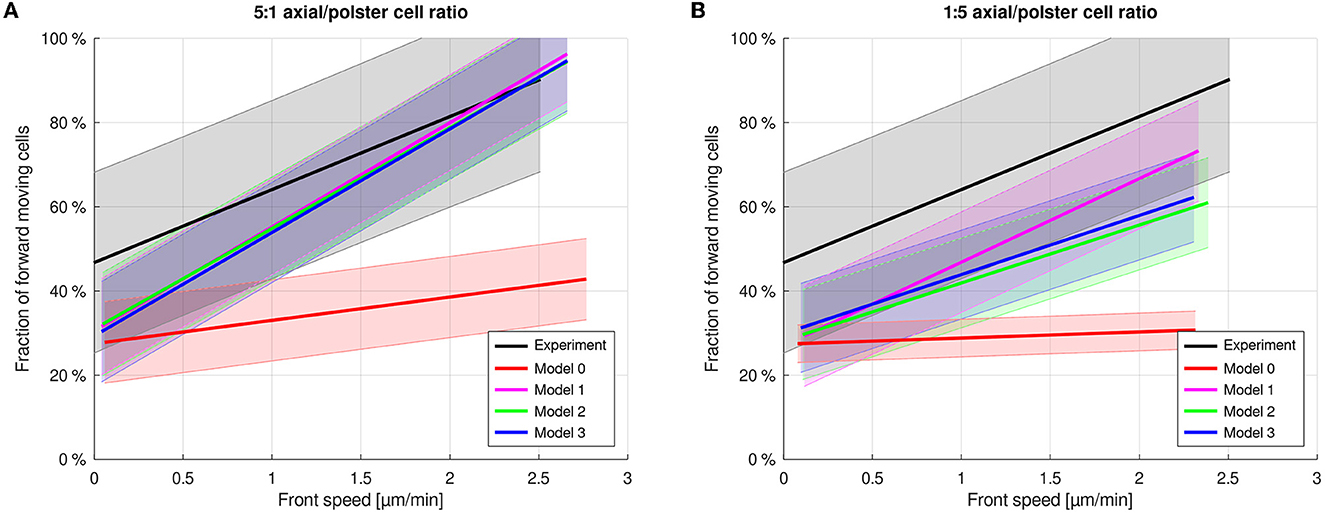
Figure 7. Axial cell to polster cell ratio of 5:1 (A) and 1:5 (B). A high polster cell fraction leads to less ordered front cell movement. Simulation results for a systematic scan over cell number ratios with a constant total cell number of 400 are shown in Supplementary Figure 2.
Among the above results, predictions by the model variants only differed for the changed cell number ratio in Figure 7B. To further focus on that interesting parameter range, we have fixed the axial motion strength parameter such that a front speed of 2 μm/min is maintained since then the differences were visible as shown in Figure 7B. We then generated model predictions by each model variant for different numbers of axial cells while keeping the number of polster cells fixed at 150. These model predictions are shown in Figure 8A as colored lines connecting simulated data points with mean and 1 SD as a function of the axial/polster cell number ratio. The data points at a cell number ratio of 2 correspond to the reference parameter set shown in Figure 4. The fraction of forward moving polster cells has already saturated at around 80% and does not increase further when adding more axial cells in the simulations.
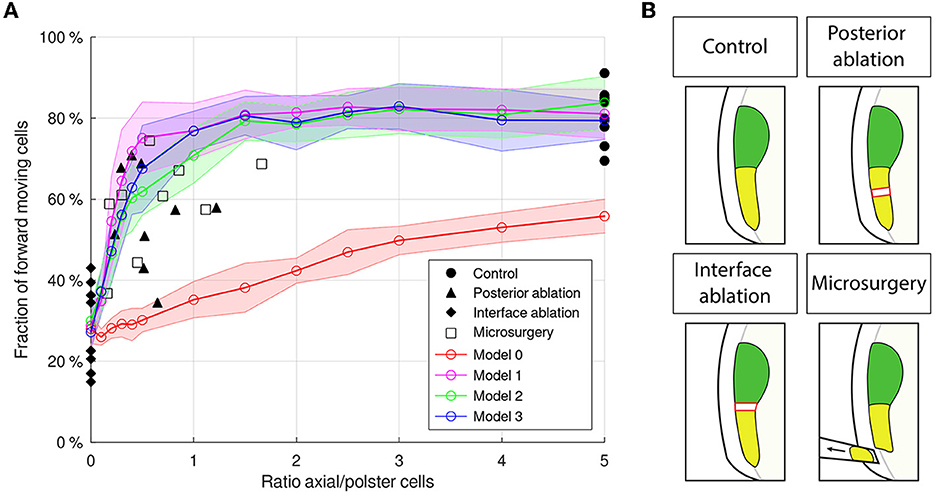
Figure 8. (A) Effect of changes in axial/polster cell number ratio on model predictions (colored lines connecting simulated data points with mean and 1 SD) and in perturbation experiments [black symbols in (A) and insets in (B)]. The cell number ratio in control samples is difficult to quantify as the microscope field did not cover the whole axis, therefore all control samples are represented by an estimated ratio of 5. In simulations, polster cell number is kept constant at 150, and the axial cell number is changed. Complementary simulation results with a constant total cell number of 400 are shown in Supplementary Figure 2. (B) The schematics of the experimental perturbations of the axial cell number and the cell number ratio: a lateral view of a zebrafish embryo during gastrulation, at 60% epiboly stage. Tissues are color coded as in Figure 1. Red rectangle corresponds to the location of deep 3D laser ablation severing the embryonic axis between polster and axial cells (interface ablation) or more posteriorly, in the axial mesoderm (posterior ablation). Microsurgery corresponds to the aspiration using a microneedle, of the posterior-most part of the axial mesoderm.
In contrast, when reducing the number of axial cells and thereby the axial/polster cell number ratio below 2, then the collective behavior breaks down to different degrees in the model variants before all models converge to isotropic random behavior (25% in the forward quarter) in the absence of any guidance and at zero axial cell number. The significant differences between model behaviors occur at a cell number ratio of 0.5 (half as many axial cells as polster cells). There, model 1 shows higher order (mean of 75% forward moving polster cells, likely due to its averaging mechanism incorporating more information from more cells) than model 2, (62%) while model 3 shows intermediate order (68%), and model 0 shows unordered behavior (30%).
Testing these differing model predictions in experiments requires techniques to perturb the normal axial cell number in zebrafish embryos. As part of previous experiments described by Boutillon et al. [20], three such perturbation techniques had been applied, as shown in Figure 8B: (i) deep 3D laser ablation severing the embryonic axis between polster and axial cells (interface ablation), (ii) deep 3D laser ablation more posteriorly, in the axial mesoderm (posterior ablation), and (iii) microsurgery, by aspiration with a microneedle, of the posterior-most part of the axial mesoderm. Overall, 27 perturbation samples (9 per perturbation technique) and 10 unperturbed control samples for comparison have been quantified regarding their axial/polster cell number ratio and the forward fraction of polster cells. The cell number ratio in control samples is difficult to quantify as the microscope field did not cover the whole axis, therefore all control samples are represented by an estimated ratio of 5.
While the experimental data scatter (partly due to wound healing responses after a perturbation) approximately as much as the observed differences in model behavior and cannot rule out individual model variants yet, the experimental data generally confirm the rather steep loss of collective order in models 1-3 when the cell number ratio drops below 2. It is to be noted that there is no free model parameter to adjust in this perturbation scenario. When side effects of the perturbation techniques could be reduced, then such refined experiments may discriminate and be selected among the model variants.
The robustness of collective cell migration to variation is a classic question that falls within the broader framework of the robustness of developmental processes. Recently, we described a novel mechanism responsible for the collective guidance of polster cells and cohesion of the embryonic axis during gastrulation in zebrafish [20]. The molecular details of guidance-by-followers are still not fully understood and, in particular, it is not clear how a cell integrates input from different neighbors. Here, we proposed different rule-based models with specific modalities of neighbor information integration by polster cells. We found that each of these models can to recapitulate robust guidance of polster cells by the axial mesoderm, suggesting that the guidance-by-followers process is robust to variation in cellular mechanisms. Although these results cannot indicate one solution that is closer to observations than another, we can at least support the idea that different modalities of how cells integrate information from multiple neighbors still allow guidance-by-followers to guide the migration of a group of cells.
We then tested the robustness of these different models to variations in cell properties or initial situations. First, we tested whether the ratio between the number of polster and axial cells affects collective guidance by running simulations with different ratios. We observed that, for each type of the model, a large excess of polster cells leads to a disruption of collective guidance. In this case, the guidance cue and the collective behavior in the polster are not sufficient to overcome the noise of individual cell behaviors. This result is particularly interesting as it suggests that there is a critical ratio threshold below which collective guidance is not possible, which is consistent with other studies reporting such a threshold for proper collective guidance [41, 42].
Cell shape and size are also known to be critical factors in collective cell migration. In a confluent monolayer, regions of small cells and high density exhibit disordered movement, mainly due to steric interactions [43, 44]. Some studies also suggest that the intensity of juxtacrine signaling between cells is regulated by the cell-cell contact area [45, 46]. Thus, cell size may affect both contact-mediated guidance-by-follower signaling and cell mobility in a dense group. We tested the effect of cell size on the collective guidance of the polster by introducing cell-to-cell variability. We observed that in the three models, the system is robust enough to cope with heterogeneity in cell size. Interestingly, this observation contradicts the only study that we are aware of on the effect of cell size during gastrulation in zebrafish [47]. By manipulating ploidy, the authors created embryos with larger or smaller cells and observed mild gastrulation defects. In particular, they generated chimeric embryos with larger or smaller cells placed in WT embryos and observed that the abnormally sized cells displayed fast but less directed migration. However, this study does not focus on axial cells and it is not clear which cell population has been observed. Furthermore, it appeared that changing the size of a cell affected its cortical dynamics and thus its cell-autonomous migratory properties, whereas, in our proposed model, we assumed that apart from the variation in cell size, the rest of the cell properties were kept constant. Nevertheless, it would be interesting to test the prediction of this model by introducing larger and smaller cells in the axial mesoderm and measuring the effect on collective cell guidance.
Furthermore, we tested the robustness of the different models to variations in individual cell migration properties by varying how straight and fast polster cells tend to move during a run phase. Both heterogeneously distributed individual persistence and temporal variations resulted in correct guidance of the cells, suggesting that this phenomenon is robust to differences in individual cell migration properties. This observation is particularly interesting as it suggests that even in the case where individual polster cells are particularly poorly persistent, once they are set in motion by guidance-by-followers, they exhibit collective oriented behavior. Such a phenomenon would ensure the robustness of axis development even in the case where the intrinsic guidance of polster cells is perturbed. Some molecular players are known to control cell migration persistence, such as Arpin or the CYFIP1/2 ratio in the WAVE complex [48, 49]. It would therefore be interesting to experimentally test whether local or global variations of individual polster cell persistence are buffered by guidance-by-followers.
In most simulations, although we observe remarkable robustness of the model to parameter variation (except for an extreme cell number ratio), the slope of the oriented fraction as a function of axial mesoderm speed is always higher for simulated cells compared to the experimental data. Since the individual migration behavior of cells is well-reproduced by this model, this observation suggests that some biological properties of the embryo are not fully recapitulated by this basic model.
Typically, under experimental conditions, the cell number ratio between the polster and the posterior axial mesoderm cannot be precisely measured: first, because of constraints on imaging; second, because this ratio changes over time, as new cells internalize and are added to the posterior axial mesoderm, see Figures 1A, B. This ratio could only be measured in situations where the posterior axial mesoderm was experimentally severed, leaving only a fixed fraction of it behind the polster, see Figure 8. Furthermore, the model approximates the movement of axial cells as a directed migration, while the behavior of this tissue is likely more complex, including convergence and extension movements. Hence, only a fraction of the posterior axial mesoderm actually has a forward (i.e., “animal-ward”, see Figure 1) movement, thus hampering the evaluation of this cell ratio in the embryo. This might be the reason for a slope closer to the experiment for a high polster to axial cell ratio (5:1). Another difference is that both the tissues in the embryo are multi-layered (3–4 cells thick) and migrate on a curved surface, while they are simulated in two dimensions on a flat surface, see Figure 1. Finally, the current version of the model does not take into account adhesion, allowing cells to freely attach and detach, although biological cells actually rely on adhesion to migrate and interact. In model 0, simulated axial cells and polster cells largely interpenetrate (see Figure 3), while the possibility of interpenetration of the two tissues is much less obvious in the embryo [20]. This could explain the difference in vertical intercept between the model and the experimental data. Indeed, modeled polster cells in the absence of guidance (low front speed) are free to move in every direction, and thus 25% of them happen to be in the forward quadrant. Actual polster cells, however, likely experience an easier path forward, where the edge is free than backward and the movement might be obstructed by (static) the posterior axial mesoderm. This could explain the experimental forward fraction of 45% for a null front speed.
It is however interesting and surprising to note that such a simple set of rules can quasi-quantitatively predict polster behavior and is so robust to many variations. In addition, in this study, we observed the robustness of the model to variations of a single parameter. In future, it would be interesting to perturb several parameters together to further test the robustness of the model.
Similarly, we here proposed three models differing only in the mode of integration of multiple stimuli and compared them by varying cell properties, especially more implementations of guidance-by-followers could be considered. Typically, cells being biological objects, there is likely a delay between the detection of the signal, the modification of cell polarity, and the ability to detect another signal. Models could thus be tested by varying the time between the detection of two signals or reaction time after receiving input. Other interesting results could be obtained by changing the nature of the model, for example, by adding a stabilization of cell movement by contact as it has already been observed in some studies [50]. Naturally, such modifications of the model would call for more experimental observations to be validated.
Finally, from a modeling perspective, this study highlights the role of individual-based approaches for understanding the collective phenomena at the population scale that emerges from cell-cell interactions. Here, we have specifically assessed the robustness of our developed IBM to variations in modeling assumptions and to cell-to-cell variations. From a data management perspective, we ensure the reproducibility of this computational study and the reusability and extensibility of the developed IBM by the strict separation of model definition from simulator code using the MorpheusML model description language [35] and a public model repository (https://morpheus.gitlab.io/model).
The datasets presented in this study can be found in online repositories. The names of the repository/repositories and accession number(s) can be found in the article/Supplementary material. The Morpheus model generated during this study was deposited in the public model repository under MorpheusModelID:M0008 (https://identifiers.org/morpheus/M0008).
RM and DJ developed the model, ran the simulations, performed the statistical analysis, and prepared the figures. AB analyzed the experimental data and contributed to figures. JS developed, maintained, and extended the model simulator. AB, ND, and LB contributed to the conception and design of the study. RM and LB wrote the first draft of the manuscript. All the authors contributed to the manuscript revision, read, and approved the submitted version.
ND acknowledges the support by the French ANR, Grant ANR-20-CE13-0016-03. LB acknowledges the support by the German BMBF through EMUNE (Grant 031L0293D) and the German DFG (Grant 391070520). The Article Processing Charges (APC) were funded by the joint publication fund of the TU Dresden, the Medical Faculty Carl Gustav Carus, and the SLUB Dresden, Germany.
We are grateful to lab members of Morpheus for fruitful discussions. We thank the ZIH at TU Dresden, Germany, for granting HPC resources for model simulations.
The authors declare that the research was conducted in the absence of any commercial or financial relationships that could be construed as a potential conflict of interest.
All claims expressed in this article are solely those of the authors and do not necessarily represent those of their affiliated organizations, or those of the publisher, the editors and the reviewers. Any product that may be evaluated in this article, or claim that may be made by its manufacturer, is not guaranteed or endorsed by the publisher.
The Supplementary Material for this article can be found online at: https://www.frontiersin.org/articles/10.3389/fams.2023.1163583/full#supplementary-material
1. Friedl P, Gilmour D. Collective cell migration in morphogenesis, regeneration and cancer. Nat Rev Mol Cell Biol. (2009) 10:445–57. doi: 10.1038/nrm2720
2. Weijer CJ. Collective cell migration in development. J Cell Sci. (2009) 122:3215–23. doi: 10.1242/jcs.036517
3. Scarpa E, Mayor R. Collective cell migration in development. J Cell Biol. (2016) 212:143–55. doi: 10.1083/jcb.201508047
4. Norden C, Lecaudey V. Collective cell migration: general themes and new paradigms. Curr Opin Genet Dev. (2019) 57:54–60. doi: 10.1016/j.gde.2019.06.013
5. Wan Y, McDole K, Keller PJ. Light-sheet microscopy and its potential for understanding developmental processes. Annu Rev Cell Dev Biol. (2019) 35:655–81. doi: 10.1146/annurev-cellbio-100818-125311
6. Boutillon A, Giger FA, David NB. Analysis of In Vivo Cell Migration in Mosaic Zebrafish Embryos. New York, NY: Springer (2018).
7. Deutsch A, Theraulaz G, Vicsek T. Collective motion in biological systems. Interface Focus. (2012) 2:689–92. doi: 10.1098/rsfs.2012.0048
8. Camley BA, Rappel WJ. Physical models of collective cell motility: from cell to tissue. J Phys D Appl Phys. (2017) 50:113002. doi: 10.1088/1361-6463/aa56fe
9. Deutsch A, Friedl P, Preziosi L, Theraulaz G. Multi-scale analysis and modelling of collective migration in biological systems. Philos Trans R Soc B Biol Sci. (2020) 375:20190377. doi: 10.1098/rstb.2019.0377
10. Buttenschön A, Edelstein-Keshet L. Bridging from single to collective cell migration: a review of models and links to experiments. PLoS Comput Biol. (2020) 16:e1008411. doi: 10.1371/journal.pcbi.1008411
11. Köhn-Luque A, de Back W, Starrußý J, Mattiotti A, Deutsch A, Perez-Pomares JM, et al. Early embryonic vascular patterning by matrix-mediated paracrine signalling: a mathematical model study. PLoS ONE. (2011) 6:e24175. doi: 10.1371/journal.pone.0024175
12. Hirashima T, Rens EG, Merks RMH. Cellular potts modeling of complex multicellular behaviors in tissue morphogenesis. Dev Growth Differ. (2017) 59:329–39. doi: 10.1111/dgd.12358
13. David NB, Sapède D, Saint-Etienne L, Thisse C, Thisse B, Dambly-Chaudière C, et al. Molecular basis of cell migration in the fish lateral line: role of the chemokine receptor CXCR4 and of its ligand, SDF1. Proc Natl Acad Sci USA. (2002) 99:16297–302. doi: 10.1073/pnas.252339399
14. Knutsdottir H, Zmurchok C, Bhaskar D, Palsson E, Dalle Nogare D, Chitnis A, et al. Polarization and migration in the zebrafish posterior lateral line system. PLoS Comput Biol. (2017) 13:e1005451. doi: 10.1371/journal.pcbi.1005451
15. Szabó A, Melchionda M, Nastasi G, Woods ML, Campo S, Perris R, et al. In vivo confinement promotes collective migration of neural crest cells eng. J Cell Biol. (2016) 213:543–55. doi: 10.1083/jcb.201602083
16. Peruani F, Klauss T, Deutsch A, Voss-Böhme A. Traffic jams, gliders, and bands in the quest for collective motion of self-propelled particles. Phys Rev Lett. (2011) 106:128101. doi: 10.1103/PhysRevLett.106.128101
17. Bär M, Großmann R, Heidenreich S, Peruani F. Self-propelled rods: insights and perspectives for active matter. Annu Rev Cond Matter Phys. (2020) 11:441–66. doi: 10.1146/annurev-conmatphys-031119-050611
18. Theveneau E, Steventon B, Scarpa E, Garcia S, Trepat X, Streit A, et al. Chase-and-run between adjacent cell populations promotes directional collective migration. Nat Cell Biol. (2013) 15:763–72. doi: 10.1038/ncb2772
19. Alhashem Z, Feldner-Busztin D, Revell C, Alvarez-Garcillan Portillo M, Camargo-Sosa K, Richardson J, et al. Notch controls the cell cycle to define leader versus follower identities during collective cell migration. eLife. (2022) 11:e73550. doi: 10.7554/eLife.73550
20. Boutillon A, Escot S, Elouin A, Jahn D, González-Tirado S, StarrußJ, et al. Guidance by followers ensures long-range coordination of cell migration through α-catenin mechanoperception. Dev Cell. (2022) 57:1529–44.e5. doi: 10.1016/j.devcel.2022.05.001
21. Diz-Muñoz A, Romanczuk P, Yu W, Bergert M, Ivanovitch K, Salbreux G, et al. Steering cell migration by alternating blebs and actin-rich protrusions. BMC Biol. (2016) 14:74. doi: 10.1186/s12915-016-0294-x
22. Dumortier JG, Martin SG, Meyer D, Rosa FM, David NB. Collective mesendoderm migration relies on an intrinsic directionality signal transmitted through cell contacts. Proc Natl Acad Sci USA. (2012) 109:16945–50. doi: 10.1073/pnas.1205870109
23. Heisenberg CP, Tada M, Rauch GJ, Saúde L, Concha ML, Geisler R, et al. Silberblick/Wnt11 mediates convergent extension movements during zebrafish gastrulation. Nature. (2000) 405:76–81. doi: 10.1038/35011068
24. Glickman NS, Kimmel CB, Jones MA, Adams RJ. Shaping the zebrafish notochord. Development. (2003) 130:873–87. doi: 10.1242/dev.00314
25. Vicsek T, Czirók A, Ben-Jacob E, Cohen I, Shochet O. Novel type of phase transition in a system of self-driven particles. Phys Rev Lett. (1995) 75:1226–9. doi: 10.1103/PhysRevLett.75.1226
26. Marchetti MC, Joanny JF, Ramaswamy S, Liverpool TB, Prost J, Rao M, et al. Hydrodynamics of soft active matter. Rev Mod Phys. (2013) 85:1143–89. doi: 10.1103/RevModPhys.85.1143
27. Van Liedekerke P, Palm MM, Jagiella N, Drasdo D. Simulating tissue mechanics with agent-based models: concepts, perspectives and some novel results. Comput Particle Mech. (2015) 2:401–4. doi: 10.1007/s40571-015-0082-3
28. Graner F, Glazier JA. Simulation of biological cell sorting using a two-dimensional extended Potts model. Phys Rev Lett. (1992) 69:2013–6.
29. Marée AFM, Grieneisen VA, Hogeweg P. The Cellular Potts Model and Biophysical Properties of Cells, Tissues and Morphogenesis. Basel: Birkhäuser (2007).
30. Swat M, Thomas GL, Belmonte JM, Shirinifard A, Hmeljak D, Glazier JA. Multi-scale modeling of tissues using CompuCell3D. In:Asthagiri AR, Arkin AP, , editors. Computational Methods in Cell Biology. vol. 110 of Methods in Cell Biology. Academic Press (2012). p. 325–66. doi: 10.1016/b978-0-12-388403-9.00013-8
31. Mirams GR, Arthurs CJ, Bernabeu MO, Bordas R, Cooper J, Corrias A, et al. Chaste: an open source C library for computational physiology and biology. PLoS Comput Biol. (2013) 9:e1002970. doi: 10.1371/journal.pcbi.1002970
32. StarrußJ, de Back W, Brusch L, Deutsch A. Morpheus: a user-friendly modeling environment for multiscale and multicellular systems biology. Bioinformatics. (2014) 30:1331–2. doi: 10.1093/bioinformatics/btt772
33. Marée AFM, Grieneisen VA, Edelstein-Keshet L. How cells integrate complex stimuli: the effect of feedback from phosphoinositides and cell shape on cell polarization and motility. PLoS Comput Biol. (2012) 8:e1002402. doi: 10.1371/journal.pcbi.1002402
34. Kabla AJ. Collective cell migration: leadership, invasion and segregation. J R Soc Interface. (2012) 9:3268–78. doi: 10.1098/rsif.2012.0448
35. Starruß J, Jahn D, Müller R, de Back W, Deutsch A, Brusch L. MorpheusML. FAIRsharing.org. (2023). doi: 10.25504/fairsharing.78b6a6
36. Alamoudi E, Starruß J, Bundgaard N, Müller R, Reck F, Graw F, et al. Massively parallel likelihood-free parameter inference for biological multi-scale systems. In: Proceedings of the NIC Symposium. (Jülich) (2022). p. 355–65.
37. Alamoudi E, Schälte Y, Müller R, Starruß J, Bundgaard N, Graw F, et al. FitMultiCell: simulating and parameterizing computational models of multi-scale and multi-cellular processes. bioRxiv. (2023). doi: 10.1101/2023.02.21.528946
38. Roszko I, Sawada A, Solnica-Krezel L. Regulation of convergence and extension movements during vertebrate gastrulation by the Wnt/PCP pathway. Semin Cell Dev Biol. (2009) 20:986–97. doi: 10.1016/j.semcdb.2009.09.004
39. Smutny M, Ákos Z, Grigolon S, Shamipour S, Ruprecht V, Čapek D, et al. Friction forces position the neural anlage. Nat Cell Biol. (2017) 19:306–17. doi: 10.1038/ncb3492
40. Boutillon A, Escot S, David NB. Deep and spatially controlled volume ablations using a two-photon microscope in the zebrafish gastrula. J Visual Exp. (2021) e62815. doi: 10.3791/62815-v
41. Zorn ML, Marel AK, Segerer FJ, Rädler JO. Phenomenological approaches to collective behavior in epithelial cell migration. Biochim Biophys Acta Mol Cell Res. (2015) 1853(11 Pt B):3143–52. doi: 10.1016/j.bbamcr.2015.05.021
42. George M, Bullo F, Campàs O. Connecting individual to collective cell migration. Sci Rep. (2017) 7:9720. doi: 10.1038/s41598-017-10069-8
43. Angelini TE, Hannezo E, Trepat X, Marquez M, Fredberg JJ, Weitz DA. Glass-like dynamics of collective cell migration. Proc Natl Acad Sci USA. (2011) 108:4714–9. doi: 10.1073/pnas.1010059108
44. Tlili S, Gauquelin E, Li B, Cardoso O, Ladoux B, Delanoë-Ayari H, et al. Collective cell migration without proliferation: density determines cell velocity and wave velocity. R Soc Open Sci. (2018) 5:172421. doi: 10.1098/rsos.172421
45. Guignard L, Fiúza UM, Leggio B, Laussu J, Faure E, Michelin G, et al. Contact area-dependent cell communication and the morphological invariance of ascidian embryogenesis. Science. (2020) 369:eaar5663. doi: 10.1126/science.aar5663
46. Shaya O, Binshtok U, Hersch M, Rivkin D, Weinreb S, Amir-Zilberstein L, et al. Cell-cell contact area affects notch signaling and notch-dependent patterning. Dev Cell. (2023) 40:505–11.e6. doi: 10.1016/j.devcel.2017.02.009
47. Menon T, Borbora AS, Kumar R, Nair S. Dynamic optima in cell sizes during early development enable normal gastrulation in zebrafish embryos. Dev Biol. (2020) 468:26–40. doi: 10.1016/j.ydbio.2020.09.002
48. Dang I, Gorelik R, Sousa-Blin C, Derivery E, Guérin C, Linkner J, et al. Inhibitory signalling to the Arp2/3 complex steers cell migration. Nature. (2013) 503:281–4. doi: 10.1038/nature12611
49. Polesskaya A, Boutillon A, Yang S, Wang Y, Romero S, Liu Y, et al. Restrained activation of CYFIP2-containing WAVE complexes controls membrane protrusions and cell migration. bioRxiv. (2022) 184655. doi: 10.1101/2020.07.02.184655
Keywords: cell migration, guidance-by-followers, zebrafish, collective phenomena, individual-based model, cellular Potts model, Morpheus
Citation: Müller R, Boutillon A, Jahn D, Starruß J, David NB and Brusch L (2023) Collective cell migration due to guidance-by-followers is robust to multiple stimuli. Front. Appl. Math. Stat. 9:1163583. doi: 10.3389/fams.2023.1163583
Received: 11 February 2023; Accepted: 02 June 2023;
Published: 13 July 2023.
Edited by:
James Osborne, The University of Melbourne, AustraliaReviewed by:
Julio Belmonte, North Carolina State University, United StatesCopyright © 2023 Müller, Boutillon, Jahn, Starruß, David and Brusch. This is an open-access article distributed under the terms of the Creative Commons Attribution License (CC BY). The use, distribution or reproduction in other forums is permitted, provided the original author(s) and the copyright owner(s) are credited and that the original publication in this journal is cited, in accordance with accepted academic practice. No use, distribution or reproduction is permitted which does not comply with these terms.
*Correspondence: Lutz Brusch, bHV0ei5icnVzY2hAdHUtZHJlc2Rlbi5kZQ==
†These authors have contributed equally to this work
Disclaimer: All claims expressed in this article are solely those of the authors and do not necessarily represent those of their affiliated organizations, or those of the publisher, the editors and the reviewers. Any product that may be evaluated in this article or claim that may be made by its manufacturer is not guaranteed or endorsed by the publisher.
Research integrity at Frontiers
Learn more about the work of our research integrity team to safeguard the quality of each article we publish.