 Paula Ann Gabrielle Yap1
 Zython Paul Lachica1,2,3†
 Abel Leandro Paras2
 Ivy Grace Panogalinog1,2
 Jerrold M. Tubay4
 May Anne Mata1,2,3,5*
- 1Center for Applied Modeling, Data Analytics, and Bioinformatics for Decision Support Systems in Health, University of the Philippines Mindanao, Davao City, Philippines
- 2Interdisciplinary Applied Modeling (IAM) Laboratory, University of the Philippines Mindanao, Davao City, Philippines
- 3University of the Philippines Resilience Institute, University of the Philippines Diliman, Quezon City, Philippines
- 4Mathematics Division, Institute of Mathematical Sciences and Physics, University of the Philippines Los Baños, Laguna, Philippines
- 5Department of Mathematics, Physics, and Computer Science, University of the Philippines Mindanao, Davao City, Philippines
Introduction: The onset of the SARS-CoV-2 pandemic alerted the Philippine government to impose the enhanced community quarantine (ECQ) as a means to hamper human mobility and interaction and eventually diminish transmission. Due to severe limitations in accessibility to basic needs due to ECQ, the government devised amelioration programs. A year after the declaration of the SARS-CoV-2 pandemic, variants of concern were detected locally. Consequently, there is a necessity to prepare reinstatement of strict non-pharmaceutical interventions while meeting the food-related basic needs of the population. Studies related to food distribution during a strict community quarantine have been lacking. The importance of allocating provisions during extreme pandemic measures should be properly analyzed, especially when attempts had been made by local government units.
Methods: This study devised an agent-based model (ABM) to observe the effects of the food relief system in mitigating the disease during Davao City ECQ when two variants are present in two adjacent villages. These relief distribution types are as follows: “regular and sufficient,” “regular but insufficient,” and “irregular” relief type. In total, three barangay scenarios were considered.
Results and discussion: For the worst-case scenario, wherein a lot of infections are anticipated, the results show that the “irregular” relief type peaked at the highest number of cases, while the “regular and sufficient” relief type showed little to almost no new cases. The compromise-case scenario showed almost no difference between “regular but insufficient” and “regular and sufficient.” For the best-case scenario, the three relief types showed low average infected cases with almost small variance. The model was then compared, situationally, with Davao City barangays during ECQ and recommended which food relief type applies to the barangays. This could serve as a baseline on how food reliefs could be optimally distributed in cases where barangay conditions differently affect and transmit the SARS-CoV-2 virus of different variants with varying transmission rates within a community. Further development of the model should potentially be useful for decision support not only during pandemics but also in contexts where resource allocation to a community is involved.
1. Introduction
The coronavirus disease 2019 (COVID-19) pandemic prompted different government organizations worldwide to formulate pandemic response measures aimed at lessening the spread of the disease. Since mobility and human interaction are mainly the key factors that affect infectious disease transmission [1], most of these response measures involve the isolation or containment of individuals up to certain rules and localities [2–4]. Efforts made by the Philippine government mostly involved recommendations from the World Health Organization (WHO) and the Center for Disease Control (CDC), as well as the minimum health standards implemented by other countries [5]. For instance, when new COVID-19 cases reached an alarming rate within the country, the immediate response was to implement strict border and mobility control, which are components of the enhanced community quarantine (ECQ) [6].
The Philippines was placed under ECQ during the early onset of the pandemic. In this level of community quarantine, the mobility of the general population was limited by restrictions on access to necessities by which strict rules were being imposed such as suspension of classes, public transportation, closure of workplaces, and observance of health protocols [7]. In Davao City, the largest city in the Philippines, enforcement and community checkpoints were implemented. Employee ID or the so-called food-and-medicine (FM) pass is presented whenever an individual passes through the checkpoints or goes inside the establishments that were allowed to operate. Curfew and banning liquor were also implemented as a COVID-19 response through executive order [8]. Due to these restrictions, local government units (LGUs) implemented social amelioration [9] measures to ease the burden on affected constituents [10]. One of these measures is the food relief system that encourages people to stay in their houses while meeting their physiological needs despite restrictions [11]. However, this system was eventually halted as it was implemented only during the extremely strict community quarantines.
More than a year after the pandemic started, COVID-19 variants emerged with different origins. This gave rise to what the World Health Organization (WHO) categorizes as variants of concern (VOCs), among which, the Delta variant is known to be the most contagious [12, 13]. As of 31 December 2021, the Philippines reached a total of 3,169 detected Alpha variant cases, 3,630 detected Beta variant cases, 8,452 detected Delta variant cases, and four detected Omicron variant cases [14].
The emergence of the VOCs has reintroduced government officials to the possibility of imposing strict non-pharmaceutical controls to ultimately slow the progress of COVID-19 transmission when the effectiveness of existing pharmaceutical approaches against emerging variants is not certain [15]. In the Philippines, quarantine policies and lockdowns are met with inconsistencies and criticisms due to their heavy-handed approach. Shortages, delays, and inconsistencies of food aid across the poorest sectors may correlate to less adherence to quarantine protocols. A retrospect into the potential effects of the food relief system as a COVID-19 non-pharmaceutical intervention (NPI) in mitigating disease transmission should be explored in the event that a more transmissible variant becomes increasingly prevalent within the country, and the urgency to reinstate these strict protocols, e.g., ECQ or stricter community quarantines, may become a less burden to both the people and the government.
To delve deeper into these effects in the context of an interaction-driven epidemic, agent-based modeling (ABM) simulation approach was used in this article. This approach has been shown to have the advantage compared with other types of models when the situation or system being studied has heterogeneous agents and can capture combined results from agent behaviors and interactions [16–18]. ABM is commonly applied to investigate “possibilities” of an event, for instance, what phenomena are to be observed if different scenarios are considered on the model [19]. The modeling approach is advantageous for this study due to its capability to capture the effects of individual interventions similar to its application to different types of diseases such as Dengue [20–22], HIV [23–25], and the relevant, COVID-19 [26, 27].
In this study, we formulated and developed an ABM simulation on COVID-19 dynamics incorporating the mechanisms of disease transmission and ECQ rules, such as lockdowns, curfews, and FM pass using NetLogo software [28]. This article explored how the food relief system affects the number of average infected cases per day in the presence of two SARS-CoV-2 variants within the model space—one with high transmission and one with low transmission. Moreover, we analyzed the following food relief system: regular distribution and sufficient, regular distribution but insufficient, and irregular distribution. Subsequently, the epidemic curves for each scenario were simulated and the duration for which it takes to be flattened was recorded. The results were then compared to the situation of Davao City barangays during ECQ and were given recommendations as to which relief system would best apply based on the conditions such as population density, marketplaces, and attack rates. The results can be used as a basis for an LGU in planning context-specific (e.g., highly populated communities with limited food sources such as markets) distribution of food relief/s to the villages it governs for specific contexts it may apply.
2. Materials and methods
2.1. Model overview
The model aims to emulate a closed human population in a village. We refer to this village as Barangay [29], the smallest political unit in the Philippines. In the model, two adjacent barangays, Barangay A and Barangay B, were considered and each of which consists of residents, their homes, and marketplaces where they can move in and out. Since the model replicates the state of barangays during the ECQ, it incorporates LGU guidelines as other factors affecting the simulation of the disease spread. These government guidelines, described in Table 1, are the implementation of FM-Pass, curfews, testing, and barangay lockdown.
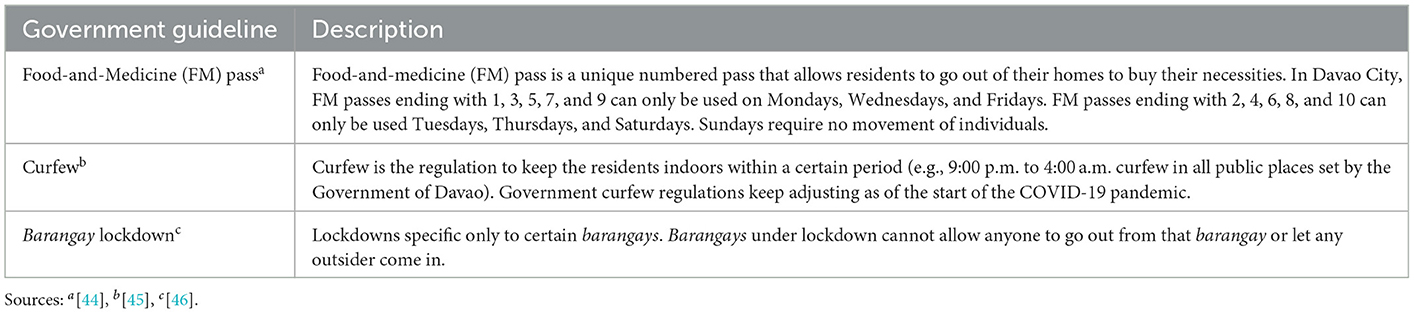
Table 1. Government guidelines implemented in the model and their description.
The following points are the model assumptions:
• A susceptible agent is said to be in contact with an infectious agent when it falls on the same grid. In this case, the contraction of the virus by the susceptible agent is determined according to its likelihood of being infected by the infectious agent. This means that infection does not happen instantaneously.
• Agents vary in their duration of stay in the marketplace such that it is normally distributed with an average of 2 h or ticks and a standard deviation of 0.5.
• Population agents will always comply with the curfew, lockdowns, and food-and-medicine passes, except for testing which is set by probability.
• Population agents will have the chance to go out once a day only to buy necessities at a marketplace and go back home once done.
• The curfew is set from 18:00 (6 p.m.) to 6:00 (6 a.m.) model time.
• Population does not increase during runtime.
• Barangay A and Barangay B agents can interact with no influx of new external agents.
• Regularity and sufficiency of food relief affect the agents' probability to move out to marketplaces. Regularity here means weekly distribution of food relief to the individuals.
• The “regular and sufficient” food relief distribution is when households are provided with relief goods that are enough for their families to sustain and last until the next distribution period. In the model, it is assumed that the agents rarely move out if this type of food distribution is set in the model.
• The “regular but insufficient” food relief distribution is when households are regularly provided with relief goods but not enough for their families to consume. This is assumed to have more effect on the probability of agents moving out to marketplaces.
• The “irregular” food relief distribution is when the relief goods are neither distributed regularly nor sufficiently, which then assumes the highest probability for agents to move out of their houses to the marketplaces.
2.2. Simulation model
2.2.1. Simulated space
A two-dimensional square grid is considered the hypothetical space of the model with each individual grid sized evenly. The left half, not including the origin along the y-axis, is represented as Barangay A, while the right half, not including the origin along the y-axis, is represented as Barangay B. The y-axis on the origin would indicate a color different from an empty space when the lockdown is in effect.
2.2.2. Time
Each timestep or tick in the model is equivalent to 1 h. In total, 24 h represent 1 full day. The model simulation period is set to 365 days.
2.3. Agents, agent states, and behaviors
The model considers three types of agents: a resident, a household, and a marketplace. A household is a representation of a house, while a marketplace is an abstraction of an actual public market where people buy their necessities. A patch, including its Moore neighborhood with r equal to 1, indicates a marketplace [30]. Both agents are immobile and do not affect the interactions of other agents. The only mobile type of agent would be the residents, which is defined as a person or an individual who lives in a barangay, resides in a household, and can travel to a marketplace. The behaviors of residents can change during the whole duration of the simulation (refer to the process overview and simulation section for further details). Table 2 tabulates and describes each of the agents' states and properties.
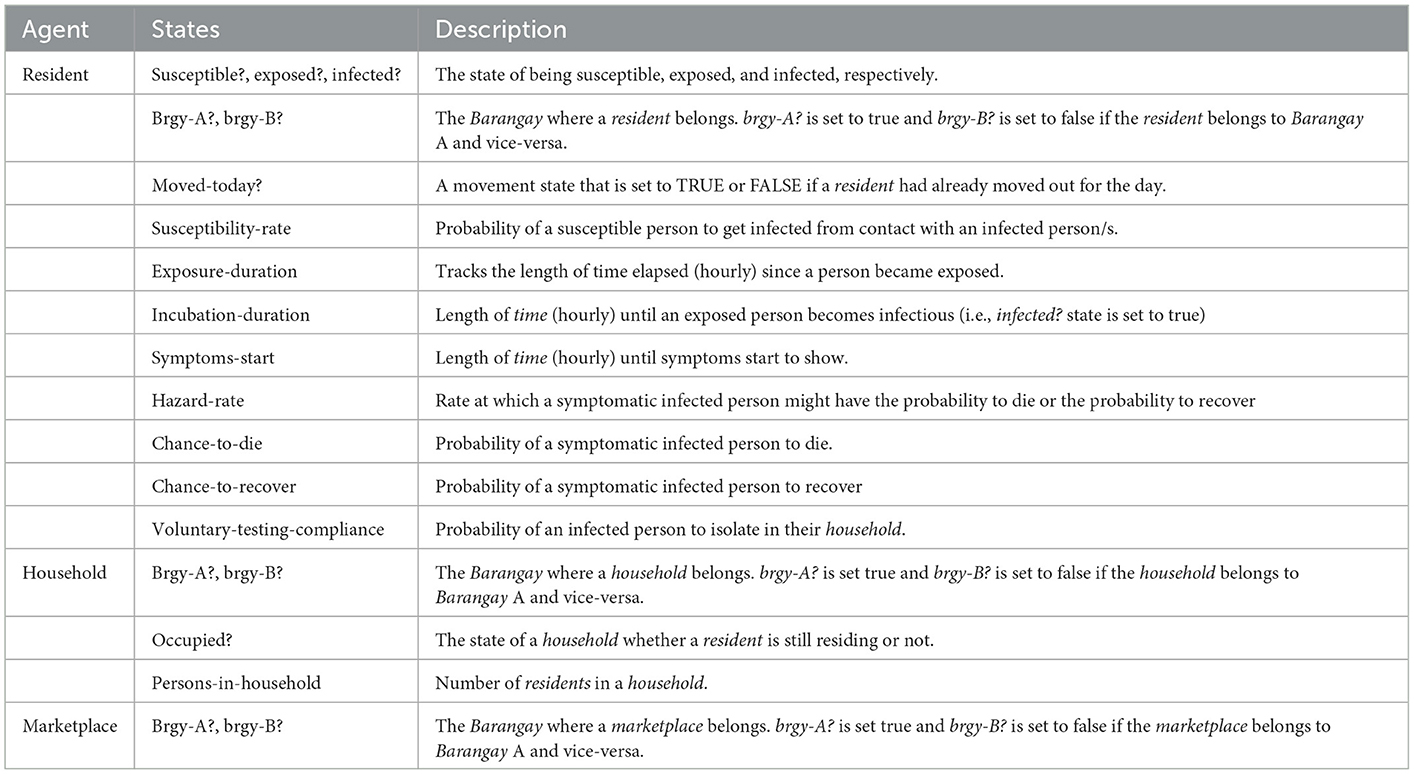
Table 2. Agent's state and properties.
2.4. Parameters
Table 3 summarizes the definitions, values, and references of each parameter in the model. Some of the parameters in the model are empirically defined. Since model parameters are sensitive to initial values, parameter variability is considered in the model. Furthermore, several parameters are allowed to be set differently for each barangay.
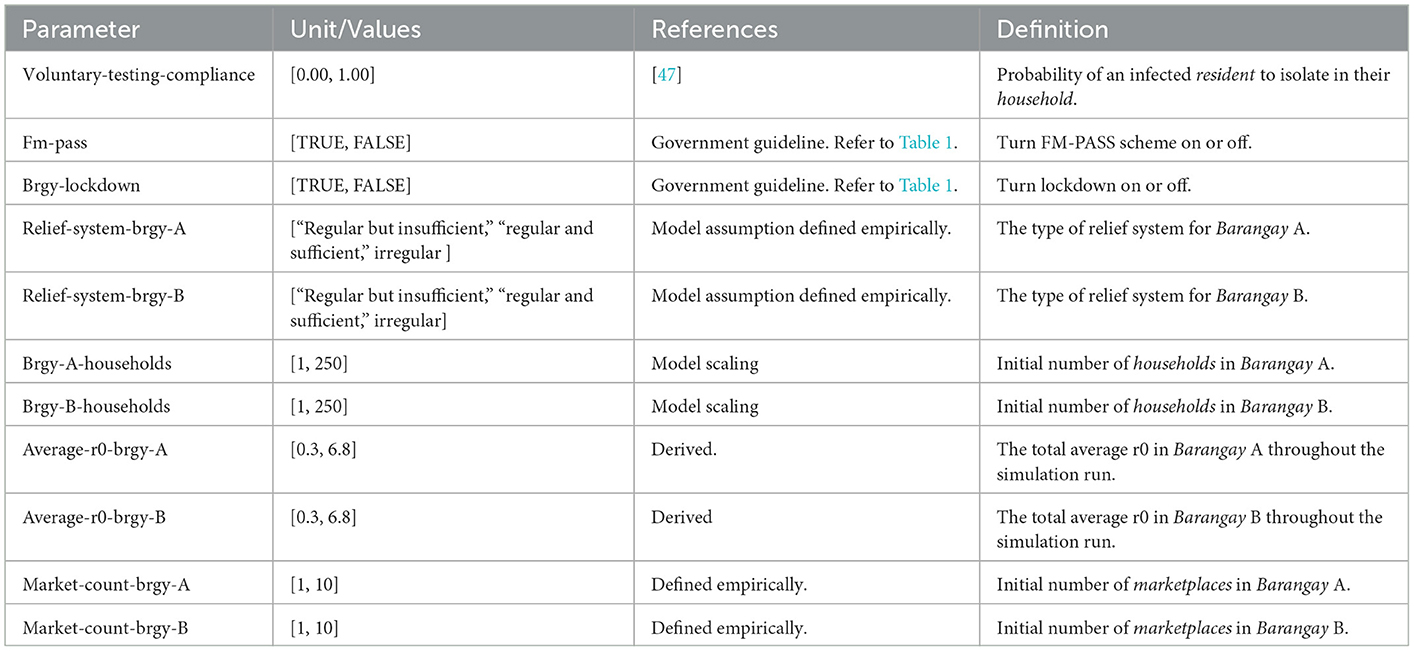
Table 3. Definition, values, and reference/s of each parameter defined in the model.
The model incorporated testing compliance, i.e., the voluntary-testing-compliance parameter, which is the probability of an infected resident being tested and consequently being isolated from the system. The parameters fm-pass and brgy-lockdown are based on actual government guidelines imposed during ECQ. For the relief system, the three relief types were mainly assumptions based on the experience during the food relief rollout in Davao City.
The range of the number of households is defined based on how dense the model space would be in its maximum range, and vice versa in its minimum. The same goes for the number of marketplaces for both barangays.
2.5. Initialization
The global variables for the time, epidemiological values, and space are initialized first. For the globals, the day is first initialized to the value −1. The constant, ave-incubation-period, is set to the product 7 × 24, which is equivalent to 7 days. The value is described in a global meta-analysis and Chinese observational study as the mean incubation period [31]. The mean susceptibility for each barangay with r0average, i.e., average-r0-brgy-A or average-r0-brgy-B parameter of Barangay A and Barangay B, respectively, is given by Equation 1. This equation was derived by empirically fitting the results of the proportion of susceptible individuals as a function of the reproduction number of the ABM. The details of the empirical fitting are found in Table 4.
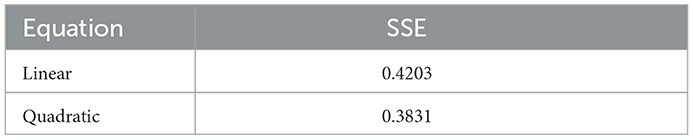
Table 4. Results of the empirical fit between linear and quadratic model specifications using sum of squared errors (SSE) with quadratic specification showing less error.
By default, the model dimensions are set through the model settings. Specifically, each grid has a size of 13.4 × 13.4 pixels. The location of the origin is centered in the model space, and the minimum and maximum x-coordinates are −40 and 40 grids in dimension, while the minimum and maximum y-coordinates are −20 and 20 grids in dimension, respectively. A grid is assumed to be a scaled-down version of a 100 sq. m block. The model space will be modified during initialization if the parameter brgy-lockdown is set to TRUE. If this is the case, the lockdown barrier will be set up by indicating a unique different color to the origin along the y-axis, different from an empty space. This will create a clear separation between Barangay A and Barangay B.
As mentioned, a single marketplace in the model space is a single grid including its Moore neighborhood with r = 1. The marketplaces will be initialized first before all agents. By adjusting the parameters, market-count-brgy-A and market-count-brgy-B, the number of marketplaces for each barangay will be created. Each marketplace is assigned a unique random grid in the model space of every setup. The marketplaces of Barangay A are created first followed by the marketplaces of Barangay B.
A single household is a single grid in the model space or a hundred square meter space. After setting up the marketplaces, the households will be initialized next. Therefore, the marketplaces, the parameters, brgy-A-households, and brgy-B-households define the number of households for each barangay. The households are randomly assigned a position, ensuring that no two households share the same location in the model space. The occupied? state is set to FALSE by default initially. Finally, for each household, the value of persons-in-household is the maximum occupancy a household can hold. It is randomized through normal distribution with a mean and standard deviation of 4 and 1, respectively [32].
A single grid can be occupied by multiple residents. The initial total number of residents for each barangay depends on the total sum of the persons-in-household value of all households in a barangay. A condition for a resident to be assigned a permanent household is to move it to the location of a household with its occupied? state set to FALSE and the brgy-A? or brgy-B? state set to TRUE, depending on which barangay the resident is assigned. Once a household reaches its maximum occupancy, the occupied? state of the household is then set to TRUE.
All residents have the susceptible? state initially set to TRUE, then the rest of the EIR (exposed?, infected?, and recovered?) states are assigned FALSE. The susceptibility-rate value is randomized through normal distribution with the mean and standard deviation of the barangay's mean susceptibility (see Equation 1) and 0.5 as the value of sd-susceptibility or the standard deviation, respectively. The same is applied to the incubation-duration but with a mean of ave-incubation-period, or 7 days, and a standard deviation of 1 day or 24 ticks.
Once the aforementioned setup procedures are done, a number of infected agents for Barangay A and Barangay B are randomly chosen based on the values of the parameters, initial-infected-residents-Brgy-A, and initial-infected-residents-Brgy-B, respectively.
2.6. Process overview and simulation
The simulation is an iterative process wherein each loop represents 1 h. Every timestep performs the behaviors of agents and updates all the states. Only the residents consist of complex processes. Table 5 lists and describes the behavior of the residents.
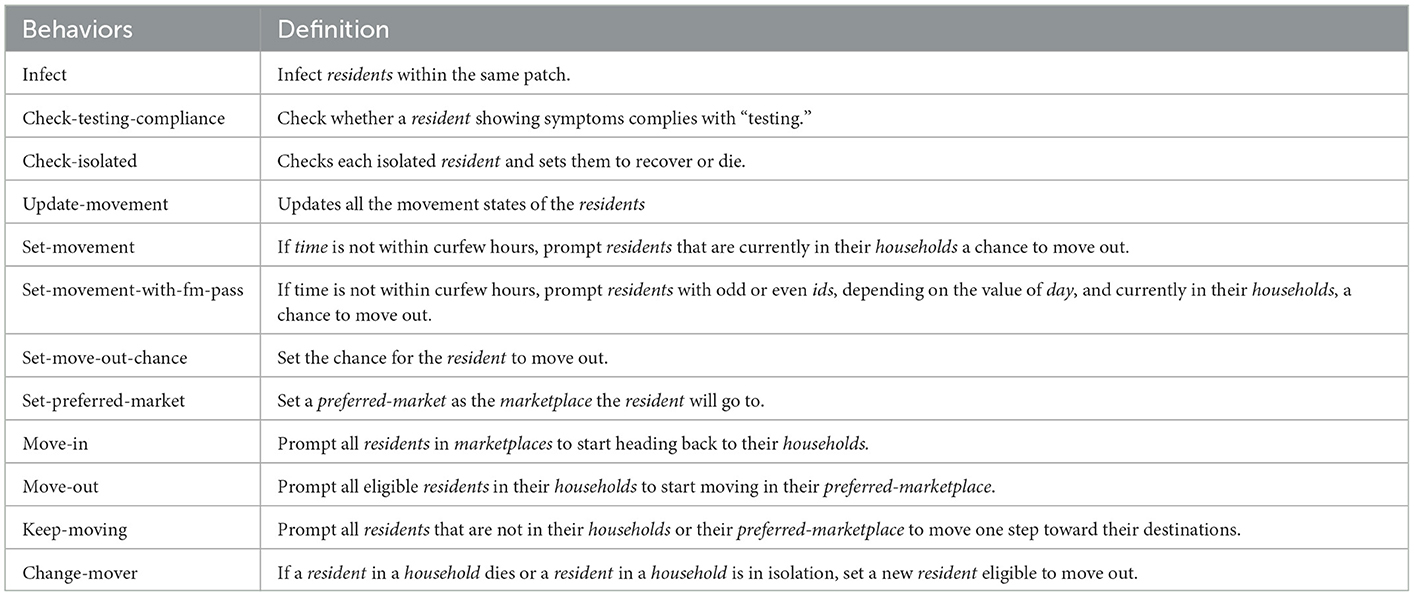
Table 5. Behaviors of residents and their definitions.
2.6.1. Movement dynamics
The parameters, fm-pass, brgy-lockdown, relief-system-brgy-A, and relief-system-brgy-B, affect the movement of residents. Setting these parameters allow different stochastic outcomes for residents in terms of movement. For instance, if fm-pass is set to TRUE, only residents with odd-numbered IDs can have the chance to move out if the day is numbered 1, 3, or 5 (Monday, Wednesday, or Friday), respectively. While residents with even-numbered IDs will have the chance to move if the day is numbered 2, 4, or 6 (Tuesday, Thursday, or Saturday), respectively. If the day is equal to 7 (Sunday), no movement behaviors will be implemented. Each household is only assigned one resident who is allowed to move out. If this assigned resident is in isolation, a new resident will be assigned to their household. If fm-pass is set to false, any resident will have the chance to move regardless of the day. Aside from the aforementioned conditions, the innate curfew set as a government guideline within the model does not allow residents to move if the simulation time is between 18:00 and 6:00.
As stated in the overview, the assumption behind the relief system in this model is that people only move around for necessities. Therefore, each relief type allows movement to a certain degree of probability depending on the type initialized. The relief type values were determined through assumptions and observations during the food relief system rollout during ECQ in Davao City. For instance, electricity and water bills were temporarily postponed, and food relief was primarily delivered door-to-door so regular activities were halted. In the model, the residents have the probabilities of 0.13, 2, and 4% to move out for regular and sufficient, regular but insufficient, and irregular relief systems correspondingly. The probabilities are assumptions based on how frequently a household might need to purchase food and other needs. If a barangay is provided enough, and regular sustenance, the less the constituents are likely to require bought necessities. In the model, it is assumed to be 0 to 1 or 0.5 every month for regular and sufficient food relief. For regular but insufficient food relief, it is 1, 2, or 1.5 times every week, due to the assumption that people would need to go out at least once a week. Finally, an irregular food relief distribution meant the highest probability of moving out because supposedly people cannot depend on government assistance and will essentially look for ways to earn money for food, hence, people are assumed to go out around three times a week in this type of relief situation.
The brgy-lockdown strictly does not allow residents to move and cross between barangays. Therefore, if brgy-lockdown is switched to true, residents at Barangay A can only move to markets within Barangay A, and residents at Barangay B can only move to markets within Barangay B. If barangay lockdown is set to false, the residents' marketplaces of choice will be divided into two—the nearest marketplaces and the farthest marketplaces. Ultimately, the decision is randomized; however, there is an 85% chance the resident would choose from the nearest marketplaces group due to the assumption that a person would still prefer going to the nearest marketplace for practicality.
2.6.2. Epidemiological dynamics
The epidemiology in this model simulation follows an SEIR compartmental model as depicted in Figure 1. Assuming a resident with its susceptible? state set to TRUE, contact with another infected resident would trigger a probability for the susceptible resident to transition to an exposed state. The probability is based on the susceptibility-rate parameter. The incubation-duration determines the duration of whether the exposed resident can now transition to an infected? state. Infected residents will eventually transition to a symptomatic state set by symptoms-start duration property. These symptomatic infectious individuals have the probability to voluntarily test and then consequently isolate. The type of symptoms to manifest is currently not considered in the model. These symptomatic residents will have the probability to die or to recover, which is triggered by the hazard-rate probability. If they do recover, then their probability to die will be reduced by 50%. These recovered residents will then cycle back immediately to a susceptible state. Dead residents are removed from the model.
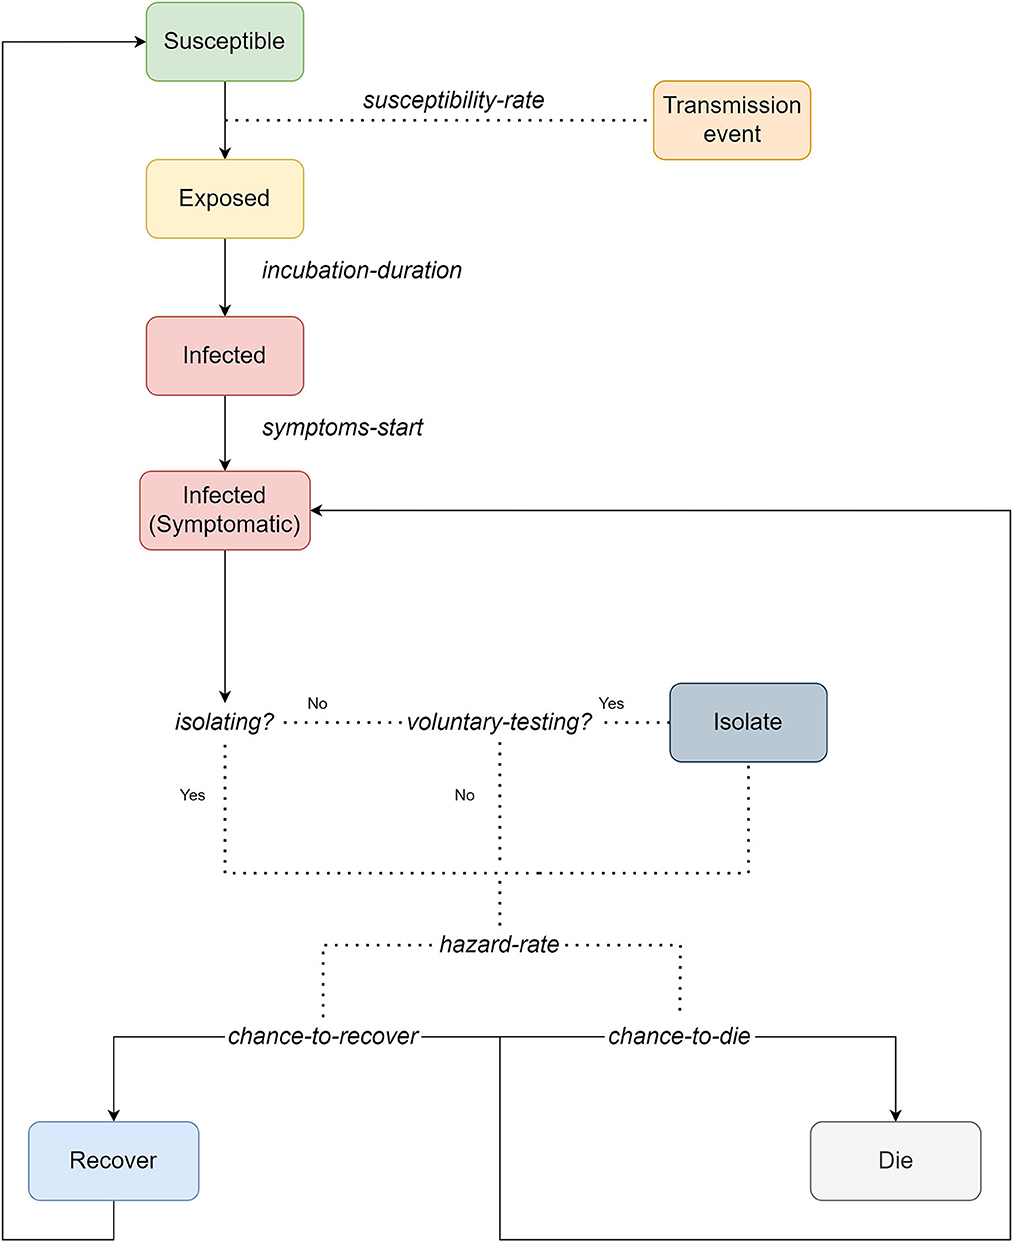
Figure 1. Flowchart of the epidemiological dynamics with isolation based on an SEIR compartmental model.
Figure 2 shows a sample grid of several interactions among residents from different barangays with varying epidemiological states. The movement process gives a possibility for the residents to epidemiologically interact. Generally, the model only allows interactions of residents within the same grid. The top-left blue grid in Figure 2, for example, indicates two residents from different barangays. In this specific grid, a resident from Barangay A, depicted by a triangle, is in an infected state, and a resident from Barangay B, depicted by a circle, is in a susceptible state. This susceptible resident will have the chance to be infected by the infected resident. The susceptible residents on the right adjacent grid will never have the chance to be infected by any infected resident from any adjacent grid. The residents in an exposed state can neither infect nor be exposed again. Exposed residents can only move to an infected state after some time.
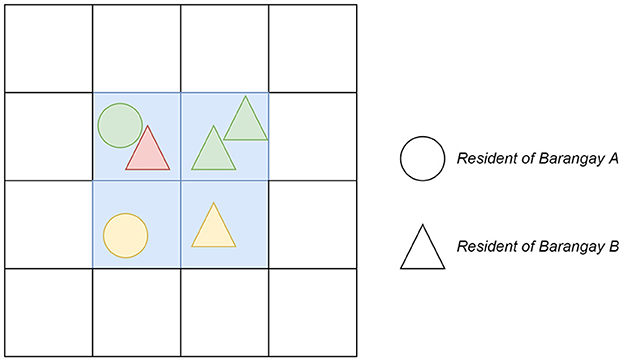
Figure 2. Visual representation of the two-dimensional world grid with several resident interactions. The circle-shaped resident belongs to barangay B, while the triangle-shaped resident belongs to barangay A. The red color represents an infected resident, the yellow color represents an exposed resident, and the green color represents a susceptible resident. The infected resident has the probability to transmit the virus to a susceptible resident within the same grid. Susceptibles or exposed residents in the neighboring grids cannot possibly be exposed by the same infected resident.
2.7. Defining barangay scenarios
The model was formulated with the spatial perspective of Davao City and the early situation of the pandemic in mind. Therefore, to test this agent-based model, scenarios will be established with specific parameter settings matching the aforementioned circumstance. It is also assumed that different variants are in circulation to replicate the present conditions where several variants are already spreading in the community. For this study, three barangay scenarios were hypothetically defined namely: the worst-case scenario, compromise-case scenario, and best-case scenario. All three scenarios' parameter values are specified in Table 6.
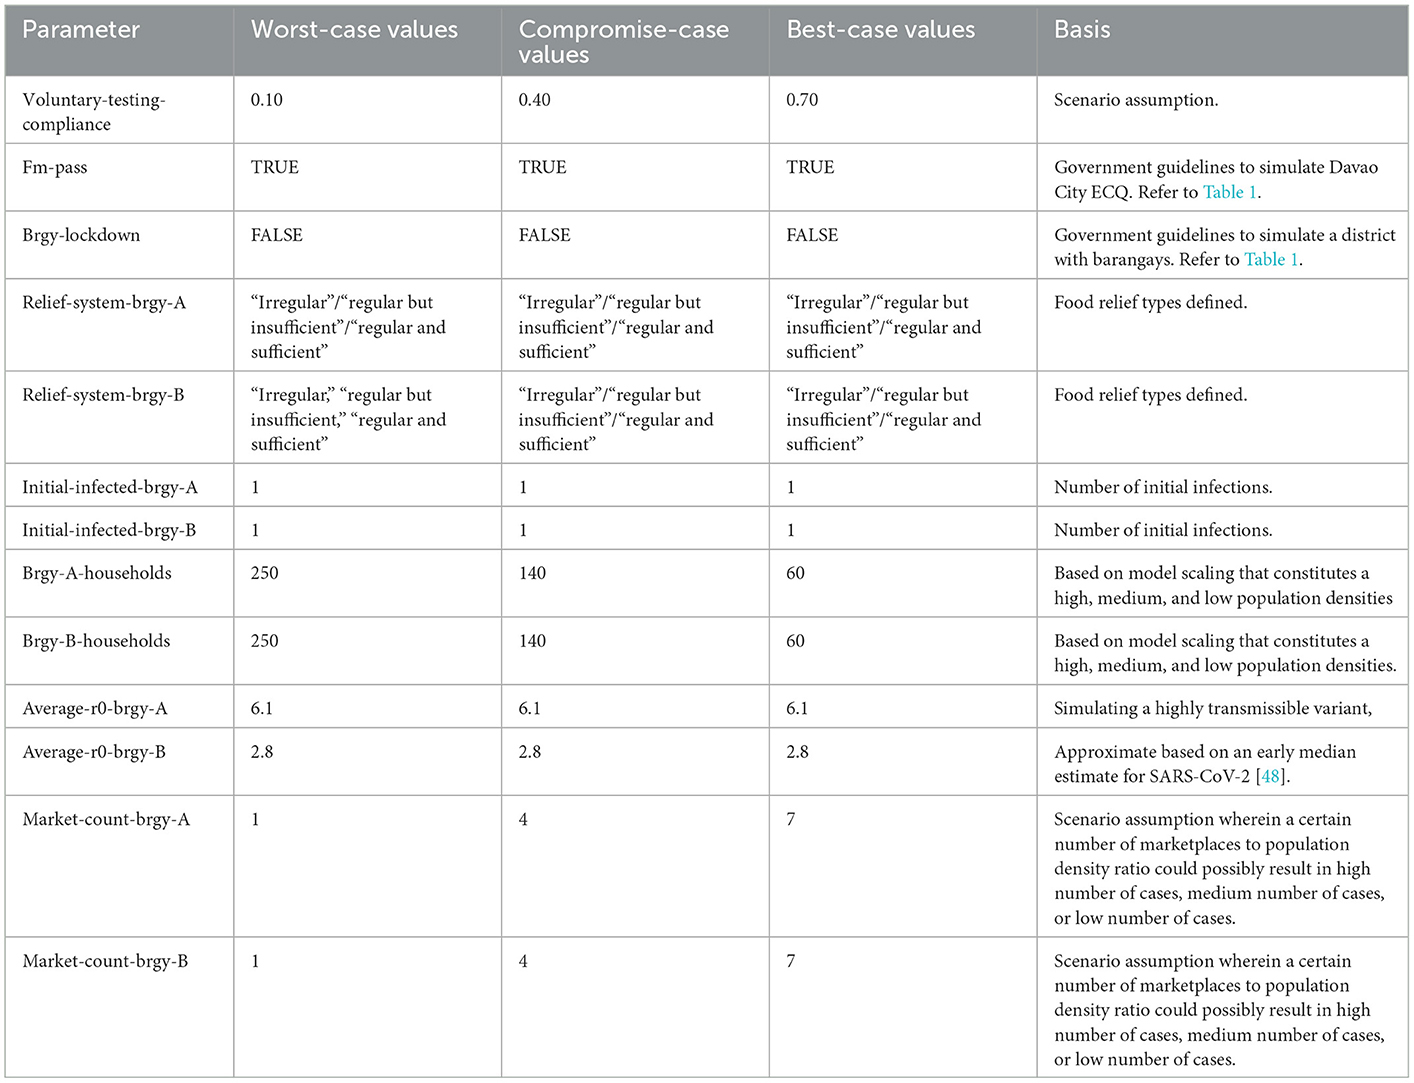
Table 6. Parameter values and settings set for every scenario's simulation run.
The worst-case scenario expects the worst results. For one, there is less compliance with testing which means less detection and isolation of infected residents. The household densities in Barangay A and Barangay B are the highest in this scenario as well. Furthermore, there is only one marketplace for every barangay which means many residents would possibly converge to these individual marketplaces. A sample figure of what the Barangays in the worst scenario might look like upon initialization is given in Figure 3. The visualization shows dense households in both barangays.
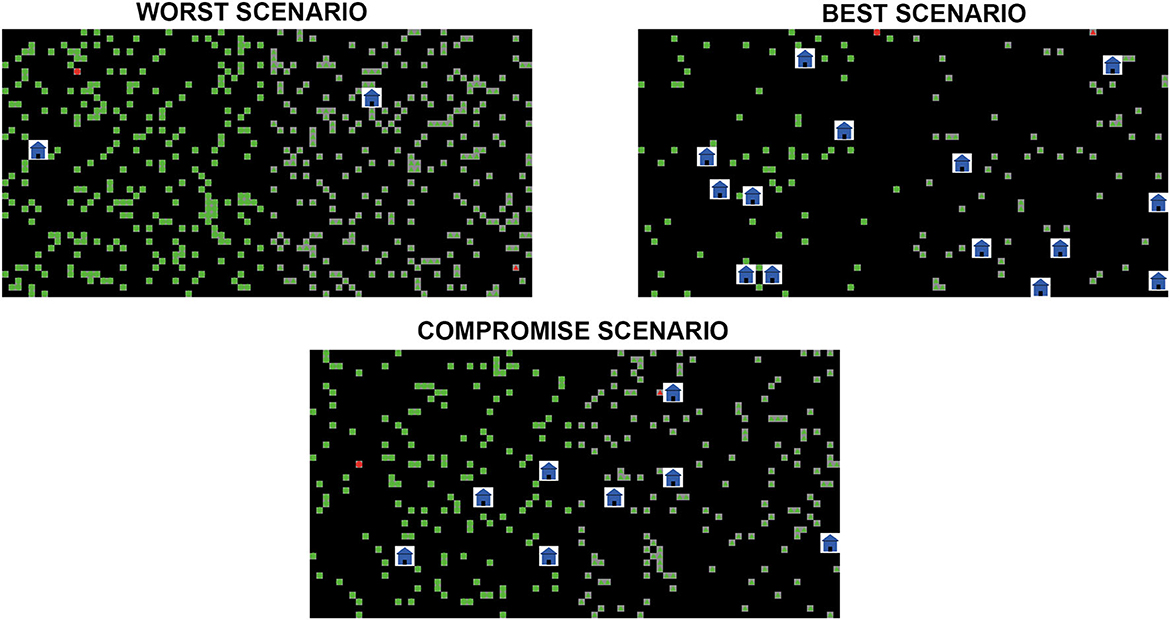
Figure 3. Sample initialization (t = 0) of the three scenarios: top-left is the worst scenario, bottom-center is the compromise scenario, and top-right is the best scenario. Generally, all scenarios have the same barangays: barangay A and barangay B. The gray square grid is a household and the white larger grid with an image of a house at its center is a marketplace. The green shapes are the susceptible residents, while the red ones are the initially infected residents. Each scenario only differs in the number of households and marketplaces counts where the values set can be seen in Table 6. Sample simulation videos for each scenario are provided as Supplementary material. The Netlogo file used in this simulation can be accessed through this GitHub link: https://github.com/PagiY/Agent-Based-Model-on-Food-Relief.git.
The compromise scenario expects better results compared with the worst scenario. A sample visualization of the initialization in this scenario is also given in Figure 3. For instance, the residents have more compliance than in the worst-case scenario, but it is still not the ideal testing compliance rate. There is lesser household density in this scenario compared with the worst-case scenario, and there are more marketplaces within each of the barangays.
Finally, the best-case scenario expects the relatively best situation of a community epidemiologically. The parameters in this scenario have the highest voluntary compliance compared with the other two scenarios. The number of households for each barangay is also the lowest compared with the other two scenarios, and the number of available marketplaces can abundantly cater to the population. A sample initialization of this scenario is shown in Figure 3.
2.8. Software and hardware requirements
The agent-based model of this article was executed using the NetLogo version 6.0.4 [17]. The minimum system requirements to run the model were based on the system requirements set by the NetLogo software. Consequently, the model was run using a Windows 10, 64-bit laptop with 16 GB RAM, and a GTX 1070 graphics card.
2.9. Data gathering
A total of 100 simulation runs were performed with 8,760 ticks each (~1 year) for each of the scenarios. Specific parameters such as fm-pass and brgy-lockdown are set to TRUE and FALSE, respectively, by default. Two variants are in circulation within these two barangays—one with a high transmission rate (93%) and one with a low (30%) transmission rate. During runtime, the total infected cases per day from Barangays A and B were gathered in every simulation run per food relief system and per barangay scenario to generate a 1-year epidemic curve with a 95% confidence interval estimate. Such an epidemic curve will provide a quick overview of the possible effect of the food relief system. Furthermore, the simulated epidemic curve peak among all the possible information was obtained since the peak is a representation of the possible healthcare burden [33]. Consequently, the simulated maximum number of COVID-19 cases, i.e., epidemic curve peak, for each food relief system under a particular barangay scenario were compared and statistically tested at a 5% level of significance. The most recommended relief type for every scenario is then identified and further discussed in the next section.
3. Results and discussion
The following sections discuss the results of three hypothetical scenarios namely: the worst-case scenario, compromise-case scenario, and best-case scenario. Figure 4 shows the plots of the simulated COVID-19 cases with a 95% confidence interval. The simulated epidemic curves vary notably in the magnitude of the epidemic peak and the time it takes for the epidemic peak to happen. The worst-case scenario, at a glance, varies notably in epidemic curves for each relief type. The compromise case comparably varies less in the regular but insufficient relief type and the regular and sufficient relief type. Finally, all food relief types allegedly see almost no difference in the best-case scenario. To confirm these observations, non-parametric statistical tests are performed.
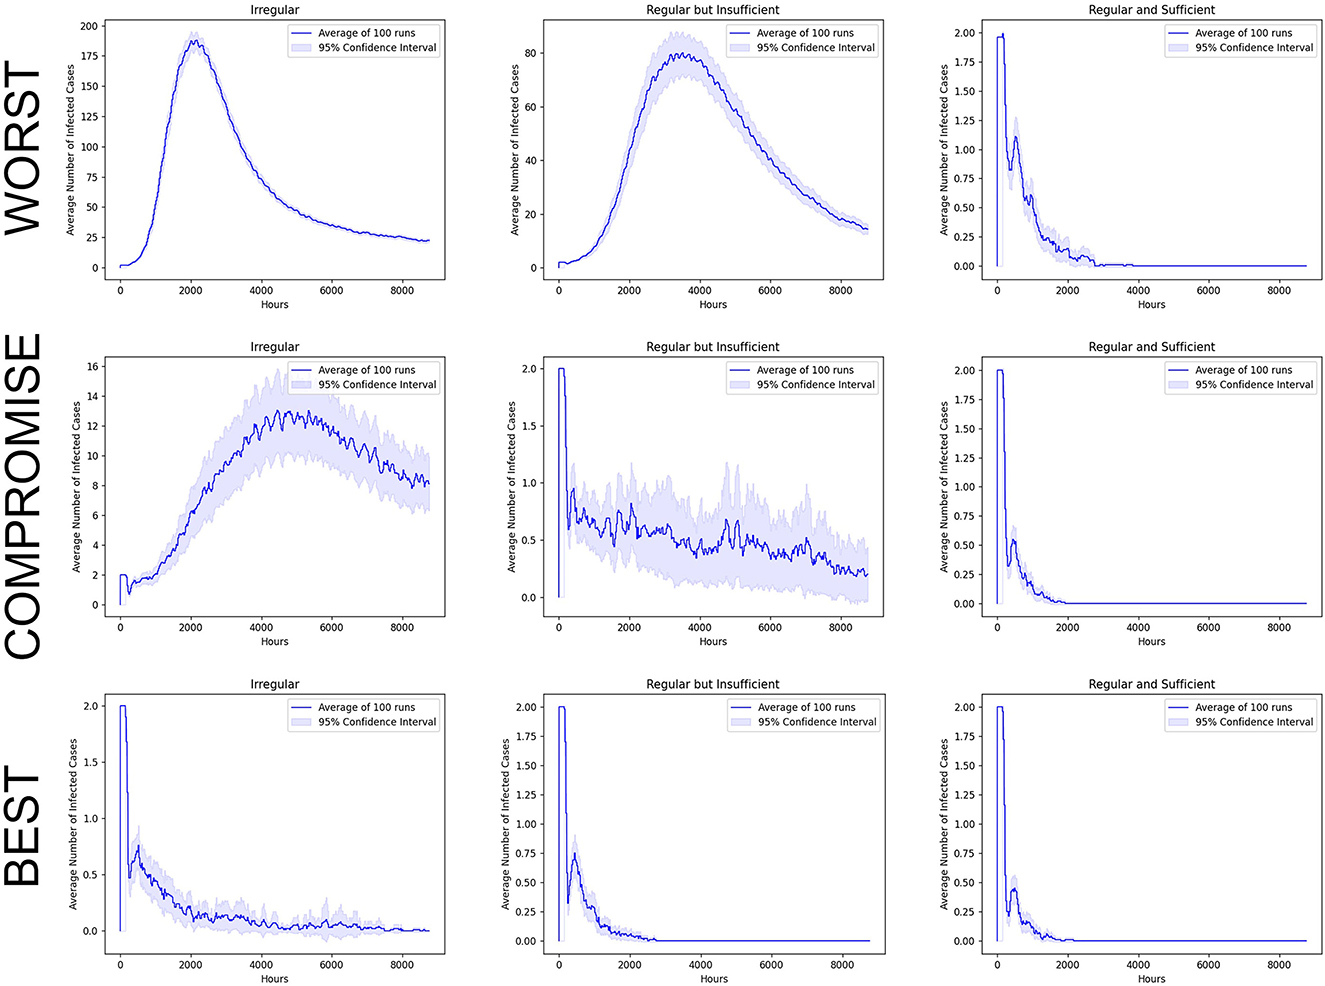
Figure 4. One-year simulation of COVID-19 cases epidemic curve with an average of 100 simulation runs for both barangays under three different scenarios with a 95% confidence interval. Sample simulation videos for each scenario are provided as Supplementary material. The Netlogo file used in this simulation can be accessed through this GitHub link: https://github.com/PagiY/Agent-Based-Model-on-Food-Relief.git.
3.1. Regular and sufficient relief for the worst-case scenario
The leftmost image in Figure 5 displays the distribution of the simulated maximum number of COVID-19 cases and it visually appears that at least one food relief system yielded a relatively lower number of COVID-19 cases. In the figure, the highest distribution of average infected cases is the “irregular” relief type, while the “regular and sufficient” relief type has the lowest distribution of a number of cases. The Kruskal–Wallis test for equal medians revealed that there is a significant difference between median COVID-19 cases. Furthermore, its post-hoc test revealed that all three relief systems are significantly different from each other in this scenario.
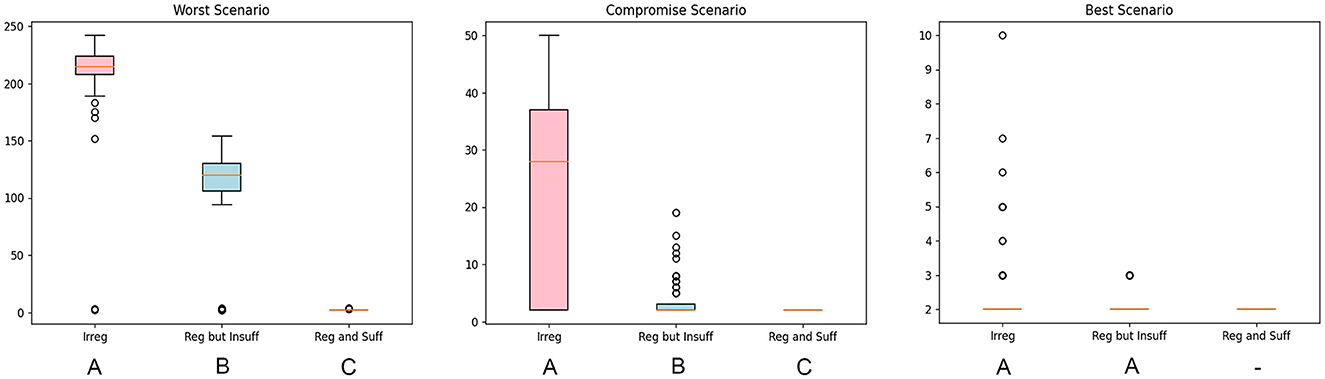
Figure 5. Box plot of the simulated COVID-19 maximum number of cases for each food relief system with 100 replications for all of the scenarios. For the worst case, the Kruskal–Wallis H-statistic result: H = 252.914; p-value = 1.203 x 10−55. Box plots not sharing the same letter are significantly different (Bonferroni-corrected p < 0.05). For the compromise cases, the Kruskal–Wallis test H-statistic result: H = 110.858; p-value = 8.461 x 10⁻²⁵. Box plots not sharing the same letter are significantly different (Bonferroni-corrected p < 0.05). Finally, for the best case, the Mann–Whitney U-test result: U = 5355.0, p-value = 0.1506. Box plots sharing the same letter are not significantly different (p < 0.05). Box plot with no letter indicates no variability, hence statistical inference for multiple group comparison was not performed.
When both barangays are densely populated, disease transmission is the highest with the “irregular” food relief system as more contact between residents can be expected due to their basic needs than with the other food relief system [34]. The disease transmission is further expedited with limited available marketplaces as agents tend to cluster, making the virus easily transmitted [35]. Meanwhile, it is noteworthy to mention that despite all the factors that constitute the worst scenario, with the “regular and sufficient” food relief type, the virus cannot propagate as shown in the worst scenario epidemic curve in Figure 4 since the residents rarely go outside their households. Hence, the best relief system for a locality with similar circumstances as the worst parameter is a “regular and sufficient” food relief system.
3.2. At least regular but insufficient for the compromise-case scenario
The distribution of the simulated maximum number of COVID-19 cases for the three relief systems in the compromise-case scenario is visualized in the middle image in Figure 5. The “irregular” relief system still showed the highest maximum number of COVID-19 cases. On the contrary, the “regular but insufficient” and “regular and sufficient” relief types showed little difference in the simulated maximum number of COVID-19 cases. This is also observed in the epidemic curve in Figure 4.
As in the worst-case scenario, there is a significant difference in the maximum number of COVID-19 cases among the three relief systems. Moreover, the three food relief systems are significantly different from each other in the compromise scenario. While the result of the statistical analysis points out that the relief systems are significantly different, the plot shown in Figure 5 would suggest almost no difference between “regular but insufficient” and “regular and sufficient” reliefs. However, it could be argued that having a single infected case could still be a cause for a lot of transmissions [36]; therefore, the best relief system to opt for in this scenario would be “regular and sufficient.” However, since the Philippines is subject to certain bureaucratic and government procurement complexity [37] that could limit a barangay's resources, then the least relief system the locality could implement would be “regular but insufficient.”
3.3. Regularity and sufficiency do not matter in the best scenario
Finally, the best-case scenario expects the best situation of a community, epidemiologically. The parameters in this scenario have the highest voluntary compliance compared with the other scenarios. The number of households for each barangay is also lower, and there are more marketplaces within the simulated space.
The rightmost image in Figure 5 shows similar averages among all relief systems. Among the three food relief systems, the “regular and sufficient” relief type yielded no variability. Variability is essential in comparing scenarios so we cannot include it in the analysis. The relief systems left to compare are “regular but insufficient” and “insufficient.” Due to less density, as well as the increase in the number of marketplaces that results in less convergence of individuals, the virus could no longer sustain its spread which, in the simulation runs, resulted in an average of only one maximum case [35]. This barangay scenario, therefore, has favorable conditions for the virus to die out. These favorable conditions are compounded due to the movement of individuals which is affected depending on the relief type. Hence, based on the results, the regularity and sufficiency of food relief do not matter. In other words, an “irregular” relief type would suffice in similar barangay scenarios such as this.
3.4. Correspondence to other COVID-19 models
This model aimed to describe the early improvised interventions imposed by the local government unit of Davao City during the onset of the pandemic in the Philippines: FM-PASS coding, curfews, and lockdowns. The concept of the model revolves around movement restriction through incentives, i.e., the food relief system as an added non-pharmaceutical intervention. To our knowledge, there have been no other models so far that have conceptualized similar interventions in their models. Distributing food relief has also been done in different countries, and common problems persisted [38, 39]. In Uganda, for example, problems such as delays, poor quality of food aid, and arrests due to strict quarantine policies are rampant and are being criticized [39]. Upon further examination of Uganda's situation, one recommendation by Nathan et al. [39] is decentralized food distribution. In this study, individuals going to decentralized food sources (e.g., marketplaces), in a way, limit the spread of the virus between villages and the distribution of the food relief further controls the possible viral spread within the village.
Most of the COVID-19 models are based on an SEIR compartmental framework, which is also the basis of our epidemiological model. Since the model's transmission dynamics heavily depend on the mobility of the agents, such results are best compared to models studying the effect of mobility on COVID-19 incidences. Oka et al. [40] used an SIR stochastic model to describe the spatiotemporal evolution of COVID-19 across several provincial regions of China. A critical component of their model is capturing the impact of human movement as part of disease transmission. Notably, Oka et al. [40] took into consideration external infections from other regions and examined scenarios wherein movement restrictions were not in effect across regions. The simulated number of infected individuals expectedly showed an increasing trend, and delaying further restrictions predicted an even higher growth. Such results of Oka et al. [40] have been reflected by our model, especially in the “irregular” relief distribution for the worst-case and compromise-case scenarios.
Zhou et al. [41], on the contrary, built an SEIR model for COVID-19 using ordinary differential equations which explored the effect of varying intensity of movement limitations on COVID-19 transmission. In their model, they used mobile phone mobility data to establish the number of people moving to or within regions. The way they reduced movement is by setting the level of mobility by 20, 40, and 60% of infectious people only, whereas in this model, all agents are affected by movement reduction based on the level of regularity and sufficiency of food relief. A 60% reduction in movement simulated the flattest epidemic curve across all scenarios, while the 20% reduction in movement simulated the highest among the restriction scenarios. Our simulation results are also in agreement with Zhou et al. [41]—our highest epidemic curve was observed when agents produced more movement and interactions in situations when there is irregularity and insufficiency of food relief, while the opposite saw the immediate flattening of the curve.
One of the main differences between this model as compared with the other models is the behavioral assumptions that are taken into account when people are subjected to restrictions as well as the uncertainty of food security. Some work sectors have been resistant to the community lockdowns driven by their physiological needs as the work-from-home (WFH) setup during the pandemic is not amenable for them. Consequently, human mobility persists which underscores the importance of a food relief system as an additional layer of the implemented NPIs. For instance, the impact of community quarantine is affected by how agreeable the tertiary workforce is to a work-from-home setup [42]. It is then important for the government to take into consideration an assistance program or to allocate resources for the affected constituents within their jurisdiction.
3.5. Scenario comparisons and recommendations to Davao City during ECQ
This section serves as a demonstration of the possible application of the results. Davao City's barangays are chosen for an actual scenario comparison in this study. To generally describe the population characteristics of these barangays, they are grouped together into 11 districts. The boundaries of the districts and population densities can be visualized in Figure 6.
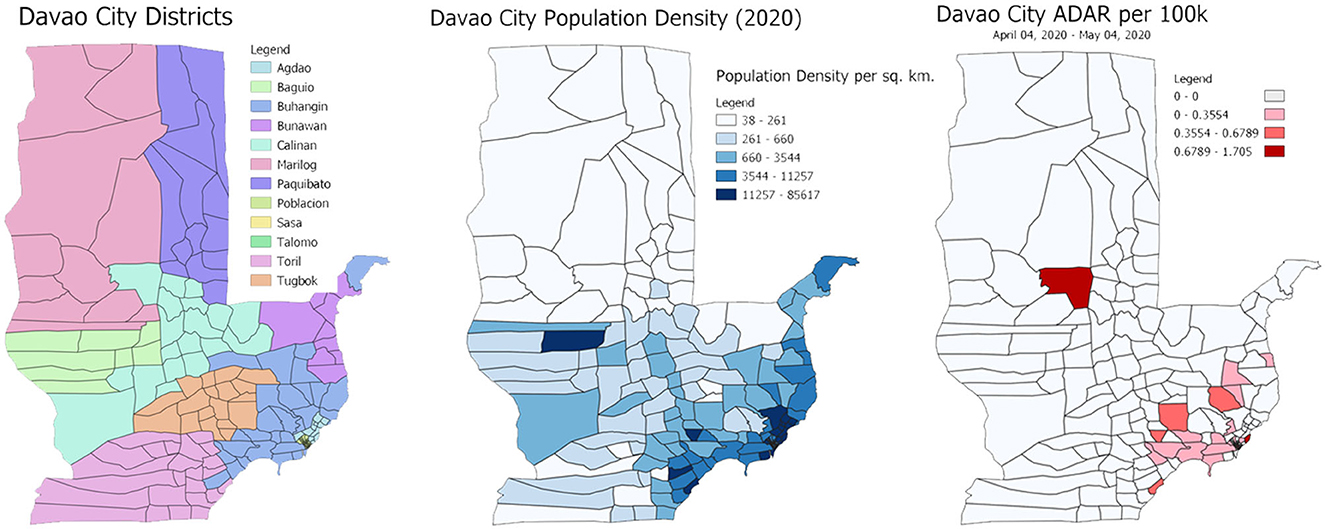
Figure 6. (Left) Map information of Davao City districts. (Center) Choropleth map details of Davao City barangays population density per square kilometer. (Right) Average daily attack rates per 100,000 per barangay from 04 April 2020 to 04 May 2020.
Along with the ECQ implementation in the city, the local government imposed a “clustering” method to curb the pandemic [43]. This method divided the barangays by districts into “clusters” where residents were only allowed to move within their assigned district cluster. These clusters were also strictly given designated marketplaces within their district where they are only permitted to purchase necessities. However, there is an uneven proportion of marketplaces assigned for each cluster, that is, some clusters are assigned a few marketplaces in proportion to their high population density barangays. This further solidifies the scenario comparison wherein the population is restricted to moving to marketplaces and households only.
From the aforementioned information, the Barangays can be categorized under the three scenarios as follows: barangays under districts Agdao, Bunawan, Buhangin, Poblacion, and Talomo are mostly categorized under the worst scenario due to their high population density and tightly clustered barangays to low marketplaces count ratio. As an example, Agdao district with 11 barangays and a high population density of 16,676.50 people per sq. km only has a single marketplace to cater to this many people. This discourages distancing measures inside the market and encourages the transmission of the virus, hence the worst case. For the compromise scenario, this could be best distinguished by the barangays under districts Baguio, Calinan, Tugbok, and Toril because of their average population density and several marketplaces proportionally provided. Finally, districts with barangays with more than sufficient marketplaces to accommodate a low population density are found in Paquibato and Marilog for the best case. Pertinent information for each district, its clustering, and recommendations are shown in Table 7.
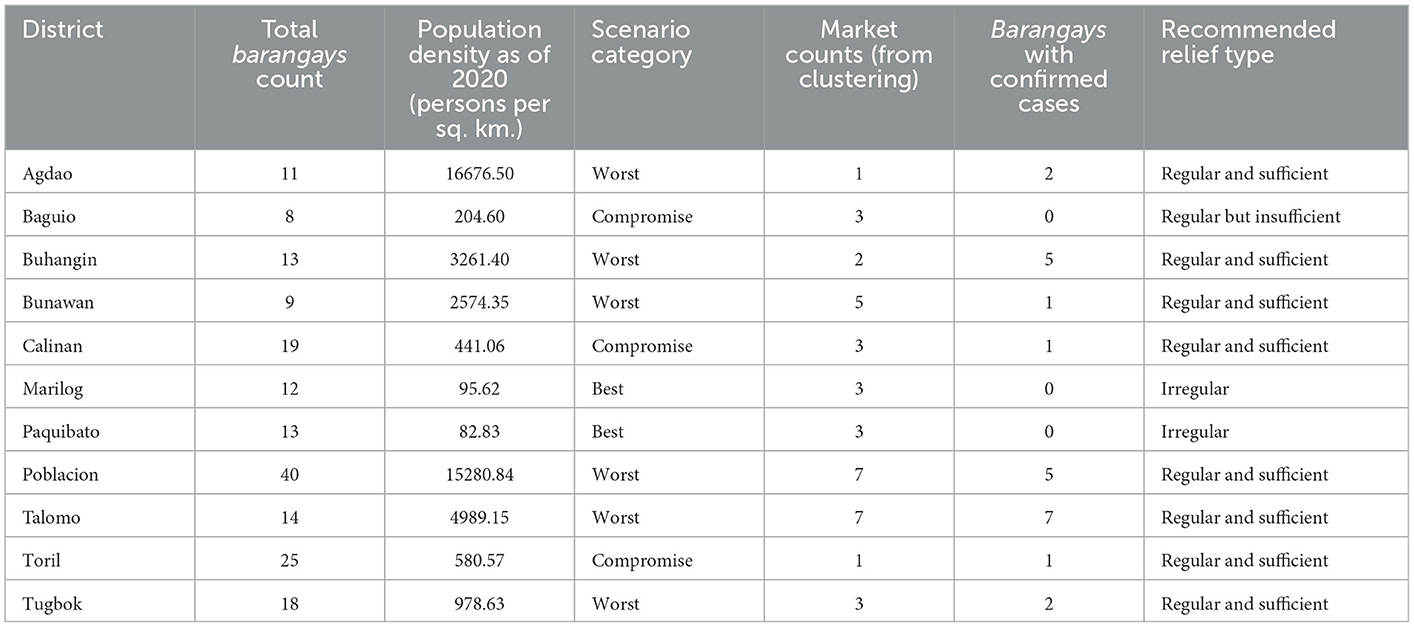
Table 7. Summary of Davao City Districts' information such as scenario category, number of marketplaces per cluster, and number of barangays with confirmed cases.
To provide proper recommendations on which relief system can be applicable, the number of barangays with cases and the average daily attack rate per 100,000 (ADAR) for each of the barangays are determined and calculated. The duration computed for the ADAR is from the imposition of ECQ and clustering back on 04 April 2020, up to a month. It is important to note that at this time, the number of cases was still minuscule compared with the number of cases today. Figure 6 summarizes the COVID-19 ADAR results into a choropleth map.
The summary for each district in Table 7 shows that the districts under the worst scenario all had barangays with confirmed cases. It can also be observed that despite the relatively high number of available marketplaces for the Talomo district, half of its barangays had confirmed cases. Reiterating the results of the simulation runs, the districts with the worst scenario are where it is strongly recommended to reinforce a regular and sufficient food relief system. The data further validate that worst scenario barangays are prone to COVID-19 transmission and therefore recommended regular and sufficient relief system distribution.
Districts under the compromise scenario have fewer barangays with confirmed cases. Under the recommendations in Table 7, some of these districts are given regular but insufficient distribution and some are given regular and sufficient. This is based on the data that some of these districts are starting to have barangays with confirmed cases, while some continue to have no cases at the time. But as stated in the previous section, regularity still matters provided a sufficient supply of resources, and as a fallback due to logistical limitations, the least food relief distribution is regular but insufficient for these barangays.
Finally, the districts categorized as the best scenario are recommended for the irregular distribution of food relief due to having no cases during the whole duration of the ECQ.
4. Key findings and limitations
The study conceptualized and developed an agent-based model that aimed to explore COVID-19 dynamics within a village called barangay, the smallest political unit in the Philippines, with food relief distribution during a strict community quarantine. The agent-based modeling allows for flexible exploration of epidemiological interactions due to its ability to quickly simulate “what-if” scenarios by adjusting parameter values. Using this model, it is observed that despite the presence of a highly transmissible variant circulating within the community, the effect of food relief is still significant. Furthermore, for different scenarios or barangay situations, varying the regularity and sufficiency of food relief distribution could affect mitigating virus transmission to different degrees. From the scenario analyses, villages with high population density and few marketplaces tend to exhibit high COVID-19 incidences. Hence, it is a strategic move to allocate a large number of food relief in these villages than in villages with low population density and a high number of accessible marketplaces. Generally, at least having a regular but insufficient food relief distribution can be an effective intervention in flattening the epidemic curve of a village with an average population density during a strict community quarantine. These findings show how the results can be utilized on a case-to-case basis.
It is noteworthy to mention that our study only explored a few possible scenarios limited only by specific NPIs that were implemented during ECQ in Davao City, but the model can be further extended to consider other scenarios, for instance, including other NPIs, as well as pharmaceutical interventions such as vaccines. Further improvements, validation, and calibration can be done to the model to simulate COVID-19 infection in specific villages or even municipalities using its actual demographic and COVID-19 data. There is also limited data on the COVID-19 dynamics during the food relief distribution in the Philippines, and therefore the subject of interest, the food relief system, is a behavioral assumption based on the observations at the time of implementation. Nevertheless, this article could serve as the baseline literature for COVID-19 dynamics driven by the need to satisfy physiological needs.
Data availability statement
The original contributions presented in the study are included in the article/Supplementary material, further inquiries can be directed to the corresponding author.
Author contributions
PY, ZL, AP, IP, JT, and MM: conceptualization and methodology. PY, AP, and IP: development. PY, ZL, MM, and JT: formal analysis, writing, reviewing, and editing. PY and ZL: resources, data gathering, and writing the original draft preparation. PY: visualization. ZL, JT, and MM: supervision. All authors have read and agreed to the published version of the manuscript.
Funding
This study was supported by the Department of Science and Technology through the Predictive Modeling and Viral Phylodynamic Analysis on the Spatial and Temporal Patterns of Disease Outbreaks with considerations for Control and Logistics (PPASTOL) applied in Mindanao region research project under the Niche Center in the Regions for R&D (NICER) Program on Decision Support Systems in Health based in the University of the Philippines Mindanao and is monitored by Philippine Council for Health Research and Development (DOST-PCHRD). ZL and MM were supported by the UP Resilience Institute as fellows of the institute and members under its UP COVID-19 Pandemic Response Team during the early phase of conceptualization of this study.
Acknowledgments
The authors would like to acknowledge Federico Calo for providing the COVID-19 data in Davao City, Jayve Iay Lato for assisting in running and interpreting codes, and Honey Glenn Lorono for proofreading and referencing.
Conflict of interest
The authors declare that the research was conducted in the absence of any commercial or financial relationships that could be construed as a potential conflict of interest.
Publisher's note
All claims expressed in this article are solely those of the authors and do not necessarily represent those of their affiliated organizations, or those of the publisher, the editors and the reviewers. Any product that may be evaluated in this article, or claim that may be made by its manufacturer, is not guaranteed or endorsed by the publisher.
Supplementary material
The Supplementary Material for this article can be found online at: https://www.frontiersin.org/articles/10.3389/fams.2023.1068180/full#supplementary-material
References
1. Meloni S, Perra N, Arenas A, Gómez S, Moreno Y, Vespignani A. Modeling human mobility responses to the large-scale spreading of infectious diseases. Sci Rep. (2011) 1:62. doi: 10.1038/srep00062
2. Talabis SDA, Babierra AL, Buhat HCA, Lutero DS, Quindala KM III, Rabajante JF. Local government responses for COVID-19 management in the Philippines. BMC Public Health. (2021) 21:1711. doi: 10.1186/s12889-021-11746-0
3. Logrosa G, Mata MA, Lachica ZP, Estaña LM, Hassall M. Integrating risk assessment and decision-making methods in analyzing the dynamics of COVID-19 epidemics in Davao City, Mindanao island, Philippines. Risk Anal. (2022) 42:105–25. doi: 10.1111/risa.13779
4. Arcede J, Randy C-A, Mammeri Y, Lachica ZP, Gonzales ICA, Mata MA. A modeling strategy for novel pandemics using monitoring data: the case of early COVID-19 pandemic in Northern Mindanao, Philippines. Researchgate.net (2022). Available online at: https://www.researchgate.net/publication/360215883_A_modeling_strategy_for_novel_pandemics_using_monitoring_data_the_case_of_early_COVID-19_pandemic_in_Northern_Mindanao_Philippines (accessed October 27, 2021).
5. Department of Health. Workplace Handbook on COVID-19 Management and Prevention Version 2. (2021). Available online at: https://doh.gov.ph/sites/default/files/publications/Workplace-Handbook-Version-2-Sept-13-2021.pdf (accessed October 27, 2021).
6. Ravelo JL. To contain the spread of coronavirus, Manila grapples with lockdown. (2020). Available online at: https://www.devex.com/news/to-contain-the-spread-of-coronavirus-manila-grapples-with-lockdown-96823 (accessed October 27, 2021).
7. Inter-Agency Task Force. Omnibus Guidelines on the Implementation of Community Quarantine in the Philippines. Official Gazette Philippines (2020). Available online at: https://www.officialgazette.gov.ph/downloads/2020/05may/20200429-Omnibus-Guidelines-on-the-Implementation-of-Community-Quarantine-in-the-Philippines.pdf
8. City Government of Davao. Executive Order No. 20. (2020). Available online at: https://records.davaocity.gov.ph/wp-content/uploads/2021/06/EO-20-s.-2020.pdf (accessed October 28, 2021).
9. Department of Social Welfare Development. DSWD Memorandum Circular No. 04 Series of 2020. (2020). Available online at: https://www.dswd.gov.ph/issuances/MCs/MC_2020-004.pdf (accessed October 28, 2021).
10. Department of Interior Local Government. DILG: LGUs which impose localized lockdowns must organize quick response teams. (2020). Available online at: https://www.dilg.gov.ph/news/DILG-LGUs-which-impose-localized-lockdowns-must-organize-quick-response-teams/NC-2020-1192 (accessed January 19, 2021).
11. Palicte C. Food rationing starts in Davao City. (2020). Available online at: https://www.pna.gov.ph/articles/1097460 (accessed October 28, 2021).
12. World Health Organization. Tracking SARS-CoV-2 variants. Who.int. Available online at: https://www.who.int/en/activities/tracking-SARS-CoV-2-variants/ (accessed October 27, 2021).
13. Desimone D. COVID-19 variants: What's the concern?. Mayo Clinic (2021). Available online at: https://www.mayoclinic.org/diseases-conditions/coronavirus/expert-answers/covid-variant/faq-20505779 (accessed October 28, 2021).
14. Montemayor MT. 2021 a year of recovery from pandemic: DOH. Philippine News Agency (2021). Available online at: https://www.pna.gov.ph/articles/1164207 (accessed January 29, 2022).
15. Li M, Lou F, Fan H. SARS-CoV-2 Variants of Concern Delta: a great challenge to prevention and control of COVID-19. Signal Transduct Target Ther. (2021) 6:349. doi: 10.1038/s41392-021-00767-1
16. Macal C, North M. Introductory tutorial: Agent-based modeling and simulation. In: Proceedings of the Winter Simulation Conference 2014. Savannah, GA: IEEE (2014). p. 6–20.
18. Hunter E, Mac Mamee B, Kelleher JD. A Comparison of Agent-Based Models Equation Based Models for Infectious Disease Epidemiology. Dublin; Leinster: Technological University of Dublin (2018). Available online at: https://arrow.tudublin.ie/cgi/viewcontent.cgi?article=1086&context=scschcomart
19. Gallagher S, Eddy WF. Comparing Compartment Agent-Based Models. Pittsburgh, PA: Carnegie Mellon University (2017). Available online at: https://skgallagher.github.io/papers/gallagher_8-17.pdf (accessed October 28, 2021).
20. Isidoro C, Fachada N, Barata F, Rosa A. Agent-based model of dengue disease transmission by Aedes aegypti populations. In: Advances in Artificial Life Darwin Meets von Neumann. Berlin, Heidelberg: Springer Berlin Heidelberg (2011). p. 345–52. doi: 10.1007/978-3-642-21283-3_43
21. Jacintho LFO, Batista AFM, Ruas TL, Marietto MGB, Silva FA. An agent-based model for the spread of the Dengue fever: a swarm platform simulation approach. In: Proceedings of the 2010Spring Simulation Multiconference on - SpringSim '10. New York, NY: ACM Press (2010). doi: 10.1145/1878537.1878540
22. Miksch F, Jahn B, Espinosa KJ, Chhatwal J, Siebert U, Popper N. Why should we apply ABM for decision analysis for infectious diseases?-an example for dengue interventions. PLoS ONE. (2019) 14:e0221564. doi: 10.1371/journal.pone.0221564
23. Alam SJ, Meyer R, Ziervogel G, Moss S. The impact of HIV/AIDS in the context of socioeconomic stressors: an evidence-driven approach. J Artif Soc Soc Simul. (2007) 10:1–7.
24. Luo W, Katz DA, Hamilton DT, McKenney J, Jenness SM, Goodreau SM, et al. Development of an agent-based model to investigate the impact of HIV self-testing programs on men who have sex with men in Atlanta and Seattle. JMIR Public Health Surveill. (2018) 4:e58. doi: 10.2196/publichealth.9357
25. Teweldemedhin E, Marwala T, Mueller C. Agent-based modelling: A case study in HIV epidemic. In: Fourth International Conference on Hybrid Intelligent Systems (HIS'04). Kitakyushu: IEEE (2005). p. 154–9.
26. Jalayer M, Orsenigo C, Vercellis C. CoV-ABM: a stochastic discrete-event agent-based framework to simulate spatiotemporal dynamics of COVID-19. arXiv [physics.soc-ph]. (2020). doi: 10.48550/arXiv.2007.13231
27. Mahdizadeh Gharakhanlou N, Hooshangi N. Spatio-temporal simulation of the novel coronavirus (COVID-19) outbreak using the agent-based modeling approach (case study: Urmia, Iran). Inform Med Unlocked. (2020) 20:100403. doi: 10.1016/j.imu.2020.100403
28. Wilensky U. NetLogo. Center for Connected Learning Computer-Based Modeling, Northwestern University, Evanston, IL, United States. (1999). Available online at: http://ccl.northwestern.edu/netlogo/
29. Lachica ZP, Evangelio S, Diamante E, Clemente A, Peralta JM, Murao LA, et al. Trends of canine rabies lyssavirus and impact of the intensified rabies control program in Davao city, Philippines: 2006–2017. Philippine J Sci. (2019) 148:751–63.
30. Weisstein EW. Moore Neighborhood. MathWorld–A Wolfram Web Resource (2003). Available online at: https://mathworld.wolfram.com/MooreNeighborhood.html (accessed November 13, 2022).
31. Cheng C, Zhang D, Dang D, Geng J, Zhu P, Yuan M, et al. The incubation period of COVID-19: a global meta-analysis of 53 studies and a Chinese observation study of 11 545 patients. Infect Dis Poverty. (2021) 10:119. doi: 10.1186/s40249-021-00901-9
32. National Statistics Office, ICF Macro. Philippines National Demographic and Health Survey 2008: Key Findings. Calverton, MD: NSO and ICF Macro (2009). Available online at: https://dhsprogram.com/pubs/pdf/SR175/SR175.pdf (accessed October 28, 2021).
33. Miller IF, Becker AD, Grenfell BT, Metcalf CJE. Disease and healthcare burden of COVID-19 in the United States. Nat Med. (2020) 26:1212–7. doi: 10.1038/s41591-020-0952-y
34. Wong DWS, Li Y. Spreading of COVID-19: density matters. PLoS ONE. (2020) 15:e0242398. doi: 10.1371/journal.pone.0242398
35. Kupferschmidt K. Why do some COVID-19 patients infect many others, whereas most don't spread the virus at all?. Science (2020, May 19). Available online at: https://www.science.org/content/article/why-do-some-covid-19-patients-infect-many-others-whereas-most-don-t-spread-virus-all#:~:text=Individual%20patients'%20characteristics%20play%20a,virus%20receptors%20in%20their%20body.
36. Endo A, Centre for the Mathematical Modelling of Infectious Diseases COVID-19 Working Group,, Abbott S, Kucharski AJ, Funk S. Estimating the overdispersion in COVID-19 transmission using outbreak sizes outside China. Wellcome Open Res. (2020) 5:67. doi: 10.12688/wellcomeopenres.15842.2
37. Diamante E, Herrada N, Lachica ZP, Oguis GF, Alviola P IV, Mata MA. Cost optimization of the Intensified Rabies Control Program in Davao City, Philippines using linear programming. Philipp J Sci. (2021) 150:683–92. Available online at: https://philjournalsci.dost.gov.ph/images/pdf/pjs_pdf/vol150no3/cost_optimization_of_intensified_rabies_control_program_.pdf
38. Singh DR, Sunuwar DR, Shah SK, Sah LK, Karki K, Sah RK. Food insecurity during COVID-19 pandemic: a genuine concern for people from disadvantaged community and low-income families in Province 2 of Nepal. PLoS ONE. (2021) 16:e0254954. doi: 10.1371/journal.pone.0254954
39. Nathan I, Benon M. COVID-19 relief food distribution: impact and lessons for Uganda. Pan Afr Med J. (2020) 35(Suppl. 2):142. doi: 10.11604/pamj.supp.2020.35.2.24214
40. Oka T, Wei W, Zhu D. The effect of human mobility restrictions on the COVID-19 transmission network in China. PLoS ONE. (2021) 16:e0254403. doi: 10.1371/journal.pone.0254403
41. Zhou Y, Xu R, Hu D, Yue Y, Li Q, Xia J. Effects of human mobility restrictions on the spread of COVID-19 in Shenzhen, China: a modelling study using mobile phone data. Lancet Digital Health. (2020) 2:e417–24. doi: 10.1016/S2589-7500(20)30165-5
42. Jiang Y, Laranjo JR, Thomas M. Impact of COVID-19 Community Quarantines on Urban Mobility in the Philippines. Asian Development Bank (2022).
43. Rappler.com. Davao City Residents Now Only Allowed to Move Within Their “Clusters”. Rappler (2020). Available online at: https://www.rappler.com/nation/258529-davao-city-residents-clusters-coronavirus/ (accessed November 13, 2022).
44. Llemit RLG. Davao City Council passes FM Pass Ordinance. SUNSTAR (2020). Available online at: https://www.sunstar.com.ph/article/1880167/Davao/Local-News/Davao-City-Council-passes-FM-Pass-Ordinance (accessed November 13, 2022).
45. Colina AL IV. Davao to impose 8-hour curfew if allowed to shift to GCQ. MindaNews (2020). Available online at: https://www.mindanews.com/top-stories/2020/05/davao-to-impose-8-hour-curfew-if-allowed-to-shift-to-gcq/ (accessed November 13, 2022).
46. Davao City to implement lockdowns barangay ECQ during MGCQ. City Government of Davao (2020). Available online at: https://www.davaocity.gov.ph/health/davao-city-to-implement-lockdowns-barangay-ecq-during-mgcq/ (accessed November 13, 2022).
47. CDC. Overview of Testing for SARS-CoV-2, the virus that causes COVID-19. Centers for Disease Control and Prevention (2022). Available online at: https://www.cdc.gov/coronavirus/2019-ncov/hcp/testing-overview.html (accessed November 13, 2022).
Keywords: agent-based, community quarantine, COVID-19, food relief, simulation model
Citation: Yap PAG, Lachica ZP, Paras AL, Panogalinog IG, Tubay JM and Mata MA (2023) An agent-based model of COVID-19 dynamics during enhanced community quarantine: Exploring the role of food relief system in the presence of two SARS-CoV-2 variants. Front. Appl. Math. Stat. 9:1068180. doi: 10.3389/fams.2023.1068180
Received: 12 October 2022; Accepted: 20 January 2023;
Published: 16 February 2023.
Edited by:
Hyojung Lee, Kyungpook National University, Republic of KoreaReviewed by:
Angelyn Lao, De La Salle University, PhilippinesMoses Akanbi, Lagos State University, Nigeria
Copyright © 2023 Yap, Lachica, Paras, Panogalinog, Tubay and Mata. This is an open-access article distributed under the terms of the Creative Commons Attribution License (CC BY). The use, distribution or reproduction in other forums is permitted, provided the original author(s) and the copyright owner(s) are credited and that the original publication in this journal is cited, in accordance with accepted academic practice. No use, distribution or reproduction is permitted which does not comply with these terms.
*Correspondence: May Anne Mata,  bWVtYXRhQHVwLmVkdS5waA==
†Present address: Zython Paul Lachica, St. Cross College, Oxford, United Kingdom