 Md. Mulk
 Kazi Nusrat Islam
 Md. Haider Ali Biswas
- 1School of Biomedical Engineering, Western University Canada, London, ON, Canada
- 2Mathematics Discipline, Science Engineering, and Technology School, Khulna University, Khulna, Bangladesh
Tissue-mimicking materials [e.g., polyvinyl alcohol cryogel (PVA-C)] are extensively used in clinical applications such as tissue repair and tissue engineering. Various mechanical testing techniques have been used to assess the biomechanical compatibility of tissue-mimicking materials. This article presents the development of inverse finite element (FE) techniques that are solved using numerical optimization to characterize the mechanical properties of PVA-C specimens. In this study, a numerical analysis where the displacement influence factor was employed in conjunction with a linear elastic model of finite thickness was performed. In the analysis, the effects of Poisson's ratio, specimen aspect ratio, and relative indentation depth were investigated, and a novel mathematical term was introduced to Sneddon's equation. In addition, a robust optimization algorithm was developed in MATLAB that utilized FE modeling for parameter estimation before it was rigorously validated.
1. Introduction
Inverse finite element analysis is a numerical method used to characterize the material properties of soft tissues for biomedical engineering applications [1, 2]. Many techniques have been implemented previously to characterize tissue in vivo, ex vivo, or tissue-mimicking materials [3]. During the characterization process, the first-order Ogden hyperelastic model is used for estimating material properties. Many previous studies have indicated that the indentation test is an effective technique for characterizing the compressive behavior of tissue under small and large deformation loading conditions [4]. Samani et al. [5] considered tissue hyperelasticity in their indentation-based measurement technique and reported hyperelastic parameters of breast tissues. Soft tissues or tissue-mimicking materials are typically modeled as non-linear, homogeneous, isotropic, and nearly incompressible. The Ogden hyperelastic model is commonly used to capture biological tissue non-linearity. Isvilanonda et al. used the first-order Ogden constitutive model in the material characterization process, and after using an inverse problem analysis of experimental data, they obtained very good results [6–8]. A similar approach is followed in this article whereby indentation testing data are processed through an inverse FE framework to estimate tissue hyperelastic parameters. For solving the inverse problem in this article, an optimization algorithm developed in MATLAB was used where the tissue FE model was used to calculate the cost function to be minimized [9]. For the first step, FE modeling is a good candidate and has been used extensively in this article. For the second step, a cost or objective function that measures the difference between measured and model-based mechanical response is developed. With these two essential elements, the hyperelastic parameters can be calculated and optimized by iteratively refining the sought parameters with initial estimates until the cost function reaches its minimum value [10–12].
The main motivation of the article as well as the novelty of this study can be highlighted clearly in the following paragraph.
A variety of clinical procedures for assessing structural and functional damage of tissues and treating the effectiveness of tissue therapeutics are under active investigation. Therapeutics of soft tissues depend on the mechanical response of the organs and neighboring tissues. Indentation techniques can be used to probe the local mechanical properties of soft tissues and tissue mimics. The effect of relative indentation depth, aspect ratio, Poisson's ratio, and dimensionless k on the indentation response of soft tissue mimics needs to be further investigated for an improved understanding of material characterization. One way to solve this problem is mesh refinement which also verifies the convergence of stresses, but most of the mesh sensitivity cases showed divergence. Even with increasing load sharp edges form crack that makes the cylindrical indenter very unpopular. To overcome this problem, a novel approach displacement influence factor (IF) is used with Boussinesq's equation to calculate stress at any point underneath the indenter. Non-linear, hyperelastic models have been used previously to characterize sources of non-linearities (i.e., material and geometrical) in this type of problem but have presented some problems. In this study, indentation responses from cylindrical indenters are investigated using numerical methods to develop and optimize new techniques for characterizing non-linear material properties using Ogden and Mooney Rivlin's hyperelastic models.
In this article, we develop a comprehensive understanding of soft tissue characterization based on a hyperelastic model using inverse analysis. Moreover, we conduct a parametric analysis with varying material properties and examine the effectiveness of an optimization method. Sensitivity analysis was conducted for cylindrical and spherical indentation tests. Our analysis shows the effect of specimen thickness, PVA-C concentration, and freeze–thaw cycle on (μ, α).
1.1. Hyperelastic model
A hyperelastic or green-type elastic material [13–15] is a type of material that follows constitutive models where the stress–strain behavior is defined by a strain energy density function [16]. They are considered to be truly elastic as they store energy during loading and dissipate equal amounts of energy during the unloading process. These materials experience large strains that are mostly recoverable [17–19]. To define hyperelasticity, many mathematical models have been developed and different aspects of non-linear elastic material behavior have been explained [20, 21]. These types of models have been very successfully applied to soft materials and tissues.
Polyvinyl alcohol cryogel (PVA-C) samples of 5%, 10%, and 15% concentrations are modeled as soft tissue mimics to examine their non-linear material properties. Experimental force–displacement (F–D) data were used as an input parameter for the Ogden hyperelastic model.
A hyperelastic material is a type of constitutive model where the presence of a strain energy density function is assumed, and the stress–strain relationship is derived from a strain energy density function. The Ogden hyperelastic model for isotropic material can be obtained from strain as follows:
where μ, α, and K are presented as constitutive parameters, J is the determinant of the strain tensor, and λ is known as the principle stretch. For incompressible material deformation, J = 1 leads the second term in the aforementioned equation to vanish. For the first-order Ogden model, n = 1. Thus, the model will have only two unknown parameters of shear modulus (μ) and strain hardening exponent (α).
For a uniaxial compression test, the nominal stress (σ) is represented as a function of the stretch ratio λ. The first-order Ogden material model can be presented in the form as given in equation (2):
The aforementioned two equations can take only positive values. The experimental force–displacement (F–d) data are used as an input parameter for the hyperelastic model. By applying curve fitting to the experimental (σ – λ) data, the first-order Ogden parameter is extracted.
1.2. Numerical analysis
Commercial FE software package Abaqus was used to create an axisymmetric model for examining indentation. PVA-C was used as a soft tissue mimic, and a flat-ended cylindrical indenter was modeled in this simulation. The contact surface between the indenter and the soft tissue was set as frictionless. Soft biological tissue is generally considered to be incompressible [22]. For optimal numerical accuracy, high mesh density was adapted underneath the indenter, and convergence criteria were verified. Indentation tests were simulated under linear and non-linear hyperelastic model assumptions. Numerical analysis was performed by FEM using Abaqus version 6:13–4 (2013). Cylindrical indenters and rigid flat-ended cylindrical indenters were used for numerical analysis. An indenter of radius 4 mm was indented on a soft tissue-mimicking sample of PVA-C with 5%, 10%, and 15% (w/w) concentrations. The sample size was L = 19 mm and B = 12 mm. The soft tissue sample was modeled as homogeneous, isotropic, and nearly incompressible.
An axisymmetric model was developed and meshed with (CAX4RH) and (CAX3H) linear quadrilateral elements. A very fine mesh was made at the contact zone and comparatively, the coarse mesh was utilized outside the contact zone. The boundary conditions for the three sides of the sample were fixed (U1 = U2 = U3 = UR1 = UR2 = UR3 = 0), and one side is variable (U1 = U3 = UR2 = 0). During the indentation test, a 4N vertical load was applied, and the contact between the indenter and the sample was considered frictionless. The Ogden hyperelastic material model was considered for PVA-C samples undergoing the indentation test, the data of which are provided in Ref. [23]. The simulation was completed in 13 steps with a step size of 0.01. To observe the indentation responses, the hyperelastic FE model was analyzed including a sample with finite thick and infinite thickness made of PVA-C with 5% and 15% concentrations.
1.3. Numerical model setting
A two-dimensional axisymmetric cylindrical indentation model was developed by using Abaqus version 6:13–4 (2013). The Ogden first-order strain energy density function was used in the numerical simulation. In total, 7818 (CAX4RH) nodes were generated in the meshing process, as shown in Table 1.

Table 1. FE generated variable for cylindrical indentation.
An axisymmetric FE model was developed by using Abaqus, and PVA-C 5% and 15% 2FTC experimental data obtained from Ref. [23] were used as an input parameter for the first-order Ogden hyperelastic model. The load–displacement graph for both PVA concentrations is shown in Figures 1, 2.
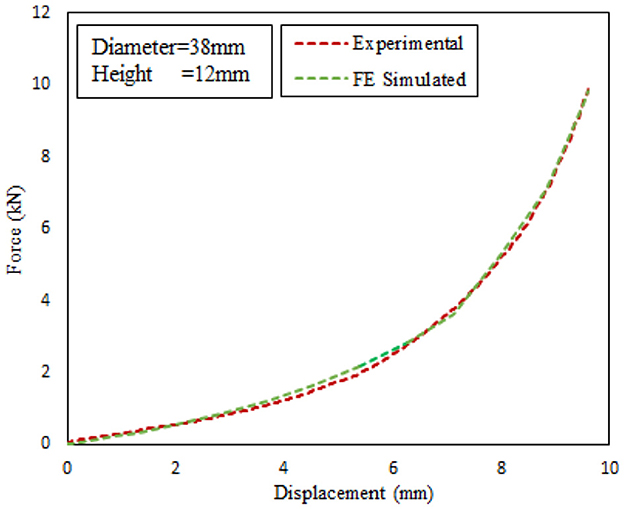
Figure 1. Load vs. displacement graph for PVA-C model with 5% concentration.
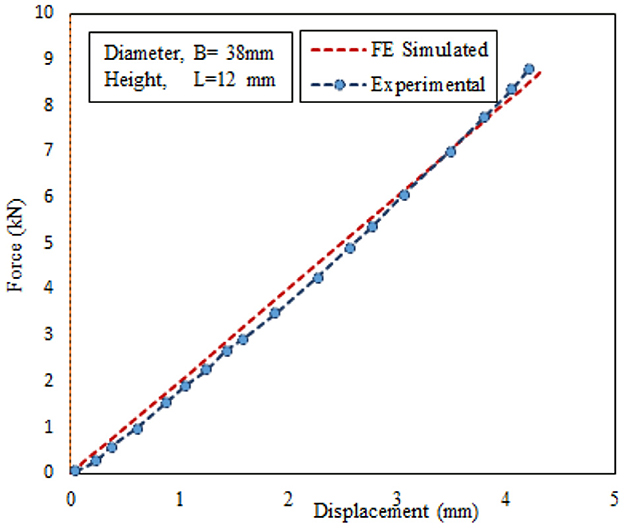
Figure 2. Load vs. displacement graph for PVA-C model with 15% concentration.
1.4. Parametric studies
Based on previous research, it has been found that the hyperelastic parameters determined using cylindrical or spherical indentation testing are not always the same as those obtained from experimental uniaxial compression tests [4, 6, 10, 20]. To investigate the sources of such disagreement, a parametric study was conducted to examine the influence of (μ, α) on the shape of the simulated data. An optimization algorithm combined with MATLAB was used to minimize the sum of the squared difference between the experimental measurements and the FE-simulated Ogden hyperelastic model. This allowed for the unknown parameters (μ, α) to be determined. A sensitivity analysis was then conducted to verify the accuracy and robustness of the parameters. For cylindrical uniaxial indentation obtained from inverse analysis shown in Table 2.
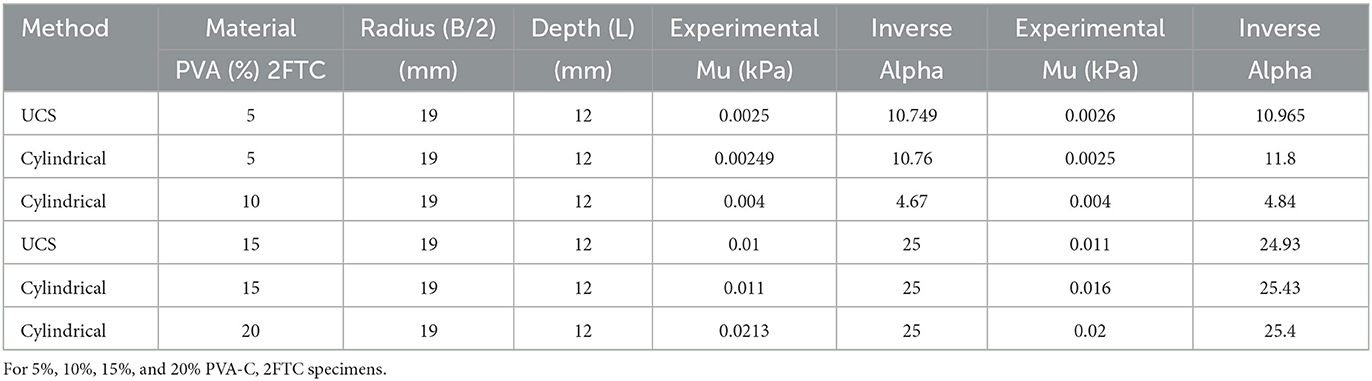
Table 2. For cylindrical and uniaxial indentation (μ, α) obtained from the inverse analysis.
1.5. Inverse finite element analysis
The inverse FE method was used to determine the hyperelastic material parameters of soft tissue specimens from indentation responses [24, 25]. Based on Hadamard's definition, an inverse problem is posed if one of the three conditions is violated: (i) existence, (ii) uniqueness, and (iii) stability. Many optimization algorithms are commonly used as such least square fitting power low, Levenberg–Marquardt (LM) Trust Region Algorithm, and Kalman Filter to solve the inverse problems.
The inverse analysis is introduced to minimize an objective function with respect to unknown constitutive material parameters (μ, α) that match the experimental data [10, 26]. The Levenberg–Marquardt (LM) method was used in this dissertation to extract the unknown parameters based on the inverse analysis. The LM method is defined as the minimization of the error function Φ with respect to a vector . The error function is represented as follows:
Here, P88 is a vector that contains unknown constitutive parameters {μ, α}, and n is the number of measurements. The vector is defined as follows:
where t* and are the model-predicted and experimental data.
1.6. Optimization algorithm: Using ogden model
A detailed flowchart of the inverse optimization process to characterize the tissue hyperelastic parameters used in the current study is shown in Figure 3.
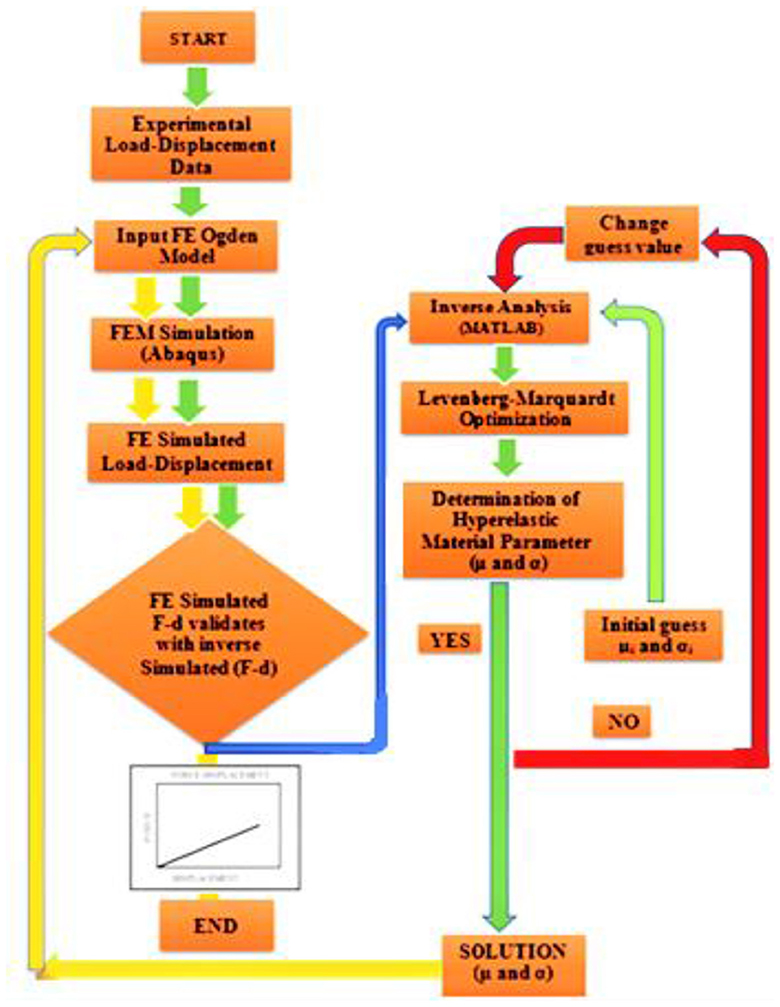
Figure 3. Flowchart of the inverse optimization process to characterize the unknown tissue hyperelastic parameters—Ogden parameter.
First, experimental (F–D) data were used as an input parameter for the numerical model (Abaqus). Simulated (F–D) data were then used as an input parameter for inverse analysis (MATLAB). An object junction was introduced to minimize the quadratic difference between simulated- and model-predicted data. Through the optimization process, a numerical convergence was achieved, and an optimized unknown parameter was obtained. These parameters were used as an input parameter of Abaqus for numerical validation.
1.7. Mesh optimization with μ and α
Although the implicit method with Newton–Raphson iterative solver is enough to obtain the converged solution, mesh optimization through adaptive meshing was adopted for numerical accuracy. Optimized μ and α through mesh convergence are shown in Figures 4, 5.
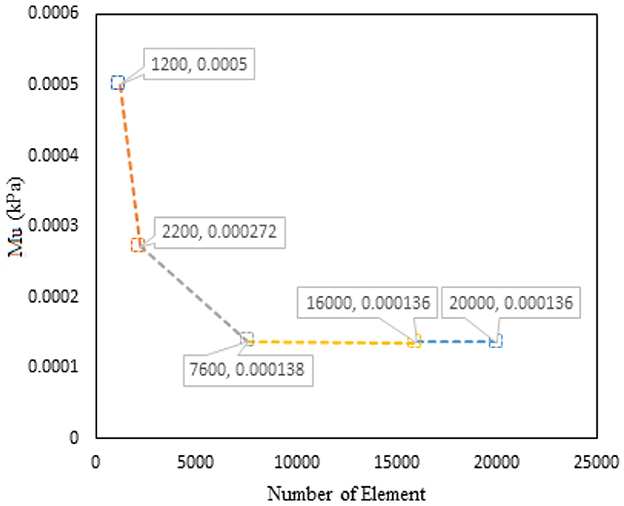
Figure 4. Graph of μ vs. number of elements for PVA-C modeled with 5% concentration and finite thickness.
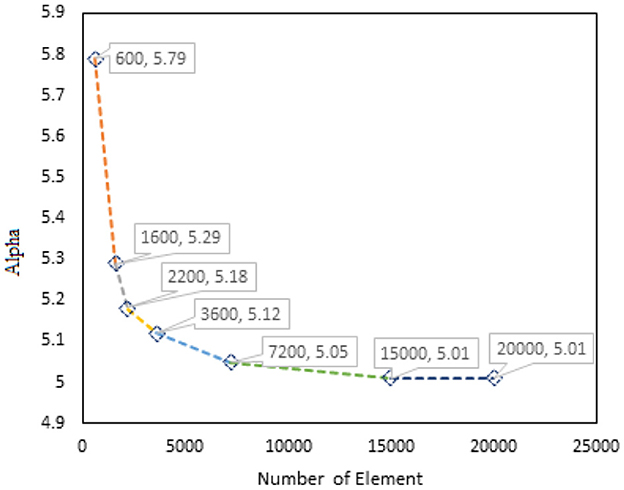
Figure 5. Graph of α vs. number of elements for PVA-C modeled with 15% concentration and finite thickness.
1.8. Identification for estimating material properties
The Ogden model is used to identify the hyperelastic material properties. The Levenburg–Marquardt (LM) algorithm was used to minimize the difference between experimental- and model-predicted data. Here, a novel approach is introduced to determine and validate material hyperelasticity. This method includes the following steps:
• Experimental data are used as input for the Ogden hyperelasticity model.
• Numerical analysis is carried out with FEM (Abaqus), and the output of the load–displacement curve is recorded.
• This load–displacement data are used as input for the Levenburg–Marquardt (LM) optimization algorithm in MATLAB.
• Initial estimate values (μ, α) are used for initializing the optimization algorithm.
• MATLABR Simulink: R2015a used @ fminsearch algorithm was used to fit the Ogden first-order hyperelastic model as shown in Equation (2). Moreover, the Levenburg–Marqardt (LM) optimization algorithm was used as shown in Equation (3). The optimized parameters (μ, α) are recorded as shown in Equation (4).
• These optimized parameters (μ, α) are inserted in FEA (Abaqus) for validation and verification of the inverse problem.
Through inverse analysis, extracted Ogden parameters are readily available to use in simulation and also to verify the stability of the solution. The detailed process is shown in the flowchart of Figure 3.
A new technique has been developed to characterize the biomechanical properties of nonlinear material using Ogden and hyperelastic models. Experimental results are compared with the novel inverse technique that can be further investigated to develop patient-specific artificial organs.
1.9. Validation exercise
FE-simulated cylindrical load–displacement data were used in the robust optimization algorithm through inverse analysis. The entire procedure is shown as a flowchart in Figure 3. A validation exercise was conducted using Ogden parameters (μ), which were varied while α was kept constant and vice versa as shown in Figures 6, 7 [10].
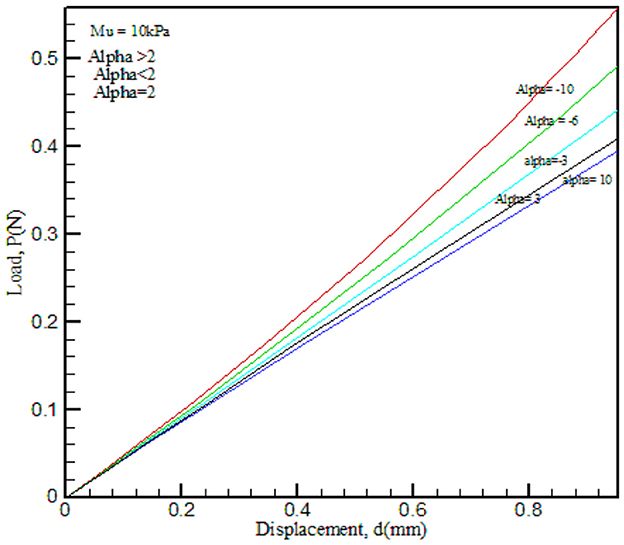
Figure 6. FE-simulated load–displacement graph for the Ogden hyperelastic model. Material property α was kept constant and μ was varied.
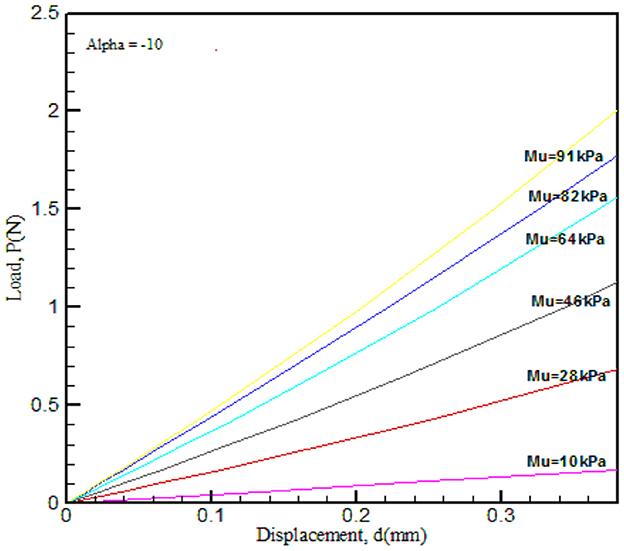
Figure 7. FE-simulated load–displacement graph for the Ogden hyperelastic model. Material property α was varied and μ was kept constant.
The results obtained from the load–displacement curve indicated that there is a significant effect of (μ), as this parameter explains the strength of the material and α is the strain hardening coefficient. In the process of validation, μ and α values were compared with that of Ref. [10] and found good agreement.
2. Results
Before conducting any surgical procedures, planning for biomaterial research, or any other fields where applicable, unique identification of material properties is essential. The accuracy, effectiveness, and robustness of such procedures need verification [3] with FE-simulated data. The performances of the novel model are illustrated in this section. In general, 5% and 15% (w/w) soft tissue mimic data [23] were used in the hyperelastic model. During the simulation, cylindrical, spherical, and uniaxial indentation tests were conducted.
The hyperelastic model was simulated in the Abaqus environment, where Ogden first-order constitutive model was used, and experimental data were fitted for parameter optimization. The indentation response from cylindrical indentation for 5% and 15% soft tissue mimics are shown in Figures 8, 9 along with optimized (μ and α) values.
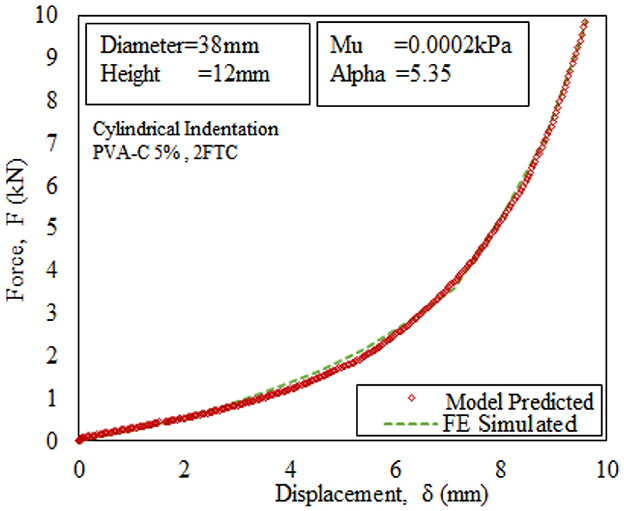
Figure 8. Load vs. displacement graph for PVA-C sample with finite thickness and 5% concentration.
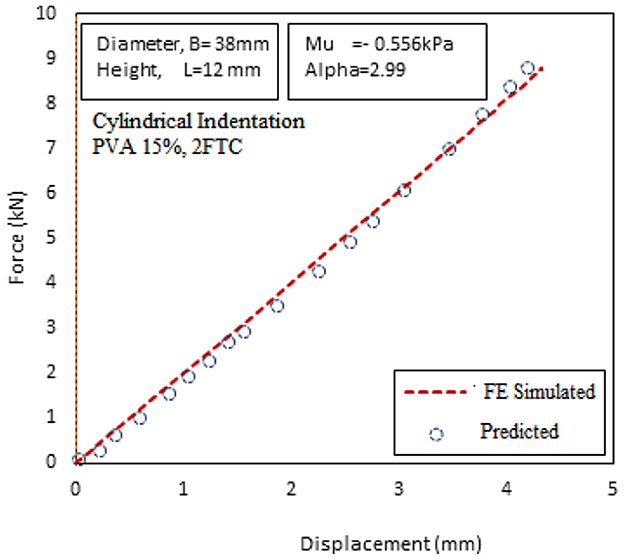
Figure 9. Load vs. displacement graph for PVA-C sample with finite thickness and 15% concentration.
Experimental data obtained from Ref [7, 23, 27] were used as an input parameter for the FE-simulated Ogden model. FE-simulated and model-predicted load vs. displacement curve for PVA-C, 2FTC5%, and 15% specimens are shown earlier. This process is used as an optimization algorithm for the determination of material properties (μ and α).
Figure 10 shows a residual–stretch graph. It is defined by the proportion of variance (R-square) between the observed and the predicted data. The FE-simulated Ogden model was used in the optimization algorithm to gain the residual–stretch results. Experimental data at a concentration of (i) PVA-C 5%, 2FTC and (ii) PVA-C 15%, 2FTC were used from cylindrical indentation.
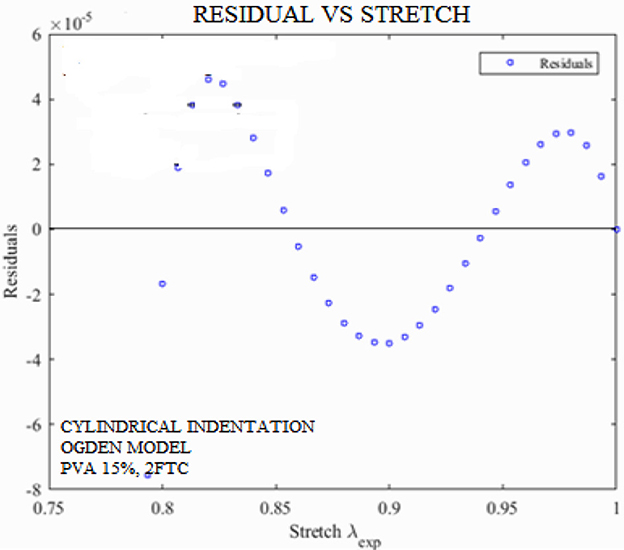
Figure 10. Residual vs. stretch graph for PVA-C samples with 15% concentration, where fitness coefficient is R2 = 0.9998.
2.1. Optimization algorithm
A detailed flowchart of the inverse optimization process to characterize the tissue hyperelastic parameters used in the current study is shown in Figure 11.
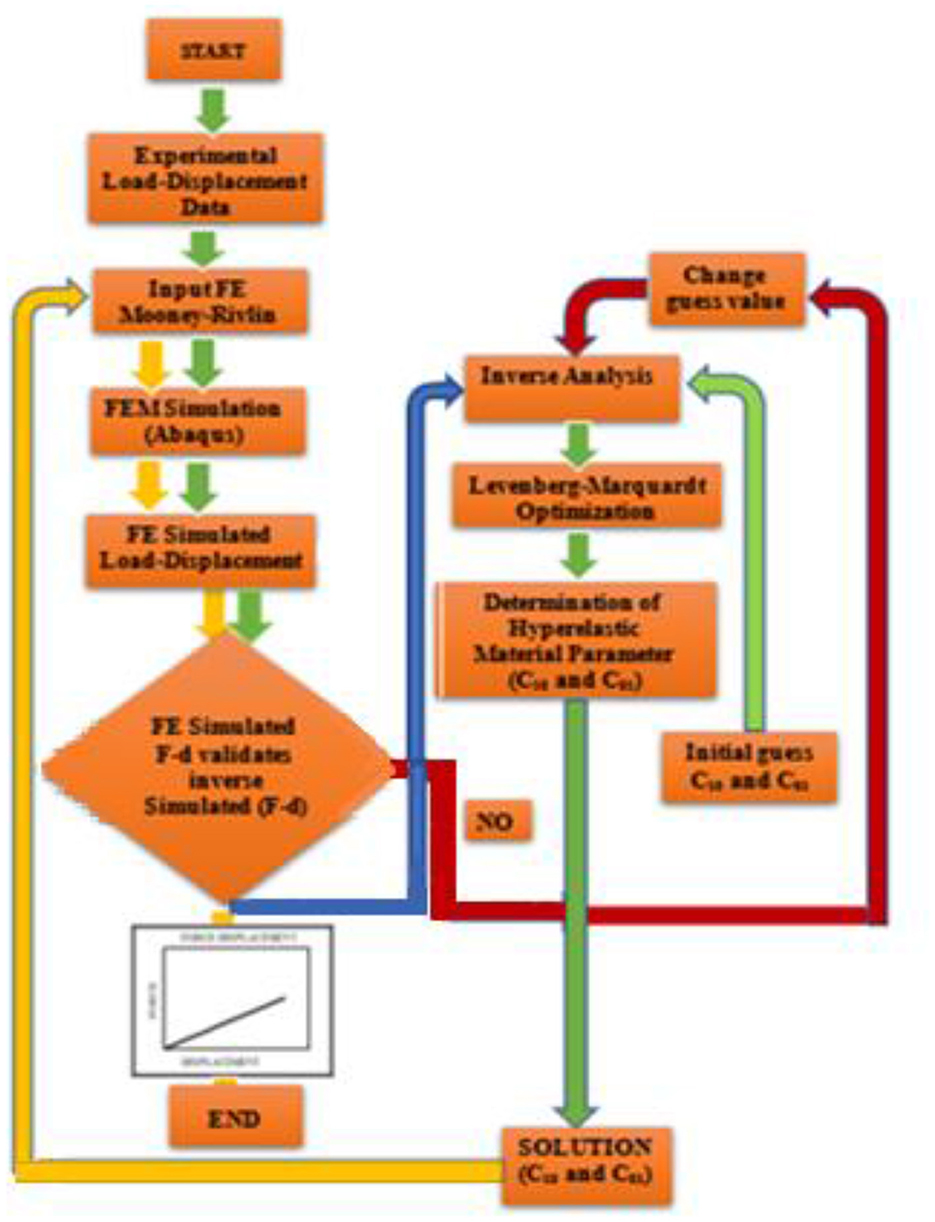
Figure 11. Flowchart of the inverse optimization process to characterize the unknown tissue hyperelastic parameters Mooney–Rivlin parameters.
First, experimental (F–D) data are used as an input parameter for the numerical model (Abaqus). Simulated (F–D) data were then used as an input parameter for inverse analysis (MATLAB). An object junction was introduced to minimize the quadratic difference between simulated and model-predicted data. Through the optimization process, a numerical convergence was achieved and an optimized unknown parameter was obtained. These parameters were used as an input parameter of Abaqus for numerical validation.
2.2. Effect of μ and α on thickness
The extracted Ogden parameters from the inverse optimization algorithm are plotted against various concentrations of PVA-C 5%, 2FTC and PVA-C 15%, 2FTC as shown in Figures 12, 13.
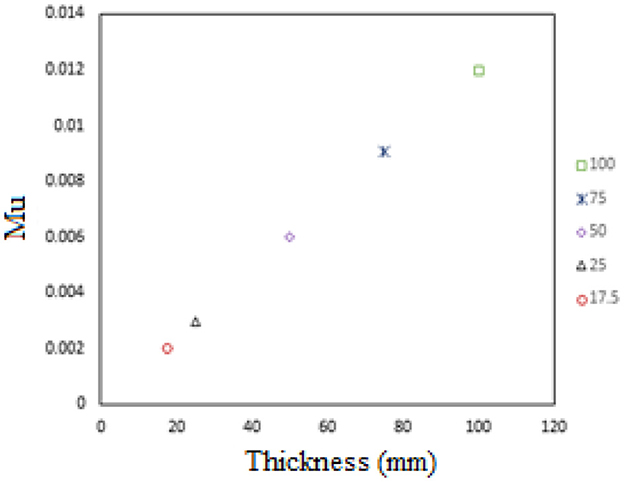
Figure 12. Graph of μ vs. various thicknesses for PVA-C 5%.

Figure 13. Graph of α vs. various thicknesses for PVA-C 5%.
It can be hypothesized that (μ, α) values have a greater dependency on thickness. As the thickness increases, both μ and α increase.
2.3. Effect of concentration
The freeze and thaw technique is a part of the stability testing that determines whether any formulation will remain stable under various conditions. The extracted Ogden parameters from the inverse optimization algorithm are plotted against concentration and freeze–thaw cycles are shown in Figures 14, 15.
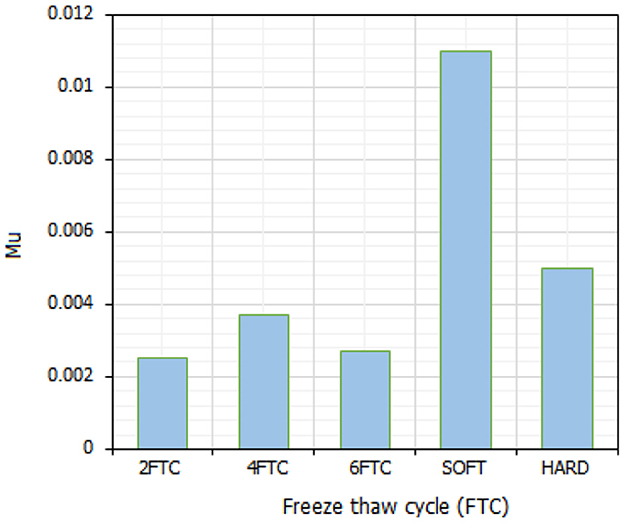
Figure 14. Graph of μ vs. various PVA-C concentrations.
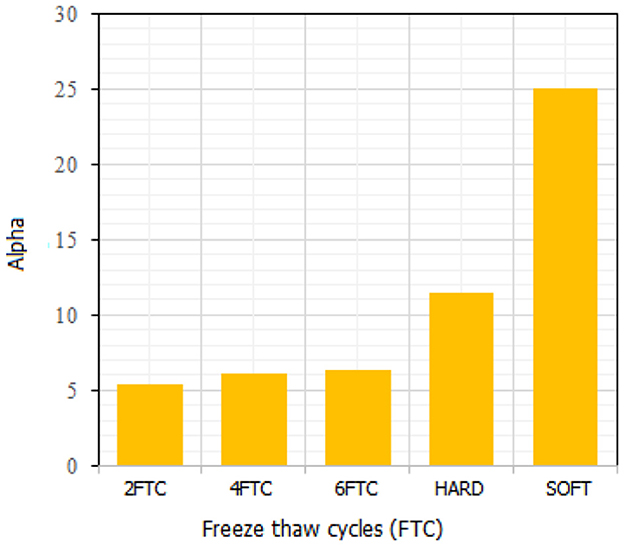
Figure 15. Graph of α vs. various PVA-C concentrations.
This led us to conclude that there is a proportional relationship between (μ, α) values and PVA-C concentration and freeze-thaw cycles. With the increase in PVA-C concentration, (μ, α) values increase. With the increase of the freeze–thaw cycle time (FTC), the values of (μ, α) also increase.
2.4. Sensitivity analysis: Cylindrical indentation
To overcome the stability problem, sensitivity analysis was conducted by adding noise (±1% and ±2 %) to the solutions. This noise modulation with the input data will enable us to investigate whether there is any extraneous influence on material and equipment. Fellay et al. [6, 13] considered this problem as another minimization approach.
After determining optimal material parameters, the sensitivity analysis of the solution was analyzed by adding noise (±1% and ±2%) to the iterative solutions. Based on Hadamard's [9] article, a solution to any inverse problem continuously depends on the stability of the data [28]. The sensitivity of the solution indicates that there was no external influence in the solution. This again proved the uniqueness of the solution.
The objective of the study was to characterize the nonlinear behavior of soft tissue phantom. The combination of the inverse method in conjunction with the FE method enables the identification of unknown material parameters. The LM optimization algorithm was used to optimize material properties by minimizing the sum of squared differences between the model-predicted and experimentally measured load–displacement data, which provided benchmarks for accurate Ogden parameters (μ, α). The accuracy, effectiveness, and robustness of such procedures were validated through FE-simulated data, which is cross-checked by the LM optimization technique and finally, compared with published results.
First, the simulated data were used as an input parameter for the MATLAB optimization algorithm. The robust optimization technique was performed as expected, which confirmed the uniqueness of the solution. Second, the Ogden parameters were plotted at various thicknesses. This proved that μ and α have a significant effect on specimen thickness. Moreover, μ and α were plotted against concentration and freeze–thaw cycles. The simulated result confirmed the dependency of μ and α on PVA concentration and freeze–thaw cycles. This means that the value of μ and α increases with the increase in concentration and freeze–thaw cycles with the little exception of PVA at higher concentrations.
R-squared values for 5% and 15% PVA-C, 2FTC were obtained through the parameter estimation techniques, and their fitness coefficients were 0.99999 and 0.9998, respectively. This led us to conclude that the optimization algorithm provided accurate results in the determination of the Ogden parameter. Finally, PVA-C 5% and PVA-C 15% have undergone a sensitivity test by adding y ± 2% noise to the solution. No extraneous effect was observed. Thus, supporting the uniqueness of the solution. This robust technique will be proposed as a “gold standard” for future biomedical research.
Finally, some perspectives and future works of this study have been summarized in the Conclusion section.
3. Conclusion
A numerical study was conducted to characterize the nonlinear mechanical properties of PVA-C. A range of PVA-C phantom data was analyzed in the numerical study. The force–displacement data were recorded and used in FEA studies for experimental data validations and material characterizations.
1. The developed finite element model (FE) can be utilized to determine the distribution of resulting stresses of linear and nonlinear elastic thin-structured materials for a given load. Since this FE model incorporates an influence factor (IF), the stress distribution could be computed up to 36% (with IF = 1, and IF = 0.637) more reliably.
2. Introduction of friction coefficient (Ω) in the developed analytical model provides up to 23% difference in magnitude of the functional parameter k used in different standard models such as Zhang's, Cao's, and Hayes' models. Thus, the proposed analytical solution can potentially provide an improved understanding of the indentation response of soft tissues.
3. The developed inverse algorithm is suitable to identify a few biomechanical properties (e.g., Ogden and Mooney–Rivlin parameters) for a new development of artificial materials (e.g., scaffolding, tissue generation, and phantoms for surgical training).
4. Overall, the finite element model, the analytical model, and the inverse algorithm developed in this study would provide an important tool in the design and characterization of soft tissue materials. In future research, this technique can be further explored to help develop patient-specific artificial organs, which can replace the need for human organ transplantations.
Data availability statement
The original contributions presented in the study are included in the article/Supplementary material, further inquiries can be directed to the corresponding author.
Author contributions
Conceptualization, methodology, and writing—original draft preparation: MM. Software and validation: MB. Writing—review and editing: MB and KI. All authors have read and agreed to the published version of the manuscript.
Acknowledgments
The authors would like to thank Rayyan Syed Kamal, Master of Science candidate in Interdisciplinary Medical Sciences at Western University, London ON, Canada, for taking the time to edit and consult the clarification of the concept mentioned in this manuscript. Kamal's knowledge of science communication proved to be an asset in this manuscript. The authors would also like to thank Maryium Mansur, Bachelor of Science in Nursing at Western University, London ON, Canada, for editing this manuscript.
Conflict of interest
The authors declare that the research was conducted in the absence of any commercial or financial relationships that could be construed as a potential conflict of interest.
Publisher's note
All claims expressed in this article are solely those of the authors and do not necessarily represent those of their affiliated organizations, or those of the publisher, the editors and the reviewers. Any product that may be evaluated in this article, or claim that may be made by its manufacturer, is not guaranteed or endorsed by the publisher.
Supplementary material
The Supplementary Material for this article can be found online at: https://www.frontiersin.org/articles/10.3389/fams.2023.1064130/full#supplementary-material
References
1. Costa KD, Yin FC. Analysis of indentation: implications for measuring mechanical properties with atomic force microscopy. J Biomech Eng. (1999) 121:462–71.
2. Di Silvestro MR, Suh JKF. A cross-validation of the biphasic poro-viscoelastic model of articular cartilage in unconfined compression, indentation, and confined compression. J Biomech. (2001) 34:519–25. doi: 10.1016/S0021-9290(00)00224-4
3. Rivlin RS, Saunders DW. Large elastic deformations of isotropic materials. VII. Experiments on the deformation of rubber. Philos Trans R Soc Lond Ser A Math Phys Sci. (1951) 243:251–88.
4. Cox MA, Driessen NJ, Boerboom RA, Bouten CVC, Baaijens FPT. Mechanical characterization of anisotropic planar biological soft tissues using finite indentation: experimental feasibility. J Biomech. (2008) 41:422–9. doi: 10.1016/j.jbiomech.2007.08.006
5. Samani A, Plewes D, A. method to measure the hyperelastic parameters of ex vivo breast tissue samples. Phys Med Biol. (2004) 49:4395–405. doi: 10.1088/0031-9155/49/18/014
6. Isvilanonda V, Iaquinto JM, Pai S, Mackenzie-Helnwein P, Ledoux WR. Hyperelastic compressive mechanical properties of the subcalcaneal soft tissue: an inverse finite element analysis. J Biomech. (2016) 49:1186–91. doi: 10.1016/j.jbiomech.2016.03.003
7. Bentout S, Chekroun A, Kuniya T. Parameter estimation and prediction for coronavirus disease outbreak 2019 (COVID-19) in Algeria. AIMS Public Health. (2020) 7:306. doi: 10.3934/publichealth.2020026
8. Sheldon MR, Fillyaw MJ, Thompson WD. The use and interpretation of the Friedman test in the analysis of ordinal-scale data in repeated measures designs. Physiother Res Int. (1996) 1:221–8.
9. Hadamard J. Lectures on Cauchy's problem in linear partial differential equations. Physiology. (1923) 14:334.
10. Fellay LS, Fasce LA, Czerner M, Pardo E, Frontini PM. On the feasibility of identifying first order ogden constitutive parameters of gelatin gels from flat punch indentation tests. Soft Mater. (2015) 13:188–200. doi: 10.1080/1539445X.2015.1059346
11. Ogden RW. Volume changes associated with the deformation of rubber-like solids. J Mech Phys Solids. (1976) 24:323–38.
12. Kauer M, Vuskovic V, Dual J, Szekely G, Bajka M. Inverse finite element characterization of soft tissues. Med Image Anal. (2002) 6:275–87. doi: 10.1016/S1361-8415(02)00085-3
13. Narayanan B, Olender ML, Marlevi D. An inverse method for mechanical characterization of heterogeneous diseased arteries using intravascular imaging. Sci Rep. (2021) 11:22540. doi: 10.1038/s41598-021-01874-3
14. Djilali S, Bentout S, Kumar S, Touaoula TM. Approximating the asymptomatic infectious cases of the COVID-19 disease in Algeria and India using a mathematical model. Int J Model Simul Sci Comput. (2022) 13:2250028. doi: 10.1142/S1793962322500283
15. Fereidoonnezhad B, Naghdabadi R, Arghavani J. A hyperelastic constitutive model for fiber-reinforcedrubber-like materials. Int J Eng Sci. (2013) 71:36–44. doi: 10.1016/j.ijengsci.2013.06.001
16. Lin YY, Hu BW. Load relaxation of a flat rigid circular indenter on a gel half space. J Non-Cryst Solids. (2006) 352:4034–40. doi: 10.1016/j.jnoncrysol.2006.07.007
17. Valero C, Navarro B, Navajas D, García-Aznar JM. Finite element simulation for the mechanical characterization of soft biological materials by atomic force microscopy. J Mech Behav Biomed Mater. (2016) 62:222–35. doi: 10.1016/j.jmbbm.2016.05.006
18. Li WH, Zhang XZ. The effect of friction on magnetorheological fluids. Korea Aust Rheol J. (2008) 20:45–50. Available online at: https://ro.uow.edu.au/engpapers/3910
19. Ali A, Hosseini M, Sahari BB. A review of constitutive models for rubber-like materials. Am J Eng Appl Sci. (2010) 3:232–9. doi: 10.3844/ajeassp.2010.232.239
20. Myers A, Chen P, Albert YL, Seki Y. Biological materials: structure and mechanical properties. Prog Mater Sci. (2008) 53:1–206. doi: 10.1016/j.pmatsci.2007.05.002
21. Holzapfel GA. Biomechanics of soft tissue. Handbook Mater Behav. (2000) 7:1–15. Available online at: https://biomechanics.stanford.edu/me338/me338_project02.pdf
22. Hirabayashi S, Iwamoto M. Finite element analysis of biological soft tissue surrounded by a deformable membrane that controls transmembrane flow. Theor Biol Med Model. (2018) 15:21. doi: 10.1186/s12976-018-0094-9
23. Zakeri M. Assessment of the Non-linear Stress–strain Characteristics of Poly(vinyl alcohol) Cryogel. Ontario: The University of Western Ontario (2017).
24. Kyriacou SK, Shah AD, Humphrey JD. Inverse finite element characterization of nonlinear hyperelastic membranes. ASME J Appl Mech. (1997) 64:257–62.
25. Soufiane B, Touaoula TM. Global analysis of an infection age model with a class of nonlinear incidence rates. J Math Anal Appl. (2016) 434:1211–39. doi: 10.1016/j.jmaa.2015.09.066
26. Gamonpilas C, Charalambides MN, Williams JG, Dooling PJ, Gibbon SR. Predicting the mechanical behavior of starch gels through inverse analysis of indentation data. Appl Rheol. (2010) 20:1–9. doi: 10.3933/ApplRheol-20-33283
27. Bentout S, Tridane A, Djilali S, Touaoula TM. Age-structured modeling of COVID-19 epidemic in the USA, UAE and Algeria. Alexand Eng J. (2021) 60:401–11. doi: 10.1016/j.aej.2020.08.053
Keywords: indentation, soft tissue, non-destructive, PVA-C, construct, isotropy, optimization, finite element modeling
Citation: Mulk M, Islam KN and Biswas MHA (2023) Modeling and numerical analysis for mechanical characterization of soft tissue mechanism applying inverse finite element technique. Front. Appl. Math. Stat. 9:1064130. doi: 10.3389/fams.2023.1064130
Received: 07 October 2022; Accepted: 07 March 2023;
Published: 06 April 2023.
Edited by:
Salih Djilali, University of Chlef, AlgeriaReviewed by:
Soufiane Bentout, Centre Universitaire Ain Temouchent, AlgeriaFethi Souna, University of Sidi-Bel-Abbès, Algeria
Copyright © 2023 Mulk, Islam and Biswas. This is an open-access article distributed under the terms of the Creative Commons Attribution License (CC BY). The use, distribution or reproduction in other forums is permitted, provided the original author(s) and the copyright owner(s) are credited and that the original publication in this journal is cited, in accordance with accepted academic practice. No use, distribution or reproduction is permitted which does not comply with these terms.
*Correspondence: Md. Haider Ali Biswas, bWhhYmlzd2FzQHlhaG9vLmNvbQ==