 Ksenia Zlobina
 Jiahao Xue
 Marcella Gomez
94% of researchers rate our articles as excellent or good
Learn more about the work of our research integrity team to safeguard the quality of each article we publish.
Find out more
ORIGINAL RESEARCH article
Front. Appl. Math. Stat., 22 February 2022
Sec. Mathematical Biology
Volume 8 - 2022 | https://doi.org/10.3389/fams.2022.791064
This article is part of the Research TopicDynamical Systems, PDEs and Networks for Biomedical Applications: Mathematical Modeling, Analysis and SimulationsView all 18 articles
Wound healing consists of a sequence of biological processes often grouped into different stages. Interventions applied to accelerate normal wound healing must take into consideration timing with respect to wound healing stages in order to maximize treatment effectiveness. Macrophage polarization from M1 to M2 represents a transition from the inflammatory to the proliferative stage of wound healing. Accelerating this transition may be an effective way to accelerate wound healing; however, it must be induced at the appropriate time. We search for an optimal spatio-temporal regime to apply wound healing treatment in a mathematical model of wound healing. In this work we show that to maximize effectiveness, treatment must not be applied too early or too late with respect to peak inflammation. We also show that the effective spatial distribution of treatment depends on the heterogeneity of the wound surface. In conclusion, this research provides a possible optimal regime of therapy that focuses on macrophage activity and a hypothesis of treatment outcome to be tested in future experiments. Finding optimal regimes for treatment application is a first step toward the development of intelligent algorithms for wound treatment that minimize healing time.
Delayed wound healing presents an important health-care problem. There is no decisive finding regarding the best therapy for delayed wound healing due to the variety of complications that can ensue [1]. In the case of acute wounds, a growing research area in wound healing has focused on methods to accelerate wound healing such as application of an electric field, application of stem cells, and the passive release of therapeutic molecules in so-called smart bandages [2]. Less attention has been given to the timing of any given therapy. A treatment may exert no effect or even a negative effect on healing tissues if not applied appropriately [3]. For example, certain treatments can accelerate specific stages of inflammation but have little effect on others [4, 5]. In other cases, treatment can induce toxic side-effects [6]. For this reason each treatment should be applied only at the appropriate stages of wound healing. The emergence of bioelectronic devices provides the opportunity to achieve drug delivery in a continuous and controlled fashion [7, 8].
Wound healing consists of several stages: hemostasis, inflammation, proliferation, and remodeling [9–11]. During hemostasis, a blood clot is formed to stop bleeding [12]. Inflammation begins immediately after a blood clot formation. At this time, chemokines are released to attract immune cells - neutrophils and macrophages. During the proliferative stage, angiogenesis, collagen deposition, and the formation of granulation tissue occur. The main participants in this stage are fibroblasts and anti-inflammatory macrophages. During remodeling, unnecessary blood vessels are removed, the extracellular matrix is remodeled, and tissue architecture is restored.
Wound acceleration can be achieved by shortening the duration of one or more of the wound healing stages. Determining the optimal timing for a therapy requires one to map the direct effect of the therapy on the targeted biological processes to the overall wound closure time.
Mathematical modeling in this field may help to predict optimal treatment regimes and to plan future experiments. Existing mathematical models have served to investigate different aspects/stages of wound healing [13–15]. Models of inflammation have suggested strategies to avoid chronic inflammation by control of neutrophil apoptosis and macrophage phagocytosis [16]. The model presented in Xue et al. [17] suggests a mechanism by which a deficiency in oxygen supply can limit macrophage recruitment and slow healing. The models describing production of the extracellular matrix by fibroblasts allowed researchers to investigate scar formation [18]. The role of cell migration and proliferation on wound closure was investigated in Javierre et al. [19]. Thus, we propose that a qualitative model with a proper level of abstraction can be used to predict the response of a wound to dynamic therapy.
In this study, we investigate mathematically the most effective spatio-temporal regimes for drug delivery to accelerate wound closure. In particular, we identify the effects of delivering substances that can accelerate macrophage polarization on wound closure times. Macrophage polarization modeling, to our knowledge, has been applied to several biological situations but not to wound healing [20, 21].
Macrophages play important roles at all stages of wound healing [9–11, 22]—from clearing the wound of debris by phagocytosis to maintaining cell proliferation of the tissue being repaired. Macrophages can perform various tasks due to their ability to transform into several phenotypes depending on external stimuli [23]. The most famous phenotypes are M1 (pro-inflammatory) and M2 (anti-inflammatory), identified in vitro [24]. In a wound, the set of stimuli received by macrophages is constantly changing and their phenotype undergoes a dynamic transition. The ability to regulate the macrophage phenotype and achieve a controlled time-dependent transition from the M1 phenotype to the M2 phenotype is a promising approach to accelerate wound healing [25–27]. There are several substances that can induce macrophage polarization from the pro-inflammatory to the anti-inflammatory subtype [28–30]. This type of treatment can have adverse effects if applied improperly [31, 32]. For example, a fast transition from the inflammatory to the proliferative stage may slow down the cleaning of the wound of debris (e.g., removal of harmful bacteria and damaged cells).
We focus our attention on accelerating wound closure of acute wounds. For simplicity, and to this end, we consider a simple model with only one stable state – the healthy one. That is, our model does not capture switching between chronic and normal wound healing regimes. However, in order to appropriately capture trade-offs of early treatment, we model wound debris over time, which is actively degraded by M1 macrophages. Tracking this state, we quantify wound cleaning time with the understanding that any remaining wound debris can be an indicator of prolonged inflammation and potential infection preventing wound closure. That is, wound debris should decay in a timely manner for the treatment to be realizable.
In summary, we examine wound healing time and wound debris cleaning time in response to different spatio-temporal signals inducing macrophage polarization. Overall, decoupling the different modalities of wound healing trajectories reduces complexity of the model and allows us to gain intuition for optimal treatment strategies. We find that actuation of M1–M2 polarization must be applied with care and optimal timing can depend on the duration of the treatment, time of initiation, placement of the actuator, and initial distribution of wound debris.
The timing and coordination of biological processes involved in wound healing are complex, however, many of them can be lumped into a single state [33]. A good model should contain the minimal number of variables needed to describe the process [14].
We consider a five state system, which provides an appropriate level of abstraction for our study. In order to study the effects of macrophage polarization we must make them explicit states. M1 macrophages are associated with the early stages of inflammation [11, 34] and the upregulation of M2 signals corresponds to initiation of the proliferation stage [9, 10]. The remaining states defined as wound debris, temporary tissue, and new tissue represent primary activity in early and later stages of wound healing.
Debris of both internal and external origin appear in the wound at the moment of injury, when healthy tissue is damaged. The debris activate M1 macrophages and are then removed by them.
M1 macrophages clean up debris mainly by phagocytosis [35]. Soon after that, M1 macrophages become anti-inflammatory M2 macrophages in a process called efferocytosis (M1 macrophages phagocytose apoptotic neutrophils, transforming into M2 macrophages) [36, 37]. The upregulation of M2 macrophages is associated with the end of inflammation [38] and the onset of proliferation during wound healing [10, 11].
The proliferative stage is characterized by the production of an extracellular matrix facilitated by fibroblasts and the growth of new blood vessels [39, 40]. These processes are regulated by M2 macrophages [10] and are needed to help new tissue form correctly, thus, we consider these agents as “temporary tissue” in our model.
During the remodeling stage, the extracellular matrix is remodeled and extra blood vessels are removed [39]; new healthy tissue replaces temporary tissue indicating wound closure. Here, we consider a wound where only the top epithelial layer is damaged and new tissue grows from the edge of the wound as epithelial cells proliferate and migrate inward. Thus, new tissue in our model is growing as a sheet from the wound edge [41].
These five states capture the well characterized wound healing stages and changing wound conditions inducing a biological response.
Consider a wound of radius R. Let the axis r to be directed from the wound center to the edge (Figure 1A). Concentrations of substances and populations of cells are functions of r. A schematic of the interaction between the modeled biological processes including macrophage participation in wound healing is shown in Figure 1B.
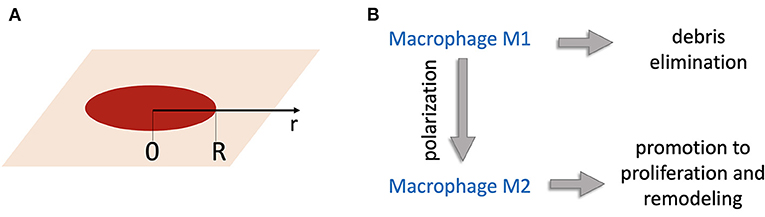
Figure 1. (A) Geometry of the model: the r-axis is directed from the wound center; R is the wound radius. (B) Schematic of the model of wound healing. Wound debris Db attract M1 macrophages that remove debris. M1 macrophages become M2 macrophages, which induce production of temporary tissue C that helps new tissue N to grow.
Db is wound debris consisting of damaged cells and bacterial cells promoting infection. We assume the wound debris to be non-active and only eliminated by M1 macrophages:
where M1 is the population of M1 macrophages, which are attracted by debris (k2Db) and removed in the reactions corresponding to debris elimination (k1DbM1), macrophage polarization , and natural death (kd1M1). Spatial migration of macrophages is described by a classical diffusion term [42]. Thus, the dynamics of M1 macrophages are described by the following equation:
where the diffusion is written in a cylindrical coordinate system. M2 is the population of M2 macrophages whose dynamics are driven by M1 polarization , their death rate (−kd2M2), and migration as follows:
Proliferation is a complex process involving fibroblasts. The extracellular matrix (ECM) formation and its partial destruction is controlled by a complex coordination of enzymes [39, 40]. This finely tuned system supporting new tissue growth has been modeled in several works [18, 43, 44]. Here, we use a simplified model of proliferation. The temporary tissue variable C represents the temporarily formed ECM and active enzymes. Temporary tissue production is induced by M2 macrophages (k5M2) and is destroyed thereafter (−krC). The dynamics are described by the following equation:
The state C is an intermediate state leading to the growth of new healthy tissue, N. To model growth of new healthy tissue, we assume that the top layer of the skin, the epithelium, grows as a sheet from the edge of the wound [41]. Epithelial cells divide, but this process slows down if there are too many cells. Thus, the epithelial growth velocity is described as N(1 − N). If the amount of new tissue reaches N = 1 it does not grow any more. New tissue cells can migrate to adjacent areas with a migration rate Dn that is much slower than that of macrophages. The equation is known in the theory of nonlinear dynamical systems as the Fisher-Kolmogorov equation [45], and its solution can be represented as a running wave [42]. However, this is possible only in the presence of temporary tissue, so the rate of new tissue growth is proportional to C. The dynamics of new tissue are described by the following equation:
In order to reduce the number of parameters, we reparameterize the model by introducing new variables:
where T and L are characteristic time and length scales. The system of equations in the reparameterized form is:
where , , k = Kk1T. The parameter values used in numerical simulations are listed in Table 1.
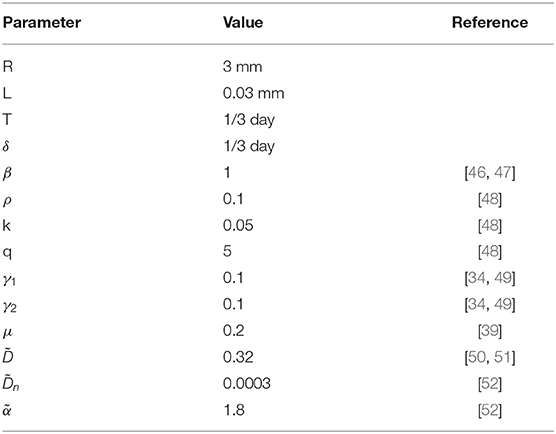
Table 1. The values of parameters used in numerical simulations.
We assume a time scale of 8 h and a spatial scale of 0.03 mm. For β the rate of attraction of macrophages by debris/pathogen was reported in Hau et al. [46] as 1/day and in Andersson et al. [47] as 0.5/day. We set β = 1. The degradation rate of macrophages varies in literature from 0.014/h [34] to 0.12/h [49]. We accept the values γ1 = γ2 = 0.1. We select parameters k, q and ρ such that M1 and M2 dynamics agree with those found in Du et al. [48]. The value of μ was set such that temporary tissue is removed 3 weeks after injury [39]. The coefficient of diffusion for macrophages can be deduced from cell migration experiments. In Wheeler et al. [51], the mean displacement of cells on plastic was 20-30 μm in 6.5 h, giving the estimate for the diffusion coefficient [50] =0.27 − 0.61. We assume .
Finally, the parameters and were selected in such a way that complete wound closure was observed by day 14, while no changes in wound closure were observed in the first 2 days as is consistent with some experiments [52]. The sensitivity analysis of the model to variations in parameters is shown in Supplementary Figures S5, S6.
The initial conditions are:
We assume zero-flux boundary conditions for macrophages on the right and left boundaries of the considered region:
New tissue is assumed to be constant at the edge of the wound and non-moving through the center of the wound:
The system of Equations (6)–(10) was solved numerically on a uniform mesh consisting of 100 spatial cells. Five equations were written in each cell, with the diffusion term approximated using a central difference scheme. The resulting system of 500 ordinary differential equations was solved in Matlab R2020a by the ode15s solver. The results of wound healing model simulations are shown in Figure 2. The wound radius is measured as the distance from wound center to the location r, where n(r) > 0.95.
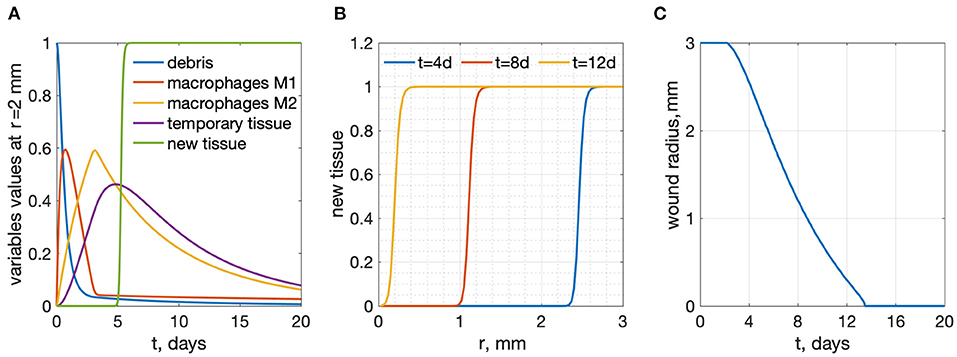
Figure 2. Results of wound healing model simulations, R = 3 mm. (A) time-dependence of all variables at a radius r = 2 mm from the wound center (B) new tissue profiles as functions of r for several time points. (C) wound radius vs. time: wound healing time is 13.47 days.
In order to investigate regimes of wound healing treatment we include actuator induced macrophage polarization into the model. This actuator is applied at a radius r = rp. We assume that the actuator delivers a biochemical at the point of application and its concentration θ is described by the following function in time and space (see Figure 3A):
where θ0 is the amplitude of the treatment controlled by the actuator. One can see that θ = θ0 at the location of the actuator, r = rp. In this work we assumed σ1 = 0.3 mm and σ2 = 0.09 mm. The treatment substance delivered affects macrophage polarization, so equations for m1 and m2 with actuators may be rewritten as follows:
In order to find the optimal regime, we test the model with impulses of actuator treatment of duration Δt beginning at time t0 (see Figure 3B):
We present a piece-wise linear function for simplicity. We assume linear growth and a decrease at the beginning and end of the signal. We tested other impulse-like shapes for actuation and found that the general behavior of the system response remained unchanged.
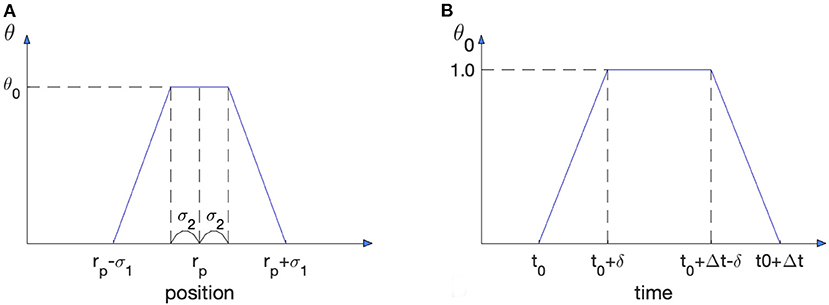
Figure 3. Spatio-temporal characteristics of treatment induced by actuation. (A) Treatment substance distribution in space. The actuator is located at r = rp. (B) Time dependence of the actuator amplitude.
We define wound healing time as the time from injury (t=0) to the moment when the wound radius reaches zero. Application of an actuator that accelerates macrophage polarization in the model decreases the time of wound healing. The results are shown in Figures 4–6.
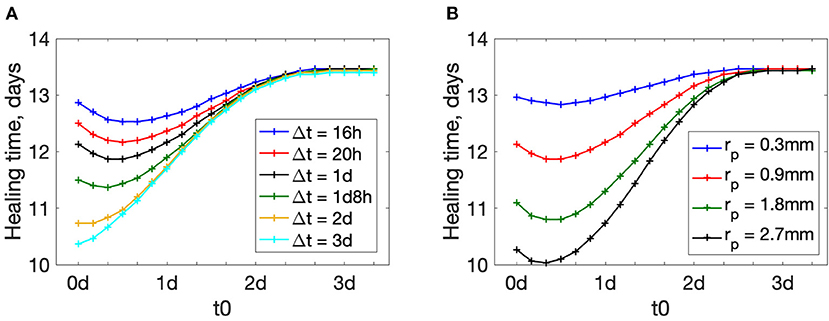
Figure 4. Wound healing time dependence on the treatment beginning time t0. (A) plots for different treatment durations Δt, rp = 0.9 mm. (B) plots for different actuator positions rp, Δt = 1 day.
The beginning time of actuation plays an important role in wound healing (see Figure 4). Large values of t0 make the treatment less effective: wound healing time increases as t0 increases. In our simulations for t0 > 3d the treatment does not have any effect: the value of healing time tends to the value of healing without treatment (13.47 days for the given set of parameters).
Interestingly, for shorter treatment durations Δt, healing time plots have a minimum away from the extremes (see plots for Δt < 2d in Figure 4A). There exists a time-window in the wound healing process when treatment is most effective. This time-window is likely characterized by some underlying biological process. If the treatment duration is short and applied early, the treatment ends before the most effective time-window is reached. This is not observed for longer treatments (Δt = 2 − 3 days) because even with early application at t0 = 0, the treatment duration overlaps with the most effective time-window for treatment.
This means that there is a non-trivial optimal treatment beginning time t0. In other words, there is a short window of time during wound healing when artificial acceleration of macrophage polarization is most effective. The plots for other actuator positions rp are shown in the Supplementary Figure S1. Similar trends are observed for different placement of the actuators.
Figure 5 shows how wound healing time depends on the duration of treatment. The longer the treatment time Δt is, the more effective it is at accelerating wound healing. However, for Δt larger than 2–3 days, wound healing time approaches a lower bound. This means that further prolongation of the treatment has minor effects. The plots for other values of rp are shown in Supplementary Figure S2. Again, we find a similar trend regardless of actuator placement.
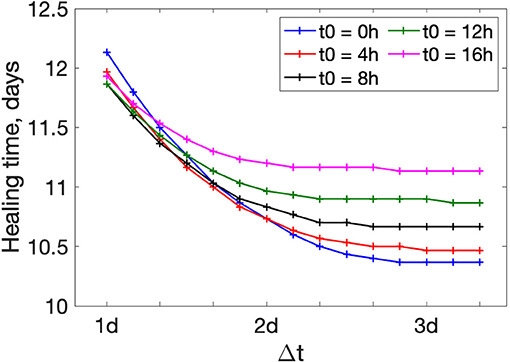
Figure 5. Wound healing time dependence of treatment duration Δt for different beginning times t0. rp = 0.9 mm.
Figure 6A shows the dependence of wound healing time on the actuator position rp. The treatment substance in this model is approximated by a piece-wise function (14) on a bounded domain. To ensure the bounded domain stays within the region of interest we constrain the actuator placement: 0.3 mm≤ r≤2.7 mm. The plots are decreasing from the wound center to the edge. This implies that an actuator located close to the wound edge is beneficial. The plots for other Δt and t0 are shown in Supplementary Figures S3, S4.
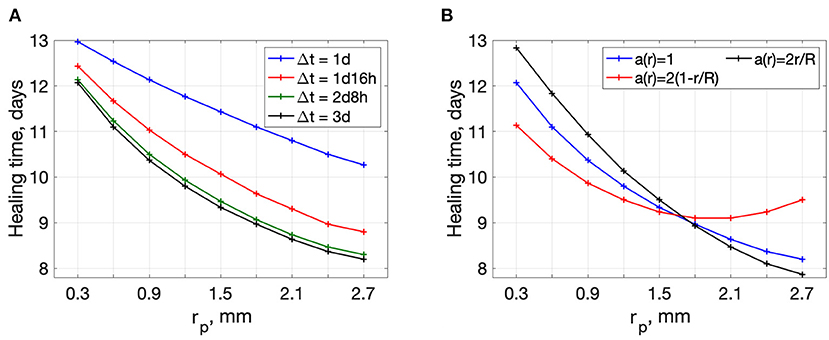
Figure 6. Wound healing time dependence on the actuator position rp. (A) plots for different treatment durations Δt, t0 = 0h (B) plots for different initial distributions of debris in the wound, t0 = 0h Δt = 3days.
The results above might be the consequence of the initial uniform distribution of the debris in the wound (see initial conditions). We provide additional simulations with debris accumulation in the center and at the edge of the wound. Alternative initial conditions for the debris variable take the following form:
and
Wound healing time dependence on rp for the three different types of initial conditions on debris distribution is shown in Figure 6B. One can see that debris distribution in the wound bed affects the dependence of healing time on actuator placement.
For the case a(r) = 2r/R, there is more debris on the edge. If the actuator is placed near the edge, we can get much shorter healing times. For the case 2(1 − r/R) (more debris in the wound center), there exists an optimal position of the actuator away from the edge (rp ≈ 1.8 mm). One can see that the optimal actuator position is sensitive to the distribution of the debris in the wound. Debris distribution cannot be estimated in the framework of this rough modeling and must be investigated experimentally.
Figure 7 demonstrates the limitations of treatment regimes. In addition to wound healing time, we define the wound cleaning time for debris removal. Because debris is a diminishing variable in our model, it tends to zero as time goes to infinity. We define wound cleaning time as the time when the maximal value of debris across the wound bed falls below a small threshold 0.025:
Because the treatment applied in this model accelerates M1 to M2 transition, it not only accelerates the proliferation-remodeling stages but removes M1 cells performing debris removal. Too large application of this treatment can make debris removal too slow—this is the cost of accelerating the proliferative and remodeling stages. Figure 7A shows that a shorter wound healing time corresponds to a longer time required for wound cleaning or debris removal. For some scenarios, wound cleaning may take even longer than wound closure, which is physically unrealizable and indicative of complications in wound healing.
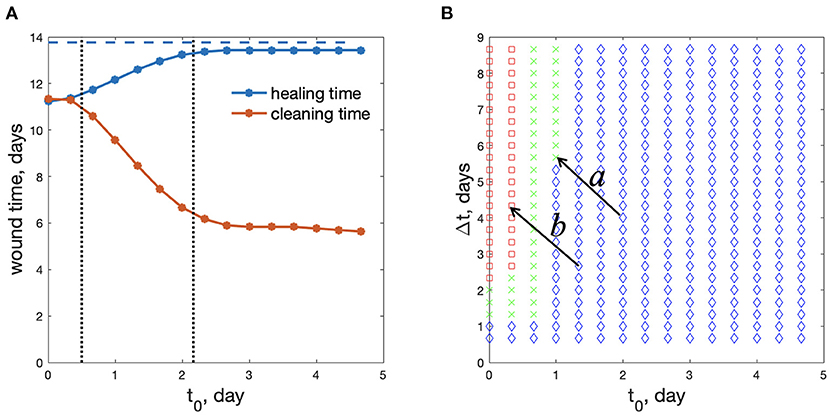
Figure 7. Optimal regimes of wound treatment. (A) wound healing time and wound cleaning time as functions of treatment beginning time, t0 (Δt = 2d8h). Blue dashed line: healing time without treatment. (B) Parametric plane for the choice of the treatment regime: green crosses – the safe and beneficial regimes of treatment; red squares – wound cleaning takes a longer time than wound healing; blue diamonds – wound healing time diminishes less than 10% in comparison with the non-treated wound (rp=0.6 mm). Arrows labeled “a” and “b” represent the same change in treatment strategy but demonstrate different outcomes due to different reference points.
We can see two main limitations of the treatment regimes, divided by vertical dotted lines in Figure 7A. The regimes with small t0 (left of the first dotted line) lead to too slow wound cleaning. Regimes with very large t0 (to the right of the second dotted line) result in insufficient improvement in wound healing. We define “insufficient” by a less that 10% reduction in wound healing time when treatment is applied. This threshold is of course arbitrary and can be chosen by the user. For reference, in Liang et al. [53], the authors demonstrated accelerated wound closure on a pig wound by applying a continuous external electric field and reduced the time for wound closure by ~12–18%. Thus, we opine that below a 10% threshold, the cost and potential side effects of applying the treatment outweigh the benefit.
Only the regimes with middle values of t0, between the vertical dotted lines in Figure 7A, shorten wound healing time sufficiently, while keeping a reasonable wound cleaning time.
Figure 7B shows these 3 types of regimes in the (t0,Δt) parametric plane. The regimes marked as red squares correspond to regimes when wound cleaning takes a longer time than wound healing, whereas blue diamonds correspond to regimes when wound healing time diminishes less than 10% in comparison with a non-treated wound. Green crosses represent the effective regimes of wound treatment. We find that the treatment should be applied between 0 and 1 days. Applying treatment past 1 day in all scenarios does not significantly reduce the wound healing time, hence, the treatment is ineffective. We note that in our simulations, M1 macrophage activity, which is associated with inflammation, peaks at around 24 h. Thus, we may hypothesize that treatment is best applied shortly after or just shy of peak inflammation, thereby, accelerating the transition from the inflammatory state to the proliferative state. Applying treatment too early can result in chronic wounds given a less than reasonable time is provided for inflammation, a stage in wound healing critical for preventing infections.
Of course, one can choose more stringent conditions for optimal regimes (maybe 10% healing time improvement is not enough, or the threshold in the condition (20) should be smaller. Some variants of other threshold selections are shown in Supplementary Figure S7). Among all the regimes presented in Figure 7B the smallest healing time (11.37 days) is observed for the treatment regime t0 = 8 h and Δt = 2 days 8 h. This reduces wound healing time by approximately 2 days. In practical situations there might be additional constraints on the duration of treatment, or maximum concentration that is not considered here. However, our model demonstrates the principles of wound treatment regime optimization.
To our knowledge, the mathematical model presented here is the first one that considers the role of macrophage polarization explicitly in wound healing. The model takes into account the presence of two types of macrophages in the wound—M1 and M2. It is believed that in addition to these primary subtypes, there are several other subtypes of macrophages. All subtypes of macrophages were found in vitro as a result of identifying corresponding activating stimuli. The exact subtypes of macrophages in wounds have not been established and are considered to be roughly similar to those found in vitro. It is most likely that macrophages of different types can be present in the wound simultaneously. However, the functions that these macrophages perform are more important for the healing process than the markers found in vitro. Therefore, in this model, we clearly divide the functions of the macrophages into inflammatory and reparative, keeping in mind that such pure cell lines may not exist in reality. This separation of functions of macrophages gave us the opportunity to draw up a rather simple naive model and identify general patterns for the effect of varying treatment regimens on wound healing time.
Admittedly, this model has its limitations. The model constructed in this work does not take into account the details of macrophages polarization due to the poor knowledge of this mechanism in vivo [34]. It is known that M2 macrophages can appear in response to stimulation by certain cytokines, for example, IL4, produced by basophils and mast cells [11]. There are indications that M1 macrophages are converted to M2 subtypes after they phagocyte apoptotic neutrophils [38]. We made a model in which the M1 population is replaced by M2 although the mechanisms of this transition in vivo are not well understood. Thus the mechanisms of polarization and their effects on timing cannot be included. Still we derive biologically meaningful results.
Our results imply that a treatment targeting macrophage polarization should not take place too early. Otherwise, M1 macrophages do not have enough time to eliminate wound debris and wound healing can be delayed. Details of this scenario is out of scope of our model. The onset of this scenario is especially important for infected wounds when the debris consists not only of damaged cells but of bacterial pathogen [54]. In the case of bacterial pathogen, the first equation in the model should include pathogen reproduction and regimes where pathogen persistence may occur. This may lead to continuation of M1 recruitment, inflammation persistence, and prevent full wound closure. On the other hand, treatment targeting macrophage polarization should not begin too late, because it becomes ineffective and toxic side effects are unknown.
The model can still be used to guide experiments. The parametric plane of treatment regimes in the (t0, Δt) coordinate plane (Figure 7B) may serve as a first approximation for planning wound treatment strategies. Although the boundaries separating the three regimes in Figure 7B may shift across experiments, we might expect the general pattern to hold. For example, if an experimentally tested treatment regimen is found to not shorten healing time to a desirable extent, then the implication is that the domain of actuation is in the blue region of Figure 7B. A reasonable choice for the next strategy is to decrease t0 and increase Δt with the goal of shifting the system from the blue to green region (arrow a in Figure 7B). However, if the new regimen leads to complications in the inflammatory stage, this implies the shift pushed the actuation domain into the red region, as shown by arrow b in Figure 7B. Having this mathematically derived parametric plane may help experimenters orient in an unknown field of regimes. The specific values of the thresholds and the corresponding shapes of the boundaries can be clarified experimentally.
We note that the geometry of the domain of actuation corresponds to a ring of a given width at a given radius. Recent advances in the design of bioelectronic devices provide the ability to deliver biochemicals with spatio-temporal precision [7]. Thus, we would like to take full advantage of these capabilities to understand the dependence of treatment effectiveness on proximity to the wound center compared to the wound edge. The lack of knowledge about debris distribution in the wound makes it difficult to predict the optimal actuator position. However, we demonstrate several possible solutions for different debris distributions in the wound. Experiments on wound treatment should be done to clarify the optimal spatial distribution of treatment actuators.
Nonetheless, the general trends for changes in wound healing times with respect to changes in actuation timing are similar for various fixed spatial profiles. The importance of considering spatial context in wound treatment remains an open question. If considering spatial information can significantly improve treatment strategies, then such numerical studies can inform future actuator design.
Wound healing consists of a sequence of stages with different cells performing different functions. Therefore, it is reasonable to assume that at each stage, different medications should be applied to improve healing. However, to our knowledge, there are not many studies of dynamic wound treatment regimens. In this work, we attempted to find the optimal wound treatment regimen by affecting macrophage polarization.
Actuating macrophage polarization for acceleration of wound healing must be done in a narrow time interval, beginning from the peak time of M1. Too early and too strong treatment of this type may slow down wound cleaning and lead to chronic inflammation. Delayed treatment may have too small of an effect. For the particular parameter values chosen here, the optimal actuating time is between 0.7 and 3.1 days. The shortest observed wound healing time was 11.37 days for a ~15.5% reduction in wound healing time. This is comparable to the results in Liang et al. [53], where time for wound closure was reduced by ~12–18%.
To our knowledge, this is the first work in search of an optimal spatio-temporal regime of wound treatment, which can be tested experimentally. We also note that we are only presenting one method of intervention. In the future, this study can be expanded to include additional intervention strategies targeting other biological processes. Thus, this naive modeling approach may help to predict optimal regimes for various treatments with known distinct actions. Combining approaches could potentially lead to unprecedented reductions in wound healing times. We believe this is the first step toward designing smart treatment and development of algorithms for smart wound healing devices.
The raw data supporting the conclusions of this article will be made available by the authors, without undue reservation.
KZ provided context and background, significantly contributed to the model, performed numerical analysis, prepared images, and wrote parts of the original draft. JX performed numerical analysis, prepared images, and parts of the original draft. MG contributed to conceptualization, supervised the work, reviewed, and edited the article. All authors contributed to the article and approved the submitted version.
Research was sponsored by the Office of Naval Research and the DARPA Biotechnologies Office (DARPA/BTO) and was accomplished under Cooperative Agreement Number DC20AC00003.
The views and conclusions contained in this document are those of the authors and should not be interpreted as representing the official policies, either expressed or implied, of the Office of Naval Research and the DARPA Biotechnologies Office (DARPA/BTO) or the U.S. Government. The U.S. Government is authorized to reproduce and distribute reprints for Government purposes notwithstanding any copyright notation herein.
The authors declare that the research was conducted in the absence of any commercial or financial relationships that could be construed as a potential conflict of interest.
All claims expressed in this article are solely those of the authors and do not necessarily represent those of their affiliated organizations, or those of the publisher, the editors and the reviewers. Any product that may be evaluated in this article, or claim that may be made by its manufacturer, is not guaranteed or endorsed by the publisher.
The Supplementary Material for this article can be found online at: https://www.frontiersin.org/articles/10.3389/fams.2022.791064/full#supplementary-material
1. Schreml S, Szeimies RM, Prantl L, Landthaler M, Babilas P. Wound healing in the 21st century. Am Acad Dermatol. (2010) 63:866–81. doi: 10.1016/j.jaad.2009.10.048
2. Kasuya A, Tokura Y. Attempts to accelerate wound healing. J Dermatol Sci. (2014) 76:169–72. doi: 10.1016/j.jdermsci.2014.11.001
3. Dreifke MB, Jayasuriya AA, Jayasuriya AC. Current wound healing procedures and potential care. Mater Sci Eng C Mater Biol Appl. (2015) 48:651–62. doi: 10.1016/j.msec.2014.12.068
4. Baron JM, Glatz M, Proksch E. Optimal support of wound healing: new insights. Dermatology. (2020) 236:593–600. doi: 10.1159/000505291
5. Ubbink DT, Brolmann FE, Go PM, Vermeulen H. Evidence-Based care of acute wounds: a perspective. Adv Wound Care (New Rochelle). (2015) 4:286–94. doi: 10.1089/wound.2014.0592
6. Murphy PS, Evans GR. Advances in wound healing: a review of current wound healing products. Plast Surg Int. (2012) 2012:190436. doi: 10.1155/2012/190436
7. Selberg J, Jafari M, Mathews J, Jia M, Pansodtee P, Dechiraju H, et al. Machine learning-driven bioelectronics for closed-loop control of cells. Adv Intell Syst. (2020) 2:2000140. doi: 10.1002/aisy.202000140
8. Mostafalu P, Tamayol A, Rahimi R, Ochoa M, Khalilpour A, Kiaee G, et al. Smart bandage for monitoring and treatment of chronic wounds. Small. (2018) 14:e1703509. doi: 10.1002/smll.201703509
9. Hesketh M, Sahin KB, West ZE, Murray RZ. Macrophage phenotypes regulate scar formation and chronic wound healing. Int J Mol Sci. (2017) 18:1545. doi: 10.3390/ijms18071545
10. Roszer T. Understanding the mysterious M2 macrophage through activation markers and effector mechanisms. Mediators Inflamm. (2015) 2015:816460. doi: 10.1155/2015/816460
11. Mosser DM, Edwards JP. Exploring the full spectrum of macrophage activation. Nat Rev Immunol. (2008) 8:958–69. doi: 10.1038/nri2448
13. Sherratt JA, Murray JD. Mathematical analysis of a basic model for epidermal wound healing. J Math Biol. (1991) 29:389–404. doi: 10.1007/BF00160468
14. Flegg JA, Menon SN, Maini PK, McElwain DL. On the mathematical modeling of wound healing angiogenesis in skin as a reaction-transport process. Front Physiol. (2015) 6:262. doi: 10.3389/fphys.2015.00262
15. Jorgensen SN, Sanders JR. Mathematical models of wound healing and closure: a comprehensive review. Med Biol Eng Comput. (2016) 54:1297–316. doi: 10.1007/s11517-015-1435-z
16. Dunster JL, Byrne HM, King JR. The resolution of inflammation: a mathematical model of neutrophil and macrophage interactions. Bull Math Biol. (2014) 76:1953–80. doi: 10.1007/s11538-014-9987-x
17. Xue C, Friedman A, Sen CK. A mathematical model of ischemic cutaneous wounds. Proc Natl Acad Sci USA. (2009) 106:16782–7. doi: 10.1073/pnas.0909115106
18. Cumming BD, McElwain DL, Upton Z. A mathematical model of wound healing and subsequent scarring. J R Soc Interface. (2010) 7:19–34. doi: 10.1098/rsif.2008.0536
19. Javierre E, Vermolen FJ, Vuik C, van der Zwaag S. A mathematical analysis of physiological and morphological aspects of wound closure. J Math Biol. (2009) 59:605–30. doi: 10.1007/s00285-008-0242-7
20. den Breems NY, Eftimie R. The re-polarisation of M2 and M1 macrophages and its role on cancer outcomes. J Theor Biol. (2016) 390:23–39. doi: 10.1016/j.jtbi.2015.10.034
21. Torres M, Wang J, Yannie PJ, Ghosh S, Segal RA, Reynolds A. Identifying important parameters in the inflammatory process with a mathematical model of immune cell influx and macrophage polarization. PLoS Comput Biol. (2019) 15:e1007172. doi: 10.1371/journal.pcbi.1007172
22. Delavary BM, van der Veer WM, van Egmond M, Niessen FB, Beelen RH. Macrophages in skin injury and repair. Immunobiology. (2011) 216:753–62. doi: 10.1016/j.imbio.2011.01.001
23. Mantovani A, Sica A, Sozzani S, Allavena P, Vecchi A, Locati M. The chemokine system in diverse forms of macrophage activation and polarization. Trends Immunol. (2004) 25:677–86. doi: 10.1016/j.it.2004.09.015
24. Mills CD, Kincaid K, Alt JM, Heilman MJ, Hill AM. M-1/M-2 macrophages and the Th1/Th2 paradigm. J Immunol. (2000) 164:6166–73. doi: 10.4049/jimmunol.164.12.6166
25. Sindrilaru A, Peters T, Wieschalka S, Baican C, Baican A, Peter H, et al. An unrestrained proinflammatory M1 macrophage population induced by iron impairs wound healing in humans and mice. J Clin Invest. (2011) 121:985–97. doi: 10.1172/JCI44490
26. Mirza RE, Fang MM, Ennis WJ, Koh TJ. Blocking interleukin-1beta induces a healing-associated wound macrophage phenotype and improves healing in type 2 diabetes. Diabetes. (2013) 62:2579–87. doi: 10.2337/db12-1450
27. Alvarez MM, Liu JC, de Santiago GT, Cha BH, Vishwakarma A, Ghaemmaghami AM, et al. Delivery strategies to control inflammatory response: modulating M1-M2 polarization in tissue engineering applications. J Control Release. (2016) 240:349–63. doi: 10.1016/j.jconrel.2016.01.026
28. Qing L, Fu J, Wu P, Zhou Z, Yu F, Tang J. Metformin induces the M2 macrophage polarization to accelerate the wound healing via regulating AMPK/mTOR/NLRP3 inflammasome singling pathway. Am J Transl Res. (2019) 11:655–68.
29. Kotwal GJ, Chien S. Macrophage differentiation in normal and accelerated wound healing. Results Probl Cell Differ. (2017) 62:353–364. doi: 10.1007/978-3-319-54090-0_14
30. Kim H, Wang SY, Kwak G, Yang Y, Kwon IC, Kim SH. Exosome-Guided phenotypic switch of M1 to M2 macrophages for cutaneous wound healing. Adv Sci (Weinh). (2019) 6:1900513. doi: 10.1002/advs.201900513
31. Goren I, Muller E, Schiefelbein D, Christen U, Pfeilschifter J, Muhl H, et al. Systemic anti-TNFalpha treatment restores diabetes-impaired skin repair in ob/ob mice by inactivation of macrophages. J Invest Dermatol. (2007) 127:2259–67. doi: 10.1038/sj.jid.5700842
32. Weagel E, Smith C, Liu PG, Robison R, O'Neill K. Macrophage polarization and its role in cancer. J Clin Cell Immunol. (2015) 6:4. doi: 10.4172/2155-9899.1000338
33. Ziraldo C, Solovyev A, Allegretti A, Krishnan S, Henzel MK, Sowa GA, et al. A computational, tissue-realistic model of pressure ulcer formation in individuals with spinal cord injury. PLoS Comput Biol. (2015) 11:e1004309. doi: 10.1371/journal.pcbi.1004309
34. Krzyszczyk P, Schloss R, Palmer A, Berthiaume F. the role of macrophages in acute and chronic wound healing and interventions to promote pro-wound healing phenotypes. Front Physiol. (2018) 9:419. doi: 10.3389/fphys.2018.00419
35. Frykberg RG, Banks J. Challenges in the treatment of chronic wounds. Adv Wound Care (New Rochelle). (2015) 4:560–82. doi: 10.1089/wound.2015.0635
36. Doran AC, A JY, Tabas I. Efferocytosis in health and disease. Nat Rev Immunol. (2020) 20:254–67. doi: 10.1038/s41577-019-0240-6
37. Landen NX, Li D, Stahle M. Transition from inflammation to proliferation: a critical step during wound healing. Cell Mol Life Sci. (2016) 73:3861–85. doi: 10.1007/s00018-016-2268-0
38. Fadok VA, Bratton DL, Konowal A, Freed PW, Westcott JY, Henson PM. Macrophages that have ingested apoptotic cells in vitro inhibit proinflammatory cytokine production through autocrine/paracrine mechanisms involving TGF-beta, PGE2, and PAF. J Clin Invest. (1998) 101:890–8. doi: 10.1172/JCI1112
39. Tracy LE, Minasian RA, Caterson EJ. Extracellular matrix and dermal fibroblast function in the healing wound. Adv Wound Care (New Rochelle). (2016) 5:119–36. doi: 10.1089/wound.2014.0561
40. Li B, Wang JH. Fibroblasts and myofibroblasts in wound healing: force generation and measurement. J Tissue Viability. (2011) 20:108–20. doi: 10.1016/j.jtv.2009.11.004
41. Zhao M, Song B, Pu J, Forrester JV, McCaig CD. Direct visualization of a stratified epithelium reveals that wounds heal by unified sliding of cell sheets. FASEB J. (2003) 17:397–406. doi: 10.1096/fj.02-0610com
43. Olsen L, Sherratt JA, Maini PK. A mathematical model for fibro-proliferative wound healing disorders. Bull Math Biol. (1996) 58:787–808. doi: 10.1007/BF02459482
44. Painter KJ. Modelling cell migration strategies in the extracellular matrix. J Math Biol. (2009) 58:511–43. doi: 10.1007/s00285-008-0217-8
45. Kolmogorov A, Petrovskii I, Piskunov N. A study of the diffusion equation with increase in the amount of substance, and its application to a biological problem. Bull Moscow Univ Math Mech. (1937) 1:1–26.
46. Hau T, Hoffman R, Simmons RL. Mechanisms of the adjuvant effect of hemoglobin in experimental peritonitis. I. In vivo inhibition of peritoneal leukocytosis. Surgery. (1978) 83:223–9.
47. Andersson U, Wang H, Palmblad K, Aveberger AC, Bloom O, Erlandsson-Harris H, et al. High mobility group 1 protein (HMG-1) stimulates proinflammatory cytokine synthesis in human monocytes. J Exp Med. (2000) 192:565–70. doi: 10.1084/jem.192.4.565
48. Du Y, Ren P, Wang Q, Jiang SK, Zhang M, Li JY, et al. Cannabinoid 2 receptor attenuates inflammation during skin wound healing by inhibiting M1 macrophages rather than activating M2 macrophages. J Inflamm (Lond). (2018) 15:25. doi: 10.1186/s12950-018-0201-z
49. Coxon A, Tang T, Mayadas TN. Cytokine-activated endothelial cells delay neutrophil apoptosis in vitro and in vivo. A role for granulocyte/macrophage colony-stimulating factor. J Exp Med. (1999) 190:923–34. doi: 10.1084/jem.190.7.923
51. Wheeler AP, Wells CM, Smith SD, Vega FM, Henderson RB, Tybulewicz VL, et al. Rac1 and Rac2 regulate macrophage morphology but are not essential for migration. J Cell Sci. (2006) 119(Pt 13):2749–57. doi: 10.1242/jcs.03024
52. Godwin A, Sharma A, Yang WL, Wang Z, Nicastro J, Coppa GF, et al. Receptor-Interacting protein kinase 3 deficiency delays cutaneous wound healing. PLoS ONE. (2015) 10:e0140514. doi: 10.1371/journal.pone.0140514
53. Liang Y, Tian H, Liu J, Lv Y, Wang Y, Zhang J, et al. Application of stable continuous external electric field promotes wound healing in pig wound model. Bioelectrochemistry. (2020) 135:107578. doi: 10.1016/j.bioelechem.2020.107578
Keywords: wound healing, mathematical model, macrophage polarization, optimal treatment regime, partial differential equations (PDE)
Citation: Zlobina K, Xue J and Gomez M (2022) Effective Spatio-Temporal Regimes for Wound Treatment by Way of Macrophage Polarization: A Mathematical Model. Front. Appl. Math. Stat. 8:791064. doi: 10.3389/fams.2022.791064
Received: 07 October 2021; Accepted: 27 January 2022;
Published: 22 February 2022.
Edited by:
Krasimira Tsaneva-Atanasova, University of Exeter, United KingdomReviewed by:
Giri Gopalan, California Polytechnic State University, United StatesCopyright © 2022 Zlobina, Xue and Gomez. This is an open-access article distributed under the terms of the Creative Commons Attribution License (CC BY). The use, distribution or reproduction in other forums is permitted, provided the original author(s) and the copyright owner(s) are credited and that the original publication in this journal is cited, in accordance with accepted academic practice. No use, distribution or reproduction is permitted which does not comply with these terms.
*Correspondence: Ksenia Zlobina, a3psb2JpbmFAdWNzYy5lZHU=
Disclaimer: All claims expressed in this article are solely those of the authors and do not necessarily represent those of their affiliated organizations, or those of the publisher, the editors and the reviewers. Any product that may be evaluated in this article or claim that may be made by its manufacturer is not guaranteed or endorsed by the publisher.
Research integrity at Frontiers
Learn more about the work of our research integrity team to safeguard the quality of each article we publish.