 Frank Schweitzer
 Giona Casiraghi
 Mario V. Tomasello1
 David Garcia
94% of researchers rate our articles as excellent or good
Learn more about the work of our research integrity team to safeguard the quality of each article we publish.
Find out more
ORIGINAL RESEARCH article
Front. Appl. Math. Stat., 10 March 2021
Sec. Dynamical Systems
Volume 7 - 2021 | https://doi.org/10.3389/fams.2021.634006
This article is part of the Research TopicTheories and Applications in Network ScienceView all 8 articles
The dynamics of collaboration networks of firms follow a life cycle of growth and decline. That does not imply they also become less resilient. Instead, declining collaboration networks may still have the ability to mitigate shocks from firms leaving and to recover from these losses by adapting to new partners. To demonstrate this, we analyze 21.500 R&D collaborations of 14.500 firms in six different industrial sectors over 25 years. We calculate time-dependent probabilities of firms leaving the network and simulate drop-out cascades to determine the expected dynamics of decline. We then show that deviations from these expectations result from the adaptivity of the network, which mitigates the decline. These deviations can be used as a measure of network resilience.
Resilience denotes the ability of a system to withstand shocks and to recover from them [1, 2]. Hence, it combines two different dimensions: robustness against shocks and adaptivity to overcome states that result from a shock [3, 4]. Interestingly, most research has only focused on the first aspect, robustness. Much less attention is paid to the second one, which is more difficult to quantify and to forecast. Therefore, in this article we aim at better understanding the adaptive capacity of systems.
One reason for the biased research interest comes from the fact that robustness is strongly related to concepts like stability which are easier to assess. However, if robustness or stability is used as a synonym for resilience [5], the temporal aspects of recovery are neglected [6, 7]. To quote Abraham Lincoln: “It’s not important how many times you fall, but how many times you get back up.” If we want to improve the resilience of systems, the solution is not to simply avoid situations that may lead to a breakdown, by increasing the robustness of a system [8]. Very often such breakdowns cannot be avoided or even controlled [9, 10]. The real problem is how to enable systems to cope with these situations and to recover from them [11, 12].
This requires us to develop a systemic view that takes the eigendynamics of a system into account [13, 14]. To address this, we need an appropriate system representation. The complex systems perspective assumes a large number of interacting system elements, denoted as agents. Such systems can be visualized as complex networks in which agents are represented by nodes and their interactions by links. In our research, we adopt this perspective to model collaboration networks in economics; i.e., nodes represent firms and link their joint activities in research and development (R&D) [15, 16].
Similar to engineered systems, many social, economic, and biological systems follow a life cycle [17, 18]. After an initial growth phase, one observes a period of maturity or saturation, which eventually leads to the decline and the decommision of the system [19]. Also collaboration networks between firms follow such a life cycle [20]. Maintaining collaborations is costly, but only through collaborations firms have access to knowledge they do not develop in-house [21]. Hence, firms will collaborate as long as they obtain a benefit from this. If the goal of the collaboration, e.g., patent development or knowledge exchange, is fulfilled, they will delete the link to the respective partner. From the life cycle perspective, the decay of the collaboration network is therefore not a sign of weakness or malfunction, but a sign of a quasinatural, even rational dynamics.
If one supposes that network growth indicates a positive and network decline a negative development, this would imply that shrinking networks are less resilient. With our study, we want to challenge such a naïve argumentation. The title phrase “fragile, yet resilient” summarizes our main finding that the system at hand even in phases of decline has the ability to respond to this development, by adaptation. This does not mean that the collaboration system completely recovers. But it is interesting to note that the decline can be stopped and the loss can be mitigated. Such a development is most often overlooked, simply because the observed dynamics is dominated by the global (negative) trend. Therefore, our aim is to detect the adaptive capability of the system and to separate it from the global trend, this way quantifying the recovery potential.
Firms with a focus on research and development (R&D) activities continuously establish new collaborations with other firms, to exchange knowledge and to leverage synergies. Because firms have to declare their R&D alliances, we have access to a large data set of more than 14.500 firms and 21.500 collaborations over a time interval of 25 years (1984–2009), covering six different industrial sections, e.g., Pharmaceuticals or Computer Hardware. The details of the data set are described in our different publications [20, 22, 23]. Figure 1 shows an example of such a collaboration network in two different years.
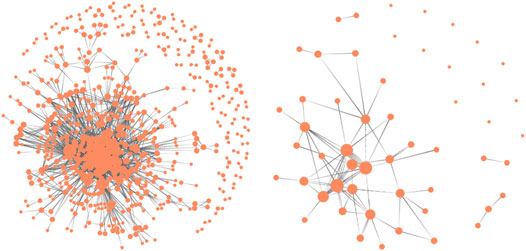
FIGURE 1. Network of R&D collaborations of firms in the sector “Communications Equipment” in 1995 (left). The right plot shows how many of the firms from 1995 are still present in 2003. The size of the nodes is determined by their degree.
An empirical investigation of the evolution of these sectoral collaboration networks has revealed a rise and fall dynamics, also illustrated in Figure 1. Two periods in the evolution of these collaboration networks have been distinguished: from 1984 to 1995, we see a steady growth of the networks, both with respect to the number of firms and the number of links. From 1995 to 2009, on the other hand, we observe that these networks continuously shrink. This holds despite the mentioned fact that firms continue to establish new alliances. But theses activities do not break the declining trend.
In the following, we seek to quantify the tendency of firms to leave. Our considerations start from the question why firms stay in a collaboration network. As other economic actors, firms try to maximize their utility, i.e., the difference between benefits and costs. Hence, firms stay as long as their benefits exceed their costs. But even if firms leave, they can still return to the network later to start new R&D collaborations with the same or with other partners.
While this dynamics seems reasonable, we have to overcome the problem that there is only data available about the starting date when firms establish a new alliance, but no data about the ending date. Thus, we first need to estimate the life time of an R&D alliance. This problem was solved in a subsequent study [24]. We have estimated that the mean life time of an R&D alliance is about 3 years. We build on this result here, assuming that the life time of an alliance is randomly drawn from a normal distribution with a mean of 3 years and a standard deviation of 1 year.
This life time estimation has enabled us to reconstruct the evolution of the collaboration network as detailed in Refs. 20 and 22. We use the starting date of each alliance and the information about its collaboration partners. Then, we sample a life time of the alliance from the mentioned distribution to determine its ending date, at which we remove all collaboration links related to that alliance. The end of an alliance does not imply that firms leave the collaboration network. In the meantime they may have used their presence to establish new alliances with other firms. Only if firms have no active alliances in a given year, they will leave. This information is aggregated for each year t.
Once we know which firms stayed and which firms left, we calculate the leaving probability p as follows. For each firm, we use a time-dependent state variable,
Our aim in this article is to estimate how the leaving probability
As a reference, we first want to estimate p for the period of network growth ending in 1995. Therefore we aggregate all data for the period from 1984 to 1995 and then do a logistic regression on the log odds (or logit),
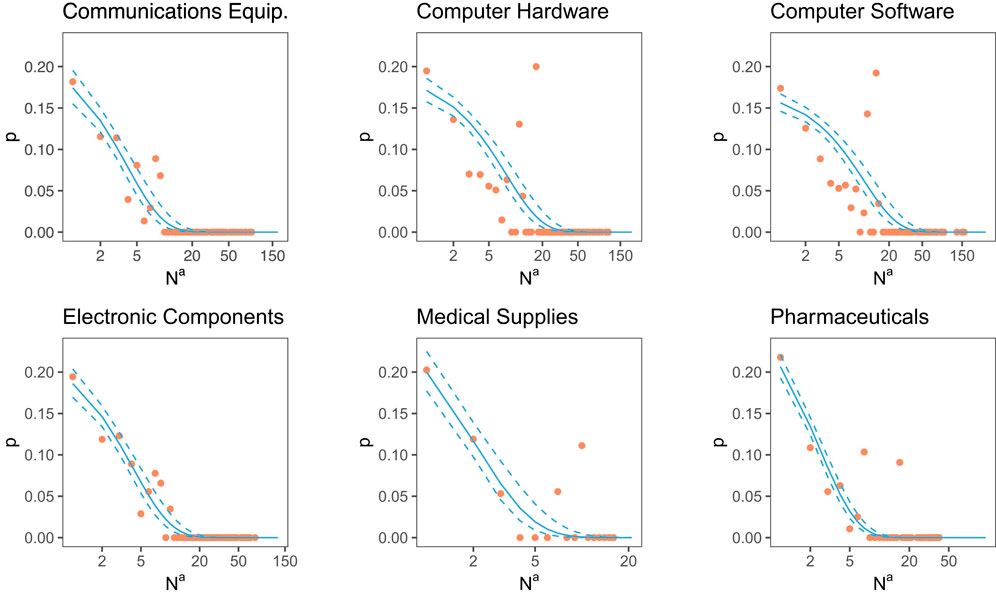
FIGURE 2. Probability of firms to leave the network as a function of the number of their active partners. Blue lines: leaving probabilities estimated as in 1 with 95% confidence intervals (dashed lines). Yellow marks: empirical proportion of nodes leaving observed in the data, as a function of their number of active partners.
We clearly see the monotonous decrease of the leaving probabilities with the number of active partners. The plotted 95% confidence intervals of the estimates indicate that the results are indeed reliable. At the same time, we also notice the differences between industrial sectors, in particular regarding the number of active partners.
Our task is now to model the cascades of firms leaving the collaboration network. We start from the network at its maximum size in 1995 and only consider firms that are present there in 1995, which we call the “class of 95” in the following. If the total number of firms in the network is
Because we lack information about leaving dates, we have to generate our empirical observations for the class of 95 from data about their new alliances and about the life time of their established alliances, as before. Firms that are no longer part of any active alliance in a given year t are assumed to leave. This way, we obtain reference data about
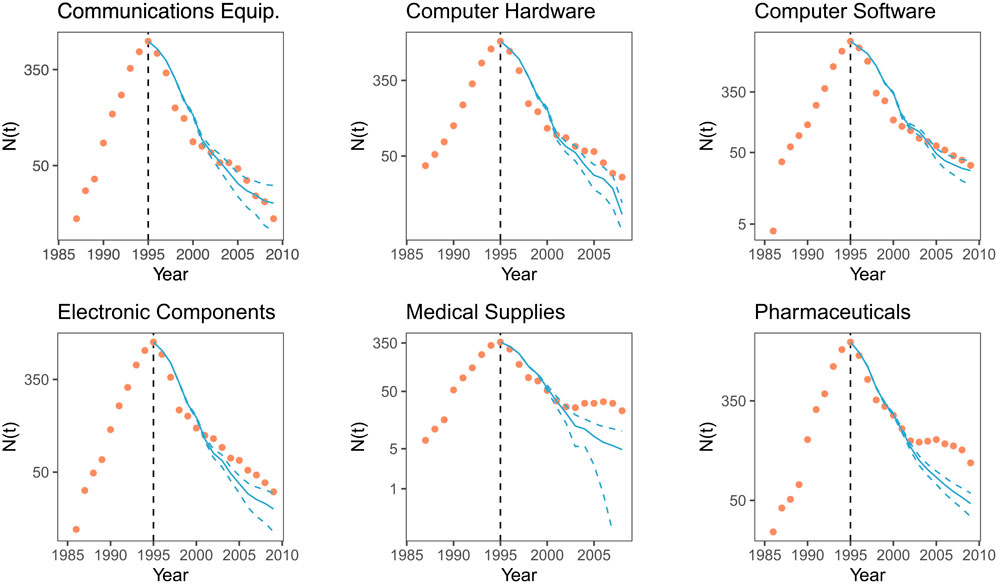
FIGURE 3. Number of firms from the class of 95 remaining in the respective collaboration network after 1995. Yellow marks: empirical observations, blue lines: predicted network size with 95% confidence intervals (dashed lines). Note the log scale of the y axis.
Now we have to compare these data with our results from simulating the cascades. Instead of the information about active alliances, we now consider the probabilities of firms to leave the network. The estimated leaving probabilities p for the different sectors shown in Figure 2 denote a lower bound because they were obtained considering the growth phase of the network. To simulate the decline of the collaboration network, we need to adjust them over time, i.e.,
We note that with this incremental update we are far from just fitting the leaving probabilities to a given year. Instead, we consider the history of the collaboration network, as well as the actual situation for firms regarding their active partners.
The regression results are shown in Figure 4 for all industrial sectors. For all years after 1995 we have plotted the differences
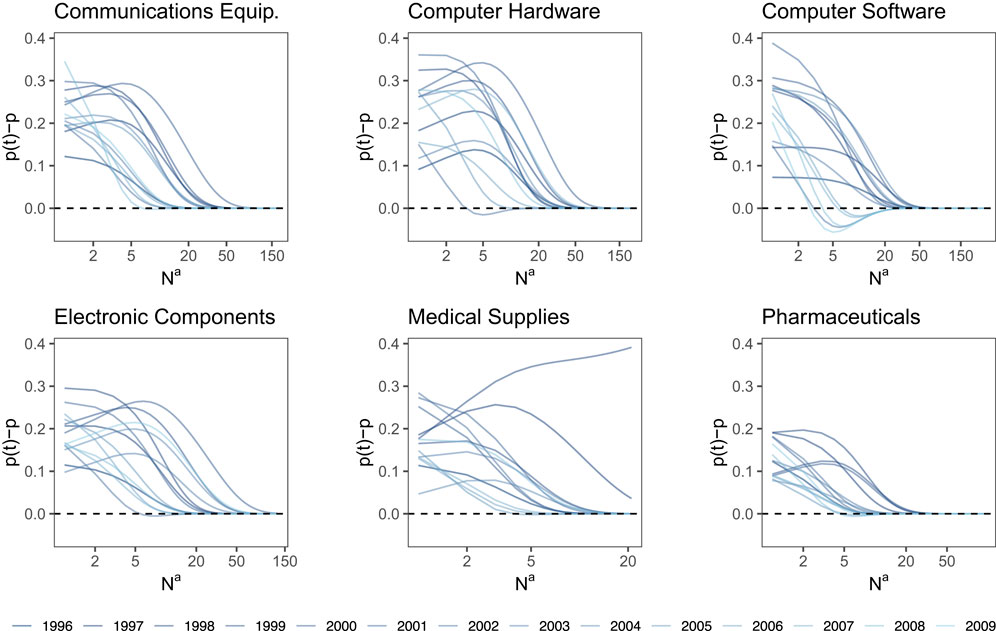
FIGURE 4. Time-dependent probability
From the results, we notice that firms with a fewer active partners are more affected by the time-dependent leaving probabilities than firms with many partners. Specifically, for firms with less than 5 active partners, the constant leaving probability underestimates their chances to leave; i.e., in reality they have left more often. Only for two sectors, Computer Hardware and Computer Software, in few years firms with 5 or more active partners leave less often; i.e., the constant leaving probability overestimates their chances to leave.
With these adjusted probabilities, we make a prediction about the network in year
Figure 3 shows both the empirical and the simulated network sizes for the six different industrial sectors. We want to point out two observations. First, it is remarkable how well our simulations of the network decay match the empirical network sizes for 4 out of 6 industrial sectors. We note that this holds irrespective of the different industrial sectors and the different sizes of the networks. Arguably, Computer Software and Electronic Components refer to very different industries and to larger or smaller collaboration networks. So, the agreement found lends evidence to the conclusion that the cascade dynamics we assumed indeed captures an essential mechanism of the observed decline.
Second, it is as interesting to note the two cases where the simulated cascade dynamics does not match the empirical decline: in Pharmaceuticals and Medical Supplies, we clearly distinguish two phases of the decline. In an earlier phase, from 1995 to 2000, our simulations still agree with the empirical sizes. But in the last phase, from 2000 to 2005, they significantly deviate from the real evolution. Our model would predict that the cascades are further amplified and even more firms from the class of 95 have left, whereas the empirical dynamics shows a remarkable stabilization. The trend toward decline is stopped, and instead the network size of the class of 95 remains almost constant until the end of the observation period.
This second observation motivates the discussion in the subsequent sections. In a first step, we want to analyze how to improve the estimates for the leaving probabilities, to better reproduce the observed network sizes for the two cases of Pharmaceuticals and Medical Supplies. In a second step, we discuss what determines these improved leaving probabilities.
What additional information do we have available to further improve the estimates for the leaving probabilities? So far, we have used only information from firms of the class of 95. But the collaboration network changes not only because of the exit of the established firms from the class of 95, but also the entry of new firms. Despite the overall “rise and fall” trend, where decline dominates after 1995, a considerable number of newcomers enter the existing networks each year. Figure 5 shows the total number of firms in the network,
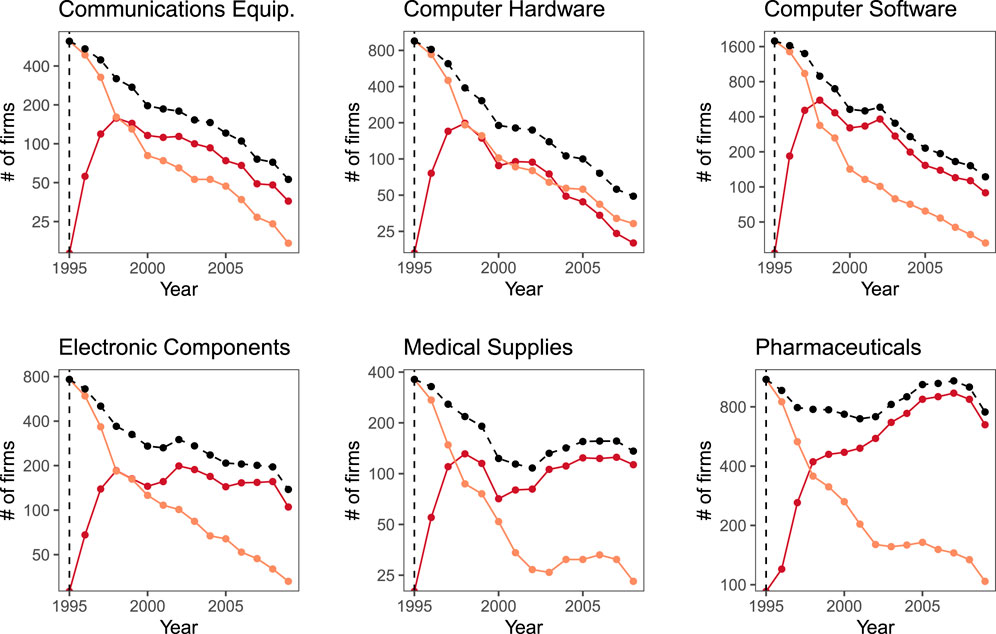
FIGURE 5. Sizes of the collaboration networks for different industrial sectors over time. Shown is the total network size
As we observe, in most sectors the total network size
We will discuss this argument in more detail in Section 4. Before that, we want to check whether information about the newcomers would allow us to improve the estimates about the leaving probabilities. We repeat the procedure to calculate
The results are shown in Figure 6. They demonstrate that with the adaptive leaving probabilities we can accurately model the network decline of the firms from the class of 95 for each year. This now holds for all industrial sectors, even for Pharmaceuticals and Medical Supplies. Thus, our cascade model with adaptive leaving probabilities that takes the impact of newcomers into account is able to reproduce the empirical network sizes.
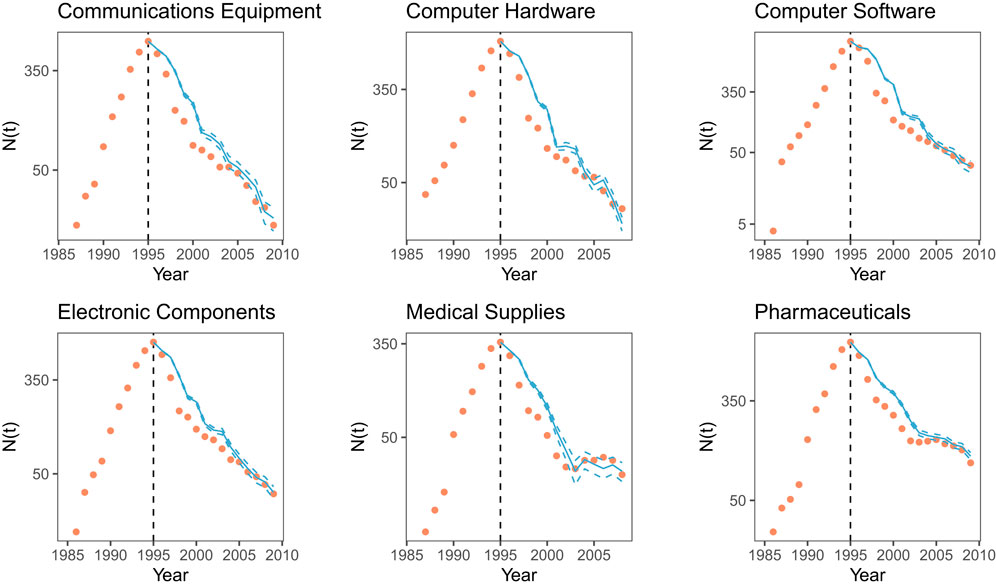
FIGURE 6. Number of firms from the class of 95 remaining in the respective collaboration network after 1995. Yellow marks: empirical observations, blue lines: predicted network size with 95% confidence intervals (dashed lines). The model has used the adaptive leaving probabilities, obtained from Eq. 2 corrected for the newcomers.
The very good agreement between the empirical and simulated network sizes shown in Figure 6 lends evidence to our methodology to estimate the leaving probabilities of firms. In particular, it supports our underlying assumption, Eq. 2, that the number of active partners is a main constituent for their decision to stay or to leave the network. But we learned that we have to correct this number to accommodate for the entry of new firms, to obtain good results.
This leaves us with the task to explain why in some cases the newcomers have such a remarkable influence. As already mentioned, we argue that these newcomers prevent the established firms from leaving the network because they provide new opportunities to collaborate and often also bring innovative knowledge to the collaboration network (startups). Instead of relying on the collaboration with established firms, the firms from the class of 95 now adapt to the situation. They form new R&D alliances with the newcomers, increasing their benefits and have no further reason to leave. Figure 7 shows two snapshots from the collaboration networks in Medical Supplies and Pharmaceuticals, to illustrate this interpretation.
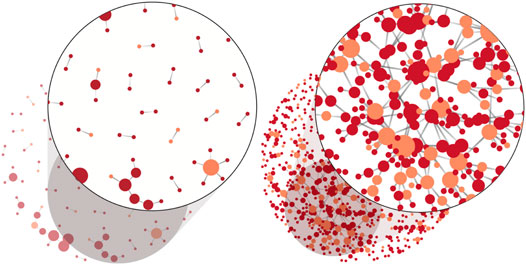
FIGURE 7. Snapshots of the collaboration networks in 2003: (left)Medical Supplies, (right)Pharmaceuticals. Orange: firms of the class of 95 and red: newcomers. The size of a node reflects its degree.
These insights can be turned into a novel argument about the resilience of networks. What we observe is the adaptive ability, or adaptivity, of established firms to cope with the new situation. Instead of following the trend to leave the network, they find new ways of leveraging the situation. This dynamics is precisely what the term resilience shall describe: the capacity to withstand shocks generated by the leave of active partners, and the ability to recover from these shocks, by establishing relations to new partners. What sounds reasonable for a personal life (and has inspired early definitions of resilience in a psychological context) can be observed also for firms, as our analysis reveals.
It is the reason for the time-dependent change of the leaving probabilities,
This leaves us with the question whether our findings could simply be reduced to the fact that newcomers enter the network. This assumes that a high entry rate would be sufficient to make a network resilient. We can refute this argument with reference to an earlier study about the “autopsy” of the social network Friendster [25]. This network collapsed despite a size of 113 million users. New users always entered the network until the very end. But it was shown that after the network has reached a size of 80 million users, more than 30 million new users still entering became less integrated into the network. Hence, what matters is not the network growth, i.e., the rate at which new nodes enter the network. Whether or not the network becomes resilient depends on the intergration of these new nodes into the network. Friendster failed in this respect and collapsed despite a steady growth.
As the two snapshots of Figure 7 and the dynamics in Figure 3 show, the R&D collaboration networks for Medical Supplies and Pharmaceuticals were successful in integrating newcomers. That’s why the established firms continued to stay. This does not mean that the network has to be as dense as for Pharmaceuticals. As we have already shown in Figure 2, each sector is characterized by a different cost-benefit relation which determines the conditions for firms to leave. In case of Medical Supplies, it is obviously sufficient that established firms start collaborating with 1-2 newcomers, whereas for Pharmaceuticals the critical number of active partners has to be higher.
To conclude, after 1995 all collaboration networks have become fragile, indicated by the global decline trend. To some degree, they are yet resilient dependent on their ability to integrate newcomers. The phrase “fragile, yet resilient” makes reference to an early study about the robustness of infrastructure networks, such as the internet, which were dubbed as “robust, yet fragile” [26]. There the term “fragile” referred to the fact that networks with a very broad degree distribution are vulnerable against the removal of nodes with a high degree. Such nodes are rare; therefore, a random removal of nodes would most likely hit one of the many nodes with a very low degree. But a targeted attack, if focused on the high-degree nodes, can easily destroy the network. This insight, however, refers to the expected properties of an ensemble of scale-free networks and cannot be applied to all individual realizations. The internet, in particular, has a low probability to occur at random. It is carefully designed for robustness and therefore much less fragile than random realizations.
A similar discussion also applies here. On the one hand, we observe cascades of firms leaving the network because they have less active partners, which in turn increases the trend. This denotes the expected behavior of a network breakdown. The double feedback that amplifies this cascade, namely, that over time more and more firms have less and less active partners for collaborations, is also known from other cascade models, e.g., from the so-called fiber bundle model [27, 28]. On the other hand, because collaboration networks are adaptive, they have in principle the ability to deviate from this expected behavior. Even more, we can turn this deviation from the expected behavior into a measure of the adaptivity of the system and, because it prevents the breakdown, as a measure of resilience.
As our results illustrate, not all collaboration networks in the different industrial sectors show this adaptive behavior to the same degree. Hence, their decline has continued as expected. We can only speculate why the networks in Medical Supplies and Pharmaceuticals seem to be more adaptive and thus more resilient. Two arguments come into play. One refers to the large number of newcomers which offer ample new opportunities. Economically, this points not only to low barriers for firms to enter the market, but also to an increased dependency of the industry on external innovations. In Pharmaceuticals, for instance, start-up firms provide a large share of new technologies, substances, etc. The second argument, however, is as important, namely, the ability of established firms to integrate these newcomers into their own R&D activities. This largely depends on legal constraints, such as compliance or protection of intellectual properties, and also on the economic pressure to exploit innovative knowledge earlier than the competitors.
With this discussion we have provided an interface toward economics, in a truly interdisciplinary manner, which can be explored in the future. But the research presented in this article also offers a general insight for network science, where studies about declining networks are still rare. Obsessed with network growth and stability, one should try to avoid the premature focus on the general trend. Decline is not a synonym for instability and a precursor of collapse. As often it is part of a life cycle dynamics, where decline should be expected rather than feared. As we have demonstrated, firms, as individuals in a social setting, have the ability to cope with this trend, making the system more resilient than expected. Hence, quantitative measures for resilient networks cannot be simply taken from the evolution of the network size. It needs a deeper reflection about the problem of resilience in face of a life cycle, which we just started to provide here.
The data analyzed in this study are subject to the following licenses/restrictions: Commercial Data Set (Thompson Reuters). Requests to access these datasets should be directed to Platinum.Data@thompson-reuters.com.
All authors conducted the research, wrote the manuscript, and discussed and approved the results. GC and MT developed the code to analyze the data and to perform computer simulations.
This work was funded by ETH Risk Center Seed Projects “Performance and Resilience of Collaboration Networks” (MT) and “Systemic Risks for Privacy in Online Interaction” (DG). MT acknowledges financial support from the ETH Risk Center (2016) and DG acknowledges financial support from the ETH Risk Center (2017).
The authors declare that the research was conducted in the absence of any commercial or financial relationships that could be construed as a potential conflict of interest.
1. Hollnagel, E, Woods, DD, and Leveson, N. Resilience engineering: concepts and precepts. Ashgate Publishing (2007).
2. Sterbenz, JPG, Hutchison, D, Çetinkaya, EK, Jabbar, A, Rohrer, JP, Schöller, M, et al. Resilience and survivability in communication networks: strategies, principles, and survey of disciplines. Comput Network (2010) 54(8):1245–65. doi:10.1016/j.comnet.2010.03.005
3. Johnson, N. Social capital and organizational resilience [PhD thesis]. University of Liverpool (2010).
4. Walker, B, Holling, CS, Carpenter, SR, and Kinzig, A. Resilience, adaptability and transformability in social-ecological systems. Ecol Soc (2004) 9(2). doi:10.5751/ES-00650-090205
5. Holling, CS. Resilience and stability of ecological systems. Annu Rev Ecol Systemat (1973) 4(1):1–23. doi:10.1146/annurev.es.04.110173.000245
7. Scheffer, M, Carpenter, SR, Lenton, TM, Bascompte, J, Brock, W, Dakos, V, et al. Anticipating critical transitions. Science (2012) 338(6105):344–8. doi:10.1126/science.1225244
8. Casiraghi, G, and Schweitzer, F. Improving the robustness of online social networks: a simulation approach of network interventions. Front Rob AI (2020) 7:57. doi:10.3389/frobt.2020.00057
9. Schweitzer, F, Zhang, Y, and Casiraghi, G. Intervention scenarios to enhance knowledge transfer in a network of firms. Front Phys (2020) 8:382. doi:10.3389/fphy.2020.00382
10. Zhang, Y, Garas, A, and Schweitzer, F. Control contribution identifies top driver nodes in complex networks. Adv Complex Syst (2019) 22(7–8):1950014. doi:10.1142/S0219525919500140
11. Lengnick-Hall, CA, and Beck, TE. Adaptive fit versus robust transformation: how organizations respond to environmental change. J Manag (2005) 31(5):738–57. doi:10.1177/0149206305279367
12. Sutcliffe, KM, and Vogus, TJ. “Organizing for resilience”, In Cameron KS, Dutton JE, and Quinn RE, editors Positive organizational scholarship: foundations of a new discipline. San Francisco: Berrett-Koeller (2003) 94–110.
13. Goggins, SP, and Valetto, G. Assessing the structural fluidity of virtual organizations and its effects. In: Socioinformatics – the social impact of interactions between humans and IT. Springer (2014). p. 121–37.
14. McManus, S, Seville, E, Brunsdon, D, and Vargo, J. Resilience management: a framework for assessing and improving the resilience of organisations. Tech. rep., Christchurch, NZ: Department of Accounting and Information Systems, University of Canterbury, Resilient Organisations Research Group (2007).
15. Koenig, MD, Battiston, S, and Schweitzer, F. Modeling evolving innovation networks. In: Innovation networks. New approaches in modelling and analyzing, understanding complex systems. Vol. 8. Berlin, Heidelberg: Springer (2009). p. 187–267.
16. Schweitzer, F, Fagiolo, G, Sornette, D, Redondo, FV, and White, DR. Economic networks: what do we know and what do we need to know? Adv Complex Syst (2009) 12(4):407–22. doi:10.1142/S0219525909002337
17. Gulati, R, Sytch, M, and Tatarynowicz, A. The rise and fall of small worlds: exploring the dynamics of social structure. Organ Sci (2012) 23(2):449–71. doi:10.1287/orsc.1100.0592
18. Powell, WW, White, DR, Koput, KW, and Owen-Smith, J. Network dynamics and field evolution: the growth of interorganizational collaboration in the life sciences. Am J Sociol (2005) 110(4):1132–205. doi:10.1086/421508
19. Saavedra, S, Reed-Tsochas, F, and Uzzi, B. Asymmetric disassembly and robustness in declining networks. Proc Natl Acad Sci USA (2008) 105(43):16466–71. doi:10.1073/pnas.0804740105
20. Tomasello, MV, Napoletano, M, Garas, A, and Schweitzer, F. The rise and fall of R&D networks. ICC – Ind Corporate Change (2016a) 26(4):617–46. doi:10.2139/ssrn.2749230
21. Vaccario, G, Tomasello, MV, Tessone, CJ, and Schweitzer, F. Quantifying knowledge exchange in R&D networks: a data-driven model. J Evol Econ (2018) 28(3):461–93. doi:10.1007/s00191-018-0569-1
22. Tomasello, MV, Perra, N, Tessone, CJ, Karsai, M, and Schweitzer, F. The role of endogenous and exogenous mechanisms in the formation of R&D networks. Sci Rep (2014) 4:5679. doi:10.1038/srep05679
23. Tomasello, MV, Vaccario, G, and Schweitzer, F. Data-driven modeling of collaboration networks: a cross-domain analysis. EPJ Data Sci (2017) 6:22. doi:10.1140/epjds/s13688-017-0117-5
24. Tomasello, MV, Tessone, CJ, and Schweitzer, F. A model of dynamic rewiring and knowledge exchange in R&D networks. Adv Complex Syst (2016b) 19:1–2. doi:10.1142/S0219525916500041
25. Garcia, D, Mavrodiev, P, and Schweitzer, F. Social resilience in online communities: the autopsy of friendster. In: COSN ′13 proceedings of the first ACM conference on online social networks. New York, NY, USA: ACM (2013). p. 39–50.
26. Doyle, JC, Alderson, DL, Li, L, Low, S, Roughan, M, Shalunov, S, et al. The “robust yet fragile” nature of the internet. Proc Natl Acad Sci USA (2005) 102(41):14497–502. doi:10.1073/pnas.0501426102
27. Kun, F, Zapperi, S, and Herrmann, HJ. Damage in fiber bundle models. Eur Phys J B-Condens Matter Complex Syst (2000) 17(2):269–79. doi:10.1007/PL00011084
Keywords: network, firms, collaboration, resilience, cascades
Citation: Schweitzer F, Casiraghi G, Tomasello MV and Garcia D (2021) Fragile, Yet Resilient: Adaptive Decline in a Collaboration Network of Firms. Front. Appl. Math. Stat. 7:634006. doi: 10.3389/fams.2021.634006
Received: 26 November 2020; Accepted: 19 January 2021;
Published: 10 March 2021.
Edited by:
Roy Cerqueti, Sapienza Università di Roma, ItalyReviewed by:
Frank Westerhoff, University of Bamberg, GermanyCopyright © 2021 Schweitzer, Casiraghi, Tomasello and Garcia. This is an open-access article distributed under the terms of the Creative Commons Attribution License (CC BY). The use, distribution or reproduction in other forums is permitted, provided the original author(s) and the copyright owner(s) are credited and that the original publication in this journal is cited, in accordance with accepted academic practice. No use, distribution or reproduction is permitted which does not comply with these terms.
*Correspondence: Frank Schweitzer, ZnNjaHdlaXR6ZXJAZXRoei5jaA==
Disclaimer: All claims expressed in this article are solely those of the authors and do not necessarily represent those of their affiliated organizations, or those of the publisher, the editors and the reviewers. Any product that may be evaluated in this article or claim that may be made by its manufacturer is not guaranteed or endorsed by the publisher.
Research integrity at Frontiers
Learn more about the work of our research integrity team to safeguard the quality of each article we publish.