 Shailesh Acharya
 Glenn Fung
95% of researchers rate our articles as excellent or good
Learn more about the work of our research integrity team to safeguard the quality of each article we publish.
Find out more
ORIGINAL RESEARCH article
Front. Appl. Math. Stat. , 10 December 2019
Sec. Mathematics of Computation and Data Science
Volume 5 - 2019 | https://doi.org/10.3389/fams.2019.00061
This article is part of the Research Topic Artificial Intelligence in Insurance and Finance View all 12 articles
For an insurance company is a priority to supply customers with an easy and streamlined way to provide all the information needed when reporting a claim or asking for a quote. A simple and efficient process to do so improves customer experience, reduces human error and accelerates the information collection process. An accurate mileage reading is a key piece of information that is relevant for auto insurance quotes and claims processing. The vehicle mileage can be combined with the License Plate number and the Vehicle Identification Number (VIN) to get a complete overview of the information needed for many insurance processes and workflows. In this paper, we describe a novel solution for extracting vehicle mileage from odometer images taken by mobile devices. There are many available low-cost commercial solutions for both License plate recognition and VIN recognition from images, however, to the best of our knowledge, this is not existing commercial solutions for odometer mileage extraction from images. Our proposed system mainly consists of two parts: (a) identifying the odometer display and, (b) extracting characters inside the display. We leverage existing state-of-the-art object detection deep learning architectures to solve each part and design a post-processing algorithm to identify mileage from the extracted characters. We tested empirically our proposed system in unseen odometer images taken in the wild. We achieve satisfactory performance that meets the requirements needed for real-life applications in the insurance industry.
In a competitive customer-driven auto insurance landscape, businesses are constantly changing the way they interact with customers to improve attraction and retention. Better customer experiences and more efficient interactions with customers lead to satisfaction which is one of the top differentiators that impact customer loyalty. Digitization and process automation allow service providers to unveil timely opportunities to offer effective and time-saving interactions to improve customer experience.
With the incorporation of more sophisticated safety features in modern cars, the increase in claim cost due to the replacement of modern devices is outpacing the decline in claim frequency. Hence, there is pressure on insurance companies to create a more effective way to handle auto claims. Filing a claim is an example of one of the few direct interactions customers have with their insurer and it comes at a time when they are under stress and will most likely appreciate a streamlined process.
However, the typical experience offered today from most insurers when you have an accident involves a process to manage the claim filing that can be slow, expensive (for the insurer) and may involve several insurance representatives. The same idea applies when a potential new customer is inquiring about a new insurance policy.
When asking for a quote for a new policy, potential customers can upload photographs that can be used for retrieving quick information about the car from their phone to a web-based app, which can be analyzed in seconds. This results in a quick and accurate quote. By reducing human error and accelerating the information collection process, we can make processes that involve customer interactions smoother, hence simplifying the policy claims ecosystem for the agent, the customer and the insurer.
Optical character recognition (OCR) is a widely researched problem in computer vision. Text extraction from scanned documents or from pictures taken under controlled lighting has seen significant improvement with the advent of deep learning architectures. However, text extraction from images in the wild is still very challenging. The general purpose OCRs do not work well for images from uncontrolled sources. In this paper, we describe a novel solution for extracting mileage readings from odometer images. In the insurance domain, especially for auto insurance quotes and claims processing, there are three key pieces of information; license plate number, odometer mileage reading and vehicle identification number (VIN). License plate recognition and VIN recognition from images are very popular problems and there exist commercial solutions for both. It is important to note that VIN recognition is a significantly easier problem since for modern cars the VIN number plates are standardized. To the best of our knowledge, few or no work has been done for odometer mileage extraction from images and there are not reliable available commercial solutions for this use-case.
There are several open source and commercial OCRs available in market such as Tesseract [1], and the built-in OCR toolbox in Matlab [2] to name a few. These OCRs systems are designed to read characters from high quality pictures taken by scanners or a camera under good lighting conditions. They use image pre-processing and character segmentation techniques that are very specific to document images. They are trained to recognize printed characters which are different from characters in a odometer display since odometer images contain huge variation in color, intensity, font, and texture. For all these reasons, these OCR systems perform poorly on odometer images. Google cloud vision API [3] is another interesting commercial option that does a better job in extracting text from images in the wild, but its performance on odometer images is nowhere close to our accuracy expectations and does not meet our performance requirements.
We divide the mileage extraction problem into two parts; identifying odometer display and extracting characters inside the display. We leveraged existing object detection architectures to solve each part and finally designed a post processing algorithm to extract mileage number. We tested two different object detection architectures Single Shot Detector (SSD)[4] and Faster RCNN [5]. Our system differs from open source OCR such as tesseract and other commercial OCRs both on the system architecture and the dataset used for training. We used hand labeled odometer pictures to train the character recognition which makes our model much more customized to odometer characters than any other OCRs. We also designed the post processing algorithm to distinguish mileage reading from other characters in odometer display such as tripmeter reading, temperature, etc.
The rest of the paper flows as follows: In section 2 we present relevant related work that uses recent machine learning techniques to extract text from pictures taken in non-restrictive environments and background on FasterRCNN and SSD object detectors. In section 3 we describe the data used to train our system which is described in detail in sections 4 (system workflow). After that, we share results derived from our empirical evaluation of the system in section 5 followed by a description of how the system is being deployed in section 6. We end the paper with conclusions and lessons learned and discuss future work in section 7.
As mentioned before, automatic license plate recognition (ALPR) is a mostly commercially solved problem. Besides traffic monitoring, this technology is used in many applications such as, highway toll collection, border and custom checkpoints, parking access control system and more recently, homeland security. The ALPR problem is similar in some aspects to our problem proposed here since most ALPR system breakdown the problem into similar sub-tasks: number plate detection, character segmentation, character recognition. Deep convolutional networks have been used recently to improve accuracy on ALPR systems [6] and in Bulan et al. [7] they propose the use of synthetically generated images to improve CNN performance while reducing the need for human labeling. A more comprehensive survey view of such system can be seen in Sanap and Narot [8], Sonavane et al. [9], and Du et al. [10].
Faster RCNNs have been successfully used to extract text from pictures taken in the wild, for example in Nagaoka et al. [11], the authors propose an architecture that takes into consideration the characteristics of texts by using multiresolution feature maps to detect texts of various sizes simultaneously. A faster RCNN approach is also used in Rosetta [12], a recently proposed scalable system to extract text from web images.
There are many recent real-world applications to detect text in images where the faster RCNN and the Single Shot Detector (SSD) architectures have been used successfully. A good representative example of such system is presented in Yang et al. [13], where the goal is to extract (detecting and recognizing) text from biomedical literature figures.
However, to best of our knowledge there is few or no work related to extracting mileage readings from odometer pictures.
Early object detectors used pyramidal sliding windows over the input image followed by an image classifier to detect objects at various location and scales. The Fast RCNN architecture introduced by Girshick [5] made significant improvement over these architectures by using selective search for region proposals and convolutional feature maps as input. Although, Fast RCNN was significantly faster than the previous architectures, the region proposal technique was still too slow for most real-time applications. Faster RCNN, introduced in Ren et al. [14], solves this problem by using a different region proposal network.
Faster RCNN can be roughly viewed as a combination of two networks: The region proposal network (RPN) and a classifier as shown in Figure 1. The RPN takes convolutional feature map inputs and outputs a set of rectangular object proposals and an objectness score for each proposal. But before that, the first step is translating the image to convolutional feature maps by passing the image through a series of convolution layers. In faster RCNN, RPN is modeled with a fully convolutional network [15]. Region proposals are generated by sliding a small sub-network over this convolutional feature map output. The sub-network looks at n × n spatial windows of input feature maps and projects it into a lower dimensional feature vector. At the end of the sub-network architecture there are two siblings fully connected layers: a box-regression layer and a box-classification layer. The regression layer outputs delta coordinates to adjust the reference anchor coordinates for each spatial window. The box-classification layer predicts the possibility of an anchor box being either background or an object. For the next stage of processing, only the anchors with high scores are retained. The second part of the faster RCNN architecture is a classifier that predicts the class label for the regions proposed by the RPN. The classifier also contains a regression layer that outputs offset coordinates to further tighten the proposed box. The output region from the RPN is passed through a ROI pooling layer to map them to a fixed shape before feeding them to the classifier. The classifier consists of a fully connected layer that outputs softmax scores across all the class labels.
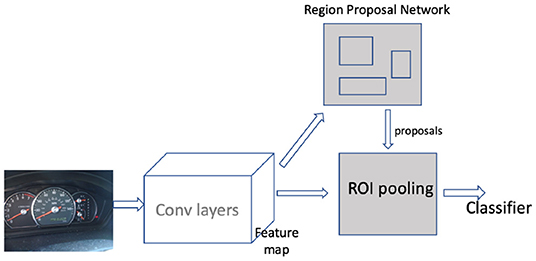
Figure 1. Faster RCNN detector.
The single shot multiBox detector (SSD) was introduced by Liu et al. [4]. The Faster RCNN algorithm produces accurate results but the network is still computationally intensive for use in some real-time applications [4]. The SSD algorithm proposed a series of improvements over the existing object detection architectures for accelerating running time. The main idea behind SSD is predicting category scores and box offsets for a fixed set of default bounding boxes using small convolutional filters applied to feature maps. SSD then generates predictions from different scales of feature maps thereby producing predictions for all of them. Similarly to the faster RCNN algorithm, the input to SSD is a convolutional feature map. In the original paper, the convolutional feature map is generated by passing an image through the Conv5_3 layer of a VGG-16 network. The feature map is downscaled using convolutional filters to get feature maps at multiple scales. Figure 2 shows original feature maps along with 6 downscaled ones. Each feature map is processed independently using different convolutional models to detect objects at particular scales. There is a set of default boxes associated with each cell of the feature maps. The convolutional model predicts offset coordinates relative to the default boxes and class scores for that box. The offset coordinates move and tighten the default boxes for a better localization of objects. The architecture is trained end-to-end by minimizing the weighted sum of the localization loss and the classification loss.
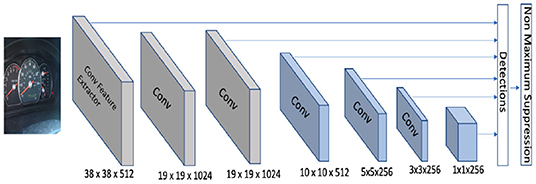
Figure 2. Single Shot Detector extracts detections from feature map at multiple scales.
The success of Deep Learning is contributed mostly by the large datasets available for training the model. However, data acquisition and annotation is costly and time consuming. Both SSD and the Faster RCNN detectors contain deep architecture with large number of parameters. Hence, training them from scratch with small dataset can lead to overfitting.
Transfer learning allows deep networks to be trained on one domain and reused on a different domain. The first few convolution layers of a CNN trained on images learn universal representation of image features. These layers can be reused to build an image classifier with a different dataset. The reused layer can either be fine-tuned on the new network or kept frozen allowing only the newly added layers to be updated. There are several different ways to adopt transfer learning in object detection. Figures 1, 2 show that the first step for both the SSD and the faster RCNN detector is transforming the images to convolutional feature maps using a feature extractor. This feature extractor can be constructed from the first few layers of pre-trained image classification architectures such as VGG [16], Inception [17], Resnet [18], etc. trained on a large image classification dataset such as imagenet [19]. When training the object detection model, the layers in the feature extractor can either be kept frozen or updated with a very small learning rate depending on the size of the dataset. Another way of adopting transfer learning in a detection domain is by training a detection model end-to-end using a large object detection dataset such as Pascal VOC [20], MS COCO [21], and fine-tuning it with a new dataset.
Training object detection architectures such as SSD and Faster RCNN requires a large corpus of annotated training samples. Our initial dataset contained only around six thousand (6,000) odometer images. These images were uploaded by customers when filing an auto insurance claim. Before any further processing, we manually filter the dataset to remove images with potential personally identifiable information (PII). We also removed images that do not contain odometers in them. Finally, the gathered dataset has total of 6,209 odometer images. The images came from uncontrolled sources and hence in general the quality of images in the dataset is poor. Most images suffer from non-uniform illumination, insufficient lighting, incorrect orientation and low picture resolution.
The process to label the dataset can be divided in two stages. In the first stage, we aimed to manually segment the odometer display by drawing a bounding box enclosing the display. Here, the term odometer display refers to LCD screens from digital odometers or mechanical meter from analog odometers. In the second stage, our goal was to generate boxes enclosing each individual character inside the odometer display and label the characters with the corresponding digit.
Both of the annotation stages involved labor intensive and repetitive tasks. Hence, we resorted to crowdsourcing as a viable solution for these tasks. There are several commercially available platforms that facilitate crowdsourcing labeling tasks. We used two popular crowdsourcing platforms: Amazon Mechanical Turk (AMT) [22] and Figure Eight (previously known as Crowdflower) [23].
Amazon Mechanical Turk is one of the largest crowdsourcing platforms operating today. At any given time, it has hundreds of active workers ready to work on the given task. It provides flexibility to build customized user interfaces using HTML, CSS and javascript. It also provides some basic customizable templates for annotations tasks like sentiment analysis, image classification, NER, etc.
For our first stage of the annotation process, i.e., manually segmenting the odometer display, we used AMT. For this task, we modified the UI opensourced by Russell et al. [24]. The modified UI allows workers to draw a box over the image, drag it and resize it. We collected 3 boxes from different labelers for each image in order to capture possible annotation errors.
Figure Eight is another crowdsourcing platform that works similar to AMT. In addition to supporting HTML, CSS and Javascript for UI design, it has rich UI templates for labeling different objects in images. It has built-in functionality such as zoom-in, zoom-out, scrolling, etc. that are very relevant for us when drawing character level bounding boxes. The zoom-in functionality facilitates the ability to draw tighter boxes. This platform also monitors the quality of work done by its workers. All workers have to pass tests before they can work on any annotation job. For all these reasons, we found the quality of the annotations on Figure Eight to be better than the ones obtained when using AMT but this comes at an extra price. Hence, we decided to use both platforms for each of our first and second stage of annotation, depending on the trade-off between the cost of labeling vs. the quality of the annotations.
For any sort of annotation task completed through crowdsourcing, it is important that the workers understand the expected outcome of the solicited annotations. It is essential to provide clear and detailed labeling instructions, covering all the corner cases and at the same time being as precise as possible. We completed the annotation tasks in several batches, we evaluated the annotations quality for each batch and identified the key sources of confusion among the workers. We then changed the instructions accordingly before sending out the next batch. Figures 3, 4 show some sample odometer images and the annotation labels.
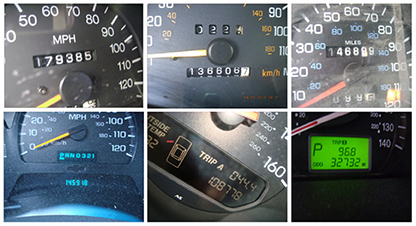
Figure 3. Sample odometer images.
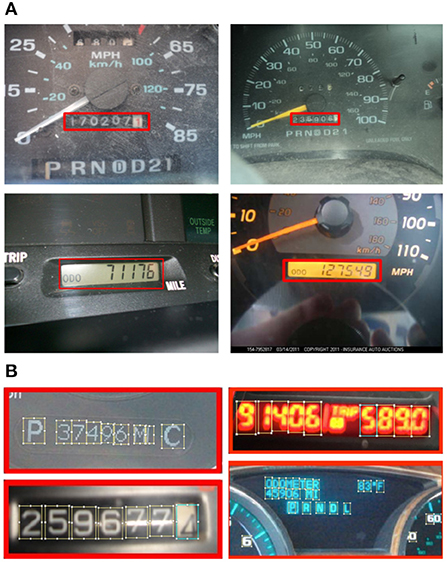
Figure 4. Sample annotations. (A) Labeling odometer display. (B) Labeling characters.
Table 1 and Figure 5 show the distribution of the characters in the dataset. 73% of all labeled characters are digits while only 27% of them are letters. With 52 possible alphabet letters (26-lowercase and 26-uppercase), the number of samples for each alphabet class is too small and highly imbalanced. This later inspires us to group all the alphabet characters together in a single class when training the character recognition model.
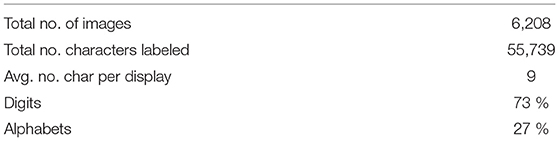
Table 1. Dataset and distribution.
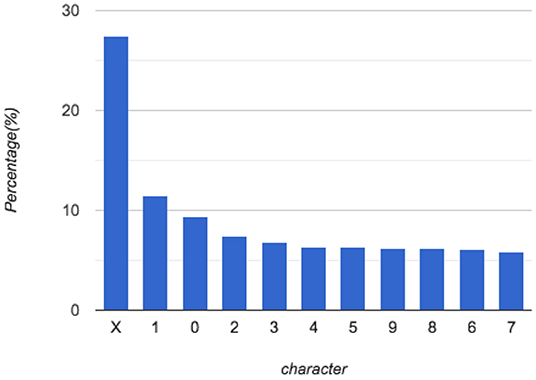
Figure 5. Distribution of characters; X represents non-digit characters.
We also collected additional information from the labelers about the quality of the images in our dataset. During an initial manual inspection, we noticed that a significant portion of the images in the dataset were not of good quality. To confirm this, during annotation, we asked the annotators to rate the image quality of the characters into different categories. Table 2 shows the distribution of the images in five categories. Note that a significant portion of the images (21%) are marked as being of poor or extremely poor quality.
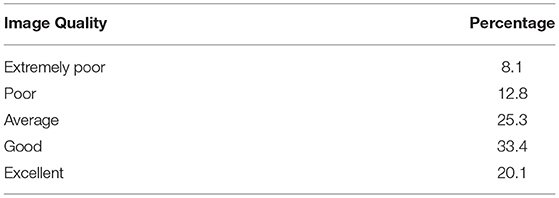
Table 2. Image quality distribution.
The proposed solution consists of two cascaded object detection classifiers followed by a post-processing algorithm (See Figure 6). Algorithms for object detection have seen significant improvement over the last few years. In order to leverage the effectiveness of these models, we divide our problem into two sub-problems that can directly be seen as problems in the object detection domain:
• The first is odometer localization where the goal is to locate the odometer display given an input image.
• The second is character recognition where the goal is to locate and recognize characters inside the odometer display.
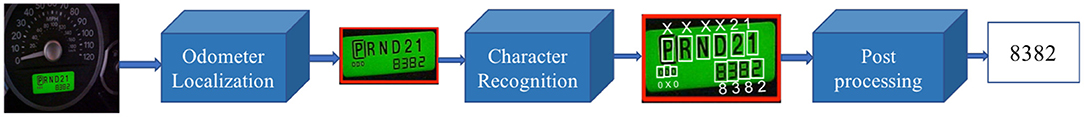
Figure 6. Pipeline of proposed architecture.
We next proceed to explain in detail each one of these sub-problems.
The first stage of the pipeline is to isolate and extract the odometer display from the rest of the image. There are commonly two types of odometers: analog and digital. Digital odometers have LCD displays containing a mileage reading and may be accompanied by other information such as temperature, time, fuel status, etc. The analog odometer consists of a mechanical rolling meter. Although, there is large variation in appearance of analog and digital odometers, we do not differentiate these two types for this stage. In order to train the odometer localization model, we trained an object detection model with odometer images where the odometer display box is the object of interest. The position of odometer display is supplied as coordinates (x-center, y-center, height, width) of the odometer display box. Object detection algorithms are usually trained to localize and classify objects in the image. However, for odometer localization there is a single class i.e., odometer display, so the only output we want from the model is the localization coordinates. During inference, the localization model takes an image and output back the coordinates(x-center, y-center, width, height) of the odometer display.
The second stage of the pipeline consists of a character recognition model. This an object recognition model trained on images and labels generated in the second stage of annotation. The training images for this stage come from the odometer display labeled in the first stage. We crop the odometer display for each image in the dataset and feed it to the model along with the annotations from the second stage. The second stage produces annotations of position (x-center, y-center, height, width) of each individual character and the corresponding class label. We do make some changes to the class labels before training the classifier. Since we only care about getting the mileage number in the images, it's sufficient to recognize only digits in the images and not the rest of the alphabet characters. Furthermore, if we look at distribution of characters in Table 1, we have very few samples per class for the letters in the alphabet. Training a model to recognize individual alphabet characters means we would have very few examples for most class labels and we would risk overfitting. Instead, we categorize characters into 11 different class labels, 10 for the digits 0–9 and 1 “non-digit” class for all the alphabets.
The character recognition stage identifies individual characters inside the odometer display along with their coordinates. In the last part of the pipeline, we want to isolate the digits that are part of the mileage reading. The post-processing step combines nearby characters to form words/numbers and selects the most likely number as the mileage reading. In some digital odometers, we can find additional information being displayed alongside the mileage reading. Some of the most frequently seen additional pieces of information include temperature, time, warning messages, trip meter reading, fuel status, etc. It is essential to distinguish the actual mileage reading from other numbers being displayed on the screen. Similarly, for an analog odometer we observe two variants: most models have six digits while a few older models have 7 digits. Usually the 7th digit changes every 1/10th of a mile and is not considered a significant part of the mileage reading.
In order to deal with special cases like this, we designed a post-processing algorithm that takes care of all these corner cases. The processing algorithm is described in detail below in Algorithm 1.
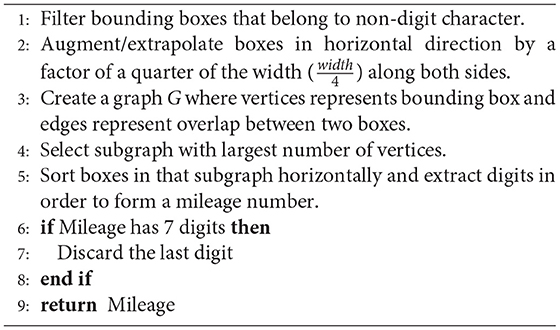
Algorithm 1: Post-processing algorithm
We randomly selected a small portion of the training set and used it as validation set for all experiments. The hyperparameter selection for all architectures is based on performance in the validation set. We used the object detection API included in tensorflow models [25] to train and evaluate the models. Huang et al. [26] provides in-depth comparison of speed and accuracy of different meta-architectures supported by the API. We used a Amazon Web Services (AWS) Elastic Cloud Compute instance containing 8 GPU with 12 GB memory each for training and testing the models. For both odometer localization task and character recognition task, we train SSD and faster RCNN architectures with several choices of CNN model for Feature extraction such as inception v2 [27], resnet101 [18], inception resnet [28], mobilenet [29], etc. We experimented with both approaches of transfer learning described in the previous section: (a) we fine-tuned a detection model trained on the MS COCO dataset and, (b) we used a classification model trained on the imagenet dataset for feature extraction and trained the remaining layers from scratch. We find that using the detection model trained on the MS COCO dataset gave the best results. Furthermore, SSD got the best performance with inception v2 as features extractor and Faster RCNN got the best results with inception Resnet as the feature extractor. We report the mean average precision for the best performing SSD and faster RCNN for the two stages; Odometer localization and character recognition. We report the final accuracy and error analysis for the faster RCNN architecture which is a winner between the two architectures for both stages.
The best performing faster RCNN model is finetuned version of a faster RCNN detector originally trained on MS COCO dataset. The MS COCO detector was trained with inception resnet architecture [detailed in Szegedy et al. [28]] as feature extractor and 90 different categories in MS COCO dataset as output objects. We finetuned this model by modifying the last layer to detect one class(odometer display) for odometer localization. Similarly, for character recognition we modified the last layer to output 11 classes(0,1,.,9, X). We used a grid anchor generator with scales of 0.25, 0.5, 1.0, and 2.0, aspect ratios of 0.5, 1.0, and 2.0 and strides of 8 for both height and width. This means a total of 12 proposal boxes for each anchor position in the grid. The post processing stage is set to reject all the detections with score < 0.3. The IOU threshold is set to 0.6 for Non maximum suppression. The loss being minimized is the sum of localization loss and classification loss both of which are equally weighted. We used learning rate of 0.0003 and trained the model for 50, 000 steps with a batch size of 8.
A common evaluation technique for object detection models is to measure mean average precision (map) [20] for a certain threshold of the Intersection Over Union (IOU) ratio. A prediction is a true positive if the IOU ratio between the predicted bounding box and the actual box is greater than the IOU threshold. Table 3 shows themap values (at IOU = 0.5) of the SSD and the faster RCNN models for both the odometer localization the and character recognition task. The results clearly indicate that the faster RCNN algorithm is a winner for both tasks.
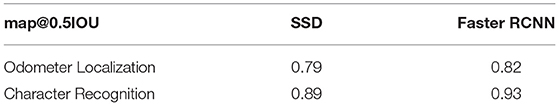
Table 3. Mean Average Precision of Faster RCNN and SSD architectures for odometer localization and character recognition stage.
Our mileage extraction model contains two object detectors working in conjunction. Rather than detecting an object/character, the objective is to extract the actual mileage reading. To do so, the model has to predict every single digit correctly. For our system, getting those numbers right is more important than getting perfect localization of the odometer display or the individual characters.
In order to measure system performance, We defined a binary measure of end-to-end system accuracy in the following way: the model gets a score equal to 1 if extracted mileage equals the annotated mileage and 0 otherwise. Furthermore, in most business use-cases, it is sufficient to get the mileage within a given error range. For example; if a model predicts the mileage to be 45,607 when the actual mileage is 45,687 then there is an error of 80 miles. For use cases such as insurance quote generation or claims processing a perfectly acceptable margin of error is around a thousand (1,000) miles. Taking this into account, we introduce one more additional end-to-end system evaluation metric in the following way: the model gets score = 1 if absolute(extracted mileage–annotated mileage) < threshold and 0 otherwise (where threshold = 1,000 miles).
Since the overall quality of images in our odometer images dataset is not so good, we performed a further analysis on the effect of the image quality on the performance of the model. We created a subset of the test set comprised of only the good quality images. These images are selected from the test set based on their corresponding annotator rating. This “good-quality images” subset ended up containing 362 images. Figure 7 shows end-to-end system accuracy for the faster RCNN model for both the original test set and the “good-quality images” subset. For the original test set, we obtain end-to-end accuracy of 85.4% using faster RCNN for both stages. Similarly, we achieve an accuracy of 88.8% within an error boundary of 1,000 miles. For the “good-quality images” subset, we get a general accuracy of 90% and an accuracy of 91.4% within an error bound of 1,000 miles. It is important to note the improvement of 5% in test set accuracy associated with the improvement in image quality. This result presents an opportunity to improve performance by validating the quality of uploaded images in real time and providing immediate feedback and guidance to the customer to generate better quality pictures. Sample results for odometer localization and character recognition are shown in Figures 8, 9.
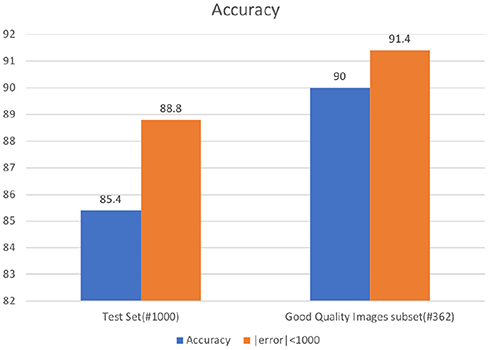
Figure 7. Accuracy results comparisons.
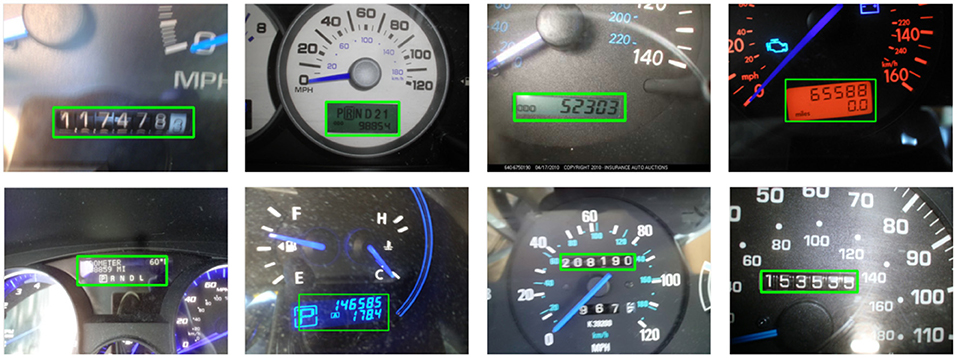
Figure 8. Selected examples of odometer localization. In case of multiple detections, only the most confident box is shown.
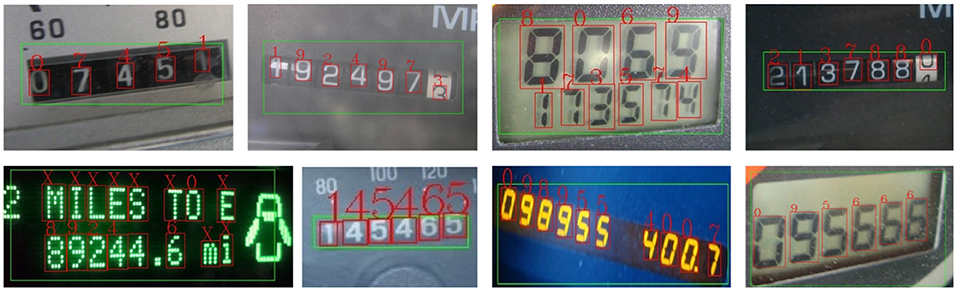
Figure 9. Selected examples of character recognition. Character recognition model scans for characters inside the region(green box) proposed by localization model. Characters in red are predictions from character recognition model. X represents non-digit character.
To identify key weakness of the model and opportunities for improvement, we performed a more detailed error analysis. For all the incorrect predictions, we manually assigned the error to one of the three stages in the pipeline. Figure 10 shows the distribution of the incurred test set errors among the odometer Localization, the character Recognition and the post-processing stage. The localization errors occur when the localization model cannot properly detect the odometer display, either because it did not find the display or because the proposed bounding box is not accurate enough to include all the characters in the display. It is evident from Figure 10 that a large portion of the errors are coming from the character recognition stage. Errors in this stage include not detecting or recognizing characters inside the odometer display. This error could be minimized by improving the character recognition model. As we mentioned before, image quality is an important factor in improving accuracy and we need to put more effort on ensuring that the uploaded images meet minimum quality standard.
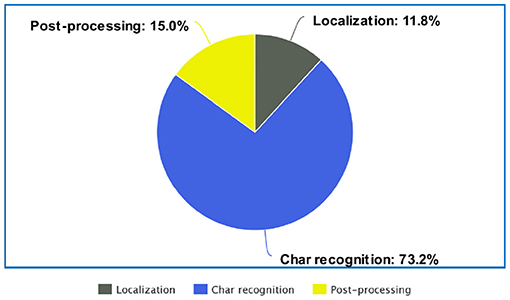
Figure 10. Detailed error analysis by stage.
The post processing algorithm constitutes 15% of the total error. This error comprises cases such as failure to group digits together, failure to distinguish mileage from other numbers in the display, identifying the digit after the decimal point as part of the mileage, etc.
The deployment of the odometer mileage detector is a work in progress. However, we are reusing a deployment framework used in the past for similar image recognition models in our company. In this section, we will describe such framework.
Containerized deployment is very popular nowadays. Containers are independent, easily configurable and easily scaled to multiple machines. Microservices running inside containers provide isolation from actual system ingesting the service and provide flexibility to work independently and quickly. We deploy the model as a microservice running in a docker container. Docker allows packaging codes and dependencies into a docker image that runs inside a docker container. Docker containers are compatible to run on any operating system.
Figure 11 shows the overall architecture used for deployment. We use tools provided by the Amazon Web Service(AWS) ecosystem to launch, scale, orchestrate and run the docker container. Detailed description of each of these tools can be found in the official site [30]. The central component is the docker container hosting the odometer mileage extraction model. We use the Amazon elastic container registry (ECR) to host docker images and Amazon elastic container services (ECS) to run the containers. We use Amazon systems manager parameter store (SMPS) to store runtime parameters and Amazon CodeBuild to build the docker image. Furthermore, Amazon ElasticBeanStalk (EBS) is used to orchestrate the deployment to ECS, as well as to provision and configure other resources such as LoadBalancer, AutoScaling groups, etc. EBS facilitates logging, monitoring and sending notifications to the developers about unexpected service interruptions. We believe that the Continuous Integration/Continuous Delivery(CI/CD) principle [31] is a crucial part of any data science project. We want to be able to train new models or update code base and deploy them into production automatically with minimum effort. This allows data scientist to focus more on improving models rather than spending time on deployment. For CI/CD, we use Jenkins. As soon as we push changes to a git repository, Jenkins builds an image, runs tests and deploys the model to production. Here is a step by step break down of the deployment process:
• Push changes to git repository hosted in bitbucket.
• Jenkins monitors changes in git repository and initiates build process.
• Jenkins builds code, runs test and builds image.
• Jenkins pushes image to ECR and issues deploy to ECS.
• ECS pulls new image from ECR and runs it inside docker container.
• EBS receives a HTTP request with odometer image.
• ELB distributes load across multiple containers and EBS launches additional container instances if necessary.
• Container processes the image and sends mileage back to user app.
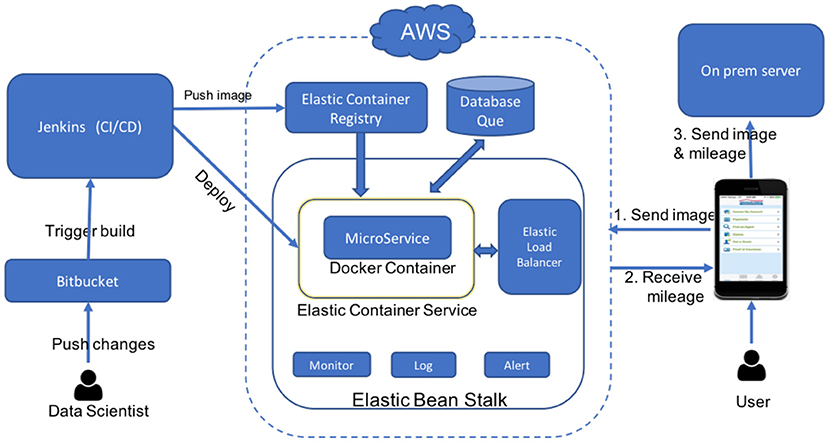
Figure 11. Deployment architecture.
The client mobile app makes a HTTP request to odometer server and receives a mileage number in response. It auto-fills the odometer mileage reading into the form. The user will have an option to validate, and correct the mileage reading if necessary, before submitting the form. The odometer picture is uploaded to a on-premises server along with the form during submission.
In this work we developed a novel solution to the insurance-related problem of extracting mileage readings from odometer images. We leveraged existing object recognition technology and designed a post processing algorithm to identify and extract mileage readings. The developed system was able to get high accuracy in mileage extraction despite having poor quality images. We also have provided a complete implementation design including the tools and technology we are using to deploy, scale and manage the model in production.
Our detailed error analysis provides insights into the shortcomings of the system and unveil opportunities to improve it. We can further improve performance of the model using image guidance and enforcing minimum requirements on image quality. For example, when a user takes a picture of the odometer, the app display could contain a bounding box and the user will be asked to align the odometer display within that bounding box. This technique is commonly used in several applications that read data from credit cards, personal checks, etc. Image guidance could help mitigate the need for having an accurate localization model and hence the errors associated with that model could be minimized significantly. This will also ensure that the images are taken directly facing the odometer display and with a proper orientation.
We are also exploring methods to estimate prediction confidence for the predicted mileage digits. If we are able to estimate prediction confidence, we can automatically accept images when we feel confident that we are predicting the correct mileage reading and ask the user to repeat the process or enter the mileage by hand if we fail to produce a confident enough prediction.
The datasets generated for this study cannot be released publicly due to the privacy concern of the customers. Requests to access these datasets should be directed to the corresponding author.
SA implemented the project, ran experiments, and worked on manuscript. GF initiated the project, managed it, and worked on manuscript.
SA and GF were employed by the company American Family Insurance.
1. Smith R. An overview of the tesseract OCR engine. In: Proc. Ninth Int. Conference on Document Analysis and Recognition (ICDAR) Parana (2007). p. 629–33. doi: 10.1109/ICDAR.2007.4378659
2. Matlab OCR toolbox (2018). Available online at: https://www.mathworks.com/help/vision/ref/ocr.html (accessed February 1, 2019).
3. Hosseini H, Xiao B, Poovendran R. Google's cloud vision API is not robust to noise. CoRR. (2017) abs/1704.05051.
4. Liu W, Anguelov D, Erhan D, Szegedy C, Reed S, Fu CY, et al. Ssd: single shot multibox detector. In: European Conference on Computer Vision. Amsterdam: Springer (2016). p. 21–37.
5. Girshick R. Fast R-CNN. In: The IEEE International Conference on Computer Vision (ICCV). Beijing (2015).
6. Masood SZ, Shu G, Dehghan A, Ortiz EG. License plate detection and recognition using deeply learned convolutional neural networks. CoRR. (2017) abs/1703.07330.
7. Bulan O, Kozitsky V, Ramesh P, Shreve M. Segmentation- and annotation-free license plate recognition with deep localization and failure identification. IEEE Trans Intell Trans Syst. (2017) 18:2351–63. doi: 10.1109/TITS.2016.2639020
8. Sanap PR, Narote SP. License plate recognition system-survey. AIP Conf Proc. (2010) 1324:255–60. doi: 10.1063/1.3526208
9. Sonavane K, Soni B, Majhi U. Survey on automatic number plate recognition (ANR). Int J Comput Appl. (2015) 125:1–4. doi: 10.5120/ijca2015905920
10. Du S, Ibrahim M, Shehata MS, Badawy WM. Automatic License Plate Recognition (ALPR): a state-of-the-art review. IEEE Trans Circ Syst Video Technol. (2013) 23:311–25. doi: 10.1109/TCSVT.2012.2203741
11. Nagaoka Y, Miyazaki T, Sugaya Y, Omachi S. Text detection by faster R-CNN with multiple region proposal networks. In: 2017 14th IAPR International Conference on Document Analysis and Recognition (ICDAR). Vol. 6. Kyoto: IEEE (2017). p. 15–20.
12. Borisyuk F, Gordo A, Sivakumar V. Rosetta: Large scale system for text detection and recognition in images. In: Proceedings of the 24th ACM SIGKDD International Conference on Knowledge Discovery & Data Mining. London: ACM (2018). p. 71–9.
13. Yang C, Yin X-C, Yu H, Karatzas D, Cao Y. ICDAR2017 robust reading challenge on text extraction from biomedical literature figures (DeTEXT). In: 2017 14th IAPR International Conference on Document Analysis and Recognition (ICDAR). Vol. 1. Kyoto: IEEE (2017). p. 1444–7.
14. Ren S, He K, Girshick R, Sun J. Faster R-CNN: Towards real-time object detection with region proposal networks. In: Advances in Neural Information Processing Systems. Montreal, QC: Curran Associates, Inc. (2015). p. 91–9.
15. Long J, Shelhamer E, Darrell T. Fully convolutional networks for semantic segmentation. In: Proceedings of the IEEE Conference on Computer Vision and Pattern Recognition. (Boston, MA) (2015). p. 3431–40.
16. Simonyan K, Zisserman A. Very deep convolutional networks for large-scale image recognition. CoRR. (2014) abs/1409.1556.
17. Szegedy C, Liu W, Jia Y, Sermanet P, Reed S, Anguelov D, et al. Going deeper with convolutions. In: Proceedings of the IEEE Conference on Computer Vision and Pattern Recognition. (Boston, MA) (2015). p. 1–9.
18. He K, Zhang X, Ren S, Sun J. Deep residual learning for image recognition. In: Proceedings of the IEEE Conference on Computer Vision and Pattern Recognition. (Seattle, WA) (2016). p. 770–8.
19. Russakovsky O, Deng J, Su H, Krause J, Satheesh S, Ma S, et al. Imagenet large scale visual recognition challenge. Int J Comput Vision. (2015) 115:211–52.
20. Everingham M, Eslami SMA, Van Gool L, Williams CKI, Winn J, Zisserman A. The pascal visual object classes challenge: a retrospective. Int J Comput Vision. (2015) 111:98–136. doi: 10.1007/s11263-014-0733-5
21. Lin TY, Maire M, Belongie S, Hays J, Perona P, Ramanan D, et al. Microsoft coco: common objects in context. In: European Conference on Computer Vision. Zurich: Springer (2014). p. 740–55.
22. Mechanical Turk (2019). Available online at: https://www.mturk.com/ (accessed February 1, 2019).
23. Figure Eight (2019). Available online at: https://www.figure-eight.com/ (accessed February 1, 2019).
24. Russell BC, Torralba A, Murphy KP, Freeman WT. LabelMe: a database and web-based tool for image annotation. Int J Comput Vision. (2008) 77:157–73. doi: 10.1007/s11263-007-0090-8
25. Github Contributor. Object Detection API. GitHub (2019). [commit 947c92bc44df7499baa3da1fefe7d3094a1f4561]. Available online at: https://github.com/tensorflow/models/tree/master/research/object_detection (accessed February 1, 2019).
26. Huang J, Rathod V, Sun C, Zhu M, Korattikara A, Fathi A, et al. Speed/accuracy trade-offs for modern convolutional object detectors. In: IEEE CVPR. Vol. 4. (Honolulu, HI) (2017).
27. Szegedy C, Vanhoucke V, Ioffe S, Shlens J, Wojna Z. Rethinking the inception architecture for computer vision. In: Proceedings of the IEEE Conference on Computer Vision and Pattern Recognition. Seattle, WA (2016). p. 2818–26.
28. Szegedy C, Ioffe S, Vanhoucke V, Alemi AA. Inception-v4, inception-resnet and the impact of residual connections on learning. In: AAAI (San Francisco, CA). (2017). p. 12.
29. Howard AG, Zhu M, Chen B, Kalenichenko D, Wang W, Weyand T, et al. Mobilenets: efficient convolutional neural networks for mobile vision applications. arXiv preprint. (2017) arXiv:170404861.
30. Amazon Web Services Ecosystem (2019). Available online at: https://aws.amazon.com/products/ (accessed February 1, 2019).
31. Wikipedia contributors. CI/CD — Wikipedia, The Free Encyclopedia (2019). Available online at: https://en.wikipedia.org/w/index.php?title=CI/CD&oldid=877599340 (accessed February 1, 2019).
Keywords: image recognition, information extraction, deep learning, computer vision, optical character recognition
Citation: Acharya S and Fung G (2019) Mileage Extraction From Odometer Pictures for Automating Auto Insurance Processes. Front. Appl. Math. Stat. 5:61. doi: 10.3389/fams.2019.00061
Received: 09 August 2019; Accepted: 15 November 2019;
Published: 10 December 2019.
Edited by:
Qingtang Jiang, University of Missouri-St. Louis, United StatesReviewed by:
Baobin Li, University of Chinese Academy of Sciences, ChinaCopyright © 2019 Acharya and Fung. This is an open-access article distributed under the terms of the Creative Commons Attribution License (CC BY). The use, distribution or reproduction in other forums is permitted, provided the original author(s) and the copyright owner(s) are credited and that the original publication in this journal is cited, in accordance with accepted academic practice. No use, distribution or reproduction is permitted which does not comply with these terms.
*Correspondence: Shailesh Acharya, c2FpbGVzNDM3QGdtYWlsLmNvbQ==
Disclaimer: All claims expressed in this article are solely those of the authors and do not necessarily represent those of their affiliated organizations, or those of the publisher, the editors and the reviewers. Any product that may be evaluated in this article or claim that may be made by its manufacturer is not guaranteed or endorsed by the publisher.
Research integrity at Frontiers
Learn more about the work of our research integrity team to safeguard the quality of each article we publish.