- 1World Agroforestry Centre (ICRAF), Nairobi, Kenya
- 2ISRIC World Soil Information, Wageningen University, Wageningen, Netherlands
- 3Department of Horticultural Sciences, University of Bonn, Bonn, Germany
Designing and implementing biodiversity-based value chains can be a complex undertaking, especially in places where outcomes are uncertain and risks of project failure and cost overruns are high. We used the Stochastic Impact Evaluation (SIE) approach to guide the Intergovernmental Authority on Development (IGAD) on viable investment options in honey value chains, which the agency considered implementing as an economic incentive for communities along the Kenya-Somalia border to conserve biodiversity. The SIE approach allows for holistic analysis of project cost, benefit, and risk variables, including those with uncertain and missing information. It also identifies areas that pose critical uncertainties in the project. We started by conducting a baseline survey in Witu and Awer in Lamu County, Kenya. The aim of the survey was to establish the current farm income from beekeeping as a baseline, against which the prospective impacts of intervention options could be measured. We then developed an intervention decision model that was populated with all cost, benefit and risk variables relevant to beekeeping. After receiving training in making quantitative estimates, four subject-matter experts expressed their uncertainty about the proposed variables in the model by specifying probability distributions for them. We then used Monte Carlo simulation to project decision outcomes. We also identified variables that projected decision outcomes were most sensitive to, and we determined the value of information for each variable. The variable with the highest information value to the decision-maker in Witu was the honey price. In Awer, no additional information on any of the variables would change the recommendation to invest in honey value chains in the region. The analysis demonstrates a novel and comprehensive approach to decision-making for different stakeholders in a project where decision outcomes are uncertain.
Introduction
How to approve and prioritize among projects that aim at biodiversity conservation has been highlighted as one of the most critical decisions that conservation planners face [1]. This is not surprising, because conservation outcomes are often achieved through complex mechanisms, and the success of conservation actions is rarely guaranteed, with many uncertainties preventing precise impact prediction. Success is even harder to predict, when conservation agencies aim to strengthen biodiversity indirectly, e.g., by supporting livelihoods and economies of local people as an incentive for them to conserve biodiversity outcomes [2]. Investing in biodiversity based value chains does not necessarily result in positive biodiversity outcomes. Negative impacts can arise, when value chain development results in depletion of the biodiversity that forms the resource base, on which the value chain depends (e.g. fisheries or non-timber forest products).
The production of honey is an example of a biodiversity based value chain that strengthens rather than erodes the conservation of biodiversity [3]. This is because honey producers have an interest to conserve the vegetation and plant species that produce the nectar and pollen that supports the value chain. The development of honey value chains typically revolves around a combination of introducing improved bee keeping and honey production techniques and improved access to markets for honey [4]. Yet, while attractive at first sight, such improved techniques are not always easily adopted [5]. An important reason for this is uncertainty among farmers about the financial outcomes of their investment in improved honey production techniques.
A detailed cost-benefit analysis on beekeeping projects can be considered to reduce the perceived uncertainty. However, there are rarely sufficient data on all relevant aspects of an investment decision to allow precise, purely data-driven projections to support decision-making [6]. Given such a lack of perfect knowledge, decision-makers need appropriate tools for handling uncertainties, and for identifying and prioritizing knowledge gaps, whose narrowing would reduce their chance of selecting a suboptimal decision option [7, 8]. Furthermore, decision-makers need improved capabilities to quantify risks surrounding proposed interventions, because failure to adequately account for risk can lead to high chances of project failure [9].
The Stochastic Impact Evaluation (SIE) approach allows for a structured decision analysis that incorporates all relevant variables, even those with uncertain and missing information [10]. It considers risk factors that may compromise project success or affect project performance. The approach incorporates Value of Information analysis that prioritizes critical uncertainties in a project, where further research has the greatest potential of enhancing clarity on the decisions. The present study uses the SIE approach to assess investment decisions in honey value chains for the Intergovernmental Authority on Development (IGAD) in its program on Biodiversity Management (BMP).
Study Background
IGAD-BMP partnered with the World Agroforestry Centre (ICRAF) to implement the program's biodiversity-based interventions along the Kenya-Somalia border. During the project inception phase, stakeholders were consulted, and they proposed participatory honey value chain development as one of the economic incentives for biodiversity conservation. Communities from Witu and Awer were selected to pilot the beekeeping project in Lamu County. One hundred farmers from both communities were selected and trained in beekeeping techniques to boost their honey production knowledge and improve their access to formal markets.
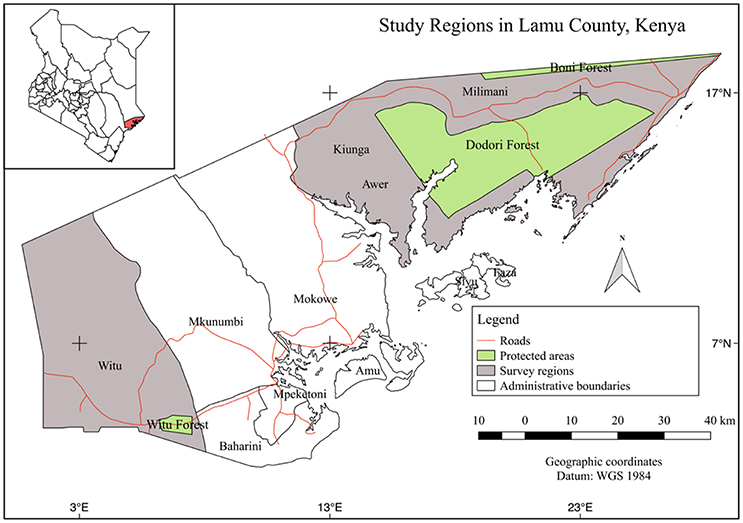
The training was held in May 2015 in Malindi, Kenya. Malindi was selected for training due to its proximity to the Arabuko-Sokoke Forest, where surrounding communities intensively practice modern beekeeping. This provided an opportunity for the trainees to learn from established beekeepers. The training brought together different honey value chain actors, including representatives from the Ministry of Livestock and Fisheries in Kenya. During the workshop, stakeholders agreed that honey value chains had potential for being a viable investment option for Witu and Awer communities. A baseline survey (Figure 1) was commissioned to establish the current net income from beekeeping, the actual number of beekeepers among the trained farmers, beekeeping practices and risks associated with beekeeping.
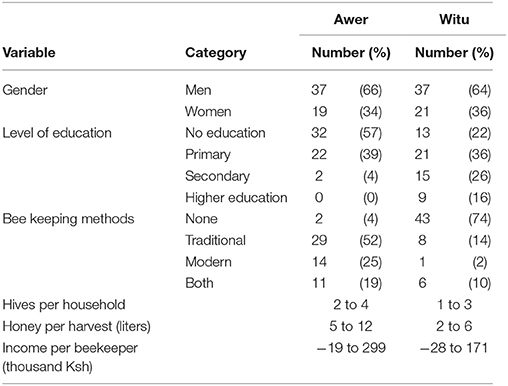
In Awer, the average net income from beekeeping was 82 thousand Kenyan Shillings (Ksh) per year, approximately Ksh 225 per day (Table 1). Traditional beekeeping was widely practiced and characterized by high productivity and well-established markets. In Witu, the average net income from beekeeping per farmer was Ksh 39 thousand (approximately Ksh 107 per day). Very few farmers were currently practicing beekeeping. The region also had very low honey productivity and low farm gate prices, although a higher percentage of interviewed farmers were educated compared to Awer.
The baseline survey informed the project implementation approach for both communities. In Awer, it seemed sensible to support traditional beekeeping, since the region was characterized by high honey productivity and favorable farm gate prices. Establishment of a honey collection center and support of value addition activities, such as packaging, branding and processing of other bee products, were the most promising investment options. In Witu, the favored approach was to invest in modern beekeeping with emphasis on intensive farmer training and engagement of all honey value chain actors to boost productivity. Bridging existing gaps between beekeepers and formal markets was also a priority for the implementer to ensure favorable farm gate prices for the beekeepers.
While clear strategies for HVC development in the two regions thus emerged from the initial consultations and baseline survey, IGAD-BMP was still lacking certainty that the investment would raise farm incomes. To clarify the prospects for the intervention, the analysis aimed at (i) projecting impacts on beekeeping farms using a probabilistic impact evaluation approach, (ii) identifying and mitigating critical uncertainties in the project, and (iii) providing recommendations for project monitoring to reduce the chance of negative outcomes.
Materials and Methods
We used ICRAF's Stochastic Impact Evaluation approach (Figure 2), which is based on the principles of Applied Information Economics (AIE) [9, 11], to project the impact of the decision on different stakeholders in the project. The method makes use of all available information, including expert knowledge, in making impact projections. The SIE approach can be applied even in the absence of perfect data. We quantified all risks, costs and benefits based on the current state of knowledge about them, considering the uncertainties about intervention outcomes that result from this. We also embraced the concept of Value of Information, which is useful for determining decision-specific knowledge gaps that decision-supporting research should address [12].
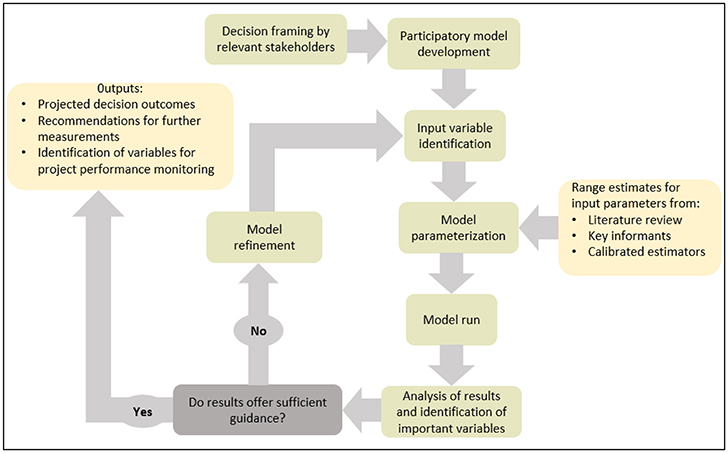
Figure 2. Sequence of activities in the SIE decision modeling approach (modified from [8]).
Modeling Process
The SIE process begins by thoroughly defining the decision to be made. According to Hubbard [9], a decision may merit structured decision analysis if it has two or more realistic alternatives, invokes some form of uncertainty or dilemma, has potentially negative consequences if it turns out that the wrong position was taken, and involves a decision-maker. For this study, HVC development was identified as a viable investment option during the consultative workshop, but stakeholders were still unsure that the decision to invest in HVCs would benefit them. This led to the question: “Should IGAD-BMP invest in the proposed honey value chain intervention as an economic incentive for Witu and Awer communities to conserve biodiversity?”
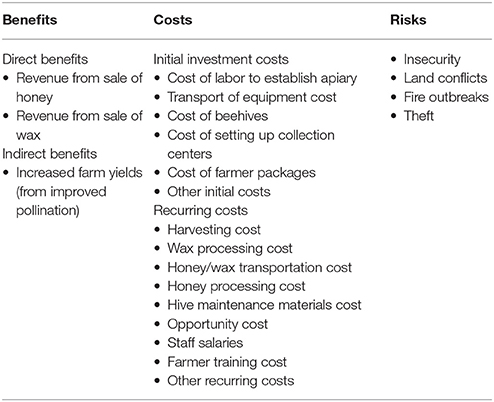
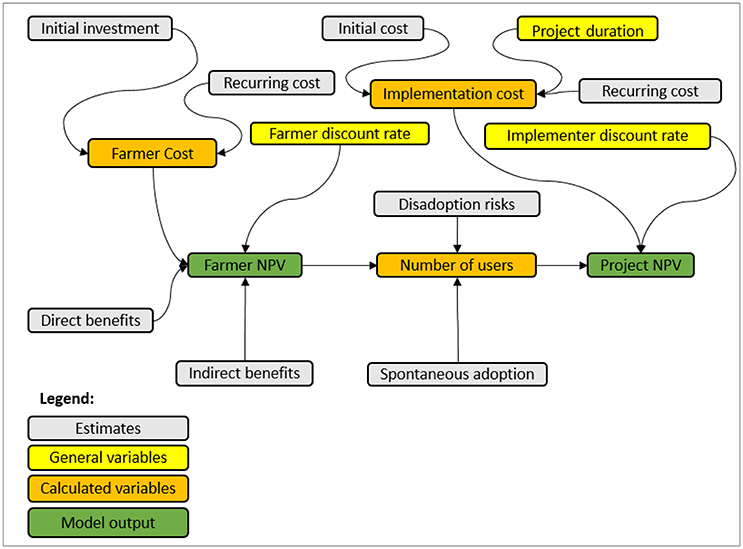
To clearly define this question, a decision analysis team was constituted with the aim of clarifying whether IGAD-BMP was interested in return on investment, who exactly the agency was targeting to raise incomes from beekeeping, and how the project was going to be implemented. The team that was convened to develop the HVC decision model consisted of 8 members: IGAD-BMP's HVC intervention project manager, the biodiversity management program coordinator, two decision analysis experts, one participatory modeling scientist and four research assistants. The initial conceptual model (Table 2), which aimed to reflect the overall structure of the decision at hand, was then sent to a principal bee health scientist from the International Centre of Insect Physiology and Ecology (icipe) for review. The updated model (Figure 3) was translated into a set of equations that represented the team's understanding of the decision's impact pathway [13].
Decision outcomes were projected using the decisionSupport package [14] for the R programming environment [15]. For this, the model equations were coded as a welfare function in R programming language (Data Sheets 3, 4). The model was parameterized using estimated probability distributions for variable values (Data Sheets 1, 2) (often specified as 90% confidence intervals), which were obtained from literature review and five established beekeepers from Mwingi in Kitui County, Kenya. The process required the team to undergo calibration training—a process that improves the capacity to make range estimates for which one is 90% confident that the actual value lies within the provided range [9]. This was done for all variables, including those for which no other information was available. Using the estimated variables as inputs, the decision model was run as a Monte Carlo simulation [16, 17]. This approach produced a distribution of possible decision outcomes by running the model a large number of times, each time fed with a different set of random draws from the defined distributions for the variables in the equations [18]). To identify variables that were most uncertain in the analysis, we used Partial Least Squares (PLS) regression [19], which was also implemented in the decisionSupport package [14].
The most uncertain variables in a project, which outcome projections are most sensitive to, are not necessarily most important to the decision-maker, because new information on them may not be able to change the recommendation emerging from the decision model. The value of additional information on a variable for decision-makers is determined by whether this information has the potential to change the sign of the expected value of the decision, which would change the preferred decision option [9].
To identify high-value variables, the Expected Value of Perfect Information (EVPI) was calculated by detecting correlations between input and output variables and identifying those that were of importance to a decision-maker, i.e., the variables, whose measurement could help reduce the expected opportunity loss of the decision. Since there was no basis for deciding on the functional form of the relationship between test and outcome variable, a non-parametric test was used to detect these relationships. We used Spearman's rank correlation, using the usual statistical cutoff criterion of α < 0.05 to exclude all variables that were not correlated with projected decision outcomes. For those that were not correlated, the value of information was zero, since the variable had no significant relationship with the outcome. This criterion excluded most variables, and discriminated well between informative and obviously uninformative variables.
We then sorted the dataset by values of each remaining input variable. In the sorted dataset, it was not possible to identify a clear threshold, where the expected decision outcomes transition from positive to negative. This was because the data was still too “noisy.” To more clearly expose the effect of uncertain variables on the decision recommendation, we processed the dataset using a second-order low-pass Butterworth filter, with a critical frequency of one divided by one tenth of the number of values in the Monte Carlo output. This resulted in a smooth dataset, in which it was often possible to identify a threshold, where the sign of projected decision outcomes was reversed, e.g. for variable values above the threshold, positive outcomes would be expected, while values below the threshold would likely lead to negative outcomes (note that using a signal processing filter is a pragmatic way to solve the computational challenge of calculating the EVPI, but it introduces a small amount of inaccuracy into the threshold identification). With this threshold identified, the EVPI was computed as the sum of all outcomes with a sign that did not correspond to that of the expected value (e.g., all negative outcomes, when the analysis produced a positive expected value), multiplied by their respective chance of occurrence. This EVPI procedure was applied to all output variables.
Results
Due to the economic and biophysical disparities between Awer and Witu, the two regions were modeled separately. The outcome of the analysis was expressed as the net present value (NPV) of the intervention for a farmer and for the overall project. Emphasis was placed on the farmer NPV and overall project NPV, since the implementer's direct objective was to raise farmer incomes from beekeeping. Cash flows were also illustrated, and variables that had information value for the decision maker were identified.
Witu Community
In Witu, the median of the modeled distribution of average annual monetary income per farmer practicing beekeeping was Ksh 65 thousand, with 90% confidence that the actual income lay within the range of Ksh −36 thousand to 140 thousand for a farmer who would continuously practice beekeeping (Figure 4). The chance of a negative average monetary NPV for a farmer in this region was 24%.
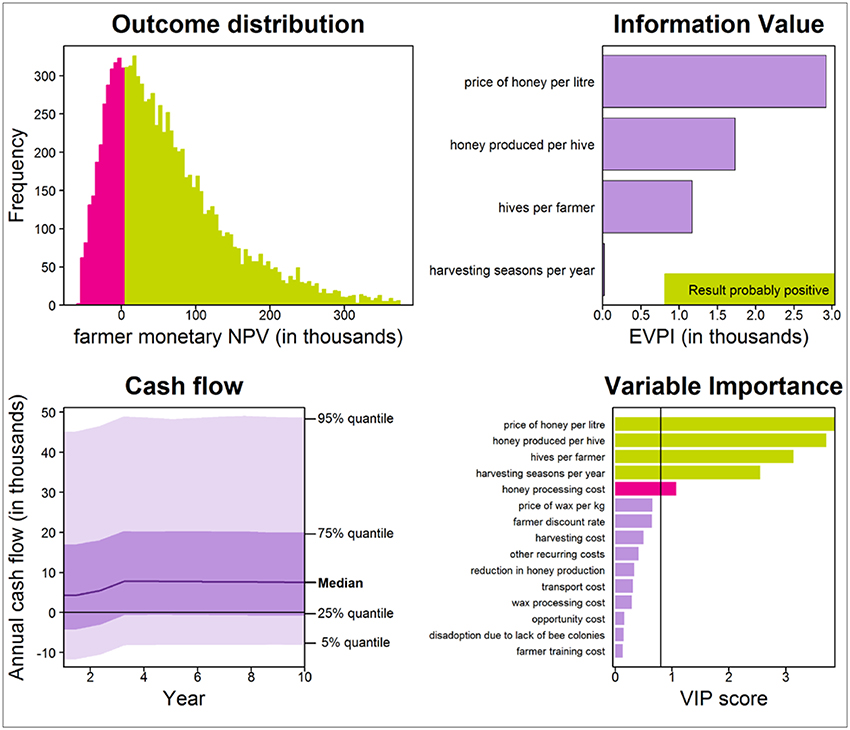
Figure 4. Projected outcome distribution (top left), high-value variables (EVPI; top right), project cash flow (bottom left) and important variables (determined by PLS regression; bottom right) for a farmer practicing beekeeping in Witu, Kenya. Results were produced through Monte Carlo simulation (with 10,000 model runs) of project performance over 10 years. Red and green bars in the outcome distribution indicate positive and negative values, respectively. In the PLS plot, green bars indicate positive correlations of uncertain variables with the outcome variable, while red bars indicate negative correlations.
The honey price, the amount of honey produced per hive, the number of hives per farmer, the number of harvesting seasons per year and the honey processing cost were the most important variables according to the PLS analysis. The distribution of total farmer NPV, including indirect benefits from beekeeping, e.g. through improved pollination of crops, had a median of Ksh 72 thousand, with a 90% confidence interval of Ksh-30–251 thousand.
Since both positive and negative farmer outcomes appeared plausible according to the simulation results, the EVPI analysis indicated that additional information about four variables could potentially change the recommendation emerging from the SIE process. These were the honey price, with a value of information of about Ksh 2750, followed by honey production per hive (Ksh 1750), the number of hives per farmer (Ksh 1250) and the number of harvesting seasons per year (Ksh 50).
The distribution of the projected NPV for the project in Witu had a median of Ksh 36 million, with 90% confidence that the actual NPV for the project lay within the range of Ksh-14–150 million. The model responded most sensitively to the amount of honey produced per hive. Seven other variables also had important impact on projected outcome values (Figure 5).
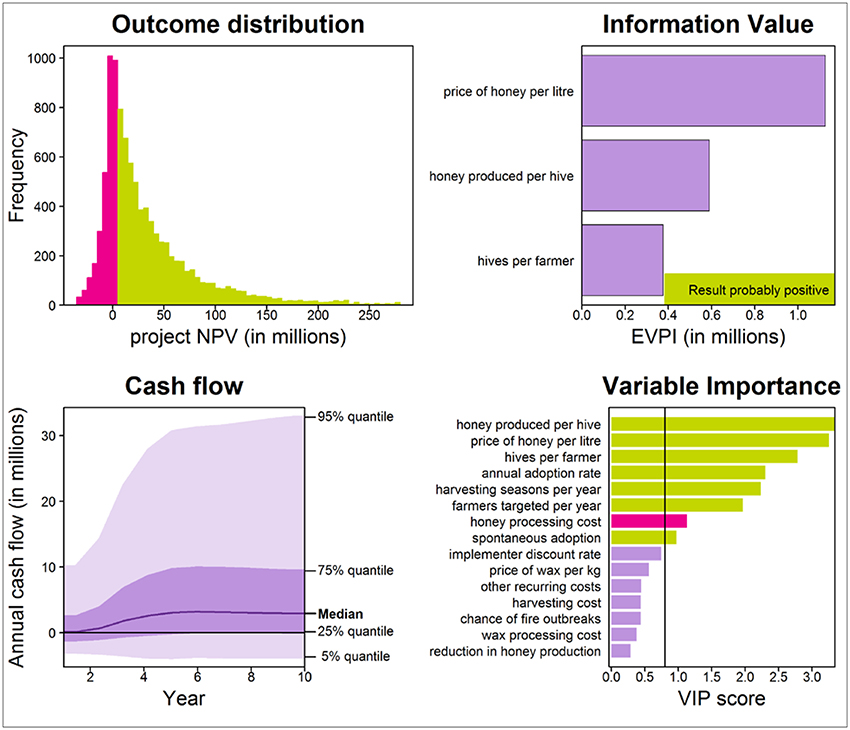
Figure 5. Projected outcome distribution (top left), high-value variables (EVPI; top right), project cash flow (bottom left) and important variables (determined by PLS regression; bottom right) for the overall project in Witu, Kenya. Results were produced through Monte Carlo simulation (with 10,000 model runs) of project performance over 10 years. Red and green bars in the outcome distribution indicate positive and negative values, respectively. In the PLS plot, green bars indicate positive correlations of uncertain variables with the outcome variable, while red bars indicate negative correlations.
The distribution of projected decision outcomes included both positive and negative outcomes, and additional information on some individual uncertain variables had potential to change the decision recommendation. EVPI analysis indicated that information on the honey price in Witu was the most valuable to the project implementers, with a value of about Ksh 1.1 million. The amount of honey produced per hive (Ksh 0.6 million) and the number of hives per farmer (Ksh 0.4 million) were also of value to the project implementers.
Awer Community
In Awer, the distribution of projected average monetary income per farmer practicing beekeeping had a median of Ksh 130 thousand per year, with 90% confidence that the actual value lay within the range of Ksh 1.5–340 thousand per year. The chance of loss for a farmer in this region was 4.6%. Total farmer NPV including non-monetary benefits had a median of Ksh 140 thousand with a 90% confidence interval of Ksh 7.2–340 thousand. The price of honey was identified as the most uncertain variable by the PLS analysis, alongside five other variables (Figure 6).
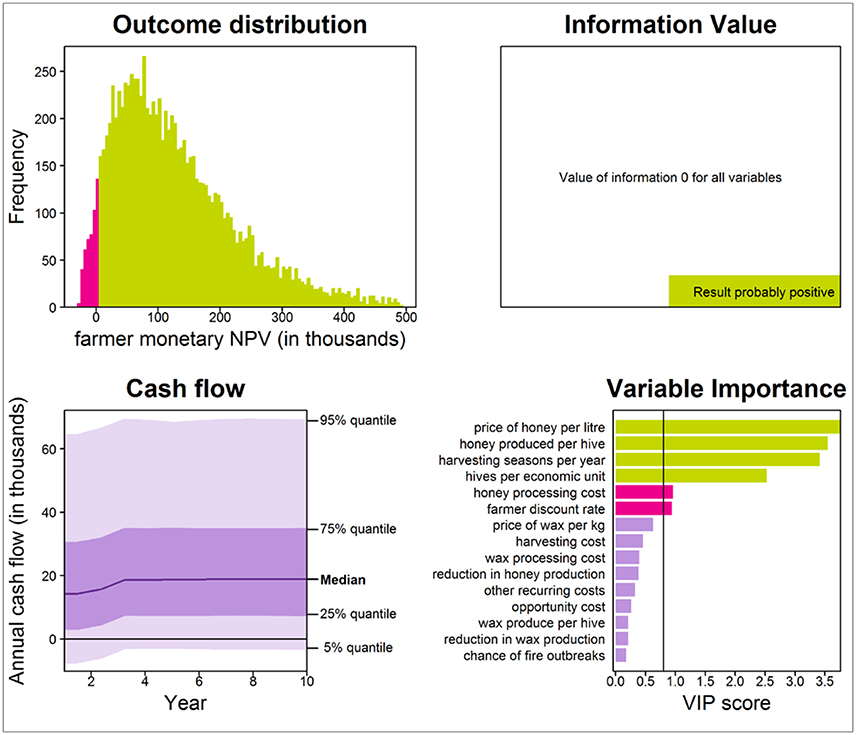
Figure 6. Projected outcome distribution (top left), high-value variables (EVPI; top right), project cash flow (bottom left) and important variables (determined by PLS regression; bottom right) for a farmer practicing beekeeping in Awer, Kenya. Results were produced through Monte Carlo simulation (with 10,000 model runs) of project performance over 10 years. Red and green bars in the outcome distribution indicate positive and negative values, respectively. In the PLS plot, green bars indicate positive correlations of uncertain variables with the outcome variable, while red bars indicate negative correlations.
EVPI analysis indicated that none of the variables had any information value for the farmer. This meant that, if the NPV was the main criterion for evaluating the attractiveness of the HVC intervention, then farmers would be well-advised to engage in beekeeping, and no additional information on any of the variables would change this recommendation.
The overall project NPV had a median of Ksh 38 million per year, with 90% confidence that the actual value lay within the range of Ksh-0.9–120 million. PLS analysis indicated that the honey price was the most uncertain variable in the projection of project NPV in Awer (Figure 7). Although PLS indicated that projected project outcomes responded to variation in a number of variables, no additional information on any of these variables had the potential to change the recommendation that the project implementer should invest in honey value chains in the region.
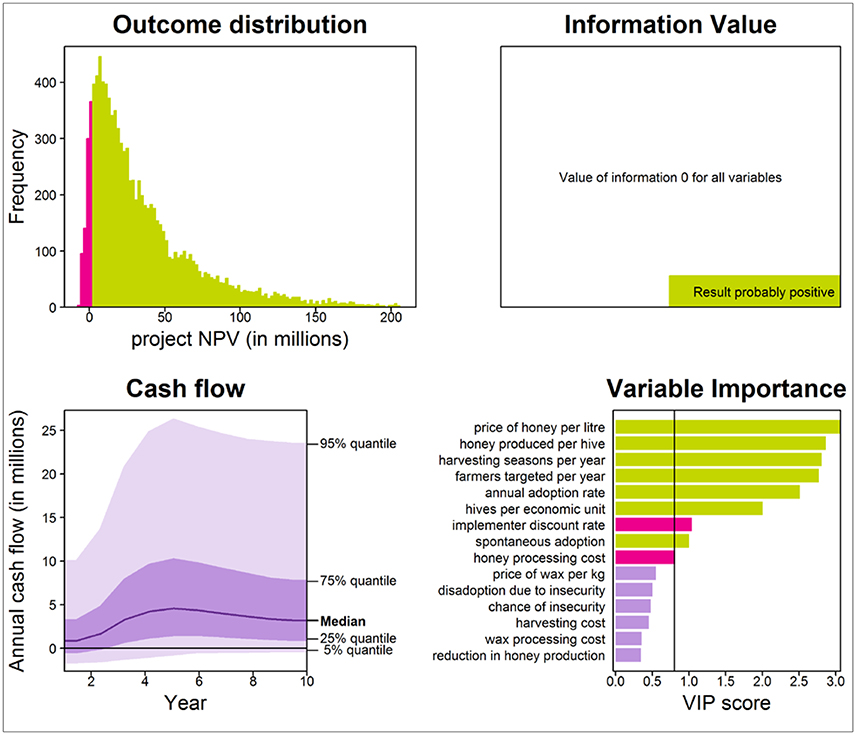
Figure 7. Projected outcome distribution (top left), high-value variables (EVPI; top right), project cash flow (bottom left) and important variables (determined by PLS regression; bottom right) for the overall project in Awer, Kenya. Results were produced through Monte Carlo simulation (with 10,000 model runs) of project performance over 10 years. Red and green bars in the outcome distribution indicate positive and negative values, respectively. In the PLS plot, green bars indicate correlations of uncertain variables with the outcome variable, while red bars indicate negative correlations.
Discussion
Beekeeping is a high-risk, high-return venture that requires a well thought-out project design to maximize returns [20]. Introduction of the HVC intervention as an economic incentive for rural communities along the Kenya-Somalia border to conserve the environment may generate significant impact in terms of raising income (average of Ksh 65 thousand per farmer for Witu and Ksh 130 thousand per farmer for Awer). However, the success of this intervention, especially for regions such as Witu, requires close monitoring by the implementing agency to minimize the chance of loss (24%).
In Witu, the most critical variable was the price of honey, which individual beekeepers have relatively little influence on. Current honey price, based on the baseline survey, is within the range of 3–7 hundred Ksh per liter. At this price, returns may be too low for a farmer who pursues beekeeping as the only source of income. For a farmer who invests in beekeeping as a supplementary source of income, the current honey price looks promising. Analyzing the impact of different factors that may affect the honey price in the future, e.g., packaging, honey quality, access to formal markets and exploitation by middlemen, will provide useful information to support farmers' decisions on investments in honey value chains. The amount of honey produced per hive is also a critical variable to farmers in Witu (Figure 4). Since productivity is a function that depends on many factors, such as good apiary management, access to extension services, technology deployed and bee forage availability, studies on these factors promise to reduce decision uncertainty for farmers. Modifications to the original project design that address the influence of these variables on the farmer NPV could reduce the chance of losses for beekeepers.
Most model runs for project NPV in Witu indicate a positive outcome, although there is still a chance (23%) of not achieving the goal of raising incomes for farmers in the region. This is because beekeeping is a relatively new venture for most farmers. The value chain is not well developed and a lot of investment has to go into farmer training to increase productivity. The honey price, the amount of honey produced per hive and the number of hives per farmer are the most critical variables for the project implementer. It is therefore important for the implementer to work with farmers to acquire more information on these variables and how they will influence their respective NPVs.
In Awer, the HVC intervention can increase monetary income for beekeepers by about Ksh 48 thousand based on the baseline survey. This is slightly higher than in Witu (Ksh 26 thousand), but this is expected, since most farmers in the region were already practicing beekeeping. The project plan to support existing traditional beekeeping methods, establish a honey collection center and support value addition activities such as packaging, branding and processing of other bee products, was likely to be more effective in raising incomes, since it would focus on bridging gaps in the chain. In Witu, the focus is on introducing the HVC to the region.
The EVPI analysis indicated that no additional information on any of the variables could change the recommendation that farmers should invest in beekeeping (Figure 6). This is not surprising, since the region is characterized by high honey productivity and well-defined markets. The overall project NPV in Awer suggests that introducing HVC is economically viable, even when fully considering the cost incurred by the implementing agency (Figure 7). The effort to improve certainty on the business case may not influence the decision to invest in HVC, since no additional information on any of the variables had value to the decision-maker.
Impact of the Intervention on Biodiversity Conservation Efforts
Biodiversity conservation is linked to income from beekeeping, because conserving the surrounding forests provides flowers for bees to forage on, thus ensuring high honey productivity throughout the year. However, raising incomes for communities within conservation areas, which is the goal of the HVC intervention, does not necessarily mean that these communities will conserve biodiversity [21]. Therefore, for IGAD-BMP to maximize its impact in terms of biodiversity conservation, the program must ensure that rural communities not only generate sustainable incomes from honey production, but also perceive relationships between these incomes and biodiversity conservation, i.e., that high honey production correlates with success in preserving biodiversity. A study on how increased incomes from honey value chain interventions would affect biodiversity conservation outcomes could produce valuable information on the prospective impacts of the intervention on biodiversity conservation.
Recommendations for Project Monitoring
Although the intervention looks promising, a few areas need to be monitored to reduce the chance of negative outcomes. In Witu, the price of honey has to be monitored to ensure farm gate prices can provide sufficient income to bee-keeping farmers. To reduce the chance of negative outcomes as a result of low farm gate prices, there is a need to link farmers to formal markets, promote collective marketing and invest in value addition. The amount of honey produced per hive should also be monitored, since it is critical in determining whether farmers investing in HVCs are likely to reap net benefits. Adequate farmer training and mitigation of risks, such as theft, land conflicts and fire outbreaks, will help reduce the chance of farmers abandoning honey production. Further, there is a need to identify the minimum number of hives per farmer that would provide substantial increase in income. The implementing agency would then focus on ensuring that most of the farmers have this minimum number to motivate them to continue contributing to HVCs.
In Awer, not much can be done in terms of project monitoring to reduce negative outcomes, since the chance of such negative outcomes was very low. However, the implementing agency can focus on monitoring how these positive outcomes affect biodiversity conservation efforts. There are no clear linkages between increase in income and biodiversity conservation. Clarifying and generating awareness on these linkages, e.g., through research and education on the need to conserve biodiversity to increase honey production, will help the implementing agency to better understand—as well as enhance the impact of—the project on biodiversity conservation.
Future Application of the SIE Approach
The costs, benefits and risks of biodiversity-based value chains, and agricultural interventions in general, typically have high levels of uncertainty, especially when considering the long-term and off-site effects of proposed interventions. In light of these uncertainties, the single most important task facing agricultural intervention planners is perhaps to determine the best way to make decisions [22]. Uncertainties and risks have to be quantified, policy preferences clarified and priority measurements for supporting their decisions identified.
The SIE approach can provide plausible solutions to this. The first critical step in the SIE process is to clearly define the decision to be taken. This step often does not receive sufficient attention [23], but it is instrumental in understanding what has to be measured. In this analysis, we spent about 30% of the entire effort on clarifying questions such as whether the implementing agency would cater for the full project implementation cost or whether these costs would be shared with farmers, who would be the actual beneficiaries of the project and whether the implementer was interested in return on investment. Clarifying these questions early in the implementation planning process enabled IGAD-BMP stakeholders to easily identify relevant benefits, costs, risks and external factors that would affect project performance.
The SIE approach allowed identification and prioritization of critical uncertainties in the project. Variables prioritized for further measurement in one of the regions (Witu) appeared easy to quantify with small efforts in data collection. In the other region (Awer), no measurements on any of the variables would change recommendations to farmers and the implementing agency to invest in HVCs. This demonstrates that the SIE approach has potential to substantially enhance the cost effectiveness of decision-supporting measurement campaigns for agricultural intervention planners. The approach presents a clear business case for or against investment in a project where outcomes are uncertain. This can provide critical information to investors aiming to support agricultural interventions with limited resources.
Conclusions
Investment in HVC as an economic incentive to conserve biodiversity requires thorough analysis of investment options to maximize returns to different stakeholders. This can be achieved through probabilistic stakeholder-disaggregated outcome projections for biodiversity-based value chain interventions. Clarifying the decision question turned out to be critical for the decision making process. This greatly facilitated the development of a decision's impact pathway, which could then be easily converted into a quantitative decision outcome projection model.
Tailoring interventions to meet economic, social and environmental requirements of rural communities is very important, so decision-makers need approaches that allow holistic ex-ante analysis of investment options. The cost-benefit and risk analyses for biodiversity-based value chains should consider all factors that are relevant for the implementation of the decision, even those that initially appear “intangible” or for which no data are available. Incorporation of local and expert knowledge into decision making using the SIE framework can significantly improve the quality of decisions.
Value of Information analysis can provide indications of what needs to be measured to support intervention decisions. While many uncertainties usually exist in all decisions that affect complex systems, only those uncertainties that are of value to the decision maker should be prioritized for further measurement. This can substantially reduce the cost of data collection aimed at informing decisions.
Study Ethical Approval and Consent
The analysis relied on information obtained from literature review, key informants and subject matter experts. This did not require ethical approval as per institutional and national guidelines, but a written and informed consent was obtained from key informants and subject matter experts. The baseline survey outcome in the study background was generated from an open access dataset, where the data was properly anonymized [24]. Written and informed consent was also obtained from all survey participants at the time of original data collection.
Author Contributions
JW: The first author. YK: Contributed to the decision model development. YT: Contributed to the decision model development. GM: Contributed to the decision model development. CM: Contributed to the decision model development. GK: Contributed to the designing of the questionnaire for the baseline survey. Also provided insights on implementation of biodiversity based value chains. JD: Provided expertise on impact of biodiversity based value chains. Also contributed to the editing of the manuscript before submission. JN: Provided vital insights in the framing of the investment decision. Also contributed to the variable estimation process. KS: Provided expertise in decision modeling. EL: Provided expertise in decision modeling and reviewed the manuscript before submission. Also provided insights on the future application of the SIE approach.
Conflict of Interest Statement
The authors declare that the research was conducted in the absence of any commercial or financial relationships that could be construed as a potential conflict of interest.
Acknowledgments
We acknowledge funding by IGAD's Biodiversity Management Program (IGAD-BMP) and the continuous support of the CGIAR Research Program on Water Land and Ecosystems (WLE). We also appreciate the support accorded to us by the International Centre of Insect Physiology and Ecology (icipe) through the African Reference Laboratory for Bee Health, led by Suresh Raina. We acknowledge the input by established beekeepers in Mwingi, who provided valuable insights to the modeling team. We also appreciate local communities in Witu and Awer for taking their time to answer questions during the baseline survey.
Supplementary Material
The Supplementary Material for this article can be found online at: https://www.frontiersin.org/articles/10.3389/fams.2018.00006/full#supplementary-material
References
1. Carwardine J, O'Connor T, Legge S, Mackey B, Possingham HP, Martin TG. Prioritizing threat management for biodiversity conservation. Conserv Lett. (2012) 5:196–204. doi: 10.1111/j.1755-263X.2012.00228.x
2. De Leeuw J, Carsan S, Koech G, Yayé AD, Josephat N. A Review of Best Practices for selected biodiversity value chains that promote pro-poor conservation in the Horn of Africa. Nairobi: The World Agroforestry Centre (ICRAF) (2017).
3. Agera SIN. Role of beekeeping in the conservation of forests. Global J Agric Sci. (2011) 10:27–32.
4. Figueiredo HS, Meuwissen MPM, Van der Lans IA, Oude Lansink AGJM. Identifying successful strategies for honey value chains in Brazil: a conjoint study. Br Food J. (2016) 118:1800–20. doi: 10.1108/BFJ-01-2016-0026
5. Uaiene R, Arndt C, Masters W. Determinants of agricultural technology adoption in Mozambique. In: National Directorate of Studies and Policy Analysis. Maputo: Ministry of Planning and Development, Republic of Mozambique (2009). p. 1–31.
6. Arzberger P, Schroeder P, Beaulieu A, Bowker G, Casey K, Laaksonen L, et al. Promoting access to public research data for scientific, economic, and social development. Data Sci J. (2004) 3:135–52. doi: 10.2481/dsj.3.135
7. Peterman RM, Anderson JL. Decision analysis: a method for taking uncertainties into account in risk-based decision making. Hum Ecol Risk Assess Int J. (1999) 5:231–44. doi: 10.1080/10807039991289383
8. Luedeling E, Oord AL, Kiteme B, Ogalleh S. Malesu M, Shepherd KD, et al. Fresh groundwater for Wajir—ex-ante assessment of uncertain benefits for multiple stakeholders in a water supply project in Northern Kenya. Front Environ Sci. (2015), 3:16. doi: 10.3389/fenvs.2015.00016
9. Hubbard DW. How to Measure Anything: Finding the Value of Intangibles in Business. Hoboken, NJ: Wiley (2014).
11. Hubbard D. Applied information economics : a new method for quantifying IT value an executive overview. Dec Anal. (2004) 6.
12. Koops MA. Reliability and the value of information. Anim Behav. (2004) 67:103–11. doi: 10.1016/j.anbehav.2003.02.008
13. Thabrew L, Wiek A, Ries R. Environmental decision making in multi-stakeholder contexts: applicability of life cycle thinking in development planning and implementation. J Clean Prod. (2009) 17:67–76. doi: 10.1016/j.jclepro.2008.03.008
14. Luedeling E, Göhring L. decisionSupport: Quantitative Support of Decision Making under Uncertainty, CRAN archive. Available online at: https://cran.r-project.org/web/packages/decisionSupport/ (2017).
15. Core Team R. R: A Language and Environment for Statistical Computing. Vienna: R Foundation for Statistical Computing (2017).
16. Velez-Pareja I. Including the risk in the analysis: montecarlo simulation (Análisis De Inversiones Bajo Riesgo: Simulación). Soc Sci Res Netw. (2007). doi: 10.2139/ssrn.986972
17. Rosenstock TS, Mpanda M, Rioux J, Aynekulu E, Kimaro AA, Neufeldt H, et al. Targeting conservation agriculture in the context of livelihoods and landscapes. Agric Ecosyst Environ. (2014) 187:47–51. doi: 10.1016/j.agee.2013.11.011
18. Chen Y, Yang Y, Luo J. Uncertainty analysis of coalbed methane economic assessment with montecarlo method. Pro Environ Sci. (2012) 12:640–5. doi: 10.1016/j.proenv.2012.01.329
19. Wold S, Sjöström M, Eriksson L. PLS-regression: a basic tool of chemometrics. In: Chemometr Intell Lab Syst. (2001) 58:109–30. doi: 10.1016/S0169-7439(01)00155-1
20. Mujuni A, Natukunda K, Kugonza DR. Factors affecting the adoption of beekeeping and associated technologies in Bushenyi District, Western Uganda. Livestock Res Rural Dev. (2012) 24.
21. Adams WM. Biodiversity conservation and the eradication of poverty. Science (2004) 306:1146–9. doi: 10.1126/science.1097920
22. Lindenmayer DB, Gibbons P, Bourke M, Burgman M, Dickman CR, Ferrier S, et al. Improving biodiversity monitoring. Aust Ecol. (2012) 37:285–94. doi: 10.1111/j.1442-9993.2011.02314.x
23. Rosenzweig P. What Makes Strategic Decisions Different. Boston, MA: Harvard Business Review (2013).
Keywords: value chains, probabilistic projection, decision outcomes, uncertainity, value of information
Citation: Wafula J, Karimjee Y, Tamba Y, Malava G, Muchiri C, Koech G, De Leeuw J, Nyongesa J, Shepherd K and Luedeling E (2018) Probabilistic Assessment of Investment Options in Honey Value Chains in Lamu County, Kenya. Front. Appl. Math. Stat. 4:6. doi: 10.3389/fams.2018.00006
Received: 15 December 2017; Accepted: 09 March 2018;
Published: 27 March 2018.
Edited by:
José Roberto Cantú-González, Universidad Autónoma de Coahuila, MexicoReviewed by:
Maria Elena De Giuli, University of Pavia, ItalyBarret Pengyuan Shao, Independent Researcher, United States
Copyright © 2018 Wafula, Karimjee, Tamba, Malava, Muchiri, Koech, De Leeuw, Nyongesa, Shepherd and Luedeling. This is an open-access article distributed under the terms of the Creative Commons Attribution License (CC BY). The use, distribution or reproduction in other forums is permitted, provided the original author(s) and the copyright owner are credited and that the original publication in this journal is cited, in accordance with accepted academic practice. No use, distribution or reproduction is permitted which does not comply with these terms.
*Correspondence: Joshua Wafula, am9rdW11NTZAeWFob28uY29t
 Joshua Wafula
 Yusuf Karimjee1
 Geoffrey Malava
 Caroline Muchiri
 Grace Koech
 Keith Shepherd
 Eike Luedeling