 Waverly Davis
 Larissa Bailey
 F. Boyd Wright III
- 1Department of Fish, Wildlife, and Conservation Biology, Colorado State University, Fort Collins, CO, United States
- 2Colorado Department of Natural Resources, Division of Parks and Wildlife, Fort Collins, CO, United States
Introduction: Efficient and effective monitoring is essential for informing conservation efforts and determining where to focus management actions. Newly arriving invasive and declining native taxa are often the focus of conservation programs, but these species are inherently difficult to monitor and detect. A key challenge to effective monitoring is when a species is present at a location but goes undetected, creating uncertainty about whether the species is truly absent or present but unobserved. Estimating detection improves the efficacy of monitoring methods and accurately informs conservation efforts.
Methods: In this study, we applied occupancy modeling to estimate method-specific detection probabilities for two focal amphibian species: the native northern leopard frog (Lithobates pipiens) and invasive American bullfrog (Lithobates catesbeianus). We evaluated three monitoring techniques: automated acoustic recorders, eDNA, and visual encounter surveys at 38 breeding sites in Colorado’s South Platte River Basin, USA, an area where northern leopard frogs are declining, and bullfrogs are expanding. We investigated how local environmental conditions (temperature and pH) and survey-specific choices (survey date, number of observers, search time, and liters of filtered water) influenced detection probabilities for each species and method.
Results: Our results showed that northern leopard frog detection probability increased slightly with longer visual search times and eDNA detection probability was highest in neutral pH conditions. Acoustic detection of northern leopard frog breeding calls peaked in early spring. For bullfrogs, eDNA detection improved with liters of filtered water and both eDNA and visual detection increased with water temperature. Bullfrog breeding call detection was highest in mid to late summer.
Discussion: Northern leopard frog and bullfrog distinct life history traits related to breeding habitat preferences, behaviors, and seasonal emergence explained differences in their detection probabilities.
1 Introduction
Conservation efforts rely on efficient and effective monitoring programs to address management objectives and differentiate among a priori hypotheses about factors influencing the system of interest. Importantly, for most wild vertebrate species, monitoring programs must address both variation in species’ detectability and spatial sampling to achieve unbiased estimates of target state variables (e.g., species distribution). Many researchers have criticized monitoring programs for their failure to state clear objectives and inadequate attention to sources of bias such as variation in detectability (Mattfeldt et al., 2009; Nichols and Williams, 2006; Yoccoz et al., 2001). Imperfect detection occurs when the species is present at the site but goes undetected during the survey, creating uncertainty in whether the species was present and undetected, or truly absent (MacKenzie et al., 2002). Unmodeled variation in species detection across space (e.g., locations) or time can bias monitoring state variables. In a recent review, Bennett et al. found that only 6% of scientific studies published detection estimates for declining taxa in the U.S., emphasizing the need to estimate detectability among species (Bennett et al., 2024). Accordingly, guidance on how to maximize detection probability and thus minimize bias in resulting state variables is essential but oftentimes lacking in monitoring programs. Additionally, early detection of invasive species is paramount to successful management or containment during a period when invasive densities are low (Prior et al., 2018). Thus, estimating distributional metrics for both declining species and colonizing invasive species is challenging and prone to detection bias.
Commonly used population metrics such as abundance, survival, reproduction, and population growth require identification of unique individuals, which is especially challenging for declining or invasive species. Occupancy is a favored state variable in these cases because it does not require individual identification and can provide insight into spatial and temporal patterns of species occurrence and persistence. Although occupancy can be defined numerous ways depending on research objectives, it commonly denotes the proportion of sites occupied by a focal species. Contemporary occupancy models allow investigators to decouple the state variable (occupancy or species occurrence) from the observational process (i.e., detection probability, given occurrence). Studies that incorporate occupancy estimation and modeling have been used to identify priority areas for conservation initiatives, evaluate management decisions, and understand biases in detection probabilities (Moor et al., 2022; Ribeiro et al., 2022; Steenweg et al., 2019).
Since MacKenzie et al.’s seminal paper describing occupancy modeling (MacKenzie et al., 2002), an occupancy framework has been commonly applied to amphibians and other cryptic species to understand species distributions, evaluate conservation priorities, and investigate detection biases (Bailey et al., 2019; Gould et al., 2012; Petitot et al., 2014). Worldwide, over 40% of amphibian species are imperiled (Luedtke et al., 2023) and northern leopard frogs (Lithobates pipiens) are a classic example: historically one of the most widespread frogs in North America, northern leopard frogs have experienced dramatic range reductions in recent decades, specifically in the Intermountain West (Corn and Fogleman, 1984; Johnson et al., 2011; Rogers and Peacock, 2012). Declines have been attributed to habitat alteration (Johnson et al., 2011), disease (Voordouw et al., 2010), and the invasive American bullfrog (Lithobates catesbeianus) (Rogers and Peacock, 2012). In the western part of the northern leopard frog range, invasive bullfrogs threaten leopard frog persistence through their role as a predator and disease reservoir (Ficetola et al., 2007). Conservation concerns have led to regional programs with monitoring initiatives targeting northern leopard frogs and bullfrogs, but these initiatives have been hampered by a lack of clear objectives, sporadic efforts, and different survey approaches with varying levels of success. In recent years, growing support for coordinated conservation actions addressing northern leopard frog declines in the Intermountain West has highlighted a need for better monitoring programs. Many potential conservation decisions rely on knowledge of the locations and local abundance of remaining northern leopard frog populations and recently established invasive bullfrog populations, which are discerned through our ability to detect these species (Bennett et al., 2024). Hence, estimating detectability and incorporating estimates into these decisions is vital to allocate survey effort, improve management outcomes, and evaluate the effectiveness of any chosen conservation action (Bennett et al., 2024).
Our research focused on estimating species-specific detection probability and understanding the factors that influence detection using different survey methods. Specifically, we assessed the efficacy of three detection methods – environmental DNA collection (eDNA), visual encounter surveys (VES) and automated acoustic recorders (AAR) – for two focal amphibians: native northern leopard frogs and invasive bullfrogs. These three survey methods are commonly employed for a variety of amphibian taxa, and each has its own strengths. Benefits of eDNA sampling include its ability to detect low density populations and that it does not require essential species identification skills (Keck et al., 2022; Pilliod et al., 2013). Visual encounter surveys (VES) require observers to search habitat for the species of interest but can identify different life stages, disease, and malformations. Automated acoustic recorders (AAR) passively record amphibian breeding calls and can continuously sample for long periods of time without disturbing potentially fragile habitat (Sugai et al., 2019).
We used detection-nondetection information for both species (northern leopard frogs and bullfrogs) at 38 sites to understand how environmental and survey-specific characteristics affect species- and method-specific detection probabilities (Table 1). We hypothesized that detection probabilities for all three methods would be influenced by environmental factors, some survey-specific considerations, and be associated with species’ distinct life histories and habitat preferences. Subsequently, this information can be used to optimize sampling effort for a given study or monitoring objective(s).
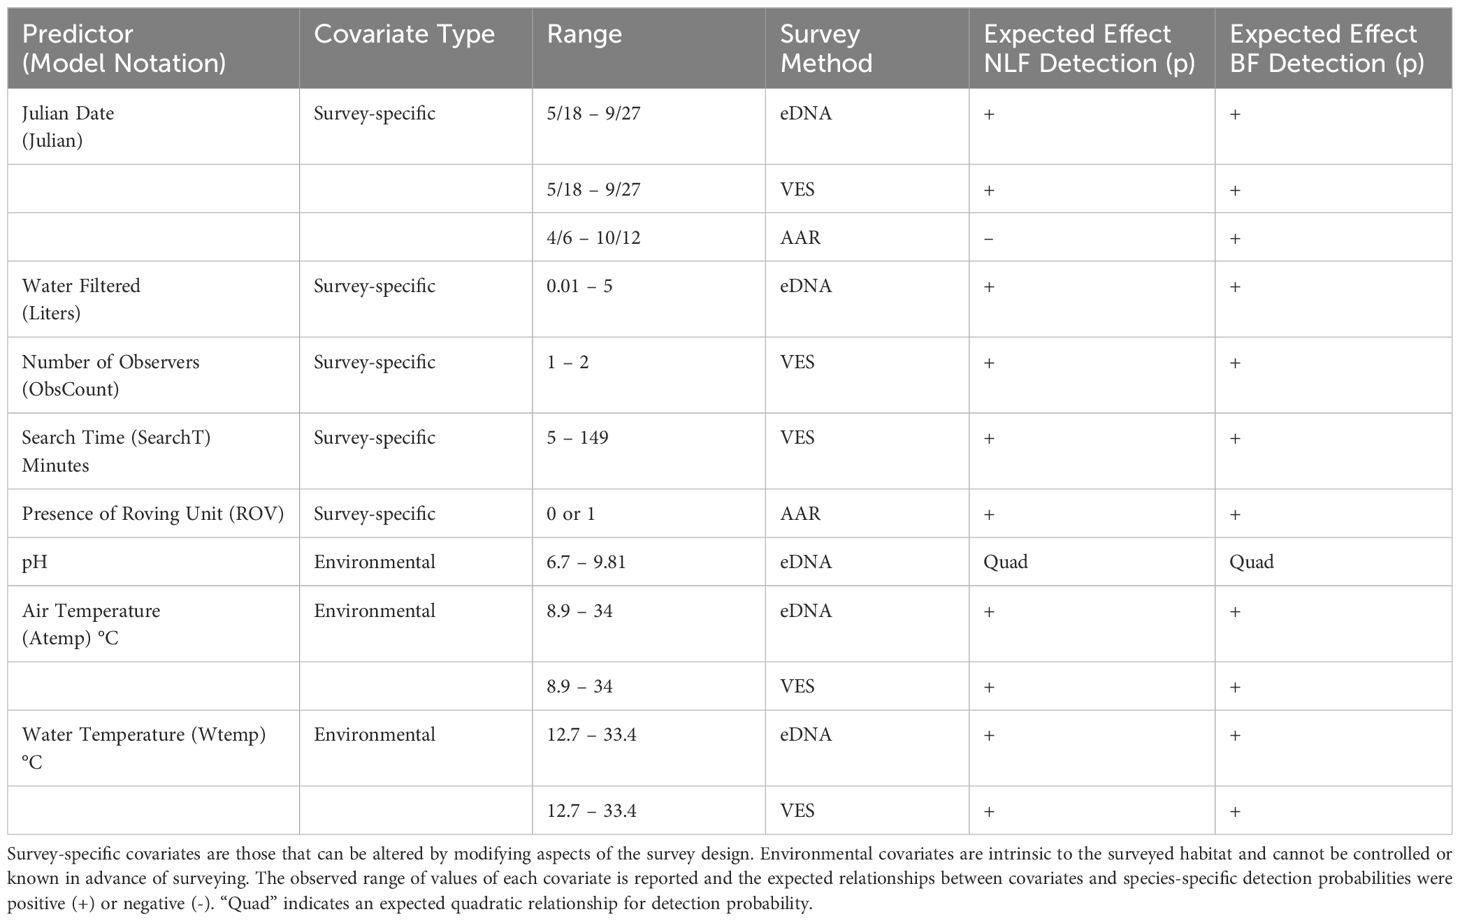
Table 1. Hypothesized effects of covariates on method- and species-specific detection probabilities for northern leopard frogs (NLF; Lithobates pipiens) and American bullfrogs (BF; Lithobates catesbeianus).
2 Materials and methods
2.1 Study system and species
Our study was conducted in the Colorado portion of the South Platte River Basin, USA (Figure 1). To investigate factors influencing species-specific detection probability, we selected sites likely to contain both northern leopard frogs and bullfrogs. Northern leopard frog populations have been documented in the basin, and American bullfrogs are considered widespread (Johnson et al., 2011; Peterson et al., 2013). We compiled northern leopard frog records from local nonprofits, city, state, and county agencies, and Citizen Science platforms. We randomly selected a subset of 38 sites, including lentic and lotic habitats, with observations from at least three decades, including the most recent decade (2011-2021), rationalizing that these sites likely supported one or both of our target species.
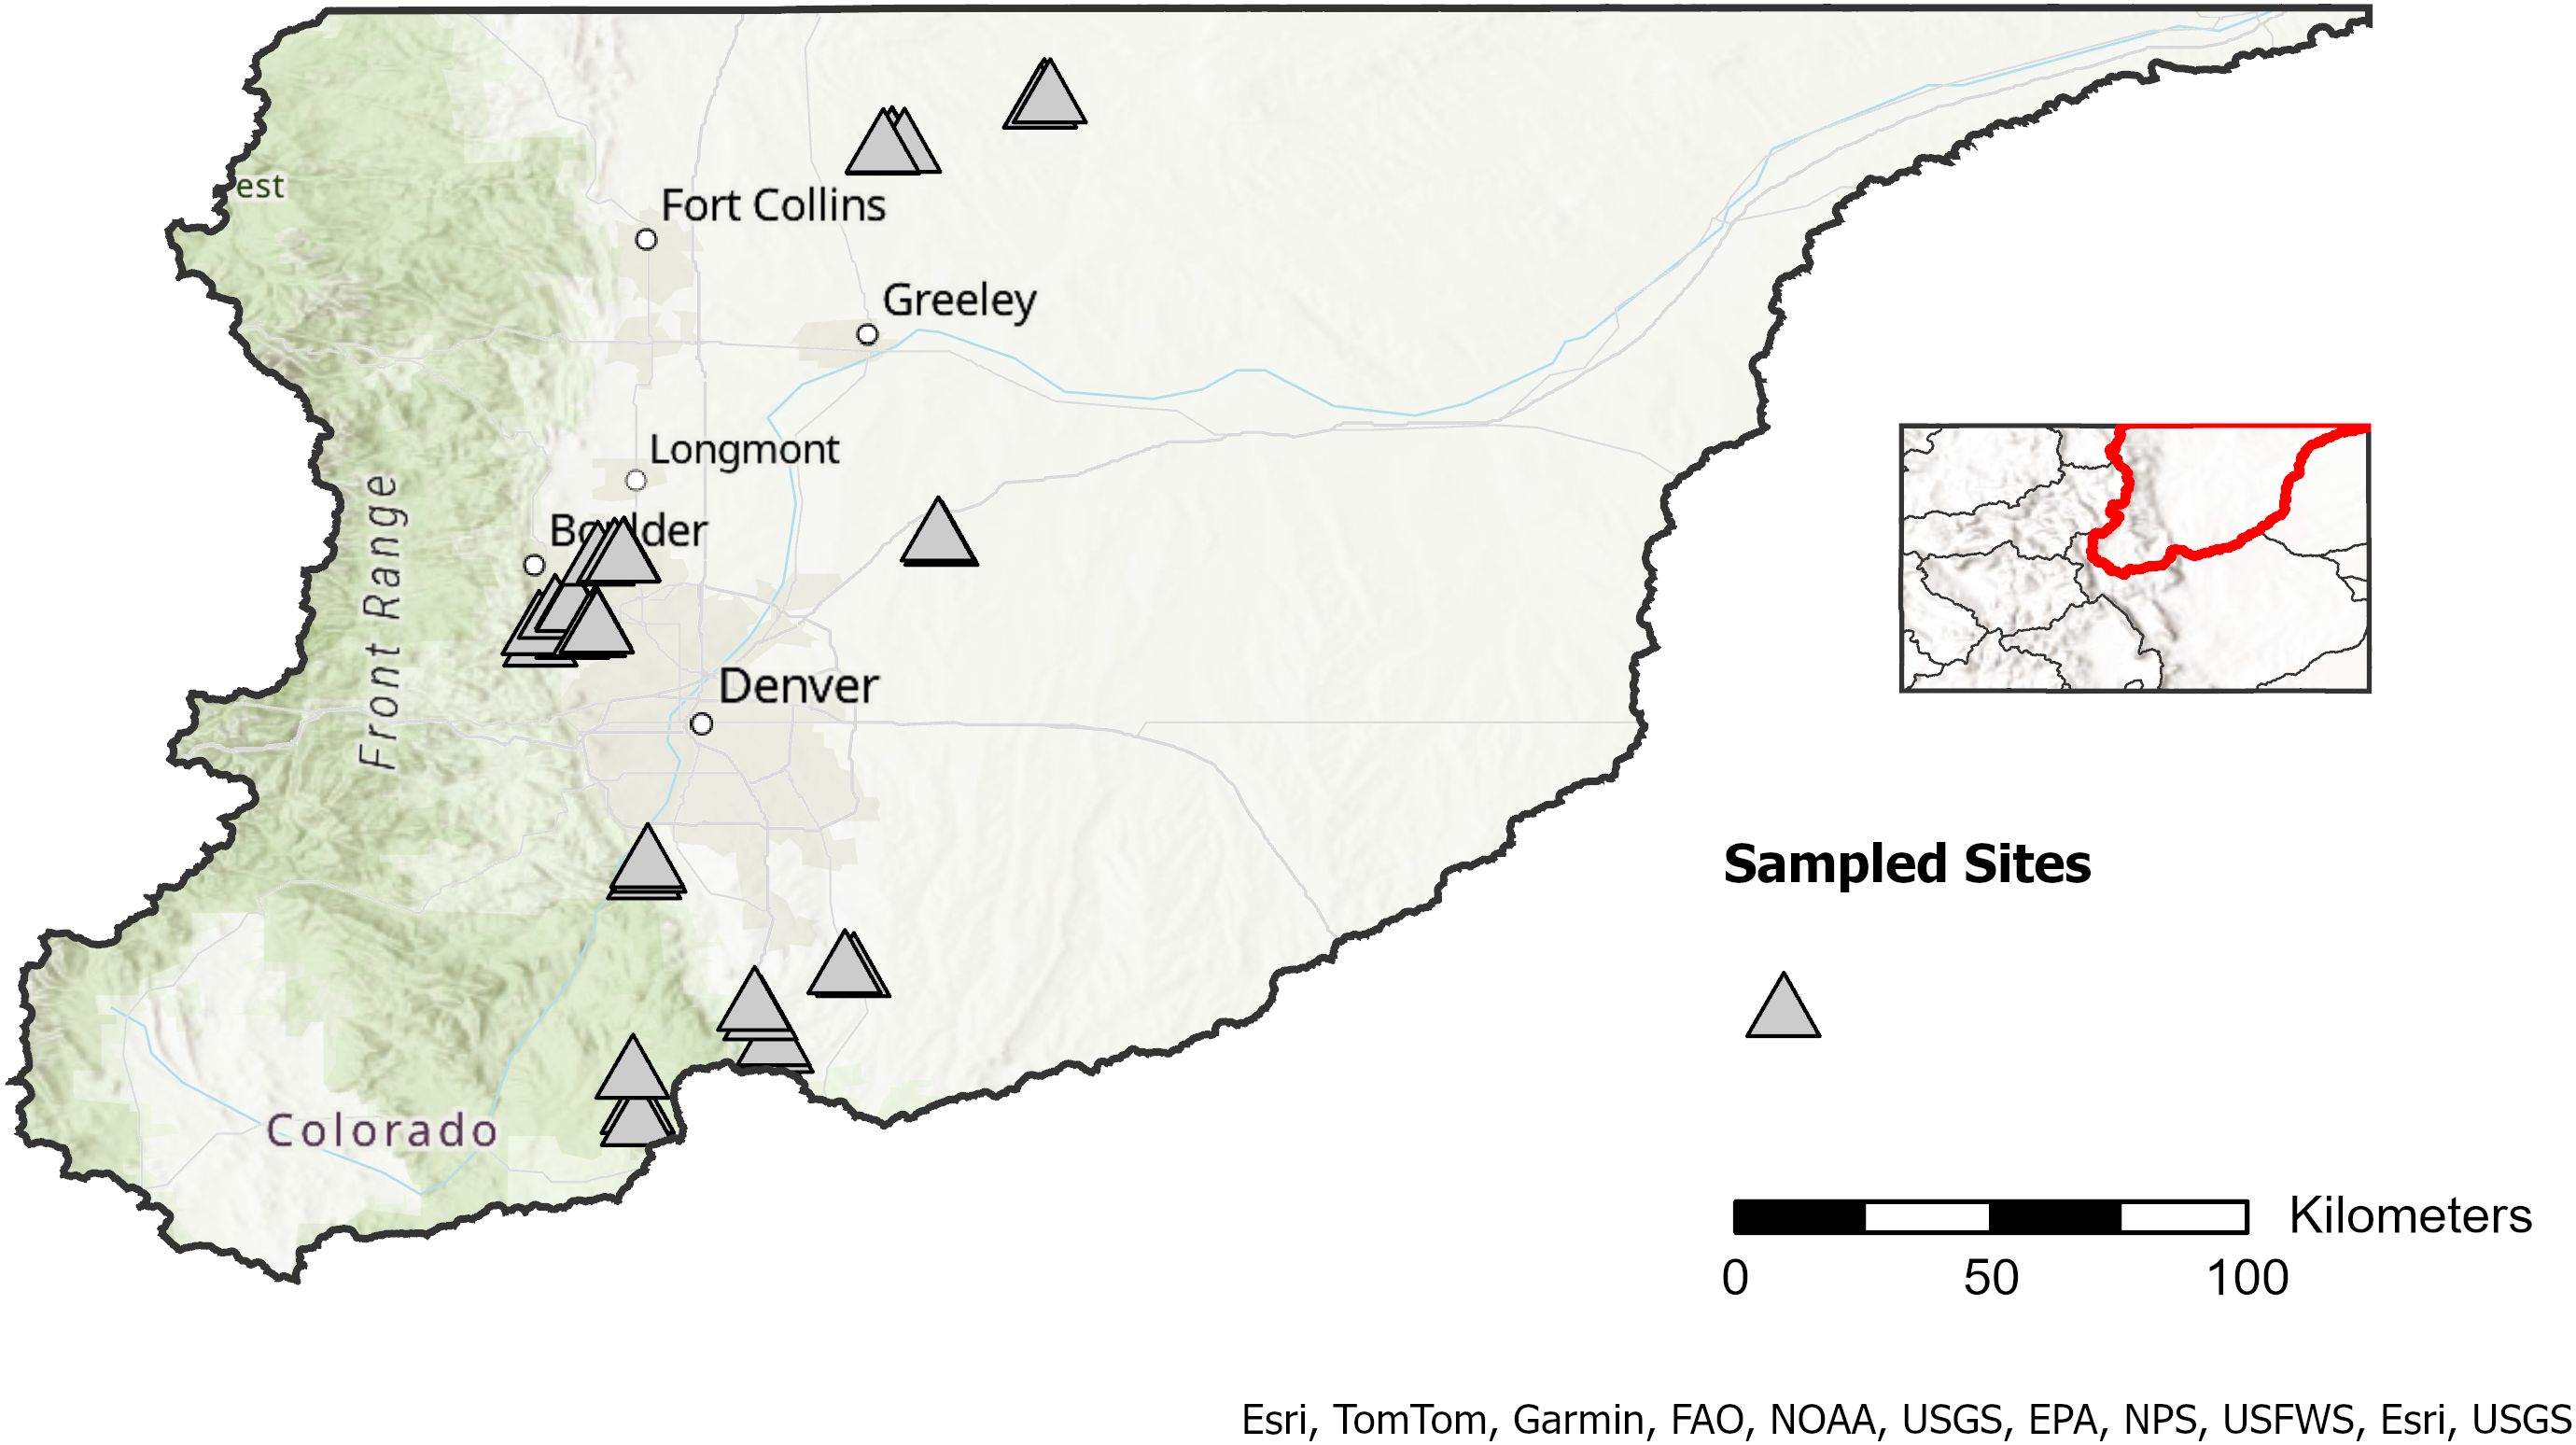
Figure 1. Sampled sites (n=38) in Colorado’s South Platte River Basin, USA. The reference map illustrates the placement of the South Platte River Basin within Colorado. Sites were selected based on occurrence data for northern leopard frogs in the past decade (2011-2021) as well as two previous decades. Watershed boundaries (HUC6) and state outlines were downloaded from the USGS Watershed Boundary Dataset via the National Map Downloader (https://apps.nationalmap.gov/downloader/) accessed December 2024. Basemap imagery is from Esri’s World Topographic Map (© Esri, TomTom, Garmin, FAO, NOAA, USGS, EPA, NPS, USFWS, Esri, USGS).
2.2 Field survey methods
We conducted eDNA and visual encounter surveys (VES) at all selected sites (n=38) and deployed automated acoustic recorders at a subset (n=19), due to equipment limitations. Sites were visited twice in a given year, either in 2022 or 2023. Visits were separated by at least one month and timed to target multiple life stages for each species. During each visit we surveyed up to 500 meters of bank habitat using eDNA and VES (Figure 2).
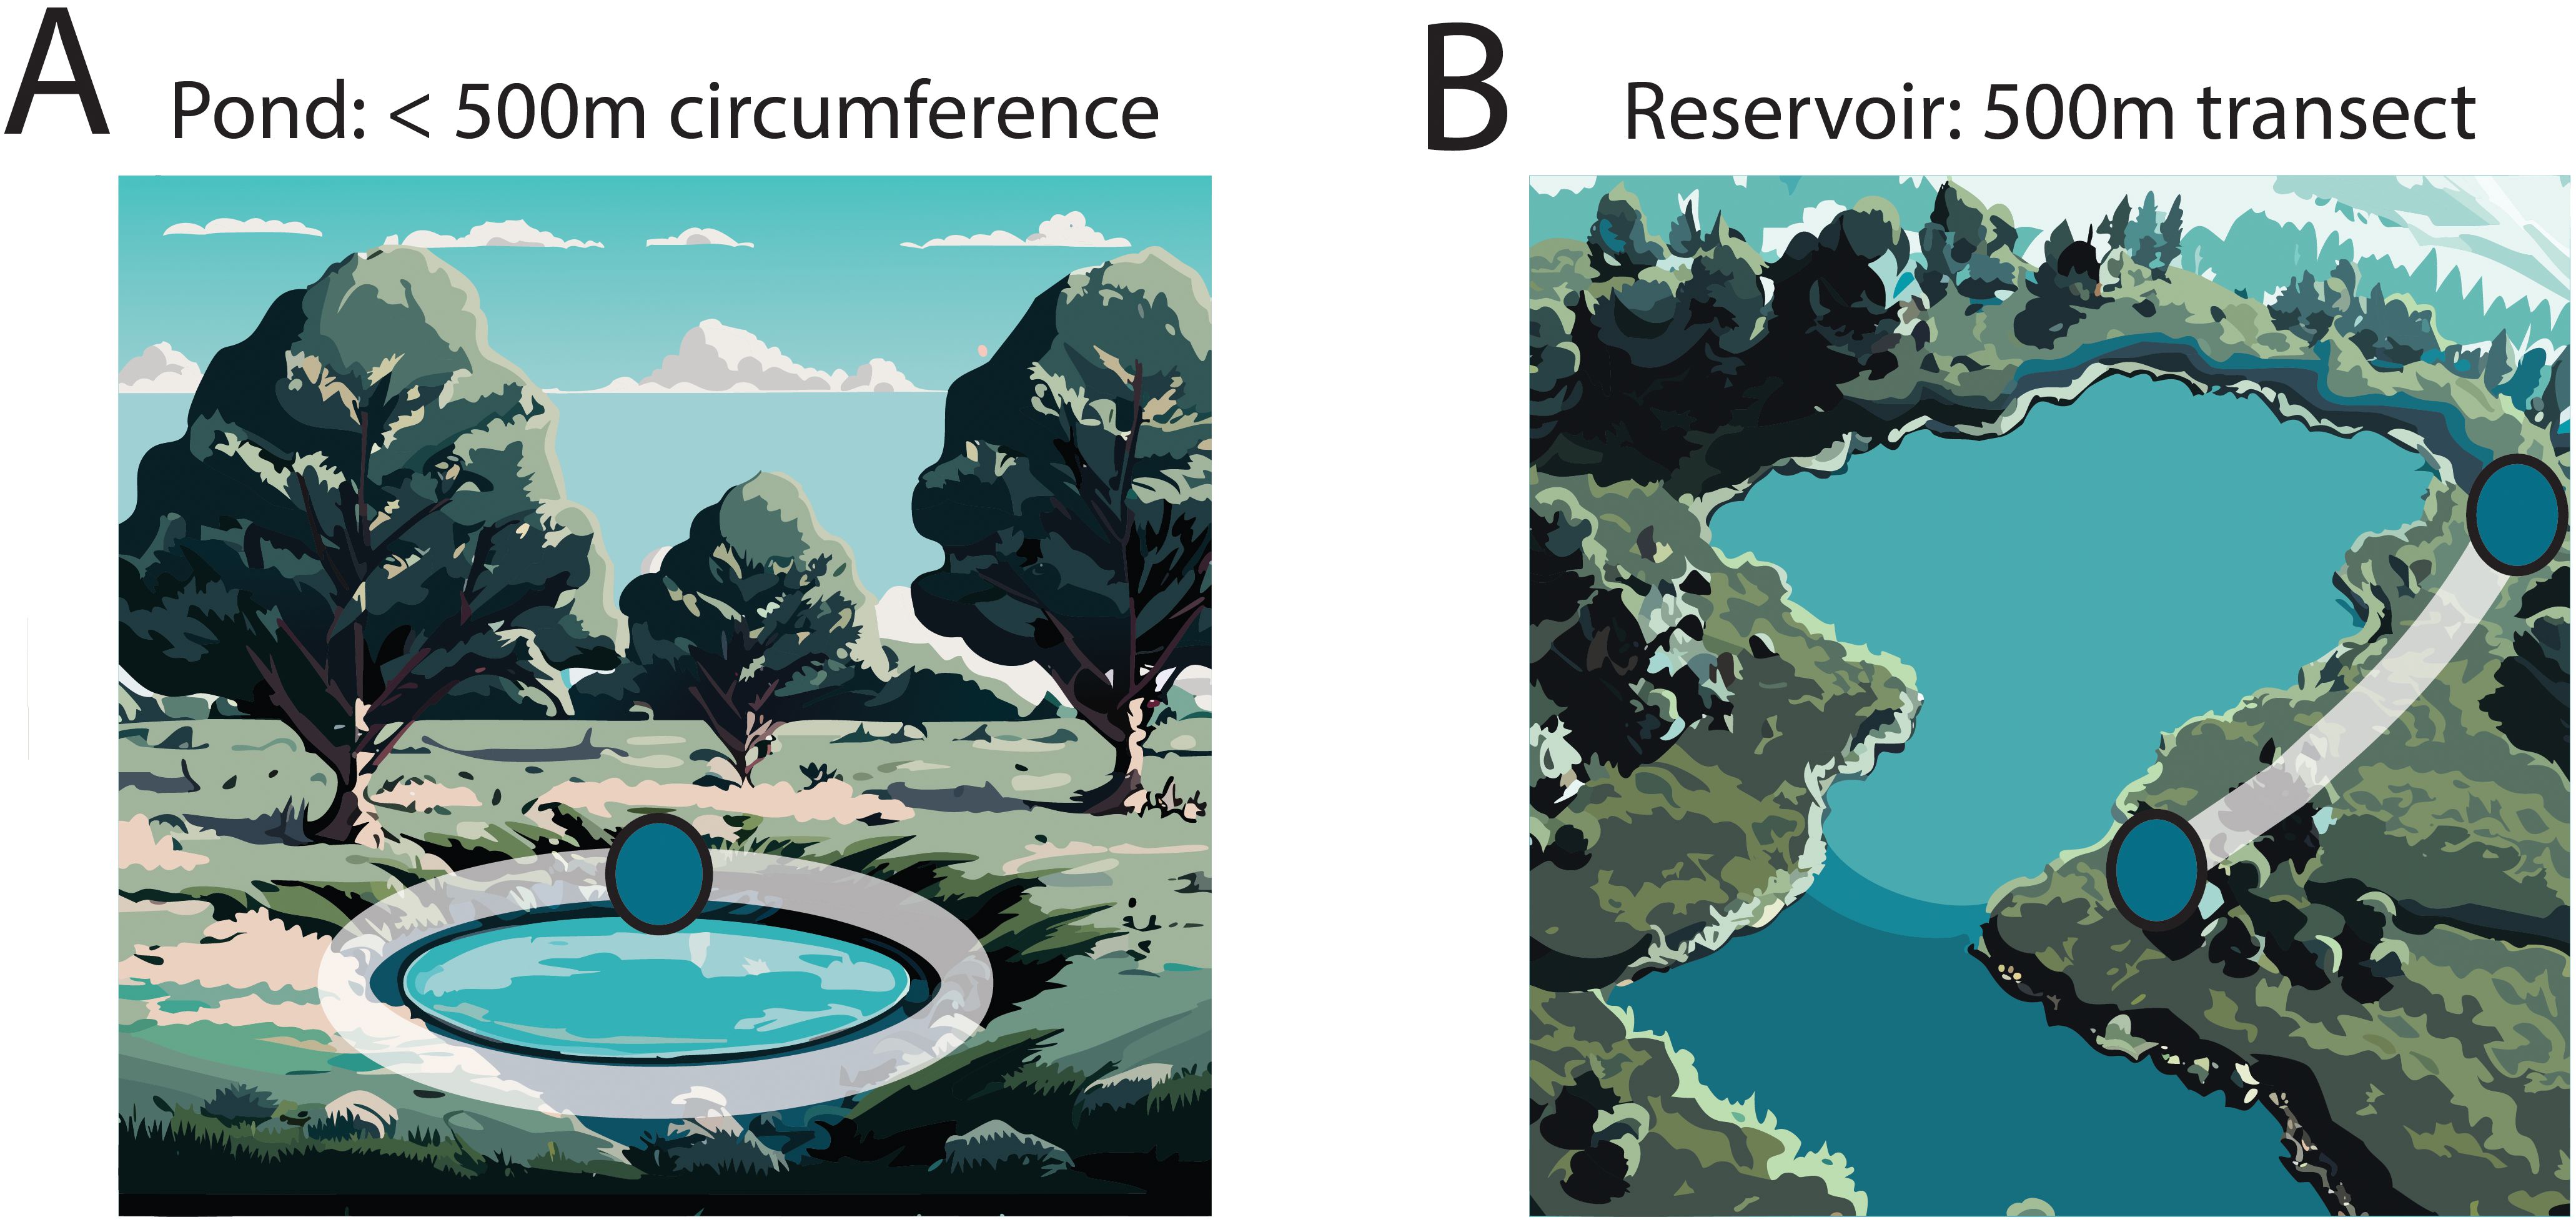
Figure 2. Examples of two sites (A, B) surveyed for northern leopard frogs and bullfrogs. Surveyors searched up to 500 meters of bank at each site for both focal species. At a subset of sites, (n=6), two automated acoustic recording (AAR) units were placed to sample different parts of the acoustic environment. White shading illustrates the surveyed transect during a visit and blue dots represent AAR unit placement. Image was generated using Adobe Illustrator version 28.0 with lines added to generated images using the Text to Vector Graphic tool.
We used the Smith-Root eDNA sampler system for all eDNA collection, which supports sampling from the bank (Thomas et al., 2018). During each site visit, we collected four eDNA field samples starting at the downstream end of lotic sites to limit potential movement of eDNA to other sampling locations. For lentic sites, collectors began at a pre-selected point and moved clockwise. All samples were evenly spaced throughout the sites using satellite imagery. We filtered up to five liters of water through 47mm filters and recorded the amount of water filtered (liters). To avoid contamination, we followed a strict protocol developed by Colorado Parks and Wildlife designed to minimize false positive and false negative samples. One person recorded data and the other collected samples with no direct contact between the two. All equipment that contacted site water was thoroughly sanitized, rinsed, and dried between sites using a 10% bleach solution. At each site, we also collected one field negative control of dechlorinated water filtered to the average number of liters collected at the site. If negative control samples tested positive for northern leopard frog or bullfrog DNA, we eliminated all other samples collected on the same survey event where contamination was observed. All eDNA samples were kept on ice in the field and stored at approximately -20°C in a sterile freezer for 3 months before being processed individually by Pisces Molecular LLC in Boulder, Colorado, USA (see Supplementary Material S1 for details). After eDNA collection, site water temperature, air temperature, and pH were recorded using the Hanna combo tester. Covariates used to model potential variation in eDNA detection probability included Julian date (Julian), liters of water filtered per sample (Liters), site pH (pH), site water temperature (Wtemp), and air temperature (Atemp; Table 1).
During each site visit we also conducted two independent visual encounter surveys (VES), where each survey was conducted by a separate team of 1-2 observers. Visual encounter surveys began 40 minutes after eDNA sampling, started from the same location, and followed the same trajectory through the streambank or shoreline habitat. The two VES were separated by at least 20 minutes to ensure independence. Observers visually inspected all suitable habitat while conducting dip net sweeps for amphibian larvae. Observers recorded encountered species, life stage, and covariates thought to influence species- and method-specific detection probabilities (Table 1). Species observations were recorded as certain or uncertain and only those certain identifications were included in the occupancy analysis. Covariates used to model potential variation in VES detection probability included time spent searching (SearchT), the number of observers (ObsCount), Julian date (Julian), water temperature (Wtemp), and air temperature (Atemp; Table 1).
Automated acoustic recorders (AAR) were deployed at a subset of sites (n=19). We programmed recorders to sample a 3-minute interval every 27 minutes for the entire season (April – October). Recorders were deployed near ideal frog breeding habitat, based on supporting literature (Pope et al., 2000; Smith and Keinath, 2007). Specifically, we installed units 1 meter above ground on a t-post at unshaded lentic locations with emergent vegetation and ample shallows. At a subset of the larger lentic sites (> 300 meters radius; n=6), we placed an additional recorder to capture vocalizing anurans and moved it bi-weekly to different potential breeding areas within the site. We compared detection probabilities from these ‘roving units’ (ROV) to their stationary counterparts and detection probabilities at sites with two units to those with one. We also explored how AAR detection probabilities varied with Julian date (Julian; Table 1). Acoustic data was sorted and processed using Kaleidoscope Pro (version 5.4.2, Wildlife Acoustics) to extract breeding call detections for each species in each week (see Supplementary Material S2 for details).
2.3 Detection hypotheses: occupancy analysis
We hypothesized that detection probabilities for all three methods would be influenced by selected environmental factors with some method-specific considerations (Table 1). We expected that species-specific detection probabilities for all methods would be influenced by Julian date as our two target species have different breeding and developmental life histories. In our study area, northern leopard frogs are early spring breeders and typically emerge to call in April and May whereas bullfrogs usually begin calling in July (Bury and Whelan, 1985; Larson, 2004). Accordingly, we expect acoustic recorder detection probabilities to decline with Julian date for northern leopard frogs but increase with date for bullfrogs (Table 1). As eggs hatch and tadpoles become larger and more active, we expect the detection probabilities for both species to increase with Julian date for visual or eDNA surveys (Table 1) (Buxton et al., 2017). Similarly, both species’ activity increases with temperature, thus detection probabilities for both visual and eDNA surveys are expected to increase with water (or air) temperature (Table 1). Because DNA may be less abundant in acidic (<5; Schlichter, 1981), and perhaps extreme basic (> 10; Fominykh, 2008), environments due to reduced amphibian tolerance of these conditions, we also expect eDNA detection probabilities to vary with pH (Fominykh, 2008; Schlichter, 1981). Finally, detection probability for each method might be influenced by characteristics specific to each method. If DNA is dispersed in the water column, eDNA detection should increase for samples with a larger volume of filtered water. Visual encounter surveys conducted by two observers may have higher detection probabilities compared to those with only a single observer and longer survey search times may yield higher detection probabilities. Acoustic recorders that are moved throughout the site during the season (roving units) could have higher mean detection probabilities as they sample more than one location within an occupied site. Sites with both stationary and roving units should have higher cumulative detection probabilities than sites with only stationary units.
We used a single-season (static) occupancy approach to test our hypotheses regarding method- and species-specific detection probabilities (MacKenzie et al., 2002). Detection histories were compiled for each species and site and indicated whether the species (northern leopard frog or bullfrog) was detected (1) and not detected (0) during a given survey. Detection histories included four independent visual encounter surveys (2 per visit), eight eDNA samples (4 per visit) and a subset of sites included up to 28 weekly acoustic surveys. We analyzed detection histories for each species separately and fit a series of models to explore how environmental (pH, Wtemp, Atemp) and survey-specific (Julian, Liters, SearchT, ObsCount) covariates influenced species’ detection probabilities. Due to sample size, we tested univariate relationships and only considered an additive effect of Julian date and unit type (roving vs. stationary) for AAR detection probability.
We used a secondary candidate set model building strategy to develop and fit our candidate models (Morin et al., 2020). Specifically, we fit models representing hypotheses associated with detection probability for a given method (e.g., pVES), while retaining a constant structure on the detection probability for the other two methods (e.g., peDNA, or pAAR) and occupancy. Because we selected sites with recent observations of northern leopard frogs and a high likelihood of bullfrogs occurring, we used a constant occupancy structure (ψ(.)) for each species in all models. We identified detection covariate(s) with substantial support for each method as those within ΔAICc <5 and included all combinations of supported covariate structures in our final combined model set (Table 2, 3; Supplementary Materials S3 and S4). We fit all models in program MARK version 6.2 (White and Burnham, 1999) and used Akaike Information Criterion and associated model weights to evaluate model performance (Anderson and Burnham, 2002).
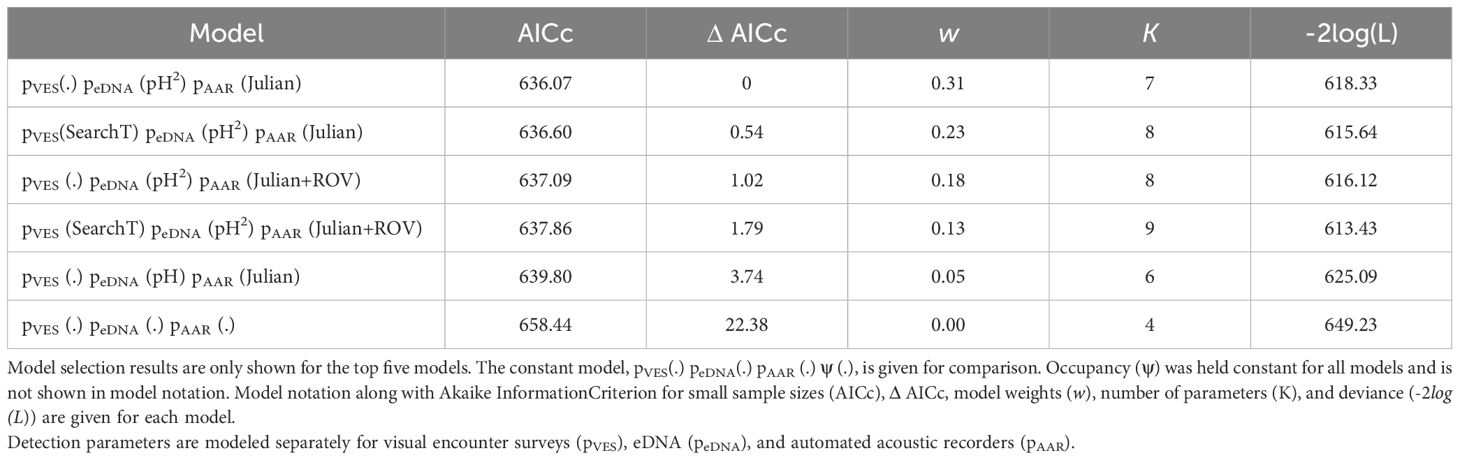
Table 2. Model selection results for northern leopard frog (Lithobates pipiens) detection models.
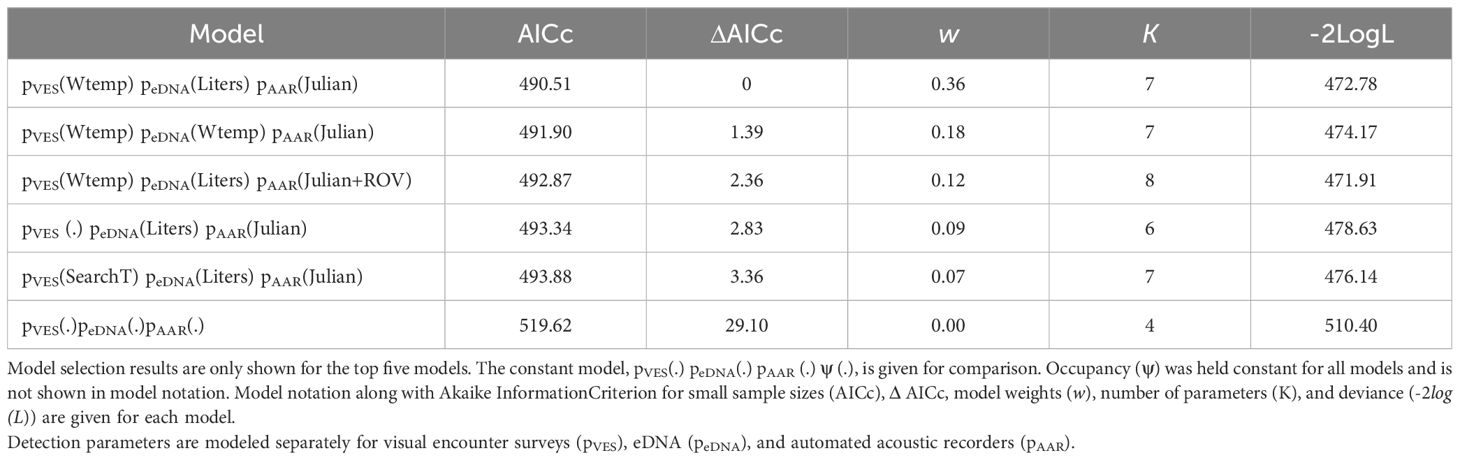
Table 3. Model selection results for American bullfrog (Lithobates catesbeianus) detection models.
We report average detection probabilities for each method and species using the constant model structure for each parameter, pVES(.) peDNA(.) pAAR (.) ψ (.) and coefficient estimates from the best supported model that includes the specified covariate. Additionally, we calculated the cumulative detection probability for each species and method as p*=1-(1-p)n where p* is the probability of detecting the species at least once over n samples/surveys/weeks and p is the probability of detection for a single sample/survey/week. We used resulting values to determine the sampling effort required to detect a species, given the site is occupied, with 90-99% confidence.
3 Results
All three methods (eDNA, VES, AAR) were compared at 19 sites and northern leopard frogs were detected at 15 of them. AARs detected northern leopard frogs at approximately 50% (n=8) of the known occupied sites, while eDNA and VES surveys detected the species at 87% of sites (n=13), although not always at the same sites. For sites with bullfrog detections (n=8), AARs and VES detected the species at 63% of these sites (n=5), whereas eDNA detected the species at all but one site (n=7).
When considering all sampled sites (n=38) and pooling detections across methods, northern leopard frogs were detected at 24 sites (naïve occupancy = 0.63), while bullfrogs were detected at 18 (naïve occupancy = 0.45). Interestingly, northern leopard frogs and bullfrogs co-occurred at 13 sites (34%), despite bullfrogs being considered a threat to northern leopard frog persistence (Johnson et al., 2011). Overall, eDNA and VES performed similarly for each species: eDNA detected northern leopard frogs at 53% (n=20) and VES at 58% (n=22) of sites. For bullfrogs, eDNA detected the species at 37% (n=14) and VES also at 37% (n=14) of sites.
Of our 76 negative control eDNA samples, two came back positive for bullfrog DNA and none came back positive for northern leopard frog DNA. The two positive control samples were collected during the first week of eDNA collection and on the same day, but at two different sites. All 8 samples from those two eDNA surveys associated with the contaminated controls were removed from analysis.
Species-specific occupancy estimates, from the constant model, pVES(.) peDNA(.) pAAR (.) ψ (.), were identical to naïve estimates for northern leopard frogs ( = 0.63 (95% Confidence Interval; CI: 0.47 to 0.77)) and bullfrogs ( = 0.45 (95% CI: 0.30 to 0.60)), indicating cumulative detection probability is close to 1 by using a combination of detection methods at our sampled sites over the course of the season.
3.1 eDNA
The average probability of detecting our target species in a single eDNA sample, given the site was occupied, was 0.46 (95% CI: 0.39 to 0.53) for northern leopard frogs and 0.53 (95% CI: 0.45 to 0.62) for bullfrogs (Table 4). eDNA detection probabilities for northern leopard frogs were strongly influenced by environmental conditions and were lowest at occupied sites with slightly basic pH values and highest in neutral conditions (Figure 3A, Table 2, Supplementary Table S3.1). Although detection was highest in neutral ranges as predicted, none of our sites were extremely acidic (pH < 5) or basic (pH > 10). eDNA detection for northern leopard frogs decreased slightly across Julian date, though the effect was imprecise. Neither water nor air temperatures were supported as influencing detection probabilities, despite their known relationship with the emergence and development of tadpoles (Supplementary Table S3.1; Sommers et al., 2018). The amount of water filtered had a slight positive effect on eDNA detection probability, but the effect was imprecise (Supplementary Table S3.1).
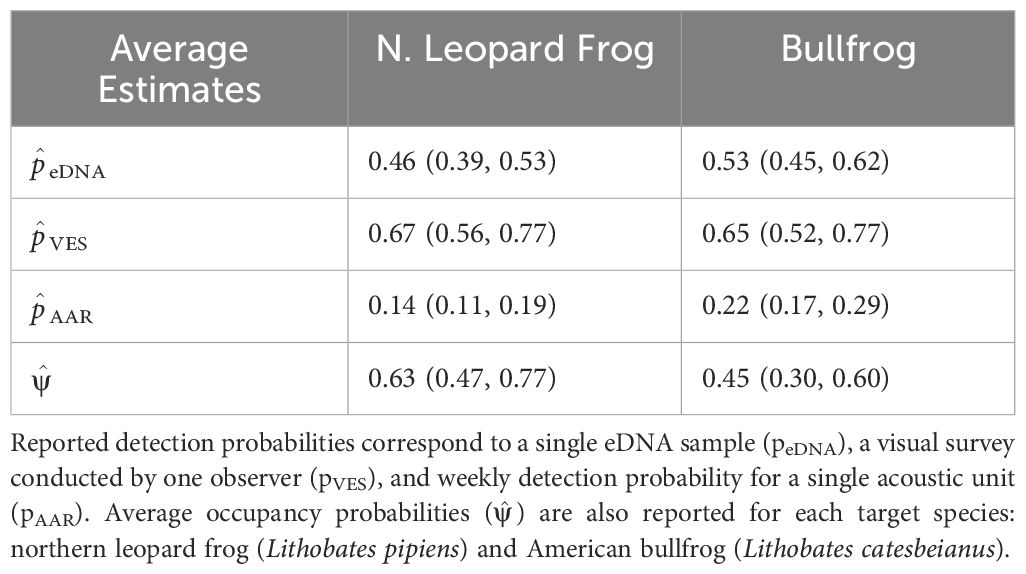
Table 4. Average detection and occupancy probabilities and 95% confidence intervals are given for each species using the constant model: pVES(.)peDNA(.)pAAR(.) ψ (.).
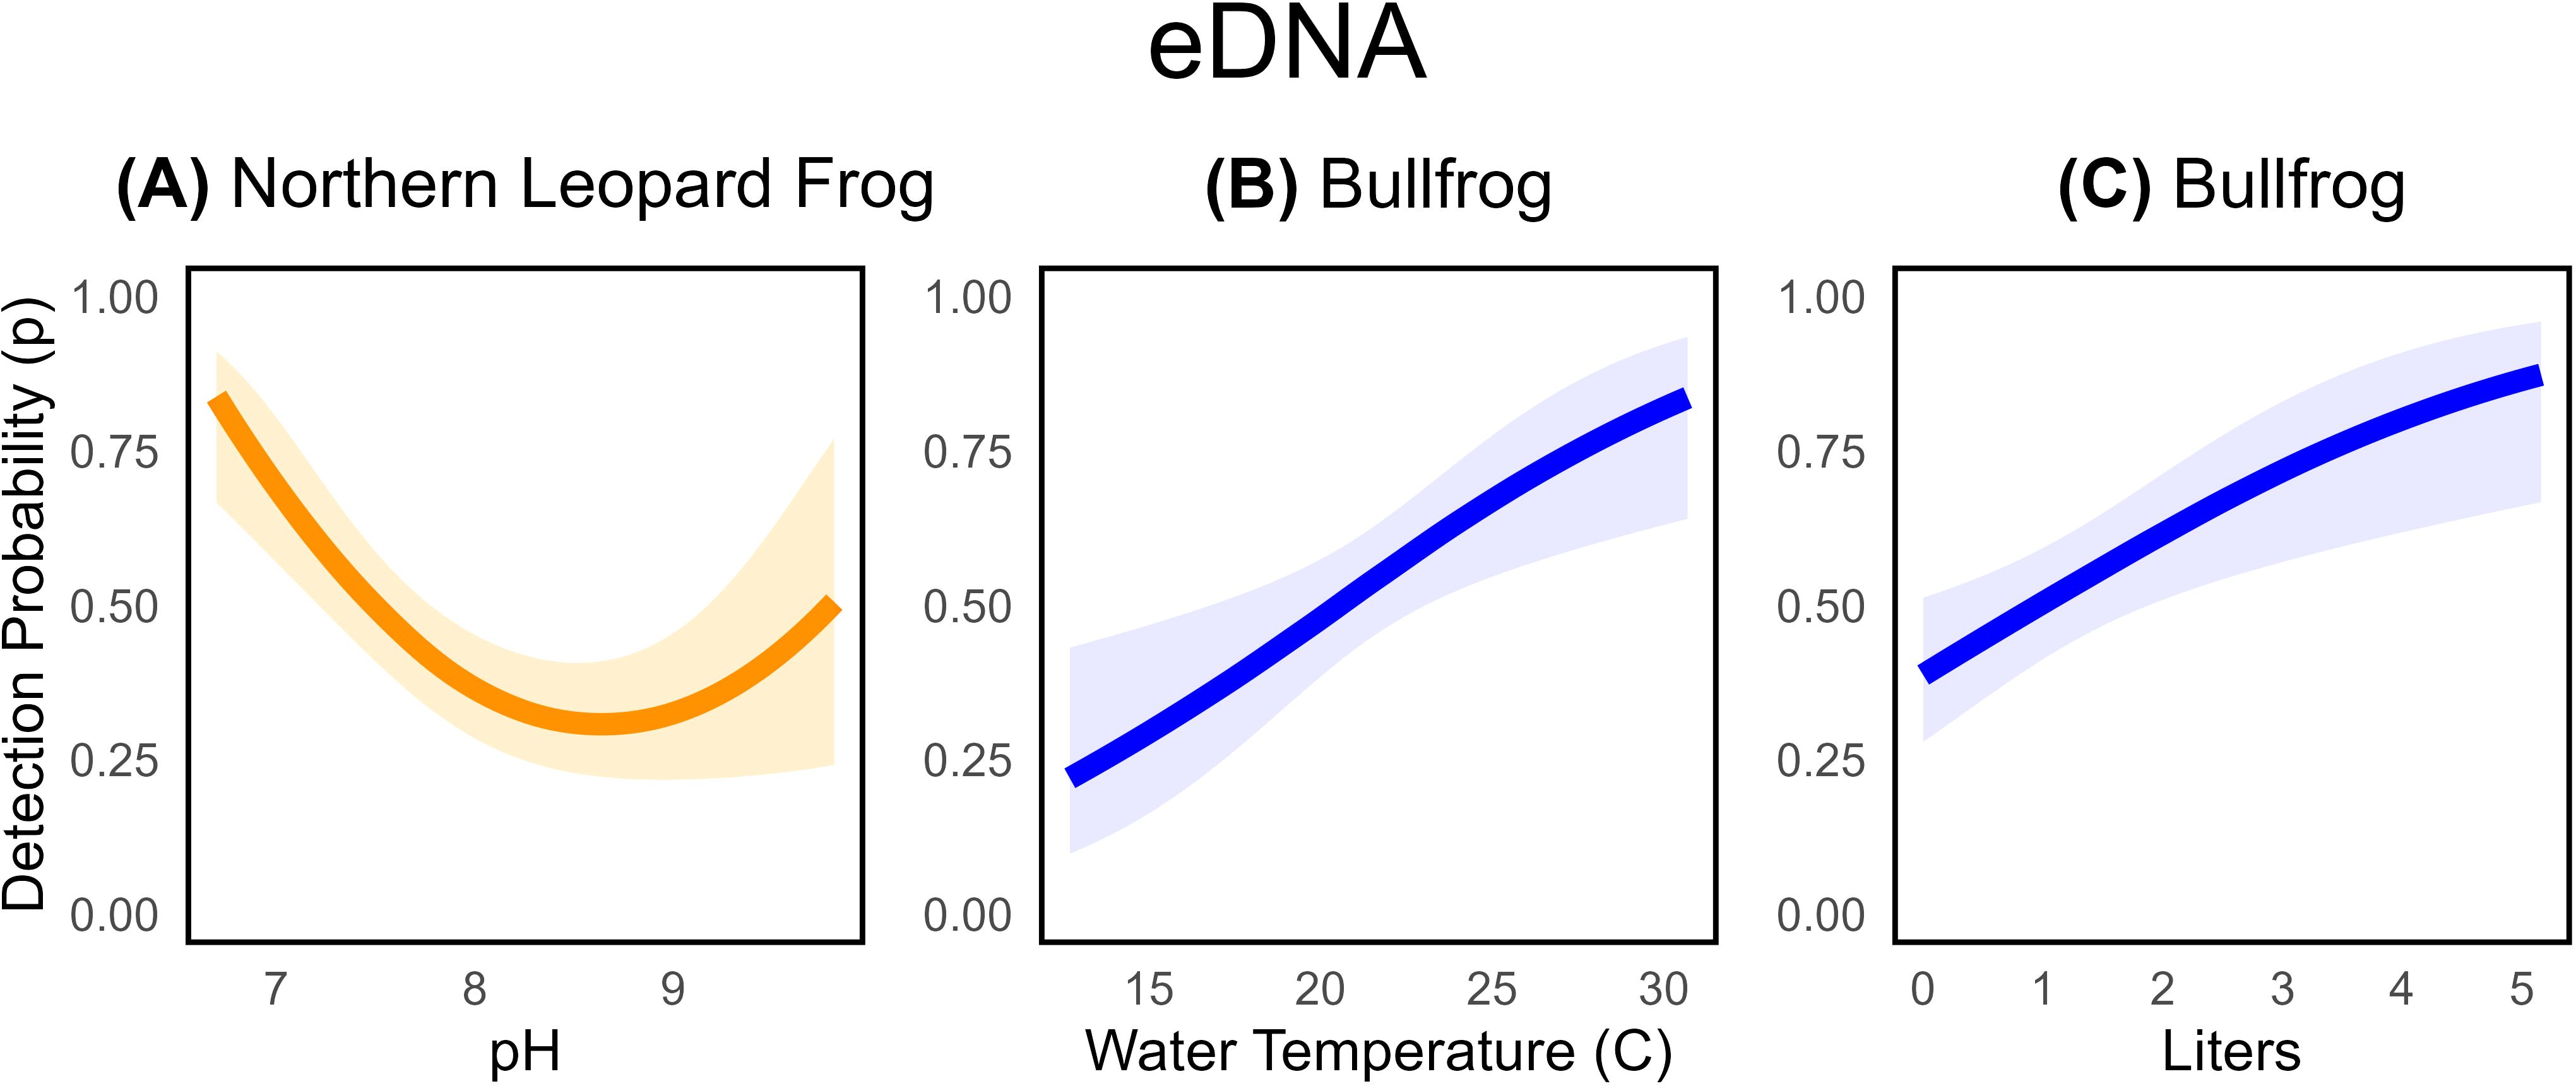
Figure 3. Estimated relationships between eDNA detection probabilities for northern leopard frogs (A) and bullfrogs (B, C) and pH ( = -10.64, SE= 3.05), water temperature ( = 0.16, SE= 0.05), and amount of water filtered (=0.46, SE=0.15). Shaded areas represent 95% confidence intervals associated with detection probability estimates. Relationships and estimates are given for the best-supported model that contains the covariate.
In contrast, eDNA detection probabilities for bullfrogs were influenced by water temperature and the amount of water filtered, but not by pH (Table 3, Supplementary Table S3.5). Consistent with our expectation, eDNA detection for bullfrogs increased with warmer water temperatures ( = 0.16, SE = 0.05; Figure 3B) and the amount of water filtered ( = 0.46, SE= 0.15; Figure 3C). For bullfrogs, the probability of detection via eDNA sampling increased by approximately 0.10 for each additional liter of water filtered (Figure 3C).
3.2 Visual encounter surveys
The average probability of detecting our target species during a visual encounter survey, given the site was occupied, was comparable for both species: 0.67 (95% CI: 0.56 to 0.77) for northern leopard frogs and 0.65 (95% CI: 0.52 to 0.77) for bullfrogs (Table 4). We found some evidence that VES detection probabilities for northern leopard frogs increased as observers spent longer searching the habitat ( = 0.02, SE= 0.01; Figure 4A; Table 2; Supplementary Table S3.2), though the estimated effect was somewhat imprecise. For example, the detection probability for a single observer searching for 25 minutes was ~ 0.60, but if the observer searched for 50 minutes, detection probability was ~ 0.70 (Figure 4A). Interestingly, the number of observers per survey did not influence northern leopard frog detection probability (Supplementary Table S3.2). Contrary to our expectations, environmental conditions (Wtemp, Atemp) and survey date (Julian) did not influence northern leopard frog VES detection probability (Supplementary Table S3.2).
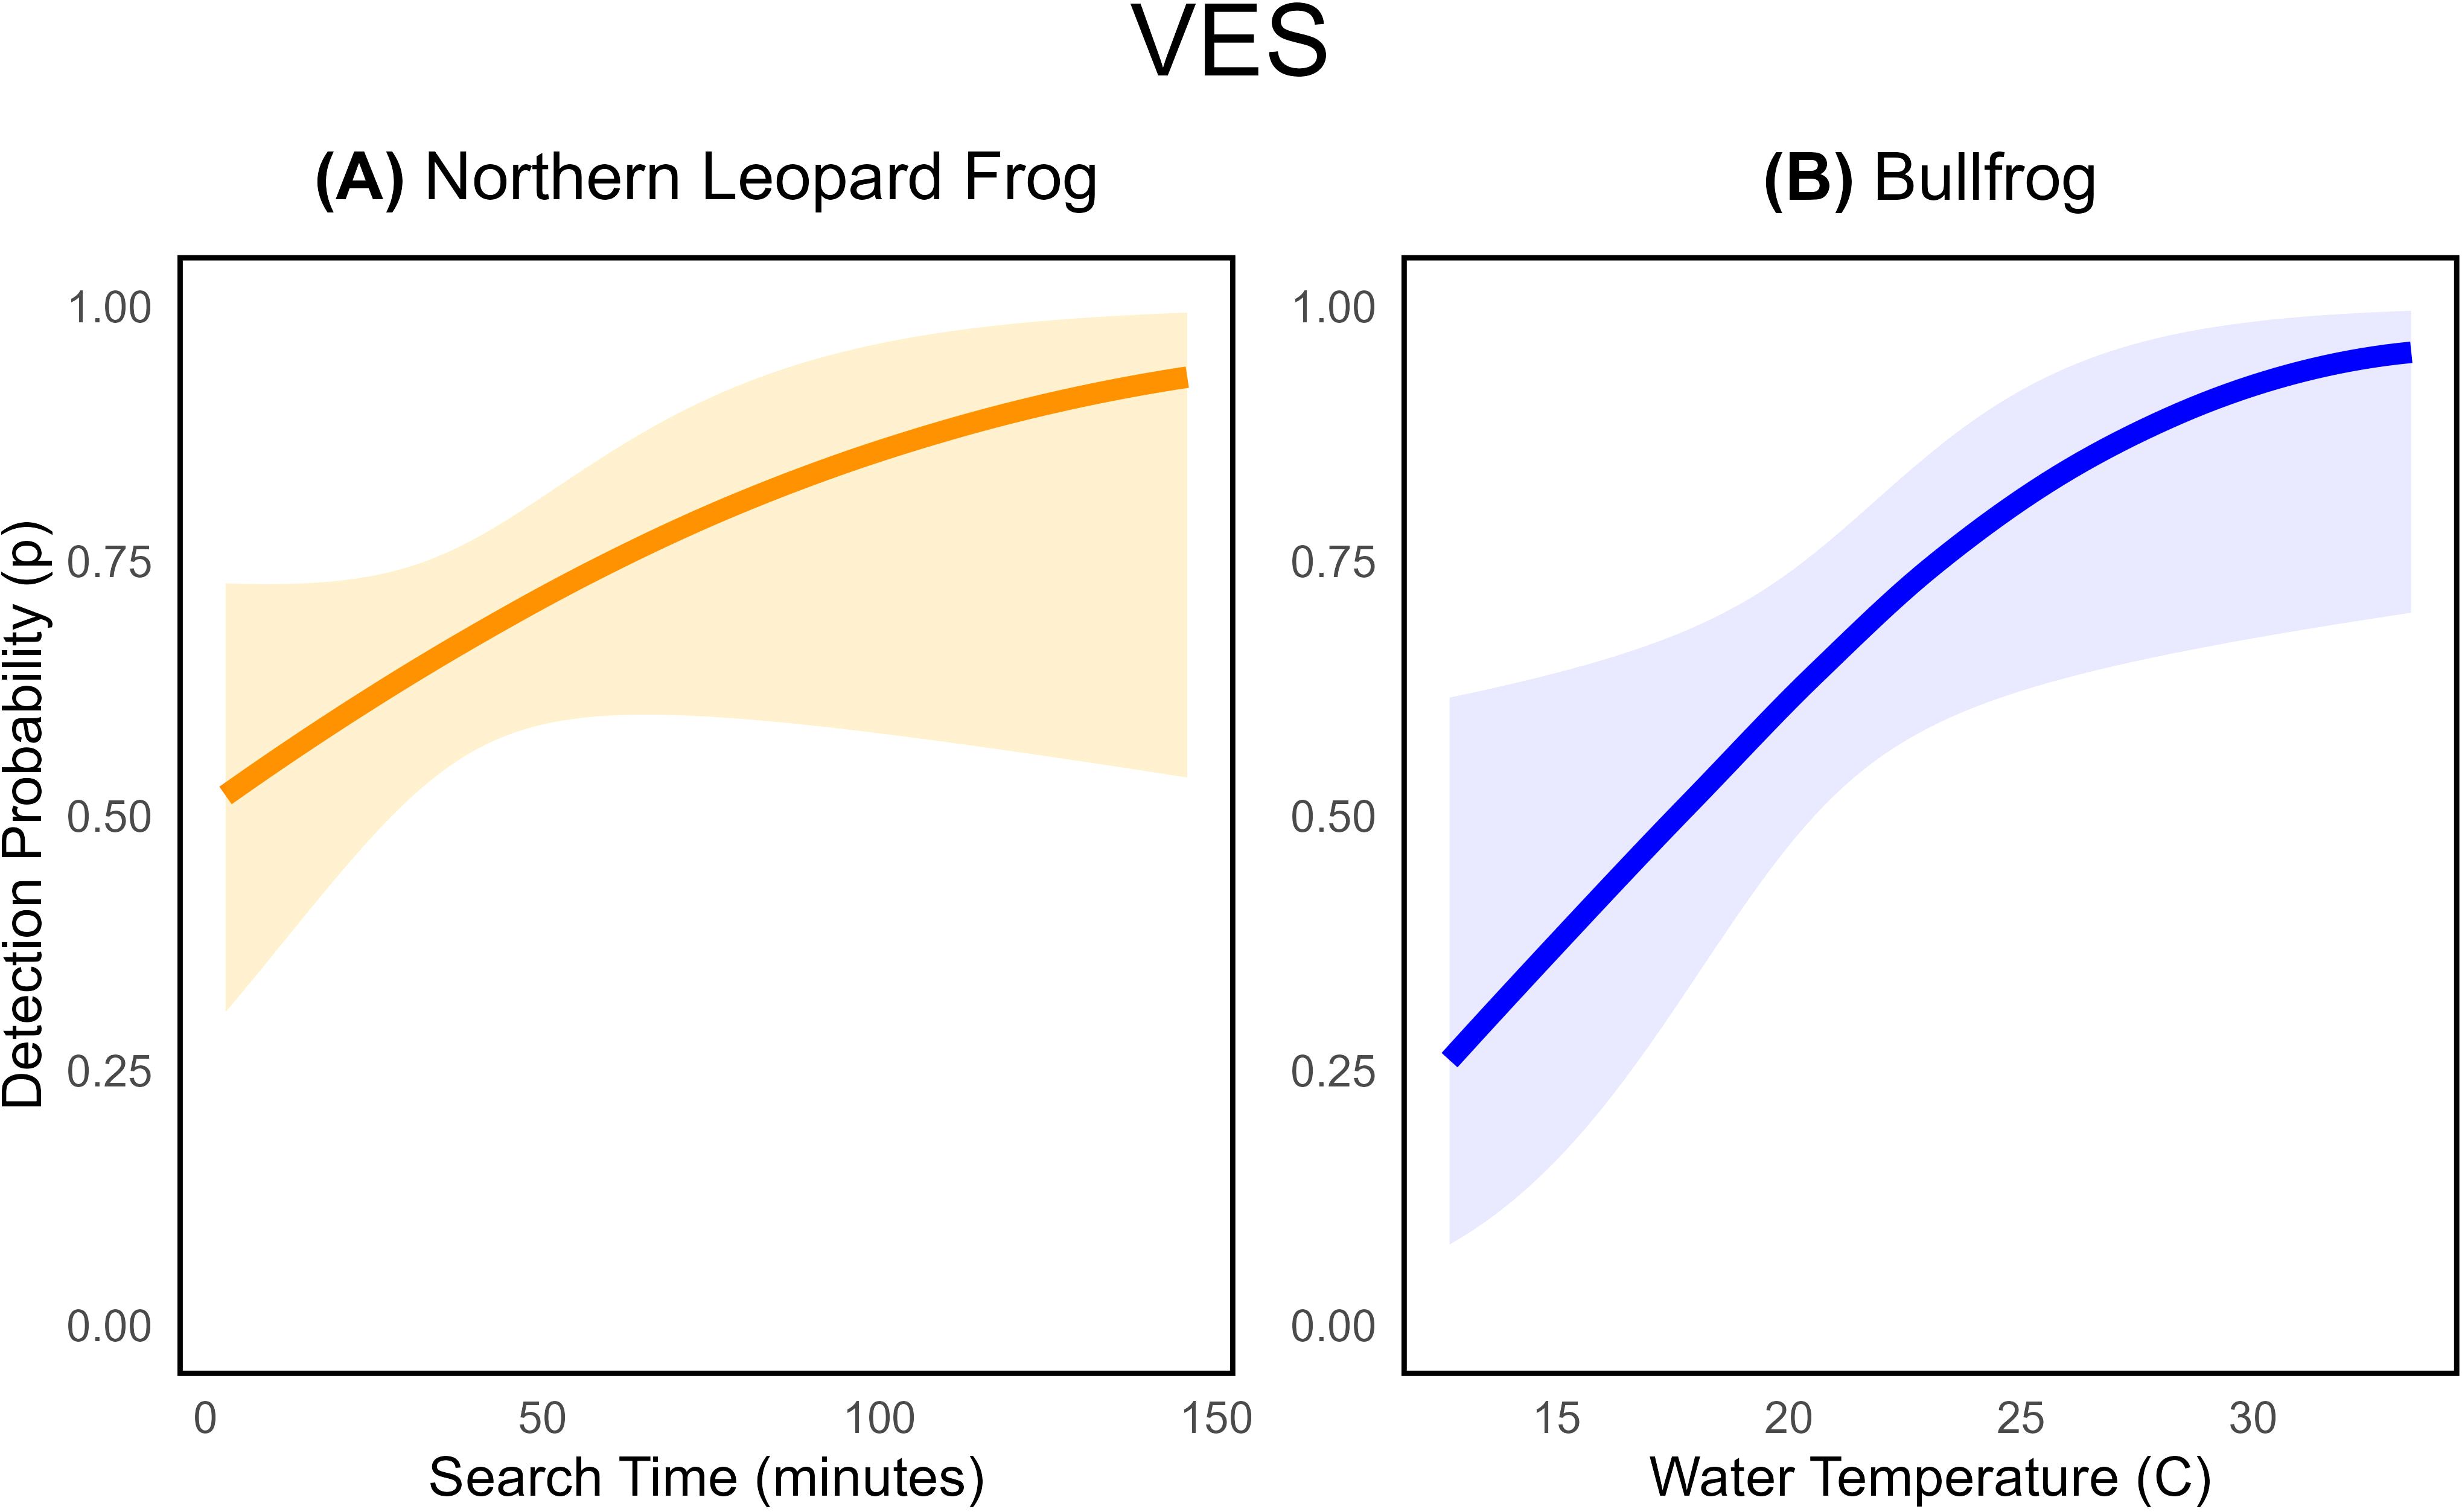
Figure 4. Estimated relationships between visual encounter survey (VES) detection probability for (A) northern leopard frogs and search time ( = 0.02, SE= 0.01) and (B) bullfrogs and water temperature ( = 20, SE= 0.09). Shaded areas represent 95% confidence intervals associated with detection probability estimates. Relationships and estimates are given for the best-supported model that contains the covariate.
In contrast, environmental conditions influenced VES detection probability of bullfrogs, but survey-specific covariates did not (Table 3; Supplementary Table S3.6). The probability of visually detecting a bullfrog increased with warmer water temperatures ( = 0.20, SE= 0.09; Figure 4B). In fact, detection probability increased by ~ 0.55 as water temperature increased from 15°C to 25°C. Despite our expectations, survey-specific variables (Julian, SearchT, ObsCount) were not well supported as predictors of bullfrog VES detection probability, emphasizing the detection disparities between the two species (Supplementary Table S3.6).
3.3 Automated acoustic recorders
Our acoustic units targeted two species with asynchronous breeding activity. Non-detections outside northern leopard frog or bullfrog seasonal activity resulted in a low average weekly detection probability at occupied sites: 0.14 (95% CI: 0.11 to 0.19) for northern leopard frogs and 0.22 (95% CI: 0.17 to 0.29) for bullfrogs (Table 4). Therefore, we also report monthly average and cumulative detection probabilities, as they describe the probability of detecting calls during peak breeding. As hypothesized, northern leopard frog acoustic detections decreased throughout the summer, with the highest weekly detection probability in April and then declining throughout the season ( = -0.016, SE= 0.004; Figure 5A; Supplementary Table S3.3). Deploying AARs during peak breeding windows can improve cumulative detection probabilities considerably over a month. For instance, if AARs sampled for a month starting in early April, the probability of capturing northern leopard frog breeding calls was 0.81 (95% CI: 0.64 to 0.93); however, if the unit sampled at the end of the season during the month of July, detection dropped by approximately half to 0.40 (95% CI: 0.28 to 0.52).
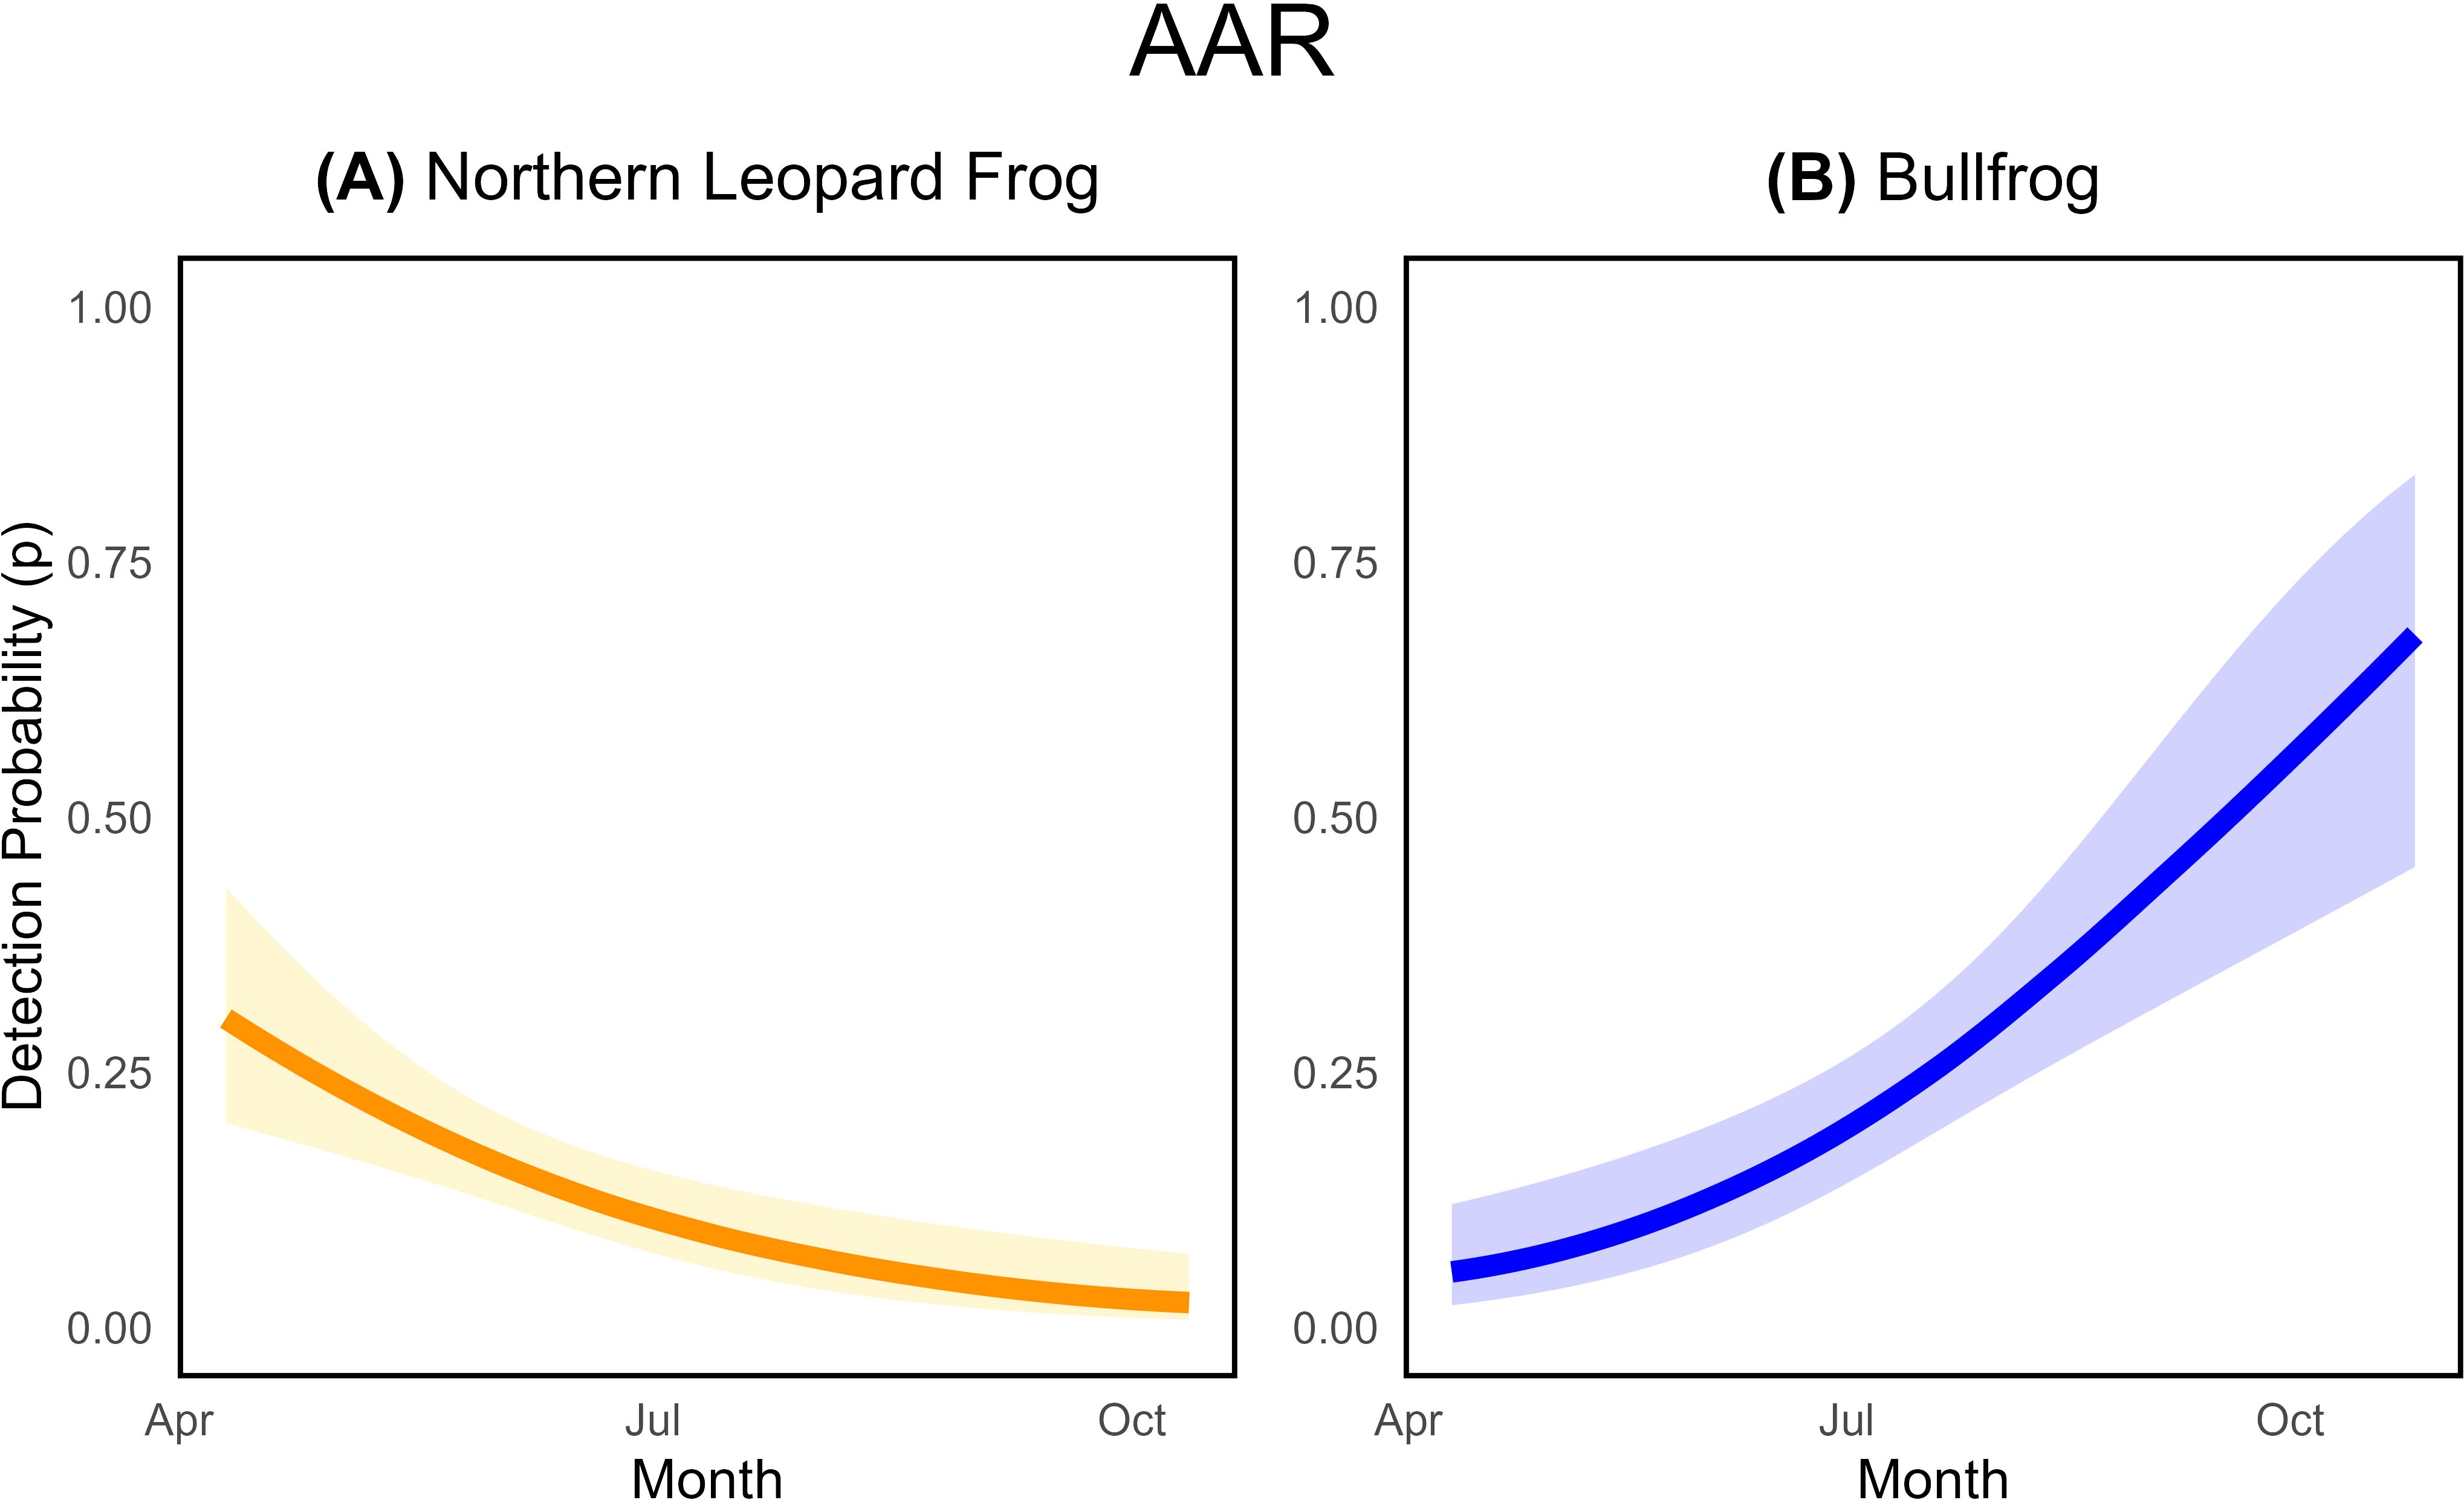
Figure 5. Estimated relationships between detection probability for a single automated acoustic recorder (AAR) and survey date for (A) northern leopard frogs ( = -0.016, SE=0.004) and (B) bullfrogs (=0.02, SE=0.004). The probability of detecting the target species, given occurrence, in any single sampled week is depicted on the y-axis. Shaded areas represent 95% confidence intervals associated with detection probability estimates. Relationships are given for the best-supported model that contains the covariate.
Bullfrog detection probabilities also varied with Julian date, but the weekly probability of detecting a breeding call increased throughout the summer ( = 0.02, SE= 0.004; Figure 5B; Supplementary Table S3.7). Again, deploying units during peak bullfrog breeding improved detection estimates over a month of sampling. If units were deployed in the first week of August and sampled for a month, there would be a ~ 0.75 cumulative probability of detection compared to ~ 0.25 if units were deployed for the month of May.
For northern leopard frogs, acoustic units that rotated to different potential breeding pools within a site had slightly lower detection probabilities relative to the stationary units. For example, during peak detection months for northern leopard frogs (April) stationary units had monthly average detection probabilities approximately 0.10 higher than paired roving units. For bullfrogs, roving units had slightly higher detection probabilities compared to stationary units. However, our results were imprecise as our sample size of roving units was small (n=6). Deploying multiple units at a site improved overall estimates of detection, as sites with both roving and stationary units had a higher cumulative detection probability during peak breeding months than sites with only stationary units. For northern leopard frogs, combined multi-unit monthly detection probability for peak calling during the month of April was ~ 0.90 and a single, stationary unit detection was ~ 0.80. For bullfrogs sampled during peak calling periods in October, combined monthly multi-unit detection probability was ~ 0.95 while a single, stationary unit detection was ~ 0.75.
4 Discussion
We investigated how detection probabilities for each species and method were influenced by survey-specific and environmental covariates for native northern leopard frogs and invasive American bullfrogs. We found detection probabilities varied considerably among methods and species, a result that is consistent with other studies (Moss et al., 2022; Randall et al., 2023; Wikston et al., 2023). Detection probabilities were highest for visual encounter surveys, followed by eDNA and then automated acoustic recorders for both species (Table 4). eDNA and acoustic detection for bullfrogs was higher than for northern leopard frogs and visual encounter survey detection was comparable for both species (Table 4). Differences in detection between the species were predicted by environmental covariates associated with life history traits while those associated with the observational process were less influential (e.g., search time, number of observers) (Knutson et al., 2018).
The availability of eDNA for detection depends on both the quantity of DNA released by the species and environmental factors influencing its degradation rate (Barnes et al., 2014; Yates et al., 2021), thus we anticipate larger quantities of DNA are released in ideal breeding conditions. We found eDNA detection was highest for northern leopard frogs in neutral pH ranges (Figure 3A), representing their habitat preferences (Smith and Keinath, 2007). Unmodeled variables influencing DNA availability or degradation could contribute to lower detection in somewhat basic conditions (pH 8-9.8). This relationship would benefit from further investigation, as mechanisms influencing DNA availability and degradation are interacting and complex (Strickler et al., 2015). For bullfrogs, water temperature was a well-supported predictor of both eDNA and visual encounter survey detection and reflected their preferences for warm aquatic habitats (Bury and Whelan, 1985; Lillywhite, 1970) (Figure 3B). DNA also degrades faster at warmer water temperatures (Strickler et al., 2015), but this decline can be offset by higher amphibian activity levels (Bedwell and Goldberg, 2020; Buxton et al., 2017; De Souza et al., 2016), which increases availability of eDNA. Visual survey detection probability also increased with temperature (Figure 4B). Higher activity of bullfrogs in warmer waters likely increases the probability an observer will notice and record an individual.
In addition to preferring warm temperatures, bullfrogs require permanent sites to breed. Developing tadpoles are much larger than the larvae of other amphibian species in our study area and require multiple seasons to develop. This consistent activity in the water column could contribute to more widely available DNA for detection. We found that filtering more water increased eDNA detection probabilities for bullfrogs (Figure 3C), but the effect was much lower for northern leopard frogs (Supplementary Tables S3.1 and S3.5). Filtering more water increases eDNA detection probability for some amphibian populations (Bedwell and Goldberg, 2020; Ficetola et al., 2008; Sepulveda et al., 2019) and we found this could be an effective strategy to increase bullfrog detection as well. In contrast, northern leopard frogs are more terrestrial, have smaller clutch sizes, and smaller tadpoles that metamorphose in late summer, possibly resulting in lower quantities of available eDNA. Collecting additional eDNA samples may be a more effective way of improving overall cumulative eDNA detection for this species. Future research would benefit from exploring optimal eDNA sampling strategies for northern leopard frogs and investigating how eDNA detection varies seasonally for both species with additional sampling dates.
Trends in method-specific detection also highlighted differences in species cryptic or conspicuous behaviors. Challenges in detecting northern leopard frogs visually and acoustically at occupied sites are likely related to their cryptic use of habitat and discrete breeding calls. We found some evidence that longer visual encounter surveys contributed to increased probability of detecting northern leopard frogs (Figure 4A), a trend that is similarly supported for declining congeneric Chiricahua leopard frogs (Hossack et al., 2022). Northern leopard frogs are often hidden in tall grasses and when startled, seek cover quickly. These behaviors may increase necessary search time to detect this cryptic species compared to bullfrogs, which often produce a characteristic and easily identifiable alert call when disturbed. Additionally, northern leopard frog breeding calls are among the most complex of any temperate zone amphibian, composed of low-volume chuckles, grunts, and snores (Larson, 2004). Unlike bullfrogs, northern leopard frogs do not form large choruses, tend to call sporadically, and are easily masked by background noises such as wind (De Solla et al., 2005; Larson, 2004). Bullfrog breeding calls consist of a series of similar croaks that can be heard from a substantial distance and large breeding choruses are common (Capranica, 1968; Guzy et al., 2014). Bullfrog calling behavior creates easily recognizable calls with a cumulative monthly acoustic detection probability near one (i.e., ) during peak breeding. These calling differences produced an overall lower probability of detecting northern leopard frogs acoustically compared to bullfrogs (Table 4, Figure 5). Northern leopard frogs emerge to breed in early spring (Oseen and Wassersug, 2002; Sommers et al., 2018) corresponding to our highest detection probabilities, followed by declining calling activity (Figure 5A). Contrarily, bullfrogs are late-season breeders, and we found acoustic detection probabilities increased throughout the summer (Figure 5B). Thus, acoustic detection probabilities for both species are improved by focusing sampling during their seasonal emergence.
Efficient and effective monitoring programs are essential to inform conservation efforts and determining the effects of management actions. However, many monitoring programs lack clear objectives and the ability to account for imperfect detection. Here, we provide two examples to illustrate how results from our study can inform future monitoring efforts aimed at our two focal species in the Intermountain West. Suppose researchers are interested in exploring factors influencing northern leopard frog colonization and recruitment following a management action (e.g., habitat improvement or translocation). Our results indicate that pairing 2 weeks of acoustic sampling during the expected peak breeding season with 2 visual encounter surveys at study locations would detect both northern leopard frog attempted (e.g., breeding calls) and successful (e.g., young of year emergence) breeding and achieve a cumulative detection probability ≥ 0.90, a sufficient value for most research questions (MacKenzie et al., 2002; Table 5). Alternatively, if researchers were interested in documenting the presence of bullfrogs early in their invasion, or following control actions, our results suggest collecting 7 eDNA samples and filtering 1 liter of water per sample, would achieve a cumulative detection ≥ 0.99. For this objective, achieving high cumulative detection probabilities provides accurate presence and absence information (Table 5). Subsequently, VES and further removal efforts could then be scheduled at sites with positive eDNA detections.
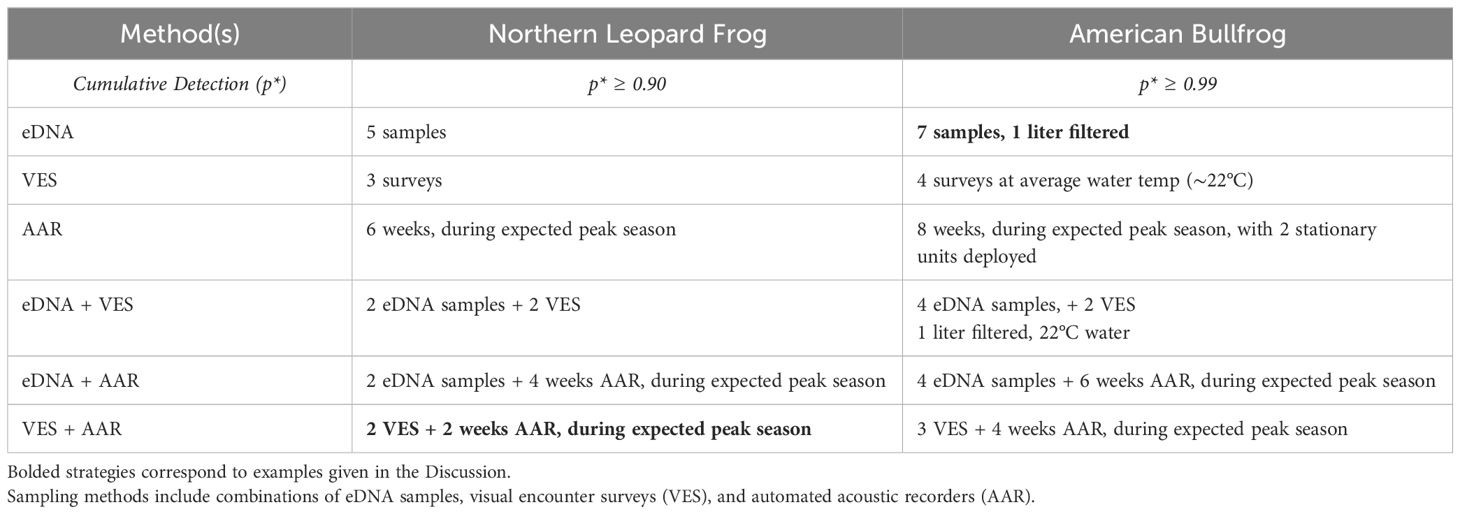
Table 5. Potential sampling strategies for northern leopard frog (Lithobates pipiens) and American bullfrog (Lithobates catesbeianus) to achieve target cumulative detection (p*).
A possible reason there are few conservation success stories, despite innovative monitoring tools and a plethora of research documenting species declines, is due to inadequate attention to imperfect detection. Understanding how management actions influence state variables over time can be clouded by a misunderstanding of the detection process. Our research provides an excellent framework to improve our understanding of detection probabilities for multiple species and methods to inform future conservation efforts. We encourage other investigators to employ a similar approach for their focal species, specifically: 1) identifying and modeling covariates that influence species- and method-specific detection probabilities, 2) determining the optimal sampling efforts required to achieve a desired detection probability, and 3) applying this knowledge to develop sampling strategies to effectively monitor amphibians to inform conservation decisions.
Data availability statement
The datasets presented in this article are not readily available because Colorado state statute prohibits sharing data collected on private property without written consent from the property owner. Requests to access the datasets should be directed to d2F2ZXJseS5kYXZpc0Bjb2xvc3RhdGUuZWR1.
Ethics statement
The animal study was approved by Colorado State University IACUC. The study was conducted in accordance with the local legislation and institutional requirements.
Author contributions
WD: Formal analysis, Writing – original draft, Conceptualization, Data curation, Investigation, Methodology, Validation, Visualization. LB: Funding acquisition, Resources, Supervision, Writing – review & editing, Conceptualization, Methodology. FW: Conceptualization, Funding acquisition, Resources, Supervision, Writing – review & editing, Methodology, Project administration.
Funding
The author(s) declare that financial support was received for the research and/or publication of this article. This research was funded by the Colorado Parks and Wildlife Species Conservation Trust Fund (SCTF406), which provided funding for fieldwork, data collection, data analysis, and manuscript preparation. Colorado State University (CSU) Extension and CSU Fish, Wildlife, and Conservation Biology internship programs funded technician salaries and were instrumental to the success of data collection.
Acknowledgments
We thank the reviewers for their valuable insights and thoughtful review of this research paper. This research would not have been possible without local organizations that helped with data collection and site access as well as the countless private landowners that granted access to their land. Special thanks to our field technicians Emma Sudbeck, Rémi Pattyn, Anthony Berardi, and Oliver Myers for their dedication to the project’s goals, which greatly contributed to the success of this research.
Conflict of interest
The authors declare that the research was conducted in the absence of any commercial or financial relationships that could be construed as a potential conflict of interest.
Generative AI statement
The author(s) declare that Generative AI was used in the creation of this manuscript. Generative AI was used to create Figure 2.
Publisher’s note
All claims expressed in this article are solely those of the authors and do not necessarily represent those of their affiliated organizations, or those of the publisher, the editors and the reviewers. Any product that may be evaluated in this article, or claim that may be made by its manufacturer, is not guaranteed or endorsed by the publisher.
Supplementary material
The Supplementary Material for this article can be found online at: https://www.frontiersin.org/articles/10.3389/famrs.2025.1547830/full#supplementary-material
References
Anderson D. R., Burnham K. P. (2002). Avoiding pitfalls when using information-theoretic methods. J. Wildl. Manage. 66, 912. doi: 10.2307/3803155
Bailey L. L., Jones P., Thompson K. G., Foutz H. P., Logan J. M., Wright F. B., et al. (2019). Determining presence of rare amphibian species: testing and combining novel survey methods. J. Herpetol. 53, 115. doi: 10.1670/18-122
Barnes M. A., Turner C. R., Jerde C. L., Renshaw M. A., Chadderton W. L., Lodge D. M. (2014). Environmental conditions influence eDNA persistence in aquatic systems. Environ. Sci. Technol. 48, 1819–1827. doi: 10.1021/es404734p
Bedwell M. E., Goldberg C. S. (2020). Spatial and temporal patterns of environmental DNA detection to inform sampling protocols in lentic and lotic systems. Ecol. Evol. 10, 1602–1612. doi: 10.1002/ece3.6014
Bennett J. R., Edwards B. P., Bergman J. N., Binley A. D., Buxton R. T., Hanna D. E., et al. (2024). How ignoring detection probability hurts biodiversity conservation. Front. Ecol. Environ. 22, e2782. doi: 10.1002/fee.2782
Bury B., Whelan J. (1985). Ecology and management of the bullfrog. U.S. Dept. Interior Fish Wildlife Service. 155, 7–10.
Buxton A. S., Groombridge J. J., Zakaria N. B., Griffiths R. A. (2017). Seasonal variation in environmental DNA in relation to population size and environmental factors. Sci. Rep. 7, 46294. doi: 10.1038/srep46294
Capranica R. R. (1968). The vocal repertoire of the bullfrog (Rana catesbeiana). Behaviour 31, 302–324. doi: 10.1163/156853968X00306
Corn P. S., Fogleman J. C. (1984). Extinction of montane populations of the northern leopard frog (Rana pipiens) in Colorado. J. Herpetol. 18, 147. doi: 10.2307/1563742
De Solla S. R., Shirose L. J., Fernie K. J., Barrett G. C., Brousseau C. S., Bishop C. A. (2005). Effect of sampling effort and species detectability on volunteer based anuran monitoring programs. Biol. Conserv. 121, 585–594. doi: 10.1016/j.biocon.2004.06.018
De Souza L. S., Godwin J. C., Renshaw M. A., Larson E. (2016). Environmental DNA (eDNA) detection probability is influenced by seasonal activity of organisms. PloS One 11, e0165273. doi: 10.1371/journal.pone.0165273
Ficetola G. F., Miaud C., Pompanon F., Taberlet P. (2008). Species detection using environmental DNA from water samples. Biol. Lett. 4, 423–425. doi: 10.1098/rsbl.2008.0118
Ficetola G. F., Thuiller W., Miaud C. (2007). Prediction and validation of the potential global distribution of a problematic alien invasive species — the American bullfrog. Divers. Distrib. 13, 476–485. doi: 10.1111/j.1472-4642.2007.00377.x
Fominykh A. S. (2008). An experimental study on the effect of alkaline water pH on the dynamics of amphibian larval development. Russ J. Ecol. 39, 145–147. doi: 10.1134/S1067413608020124
Gould W. R., Patla D. A., Daley R., Corn P. S., Hossack B. R., Bennetts R., et al. (2012). Estimating occupancy in large landscapes: evaluation of amphibian monitoring in the greater yellowstone ecosystem. Wetlands 32, 379–389. doi: 10.1007/s13157-012-0273-0
Guzy J. C., Price S. J., Dorcas M. E. (2014). Using multiple methods to assess detection probabilities of riparian-zone anurans: implications for monitoring. Wildl. Res. 41, 243. doi: 10.1071/WR14038
Hossack B. R., Howell P. E., Owens A. K., Cobos C., Goldberg C. S., Hall D., et al. (2022). Identifying factors linked with persistence of reintroduced populations: Lessons learned from 25 years of amphibian translocations. Glob. Ecol. Conserv. 35, e02078. doi: 10.1016/j.gecco.2022.e02078
Johnson P., McKenzie V. J., Peterson A. C., Kerby J. L., Brown J., Blaustein A. R., et al. (2011). Regional decline of an iconic amphibian associated with elevation, land-use change, and invasive species. Conserv. Biol. 25, 556–566. doi: 10.1111/j.1523-1739.2010.01645.x
Keck F., Blackman R. C., Bossart R., Brantschen J., Couton M., Hürlemann, et al. (2022). Meta-analysis shows both congruence and complementarity of DNA and eDNA metabarcoding to traditional methods for biological community assessment. Mol. Ecol. 31, 1820–1835. doi: 10.1111/mec.16364
Knutson M. G., Herner-Thogmartin J. H., Thogmartin W. E., Kapfer J. M., Nelson J. C. (2018). Habitat selection, movement patterns, and hazards encountered by northern leopard frogs (Lithobates pipiens) in an agricultural landscape. Herpetol. Conserv. Biol. 13, 113–130.
Larson K. A. (2004). Advertisement call complexity in northern leopard frogs, Rana pipiens. Copeia 2004, 676–682. doi: 10.1643/CH-03-247R2
Lillywhite H. B. (1970). Behavioral temperature regulation in the bullfrog, Rana catesbeiana. Copeia 1970, 158. doi: 10.2307/1441983
Luedtke J. A., Chanson J., Neam K., Hobin L., Maciel A. O., Catenazzi, et al. (2023). Ongoing declines for the world’s amphibians in the face of emerging threats. Nature 622, 308–314. doi: 10.1038/s41586-023-06578-4
MacKenzie D. I., Nichols J. D., Lachman G. B., Droege S., Andrew Royle J., Langtimm C. A. (2002). Estimating site occupancy rates when detection probabilities are less than one. Ecology 83, 2248–2255. doi: 10.1890/0012-9658(2002)083[2248:ESORWD]2.0.CO;2
Mattfeldt S. D., Bailey L. L., Grant E. H. C. (2009). Monitoring multiple species: Estimating state variables and exploring the efficacy of a monitoring program. Biol. Conserv. 142, 720–737. doi: 10.1016/j.biocon.2008.12.002
Moor H., Bergamini A., Vorburger C., Holderegger R., Bühler C., Egger S., et al. (2022). Bending the curve: Simple but massive conservation action leads to landscape-scale recovery of amphibians. Proc. Natl. Acad. Sci. U.S.A. 119, e2123070119. doi: 10.1073/pnas.2123070119
Morin D. J., Yackulic C. B., Diffendorfer J. E., Lesmeister D. B., Nielsen C. K., Reid J., et al. (2020). Is your ad hoc model selection strategy affecting your multimodel inference? Ecosphere 11, e02997. doi: 10.1002/ecs2.2997
Moss W. E., Harper L. R., Davis M. A., Goldberg C. S., Smith M. M., Johnson P. T. J. (2022). Navigating the trade-offs between environmental DNA and conventional field surveys for improved amphibian monitoring. Ecosphere 13, e3941. doi: 10.1002/ecs2.3941
Nichols J., Williams B. (2006). Monitoring for conservation. Trends Ecol. Evol. 21, 668–673. doi: 10.1016/j.tree.2006.08.007
Oseen K. L., Wassersug R. J. (2002). Environmental factors influencing calling in sympatric anurans. Oecologia 133, 616–625. doi: 10.1007/s00442-002-1067-5
Peterson A. C., Richgels K. L. D., Johnson P. T. J., McKenzie V. J. (2013). Investigating the dispersal routes used by an invasive amphibian, Lithobates catesbeianus, in human-dominated landscapes. Biol. Invasions 15, 2179–2191. doi: 10.1007/s10530-013-0442-y
Petitot M., Manceau N., Geniez P., Besnard A. (2014). Optimizing occupancy surveys by maximizing detection probability: application to amphibian monitoring in the Mediterranean region. Ecol. Evol. 4, 3538–3549. doi: 10.1002/ece3.1207
Pilliod D. S., Goldberg C. S., Arkle R. S., Waits L. P. (2013). Estimating occupancy and abundance of stream amphibians using environmental DNA from filtered water samples. Can. J. Fish. Aquat. Sci. 70, 1123–1130. doi: 10.1139/cjfas-2013-0047
Pope S. E., Fahrig L., Merriam H. G. (2000). Landscape complementation and metapopulation effects on leopard frog populations. Ecology 81, 2498–2508. doi: 10.1890/0012-9658(2000)081[2498:LCAMEO]2.0.CO;2
Prior K. M., Adams D. C., Klepzig K. D., Hulcr J. (2018). When does invasive species removal lead to ecological recovery? Implications for management success. Biol. Invasions 20, 267–283. doi: 10.1007/s10530-017-1542-x
Randall L. A., Goldberg C. S., Moehenschlager A. (2023). Environmental DNA surveys can underestimate amphibian occupancy and overestimate detection probability: implications for practice. J. Wildl. Manage. 87, e22463. doi: 10.1002/jwmg.22463
Ribeiro J. W., Harmon K., Leite G. A., De Melo T. N., LeBien J., Campos-Cerqueira M. (2022). Passive acoustic monitoring as a tool to investigate the spatial distribution of invasive alien species. Remote Sens. 14, 4565. doi: 10.3390/rs14184565
Rogers S. D., Peacock M. M. (2012). The disappearing northern leopard frog (Lithobates pipiens): conservation genetics and implications for remnant populations in western Nevada. Ecol. Evol. 2, 2040–2056. doi: 10.1002/ece3.308
Schlichter L. C. (1981). Low pH affects the fertilization and development of Rana pipiens eggs. Can. J. Zool. 59, 1693–1699. doi: 10.1139/z81-233
Sepulveda A. J., Schabacker J., Smith S., Al-Chokhachy R., Luikart G., Amish S. J. (2019). Improved detection of rare, endangered and invasive trout in using a new large-volume sampling method for eDNA capture. Environ. DNA 1, 227–237. doi: 10.1002/edn3.23
Smith B. E., Keinath D. A. (2007). Northern Leopard Frog (Rana pipiens): A Technical Conservation Assessment (USDA Forest Service, Rocky Mountain Region). Available at: http://www.fs.fed.us/r2/projects/scp/assessments/northernleopardfrog.pdf (Accessed July 15, 2024).
Sommers M. D., Randall L. A., Barclay R. M. R. (2018). Effects of environmental variables on the calling behaviour of Northern Leopard Frogs (Lithobates pipiens) in Alberta, Canada. Can. J. Zool. 96, 163–169. doi: 10.1139/cjz-2016-0239
Steenweg R., Hebblewhite M., Whittington J., McKelvey K. (2019). Species-specific differences in detection and occupancy probabilities help drive ability to detect trends in occupancy. Ecosphere 10, e02639. doi: 10.1002/ecs2.2639
Strickler K. M., Fremier A. K., Goldberg C. S. (2015). Quantifying effects of UV-B, temperature, and pH on eDNA degradation in aquatic microcosms. Biol. Conserv. 183, 85–92. doi: 10.1016/j.biocon.2014.11.038
Sugai L. S. M., Silva T. S. F., Ribeiro J. W., Llusia D. (2019). Terrestrial passive acoustic monitoring: review and perspectives. BioScience 69, 15–25. doi: 10.1093/biosci/biy147
Thomas A. C., Howard J., Nguyen P. L., Seimon T. A., Goldberg C. S. (2018). eDNA Sampler: A fully integrated environmental DNA sampling system. Methods Ecol. Evol. 9, 1379–1385. doi: 10.1111/2041-210X.12994
Voordouw M. J., Adama D., Houston B., Govindarajulu P., Robinson J. (2010). Prevalence of the pathogenic chytrid fungus, Batrachochytrium dendrobatidis, in an endangered population of northern leopard frogs, Rana pipiens. BMC Ecol. 10, 6. doi: 10.1186/1472-6785-10-6
White G. C., Burnham K. P. (1999). Program MARK: survival estimation from populations of marked animals. Bird Study 46, S120–S139. doi: 10.1080/00063659909477239
Wikston M., Breton B.-A. A., Vilaça S. T., Bennett A. M., Kyle C. J., Beresford D. V., et al. (2023). Comparative efficacy of eDNA and conventional methods for monitoring wetland anuran communities. Front. Ecol. Evol. 11. doi: 10.3389/fevo.2023.1179158
Yates M. C., Glaser D. M., Post J. R., Cristescu M. E., Fraser D. J., Derry A. M. (2021). The relationship between eDNA particle concentration and organism abundance in nature is strengthened by allometric scaling. Mol. Ecol. 30, 3068–3082. doi: 10.1111/mec.15543
Keywords: invasive species, conservation, monitoring methods, detection probability, eDNA, automated acoustic recorders, Lithobates catesbeianus (American bullfrog), Lithobates pipiens (northern leopard frog)
Citation: Davis W, Bailey L and Wright FB III (2025) Life history traits influence method-specific detection of native and invasive amphibians. Front. Amphib. Reptile Sci. 3:1547830. doi: 10.3389/famrs.2025.1547830
Received: 18 December 2024; Accepted: 03 April 2025;
Published: 24 April 2025.
Edited by:
Amanda Kissel, United States Geological Survey, United StatesReviewed by:
Andrew M Ray, United States Department of the Interior, United StatesWynne Moss, United States Department of the Interior, United States
Copyright © 2025 Davis, Bailey and Wright. This is an open-access article distributed under the terms of the Creative Commons Attribution License (CC BY). The use, distribution or reproduction in other forums is permitted, provided the original author(s) and the copyright owner(s) are credited and that the original publication in this journal is cited, in accordance with accepted academic practice. No use, distribution or reproduction is permitted which does not comply with these terms.
*Correspondence: Waverly Davis, d2F2ZXJseS5kYXZpc0Bjb2xvc3RhdGUuZWR1