 Juan Pablo Muñoz-Pérez1,2,3,4,5*
 Gregory A. Lewbart2,3,6
 Tania Toapanta7Helen Chadwick8
 Elvis D. Okoffo7
 Daniela Alarcón-Ruales1,2,3,5
 Leo Zurita-Arthos2,3
 Jen S. Jones9
 Fernando Cisneros2
 Andres Moreira-Mendieta2,3Cristina Vintimilla-Palacios3
 Cristina Miranda4Felipe Vallejo4Emma Houck6Rubén Alemán10Kamila Escobar-Flores10Alice Skehel1,3Jason Castañeda11Patricia Secoura6Shelly Vaden6
 Ceri Lewis12Tamara Galloway12
 Bryan Wallace13
 Brendan J. Godley8
 Matthew Cole14
 Penelope Lindeque14
 Kevin V. Thomas7
 Dominique A. Potvin1Carlos A. Valle2,3
 Kathy A. Townsend1
- 1School of Science, Technology and Engineering, University of the Sunshine Coast (UniSC), Hervey Bay, QLD, Australia
- 2Colegio de Ciencias Biológicas y Ambientales (COCIBA), Universidad San Francisco de Quito (USFQ), Puerto Baquerizo Moreno, Galápagos, Ecuador
- 3Galápagos Science Center (GSC), USFQ and UNC-Chapel Hill, Puerto Baquerizo Moreno, Galápagos, Ecuador
- 4Fundación EquilibrioAzul, Puerto López, Ecuador
- 5Applied Ocean Physics & Engineering Woods Hole Oceanographic Institution (WHOI), Woods Hole, MA, United States
- 6College of Veterinary Medicine, North Carolina State University, Raleigh, NC, United States
- 7Queensland Alliance for Environmental Health Sciences (QAEHS), The University of Queensland, Brisbane, QLD, Australia
- 8Centre for Ecology and Conservation (CEC), University of Exeter, Penryn, United Kingdom
- 9Galapagos Conservation Trust (GCT), London, United Kingdom
- 10Parque Nacional Machalilla, Puerto López, Ecuador
- 11Parque Nacional Galápagos, Puerto Baquerizo Moreno, Galápagos, Ecuador
- 12College of Life and Environmental Sciences, University of Exeter, Exeter, United Kingdom
- 13Ecolibrium, Inc., Boulder, CO, United States
- 14Plymouth Marine Laboratory (PML), Plymouth, United Kingdom
Marine vertebrates, particularly green sea turtles, are especially vulnerable to plastic pollution through ingestion or entanglement. This study investigated wild juvenile green sea turtles (Chelonia mydas) from two Ecuadorian national parks (Galápagos and Machallilla) to assess the prevalence of plastic pollution in their feces and its potential impact on various health metrics. We analyzed fecal samples from 46 juvenile green sea turtles using Fourier transform infrared spectroscopy (FT-IR) to quantify microplastics (MPs). A complementary methodology using pressurized liquid extraction with double-shot pyrolysis-mass spectrometry gas chromatography (Pyr-GC/MS) was also employed to quantify synthetic polymer mass concentrations. The results from these analyses were compared with blood analytes. FT-IR analysis revealed a mean of 4.4±5.2 MPs/g in fecal samples, with the highest quantities found in the Galápagos Marine Reserve (GMR). The most common MPs shape identified were fibers (x̄= 3.8±4.5 MPs/g), and the predominant synthetic polymers were polyvinyl alcohol (PVOH) and polyacrylates (PMMA). The daily intake of MPs by the sampled turtles ranged from a minimum of 312±409 MPs/day to a maximum of 430±563 MPs/day. Pyr-GC/MS analysis detected polyethylene (PE) with a mean of 367±1158 µg/g and polypropylene (PP) with a mean of 155±434 µg/g in fecal samples, with the highest pollution levels observed in the GMR. Both FT-IR and Pyr-GC/MS techniques detected plastic pollution in 98% of the sampled population. Although both FT-IR and Pyr-GC/MS are reliable methods, they produced slightly different results due to methodological variations. However, both supported the finding that turtles in the GMR were exposed to higher rates of plastic ingestion. Despite the turtles appearing clinically healthy based on blood analysis, significant differences in eleven health metrics were observed between turtles classified as less at risk and those most at risk for plastic pollution. Further research is necessary to understand the potential health implications of these findings.
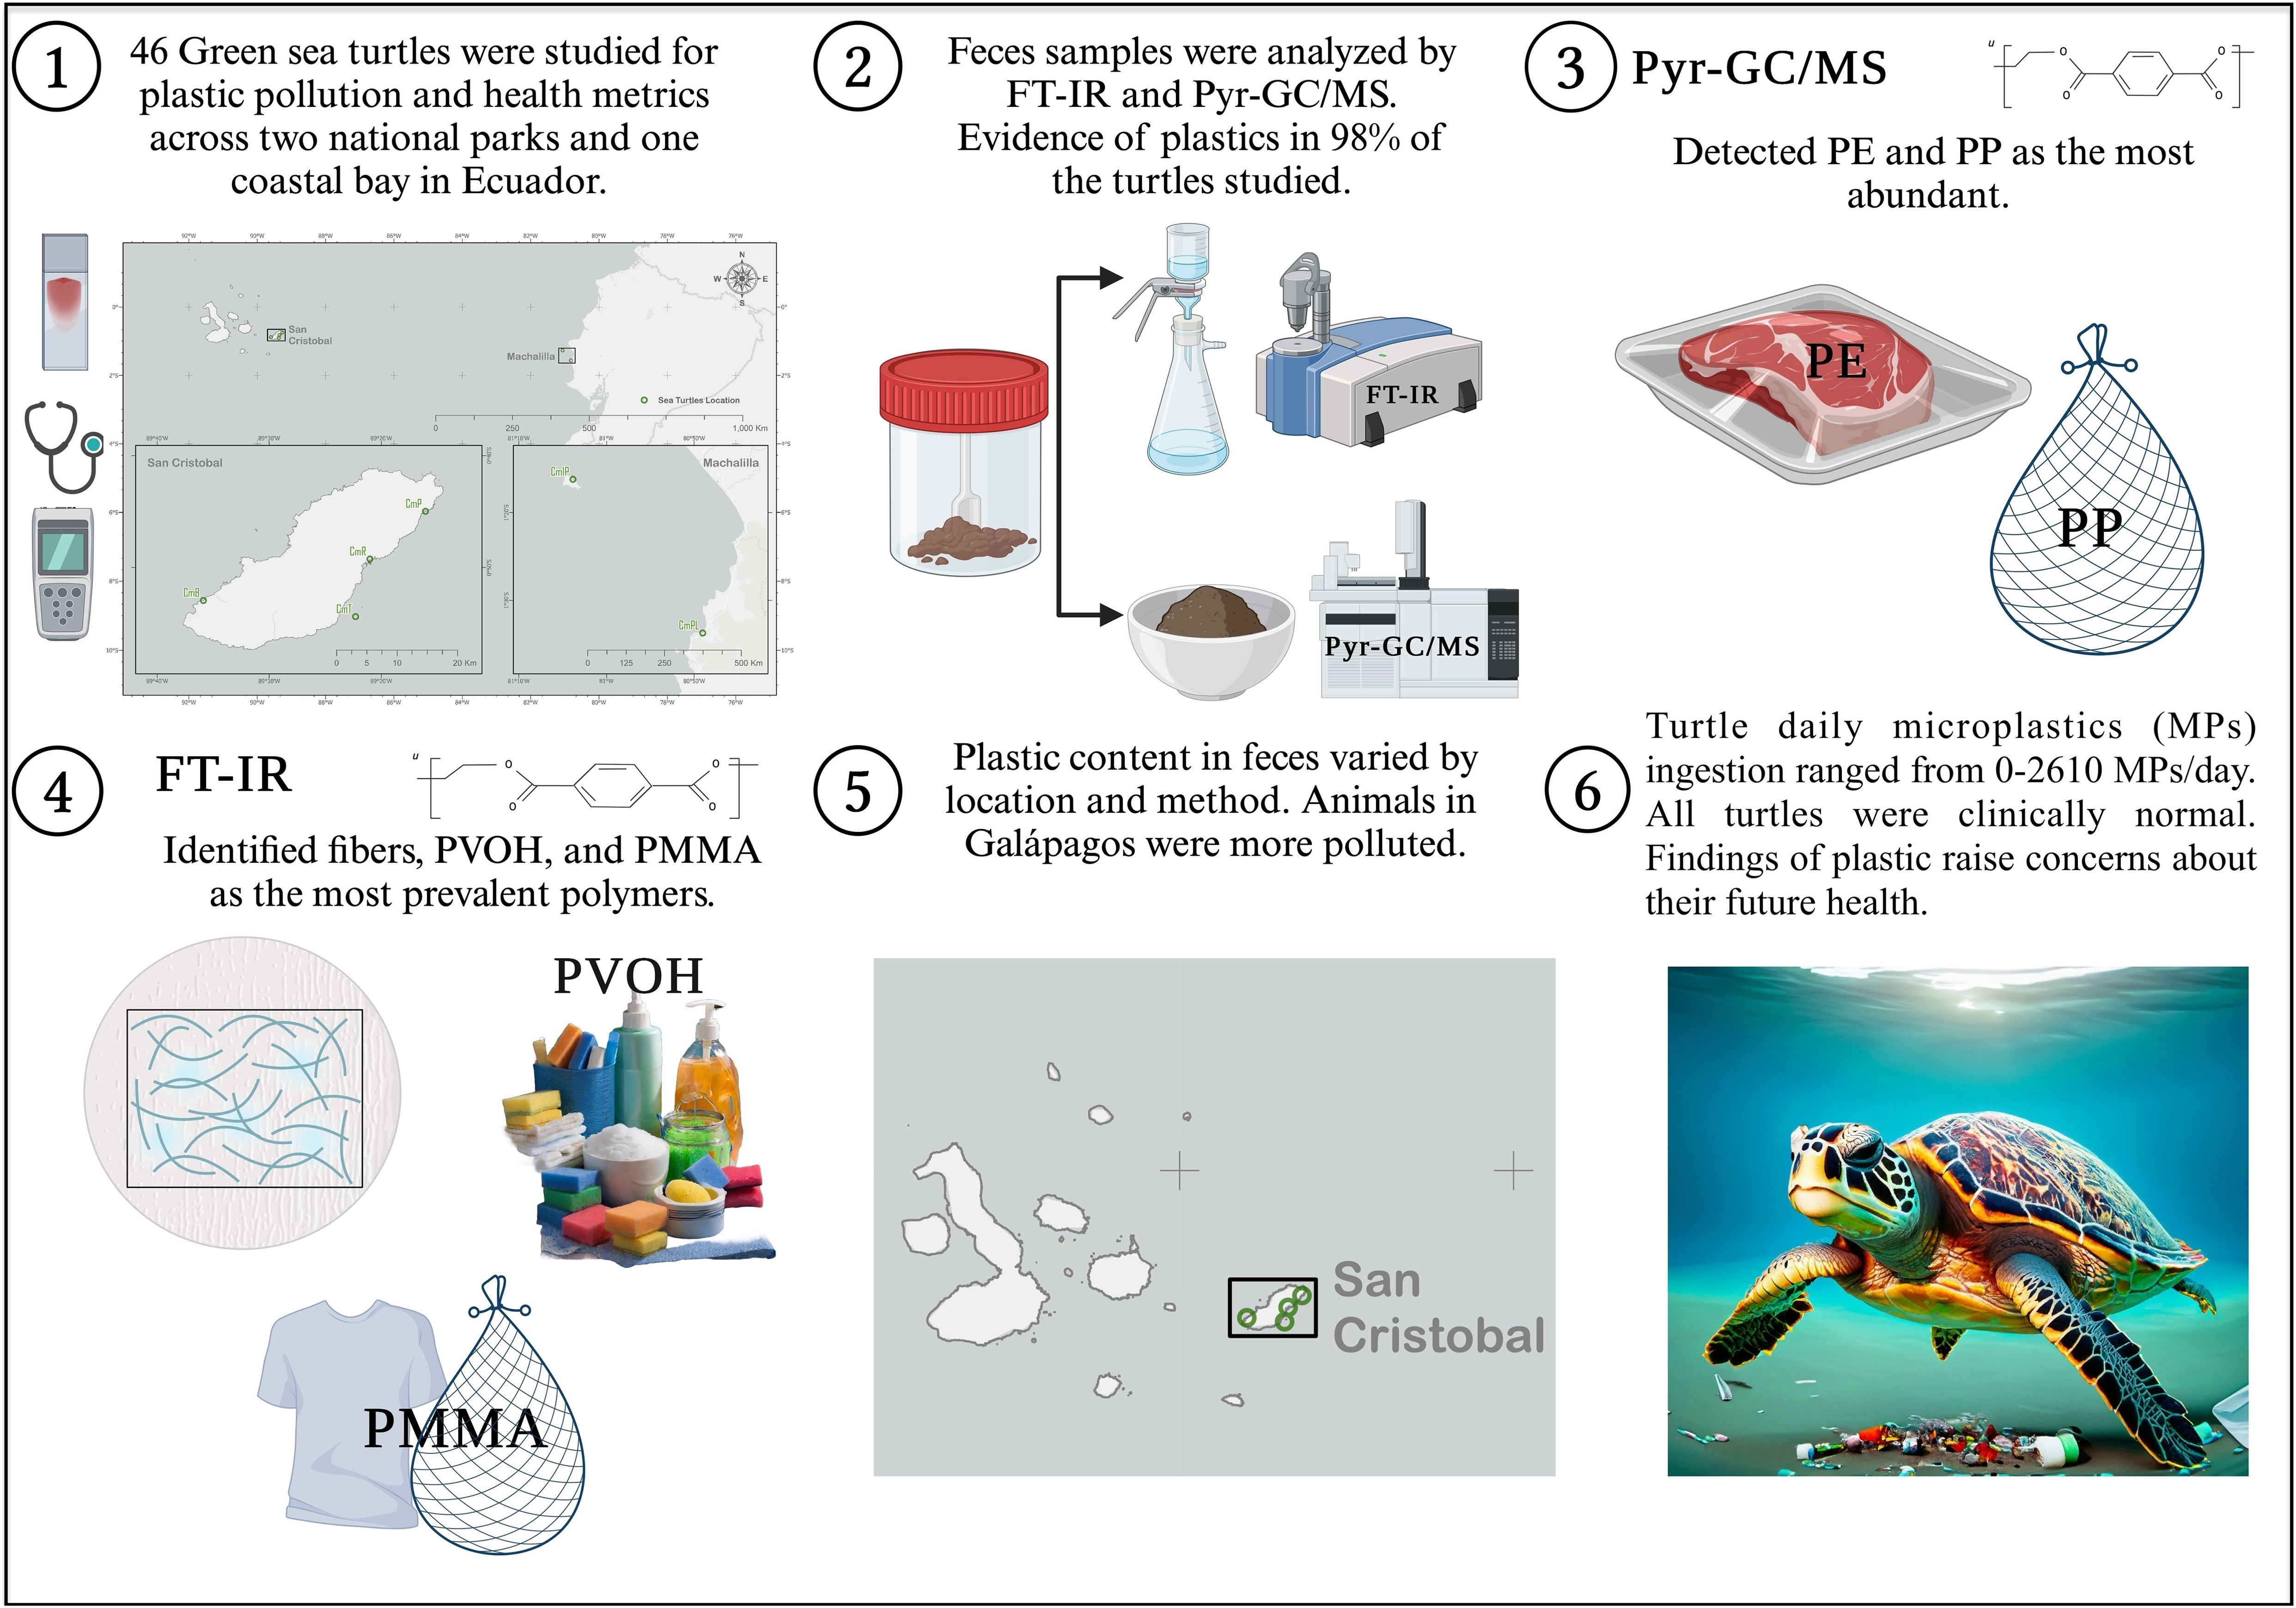
Graphical Abstract. This graphical abstract describes the main findings of this study and presents sample sites, methods, and results. Created using BioRender.com
Highlights
● Wild green sea turtles in Ecuador were studied for plastic pollution and health metrics.
● Evidence of plastic in the feces of 98% of the sea turtles studied.
● FT-IR identified PVOH and PMMA fibers as the most frequent.
● Pyr-GC/MS detected PE and PP as the most abundant.
● Plastic content in feces varied by location and method.
● Daily intake of MPs by sampled sea turtles varied from a minimum of 312 ± 409 MPs/day to a maximum of 430 ± 563 MPs/day.
● Turtles appeared clinically normal, but health metrics differed significantly between those classified as less and most at risk for plastic pollution.
1 Introduction
Plastic pollution consists of waste and chemicals originating from human-made artifacts composed of artificial polymers that cannot be recycled (Thompson, 2015; Frias and Nash, 2019). Macroplastics are artificial objects larger than 5 mm, while microplastics (MPs) are synthetic particles ranging in size from 1 μm to 5 mm and can have regular or irregular shapes (Thompson, 2015; Frias and Nash, 2019; Lusher et al., 2020).
Plastic pollution is a pervasive global pollutant. It is ubiquitous worldwide and extends to the most remote areas, including the polar regions, tropics, ocean surfaces, and depths (Eriksen et al., 2014; Jambeck et al., 2015; Van Sebille et al., 2015; Li et al., 2016; Taylor et al., 2016; Kane et al., 2020). Despite being protected areas, the Galápagos National Park (GNP) and Machalilla National Park (MNP) are not immune to this global threat (MacLeod et al., 2021; Botterell et al., 2024) and are facing severe and increasing levels of plastic pollution. In the Galápagos National Park (GNP), macroplastic abundance ranges from 0.003 to 2.87 items/m2 (Muñoz-Pérez et al., 2023). The Machalilla National Park (MNP), located in the region with the highest litter densities on the Ecuadorian mainland coastline, has a macroplastic abundance ranging from 0.31 to 2.5 items/m2 (Gaibor et al., 2020; Botterell et al., 2024).
More than 1,400 marine vertebrate species have been reported to interact with or be affected by plastic debris worldwide (Gall and Thompson, 2015; Claro et al., 2019). Plastic pollution poses a threat to marine megafauna, causing both lethal and sub-lethal effects, such as entanglement and ingestion, which can impair an individual’s ability to acquire resources, maintain health, and reproduce successfully (Laist, 1997; Li et al., 2016; Galloway et al., 2017; Senko et al., 2020).
Carr (1987) was the first to report the ingestion of plastic in wild sea turtles, providing evidence that the pelagic-phase of these animals, during which immature turtles are passive migrants, is increasingly invaded by plastic marine debris. For instance, Pelagic Pacific sea turtles ingest substantial quantities of plastics (median 5 g in gut) (Jung et al., 2018a). Sea turtles are especially vulnerable to ingestion or entanglement given that their habitats overlap with those of anthropogenic debris (Schuyler et al., 2016; Duncan et al., 2017; Wilcox et al., 2018). Moreover, as oceanic tropical and protected islands become increasingly polluted with plastics globally, sea turtles are more likely to encounter plastic marine debris, resulting in ingestion or entanglement (Schuyler et al., 2016; Rodríguez et al., 2022).
Plastic ingestion has been observed in all sea turtle species through the accidental ingestion of microplastics (MPs) attached to natural foods or mistaken for prey (Schuyler et al., 2012; Hoarau et al., 2014; Nicolau et al., 2016; Duncan et al., 2019a, b). For example, Hoarau et al. (2014) found that 84% of hard plastic fragments in loggerhead sea turtles (Caretta caretta) consisted of round-shaped caps, which visually resemble nektonic organisms that these turtles frequently prey upon and are often found floating near the surface.
Hard plastic fragments, bottle caps, bottles, and plastic covers are among the most common artifacts found in marine debris surveys along the Galápagos coast (Jones et al., 2021; Muñoz-Pérez et al., 2023), raising concerns regarding the potential impact of these items on marine reptiles such as turtles. The green sea turtle (Chelonia mydas), listed as vulnerable (VU) by the International Union for Conservation of Nature (IUCN), has been identified as a high-risk species for plastic ingestion and entanglement in recent assessments of the Galápagos Islands (Jones et al., 2021; Muñoz-Pérez et al., 2023).
Although reports on the health effects of plastic pollution in sea turtles are limited, physiological effects have been documented. For example, elevated corticosterone levels, indicative of physiological stress, have been observed in entangled loggerhead sea turtles, which can lead to decreased mobility (Hunt et al., 2016). As illustrated in Figure 1, entanglement significantly impacts marine animal health, resulting in physical injuries and illnesses, including lacerations, constriction, severe sclerosis, limb loss, and breathing difficulties. Such physiological stress can impede diving capabilities, increase hydrodynamic drag, and frequently result in death (Senko et al., 2020). Even when not directly causing fatalities, these physical injuries and stress responses can significantly impact the survival and reproductive success of entrapped sea turtles (Gregory, 2009; Senko et al., 2020).
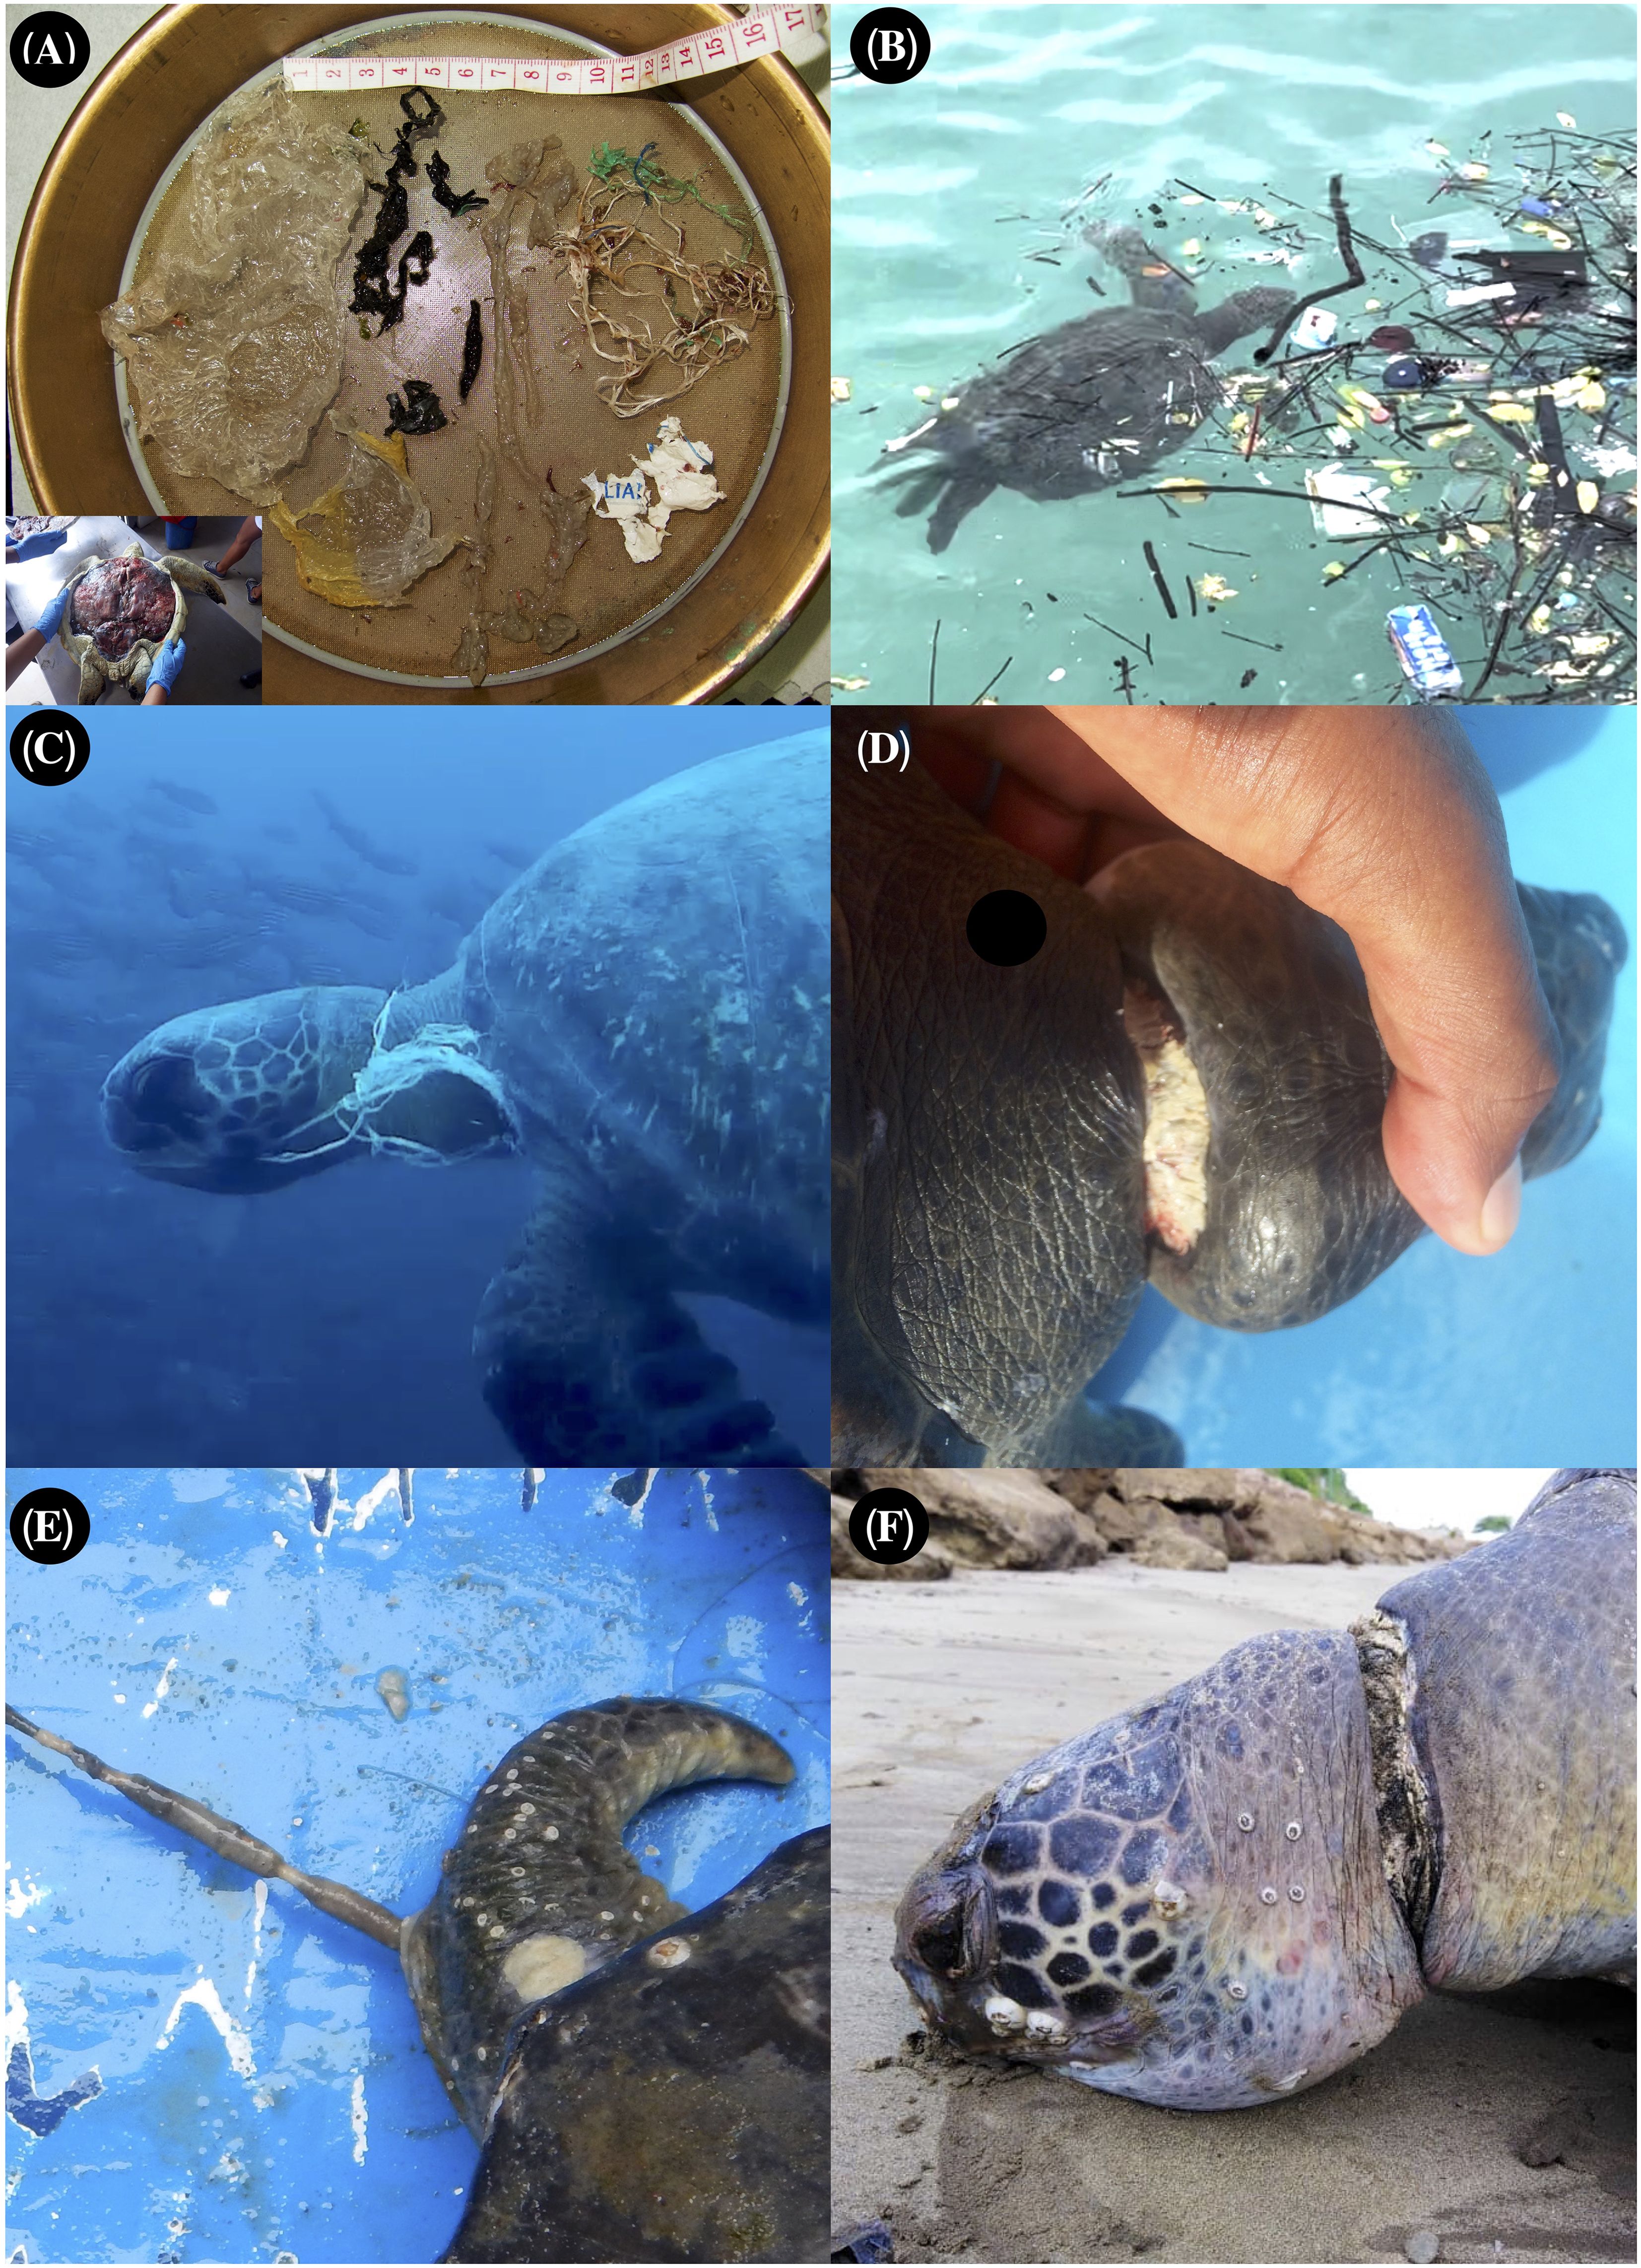
Figure 1. Documented interactions between plastic pollution and green sea turtles (Chelonia mydas) from Two Ecuador National Parks (Galápagos and Machalilla). Each image is accompanied by the name of the photographer, who has consented to the use of their photograph in this study. (A) C. mydas ingestion and dead with plastic debris on San Cristóbal Island. © Juan Pablo Muñoz-Pérez. (B) C. mydas habitat polluted with plastic pollution on Santa Cruz Island. © Carolina Pezantes. (C) C. mydas entangled in plastic debris on San Cristóbal Island. © Ricardo Mendieta. (D) C. mydas with neck nearly severed by marine debris on Española Island. © Manuel Yépez. (E) C. mydas expelling a fishing line through the cloaca on La Plata Island. © Cristina Miranda (F) C. mydas found dead due to entanglement in neck at Puerto Lopéz Bay. © Sofia Jones.
Herbivorous sea turtles, such as C. mydas, are more likely to ingest plastic than carnivorous species (Caron et al., 2018). The most frequently reported effects of plastic pollution on sea turtles include laryngeal ulcerations, perforations, and lacerations (Nelms et al., 2016). These injuries can lead to chronic infections, peritonitis, gastrointestinal motility problems, septicemia, poor nutrient absorption, absorption of toxic plasticizers, a weakened immune system, food dilution, exposure to pollutants, and potentially death (Nelms et al., 2016; Vélez-Rubio et al., 2018; Senko et al., 2020; Meaza et al., 2021).
It is of utmost importance to note that ingesting even a single plastic item carries a 22% probability of resulting in the demise of a turtle (Wilcox et al., 2018). Moreover, studies conducted along the coastline of Brazil observed that 20-100% of the examined green sea turtles ingested anthropogenic debris (Tourinho et al., 2010; Santos et al., 2011). These statistics serve as a stark reminder of the severe effects of plastic pollution on marine turtles.
Research on plastic pollution in sea turtles and other wild marine animals primarily involves examination of deceased individuals through necropsy and analysis of the gastrointestinal tract (Clukey et al., 2017; Caron et al., 2018; Duncan et al., 2019b; Rizzi et al., 2019; Darmon et al., 2022). It has been observed that plastic pollution can negatively impact all stages of a sea turtle’s life cycle (Carr, 1987; Nelms et al., 2016). However, Schuyler et al. (2012), Nelms et al. (2016), and Duncan et al. (2019b) reported that juvenile sea turtles are particularly susceptible to the ingestion of macroplastics and microplastics due to their extended life cycle duration in coastal bay habitats. This highlights the necessity of utilizing innovative methods to identify plastic ingestion and its effects in combination with health metrics. In the present study, we addressed the deficiency of knowledge regarding wild, live sea turtles.
In Ecuador, there is a general absence of comprehensive health assessments for various species of sea turtles, especially wild sea turtles along the continental coast. A standard baseline was established to describe some health metrics (blood analytes) of C.mydas (Lewbart et al., 2014) and hawksbill turtles (Eretmochelys imbricata) (Muñoz-Pérez et al., 2017) on the Galápagos Islands. To the best of our knowledge, there are no ongoing research initiatives aimed at exploring the impact of plastic pollution on the health of wild sea turtles.
Our research aimed to compare plastic pollution metrics in wild juvenile green sea turtles (C. mydas) in Ecuador and explore potential links between plastic pollution and standard health metrics. This study examined the extent of plastic pollution in sea turtle feces and surrounding environments at six locations across the provinces of Manabí and Galápagos, including Galápagos National Park, Machalilla National Park, and the coastal town of Puerto López on the Ecuadorian mainland. The findings of this study offer insights into the impacts of this type of emergent pollution on wildlife health. These findings can be utilized to enhance surveillance and management strategies to minimize the consequences of plastic pollution on marine wildlife and their protected habitats.
2 Materials and methods
2.1 Ethics
This study was conducted as part of the Galápagos Science Center (GSC) plastic pollution research program, under permits granted by the Galápagos National Park Service (PC-23-19, PC-81-20, and PC-32-21). Additionally, it was carried out within the framework of the Equilibrio Azul (EA) sea turtles research program, authorized by the Machalilla National Park Service (permit MAAE-REES-2021-0195). The research protocols were approved by Universidad San Francisco de Quito (USFQ), North Carolina State University (NC State), and the University of the Sunshine Coast (UniSC) under ethics approval ANS2178. All handling and sampling procedures conformed to established vertebrate and veterinary standards.
2.2 Study area and taxa
Fieldwork was conducted between May and June 2021. During this period, assessments of wildlife and environmental plastic pollution were conducted in three areas: Galápagos National Park on San Cristóbal Island, Machalilla National Park on La Plata Island, and the coastal bay of Puerto López on mainland Ecuador. Samples were collected from six distinct locations, as shown in Figure 2. The sampling sites were Baquerizo Bay, San Cristóbal Island (CmB); Tongo Bay, San Cristóbal Island (CmT); Rosa Blanca Bay, San Cristóbal Island (CmR); Puerto Tablas Bay, San Cristóbal Island (CmP); Puerto López Bay (CmPL); and Drake Bay on La Plata Island (CmIP). We collected samples from 46 juvenile green sea turtles (C. mydas), with more than five individuals sampled at each of the following locations: CmB (n=6), CmT (n=7), CmR (n=6), CmP (n=7), CmPL (n=10), and CmIP (n=10).
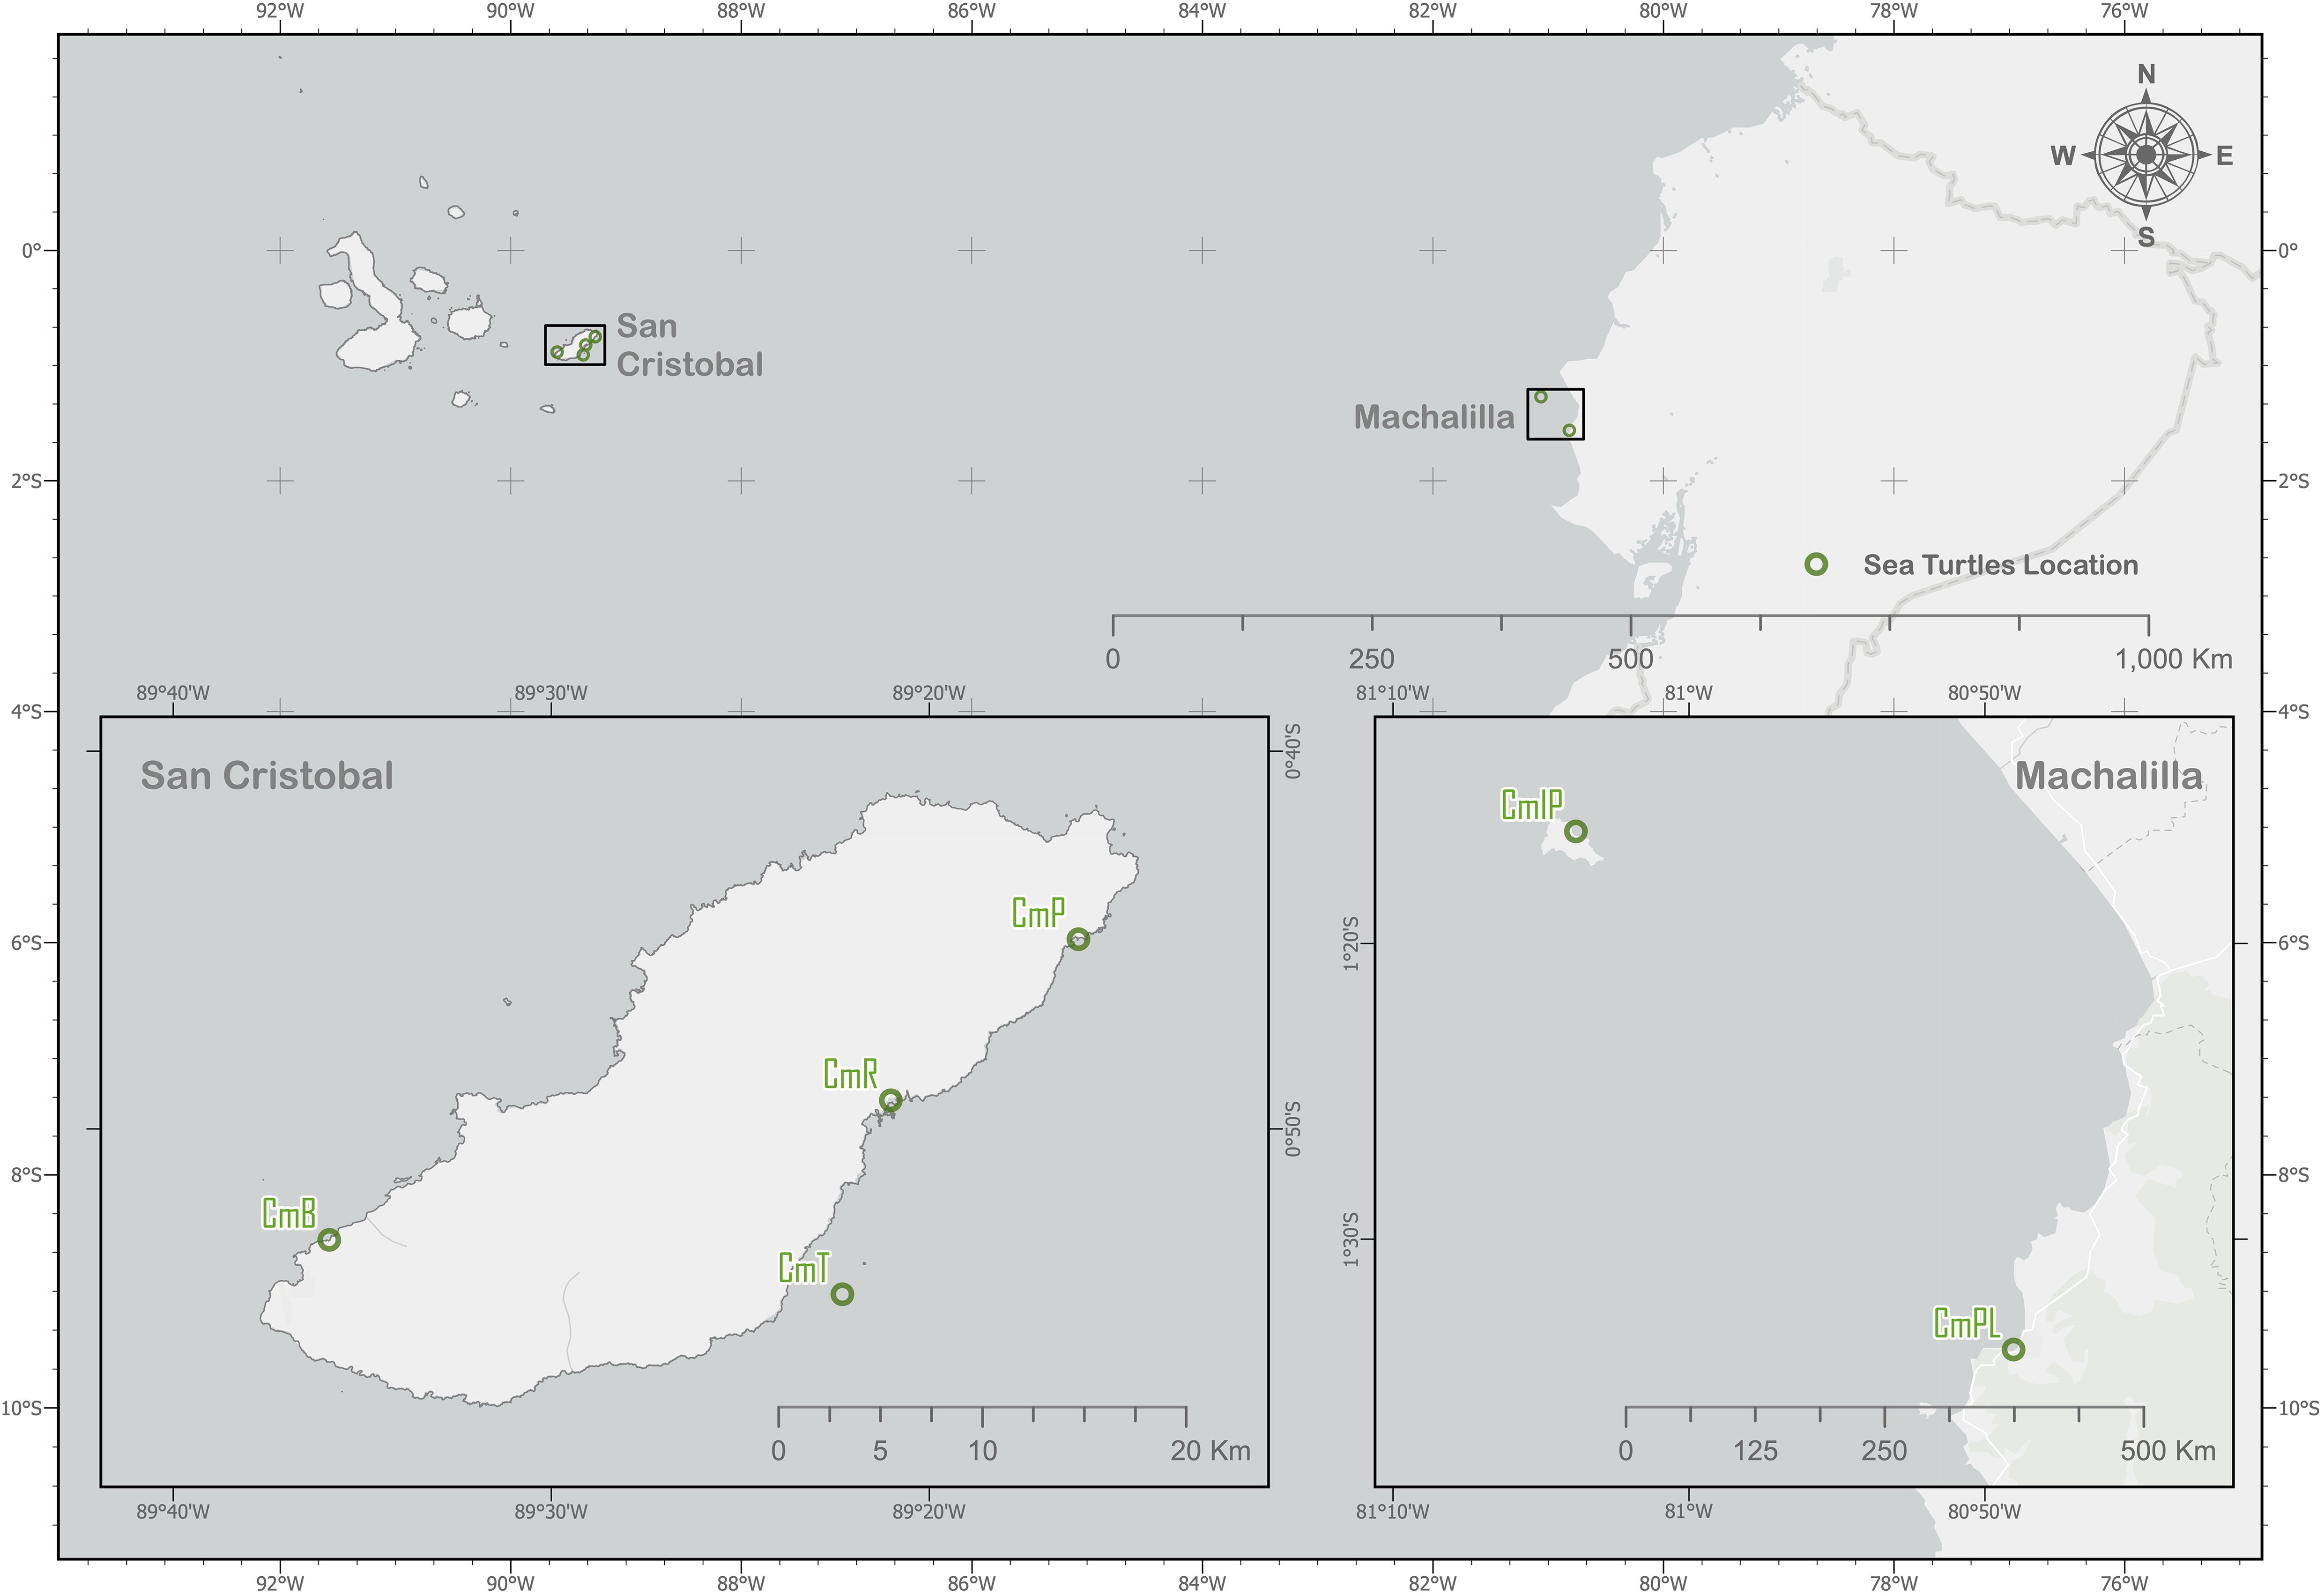
Figure 2. Sampling sites in Ecuador for juvenile green sea turtles (Chelonia mydas). The sampling locations include: Baquerizo Bay, San Cristóbal Island (CmB); Tongo Bay, San Cristóbal Island (CmT); Rosa Blanca Bay, San Cristóbal Island (CmR); Puerto Tablas Bay, San Cristóbal Island (CmP); Puerto López Bay (CmPL); and Drake Bay, La Plata Island (CmIP).
2.3 Environmental plastic pollution surveys
Microplastics (MPs) and macroplastics were collected from seawater and beach environments where sea turtles were captured. The assessment of MPs followed the methods described by Jones et al. (2021, 2022; Jones, 2021). The concentration of MPs per m3 of surface water was measured using plankton nets and three replicate surface-water transects. Surface sand samples were sieved from a 50 cm quadrat to count large MPs (1–5 mm) in three random locations along 50 m transects, with results expressed as MPs per m2. The assessment of beach macroplastics followed the procedures of Muñoz-Pérez et al. (2023), where visible plastic pieces larger than 5 mm were collected from a 50-m transect, analyzed in the laboratory, and macroplastic density calculated based on the shoreline area sampled, expressed as macroplastics per m2. Additionally, the mass concentrations of plastics in surface water (μg of polymer/g) were evaluated using plankton nets and three surface-water transect samplings. These water/plankton samples were analyzed in the same manner as sea turtle feces samples, as described in Section 2.6.
2.4 Juvenile green sea turtle (Chelonia mydas): sampling methodologies and health assessment metrics
The health of sea turtles was assessed using methods outlined in Lewbart et al. (2014) and Muñoz-Pérez et al. (2017). The selection of health metrics was guided by the advice of our wildlife veterinarian (GAL) to align with the normal range of health metrics previously established in wild sea turtles. Additionally, in accordance with the suggestions of Casale et al. (2016), only turtles observed feeding were captured to ensure accurate assessment of potential plastic marine debris ingestion.
The turtles were hand-captured by their carapace by free divers equipped with snorkels, masks, and fins. The animals were then transported to a field laboratory located on land within 100 meters of the capture site for immediate examination, measurement, weighing, and sampling. Sea turtle feces (STF) samples were collected using endoscopy and rectal enema in a field setting prior to measurement. This technique was specifically designed for the present study, and further details can be found in Kaleel et al. (2023). The average time interval between turtle capture and fecal sample collection was 161 minutes (range: 10-546 minutes).
Subsequently, we collected blood samples, with an average handling time interval between green sea turtle capture and blood sample collection of 168 minutes (range: 220-552 minutes). Blood samples (approximately 2.5 mL in volume) were obtained from the dorsal jugular sinus of manually restrained sea turtles using a heparinized 22-gauge, 2.5 cm needle attached to a 3 mL syringe. Blood was immediately divided into subsamples for either instant blood chemistry measurements or hematological and plasma analyses.
Instant blood chemistry measurements were performed using a portable iSTAT clinical analyzer (Heska Corporation, Fort Collins, Colorado, USA) and CHEM8+ cartridges, as well as a Lactate Plus analyzer (Nova Biomedical, Waltham, MA, USA). The iSTAT is a handheld, battery-powered device that measures selected blood gases and biochemical and hematological parameters using only 0.095 mL of noncoagulated whole blood. Utilizing a portable microcentrifuge (Eppendorf North America, Inc., model 547), approximately 0.05 mL of blood was centrifuged for 5 minutes at 14,000 × g to determine the packed cell volume (PCV) and total protein (TP). The PCV was calculated by comparing the proportion of red blood cells to plasma in the tubes. TP values were recorded after one or two drops of plasma were placed in a refractometer (Advanced Optics, Oregon City, Oregon, USA).
Blood smears were prepared in duplicate on hematology glass slides and fixed with Diff-Quik approximately two weeks after sampling. Diff-Quik staining comprises a fixative agent (methanol, blue), solution I (eosinophilic, orange), and solution II (basophilic, blue) (EclinPath Cornell, 2013). The slides were sequentially dipped into each solution six times (left for 10-15 seconds in each solution), rinsed with water, and dried (Jorgenson Laboratories, Loveland, CO, USA).
Stained blood films were used to perform a 100-cell white blood cell (WBC) differential and to estimate WBC counts. The WBC differential served to quantify the number and/or percentage of each type of WBC present in the blood sample at the time of testing. All WBCs were subjected to microscopic examination using an ACCU-SCOPE 3000-LED-40 Binocular Biological/Cytology Microscope with variable magnification ranging from 340 to 3100. For consistency, differentials were conducted exclusively by the co-author (KE), who possessed expertise in this technique.
Immediately following blood sampling, cloacal temperature, external temperature, heart rate, and respiratory rate were recorded. Respiratory rates were measured in respirations per minute (rpm) using visualization, while heart rate was determined in beats per minute (bpm) using a Doppler ultrasound probe (Parks Medical Electronics, Inc., Aloha, Oregon, USA) placed over the heart. An EBRO1 compact J/K/T/E thermocouple thermometer, model EW-91219-40 (manufactured by Cole Parmer, Vernon Hills, Illinois, USA), was used in conjunction with a polyvinyl chloride (PVC) epoxy-tipped 24 GA probe and a Nubee® infrared temperature gun (Model NU838OH) to determine the core body temperature in °C (Valle et al., 2019).
Standard measurements were performed using appropriate instruments. The curved carapace length (CCL), curved carapace width (CCW), plastron length (PL), and plastron width (PW) were measured in centimeters using a flexible measuring tape. Head length (HL), head width (HW), plastron tail length (PTL), and plastron tail width (PTW) were measured in centimeters using a caliper. Turtle weights were determined in kilograms using a digital scale with a 50 g precision.
Subsequently, a visual veterinary external examination index (VEEI) was adapted from Manire et al. (2017) and performed. The mean index was calculated based on 11 external visual parameters rated on a scale of 1 (normal) to 2 (abnormal). The parameters assessed included: BC (body condition), MM (mucus membrane), H (hydration), PS (pain score), EENT (eye, ear, nose, and throat), S (skin), C (coelom), U (urogenital), MSK (musculoskeletal), and N (neuro), and whether or not there was any external or internal injury present.
Prior to releasing each turtle, a white zinc oxide ointment line measuring approximately 5 cm × 2 cm was applied to the animal’s carapace to prevent recapture (Lewbart et al., 2014). Each animal was scanned to determine the presence of an ID microchip. Digital images of the carapace and both sides of the head were captured for identification (Reisser et al., 2008; Schofield et al., 2008; Carpentier et al., 2016). Conventional coded metallic Inconel self-piercing sea turtle tags (National Band and Tag Company STYLE 681IC) were attached to the rear flippers of each turtle. The average handling time was 193 minutes (range: 43–582 minutes).
2.5 Digestion, identification, and quantification of microplastics in sea turtle fecal samples using Fourier-transform infrared spectroscopy
It is essential to remove organic matter from STF samples before FT-IR analysis, as it may interfere with the detection of MPs. Therefore, approximately half of each STF sample (mean = 0.98 g dw; range: 0.18-3.2 g) was digested following the protocol described by Prata et al. (2019) and Yan et al. (2020) for the efficient removal of organic matter (e.g., algae, driftwood, feathers, fish muscle, paraffin, and oil) with minimal polymer degradation. The samples were digested at 50°C using hydrogen peroxide with an iron catalyst (H2O2 + Fe) or Fenton’s reagent for 24 hours.
Fenton’s reagent comprised a 1:1 ratio of hydrogen peroxide (H2O2; 30%; Fisher Scientific) and ferrous sulphate heptahydrate (FeSO4.7H2O) solution, prepared by dissolving 15 g of FeSO4.7H2O crystals (Arcōs Organics) in 1 L of 0.2 μm filtered Milli-Q water with 3 mL of sulfuric acid (H2SO4; 95%; Fisher Scientific) to adjust the pH to 3.0 and prevent the precipitation of iron hydroxide (Savage et al., 2022). The Fenton’s reagent was filtered through a GF/C Whatman™ filter (41 mm diameter, 1.2 µm pore size) before being added to the samples for digestion.
Following digestion, the solution was filtered through a polycarbonate filter with a pore size of 8 µm and a diameter of 47 mm (GE Healthcare Life Sciences Whatman™ Cellulose Nitrate Membrane Filters). Each filter was then systematically examined using an Olympus MVX10 microscope. Any suspected synthetic particles were isolated, imaged, counted, and categorized based on their shape (fiber, film, or fragment). Each MP candidate was then transferred to a silver-coated membrane filter (5 µm pore size and 47 mm diameter; Sterlitech®) by marking the location of the particles on the filter with a dissection needle, after which the filter was scratched with a needle to reveal the presence of MPs. This process was carried out with utmost care and precision to ensure accuracy.
FT-IR spectroscopy was used to confirm the presence of plastic polymers in the silver filters by analyzing the MPs extracted from each sample. This was performed using a PerkinElmer Spotlight 400 FT-IR imaging system (MCT detector, KBr window) operating in reflectance mode from 4000 to 750 cm⁻¹ with 4 cm⁻¹ resolution, averaged over four scans. Seventy percent was the threshold for minimum hit quality between the absorbance spectra and those in the standard polymer reference library (Jung et al., 2018b; Nelms et al., 2018). MPs that appeared in the filters other than those previously marked on the silver filter were excluded.
2.6 Mass concentration of plastic polymers in sea turtle fecal samples: analysis via pressurized liquid extraction combined with double-shot pyrolysis-gas chromatography/mass spectrometry
The methods described by Okoffo et al. (2020) and Ribeiro et al. (2020) were used. The STF subsamples were analyzed using pressurized liquid extraction (PLE), with approximately 2.1 grams dw (range: 0.15-6.5 g) of the STF subsamples being extracted. The plastics were identified and quantified using the double-shot Pyr-GC/MS method after complete extraction. This technique is effective in removing organic materials from samples and in identifying synthetic polymers.
2.7 Quantifying daily ingestion and excretion rates of microplastics in sampled green sea turtle populations
To determine the possible daily rates of MPs that may be ingested and excreted by juvenile green sea turtles in our study, we adapted the calculations performed by Garcia-Garin et al. (2021) for fin whales. We based our estimates on the daily feeding and excretion rates for wild juvenile C. mydas, as reported by Bjorndal (1980, 1985) and Thayer et al. (1982). These values were considered the minimum and maximum feeding and excretion rates per day, respectively. Using these values, we calculated the daily excretion rate in grams dry weight (dw) (E) for our sampled green sea turtles.
The calculations were as follows: According to (Thayer et al., 1982), the average daily fecal production for a 27 kg C. mydas was 30 g (dw)/day, and for a 64 kg C. mydas was 68 g (dw)/day. To estimate the daily rate of MPs excreted by our sampled turtles (MPsE), we multiplied the calculated excretion rates in grams dry weight (E) for our animals by the number of MPs detected in the assessed fecal samples (i.e., 4.4 MPs/g). We then considered daily feeding rates between 0.24% and 0.33% of their body weight each day (dw), as reported by Bjorndal (1980), to estimate the minimum and maximum daily feeding rates in grams dry weight (I) for the sampled sea turtles. Finally, we used the following equation to calculate the minimum and maximum possible daily number of ingested MPs (MPsIs):
2.8 Identification of high-risk locations for plastic pollution in sea turtles based on environmental and fecal analysis
Despite the ubiquity of plastic pollution, it is essential to evaluate the risks faced by populations and individuals of wild animals, as the occurrence of ingestion can vary among different individuals. Therefore, after measuring plastic pollution in the sea turtle fecal samples and their habitats, we adapted and utilized the scoring method developed by Jones et al. (2021), Roman et al. (2022), and Muñoz-Pérez et al. (2023). A scoring criteria was constructed to evaluate the extent and risk of plastic pollution at the sampled sea turtle locations (refer to Table 1). The total risk score (TS) was calculated based on the quantification of plastic pollution found in sea turtle habitats and feces, combined with the conservation priority status of sea turtles in the area, as per Frazier (2014). The plastic pollution scores (low, moderate, and high) were determined based on the average quantities of plastic pollution found in the sampled habitats and fecal samples. We applied the following formula for the Total Score (TS):
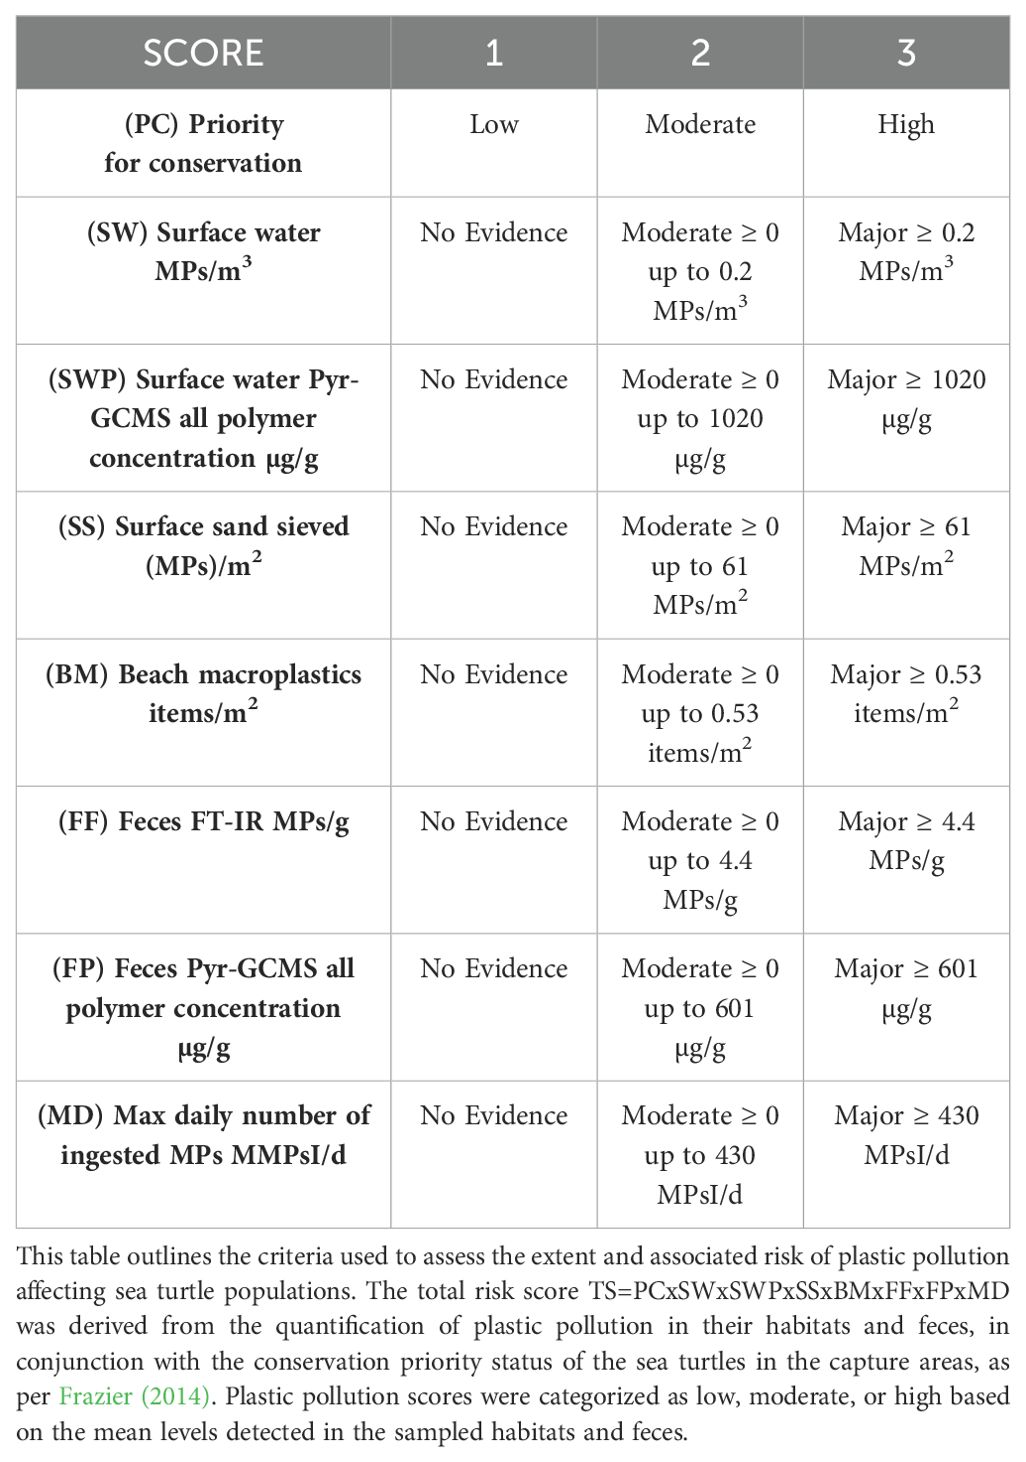
Table 1. Scoring criteria for evaluating the extent and risk of plastic pollution in sampled green sea turtle populations.
Where: Priority for conservation (PC), Surface water MPs/m3 (SW), Surface water Pyr-GCMS total all polymer concentration µg/g (SWP), Surface sand sieved (MPs)/m2 (SS), Beach macroplastics items/m2 (BM), Feces samples MPs by FT-IR MPs/g (FF), Feces samples Polymer % by Pyr-GCMS µg of polymer/g (FP), and Max daily number of ingested MPs (MD).
2.9 Investigating the relationship between plastic pollution and health metrics in sampled juvenile green sea turtles
The health metrics (blood analytes) data of the sampled juvenile green sea turtles were compared between animals classified as less at risk and those classified as more at risk for plastic pollution according to the plastic pollution measurements in habitats and feces performed in our study.
2.10 Mitigating external plastic pollution in field and laboratory detection of plastic pollution in sea turtle fecal samples
2.10.1 Field sample collection of sea turtle feces
Based on the guidelines presented by Nelms et al. (2018, 2019) and Nguyen et al. (2019), the potential for cross-contamination of sea turtle feces (STF) samples can be minimized through the implementation of rigorous field collection processing procedures. STF samples were obtained directly from the animals using meticulously cleaned field tools, including metal collectors, forceps, spoons, aluminum envelopes, and glass containers. The rigorous cleaning process involved washing with distilled water and heating for 5 hours at 450°C in a laboratory furnace to eliminate residual plastic contamination (Hardesty et al., 2015).
Each STF sample was collected directly from the animal without contact with any surface. A fresh set of uncontaminated collection tools and nitrile gloves were used for each STF collection, which was conducted by the same individual (JPMP), the lead author. Samples were subsequently stored in pre-cleaned aluminum foil, which were then sealed in airtight plastic bags. Finally, Petri dishes equipped with filters were used throughout the field sampling process to estimate possible airborne MPs contamination. Following the completion of the field collection, the “control filters” were secured in pre-cleaned aluminum envelopes and then encased in an airtight case and plastic bag for future MPs inspection.
2.10.2 Laboratory preparation and procedures to reduce microplastic contamination in samples
The extraction of MPs and subsequent analysis of the filters were performed in strict adherence to MPs contamination prevention methods described by Woodall et al. (2015) and Wesch et al. (2017). Consequently, all samples, filters, and laboratory tools were stored in a clean-air laminar flow hood, covered with borosilicate petri dishes, or contained in pre-cleaned aluminum envelopes to maintain a high level of sterility and prevent contamination. Cotton laboratory coats and nitrile gloves were worn during sample preparation. Prior to the initiation of the work, all workstations were cleaned with 70% filtered ethanol. Metal tools for sample handling and glass Erlenmeyer flasks for digestion were cleaned using a natural fiber brush and detergent, followed by three cycles of rinsing with Milli-Q water to ensure thorough cleaning.
The STF samples were only extracted from their aluminum containers when transferred to sterile and previously cleaned Erlenmeyer glass flasks for wet weight measurement in grams and subsequent organic matter digestion. A control/blank consisting of 20 ml of Milli-Q water and a digestion reagent was implemented throughout the digestion process for each batch of samples originating from a specific location to control for contamination at this stage of sample processing. All filters were dried at 40°C for a minimum of 18 hours in closed borosilicate petri dishes to eliminate moisture. The petri dishes were then sealed with Parafilm® until the next step.
During each day of digestion and filtration, a control wet filter was stored in an open borosilicate petri dish in a laminar flow hood. After filtering the samples daily, the filter was assembled in Erlenmeyer glass flasks containing 100 ml of Milli-Q water. All blank/procedural control filters were examined using microscopy and FT-IR. Control filters were also left open throughout the FT-IR process to control for airborne contamination. All procedural/blank filters were inspected in the same manner, and any confirmed microplastic-type polymer was discriminated from the final results. Please refer to Supplementary Data Table 1 for additional information.
2.10.3 Laboratory preparation for mass concentration of plastic polymers in sea turtle fecal samples via pressurized liquid extraction combined with double-shot pyrolysis-gas chromatography/mass spectrometry
We followed to all previously described contamination prevention protocols and processed the STF subsamples for Pyr-GC-MS analysis during the wet sample-weighing phase. The STF subsamples were subsequently transferred into clean glass vials, specifically Thomas 9A130 Glass 40 mL Amber Assemble Vials with accompanying aluminum foil liners and caps. These vials were then weighed and underwent lyophilization using a FreeZone 2.5 Liter -50°C Benchtop Freeze Dryer (LABCONCO).
After approximately 48 hours, each sample was progressively transformed into a fine powder using an 80 mm PZRT ceramic pestle. This operation was conducted at each sample site to avoid cross-contamination. The homogenized powder was weighed and subsequently sealed in glass vials with aluminum foil, following good laboratory practices to ensure sample integrity. This procedure was performed in a fume hood to minimize the risk of air contamination.
A control filter was placed in a separate vial during the processing of each batch of samples to monitor lyophilization and the transformation of the fine powder, which was subsequently evaluated for the presence of synthetic polymers within the same batch of samples. Please refer to Supplementary Data Table 2 for additional information.
2.11 Statistical analyses
Statistical analyses were performed using GraphPad Prism, version 10.2.3. Shapiro-Wilk tests were conducted to assess normality in the data (passed normality test, α=0.05). Pairwise comparisons are presented in figures and tables. Only values and lines with P or q values less than or equal to 0.05 are indicated. Please refer to the supplementary data for additional information.
2.11.1 Health metrics (Blood analytes)
The following health metric (blood analyte) data were normally distributed: sodium (Na) mmol/L, potassium (K) mmol/L, chloride (Cl) mmol/L, ionized calcium (iCa) mmol/L, TCO2 mmol/L, lactate mg/dL, total protein g/dL, hematocrit (Hct) % PCV, heterophil %, and eosinophil %. The following health metric data were non-normally distributed: anion gap mmol/L, glucose mg/dL, blood urea nitrogen (BUN) mg/dL, creatinine (Crea) mg/dL, hemoglobin (Hgb) g/dL, lymphocytes %, monocytes %, basophils %, and white blood cells (WBC) K/μl.
Statistical comparisons were conducted to assess significant differences in the health metrics between the current study and previous health metric baselines presented in (Aguirre and Balazs, 2000; Lewbart et al., 2014; Reséndiz and Lara-Uc, 2018; De Mello and Alvarez, 2020) using a Mann-Whitney U test. Additionally, a Kruskal-Wallis test with Dunn’s multiple comparisons was performed to investigate differences in each blood analyte metric among the sampled locations of juvenile sea turtles.
2.11.2 Plastic pollution
The data collected on plastic pollution did not conform to a normal distribution. Therefore, non-parametric Kruskal-Wallis tests were conducted to determine whether there were any statistically significant differences in plastic pollution quantities in STF between the sampled locations of wild juvenile green sea turtles.
3 Results
3.1 Environmental plastic pollution surveys
The results of the analysis of the sampled sea turtle environments showed the presence of plastic pollution at every sampling location. A summary of the information for each sampling site is presented in Table 2 and Figure 3. Surface water MPs were highest in Puerto López Bay (CmPL) with 0.35 MPs/m3 and lowest in Tongo Bay, San Cristóbal Island (CmT) with 0.08 MPs/m3. Surface water polymer concentration was highest in Rosa Blanca Bay, San Cristóbal Island (CmR) with 2747.61 µg/g and lowest in Drake Bay, La Plata Island (CmIP) with 35.17 µg/g. Beach macroplastics were highest in Puerto López Bay (CmPL) with 2.05 items/m2 and non-detected in Baquerizo Bay, San Cristóbal Island (CmB) with 0 items/m2. Surface sand large MPs were also highest in Puerto López Bay (CmPL) with 157 MPs/m2 and non-detected in Baquerizo Bay, San Cristóbal Island (CmB) with 0 MPs/m2.
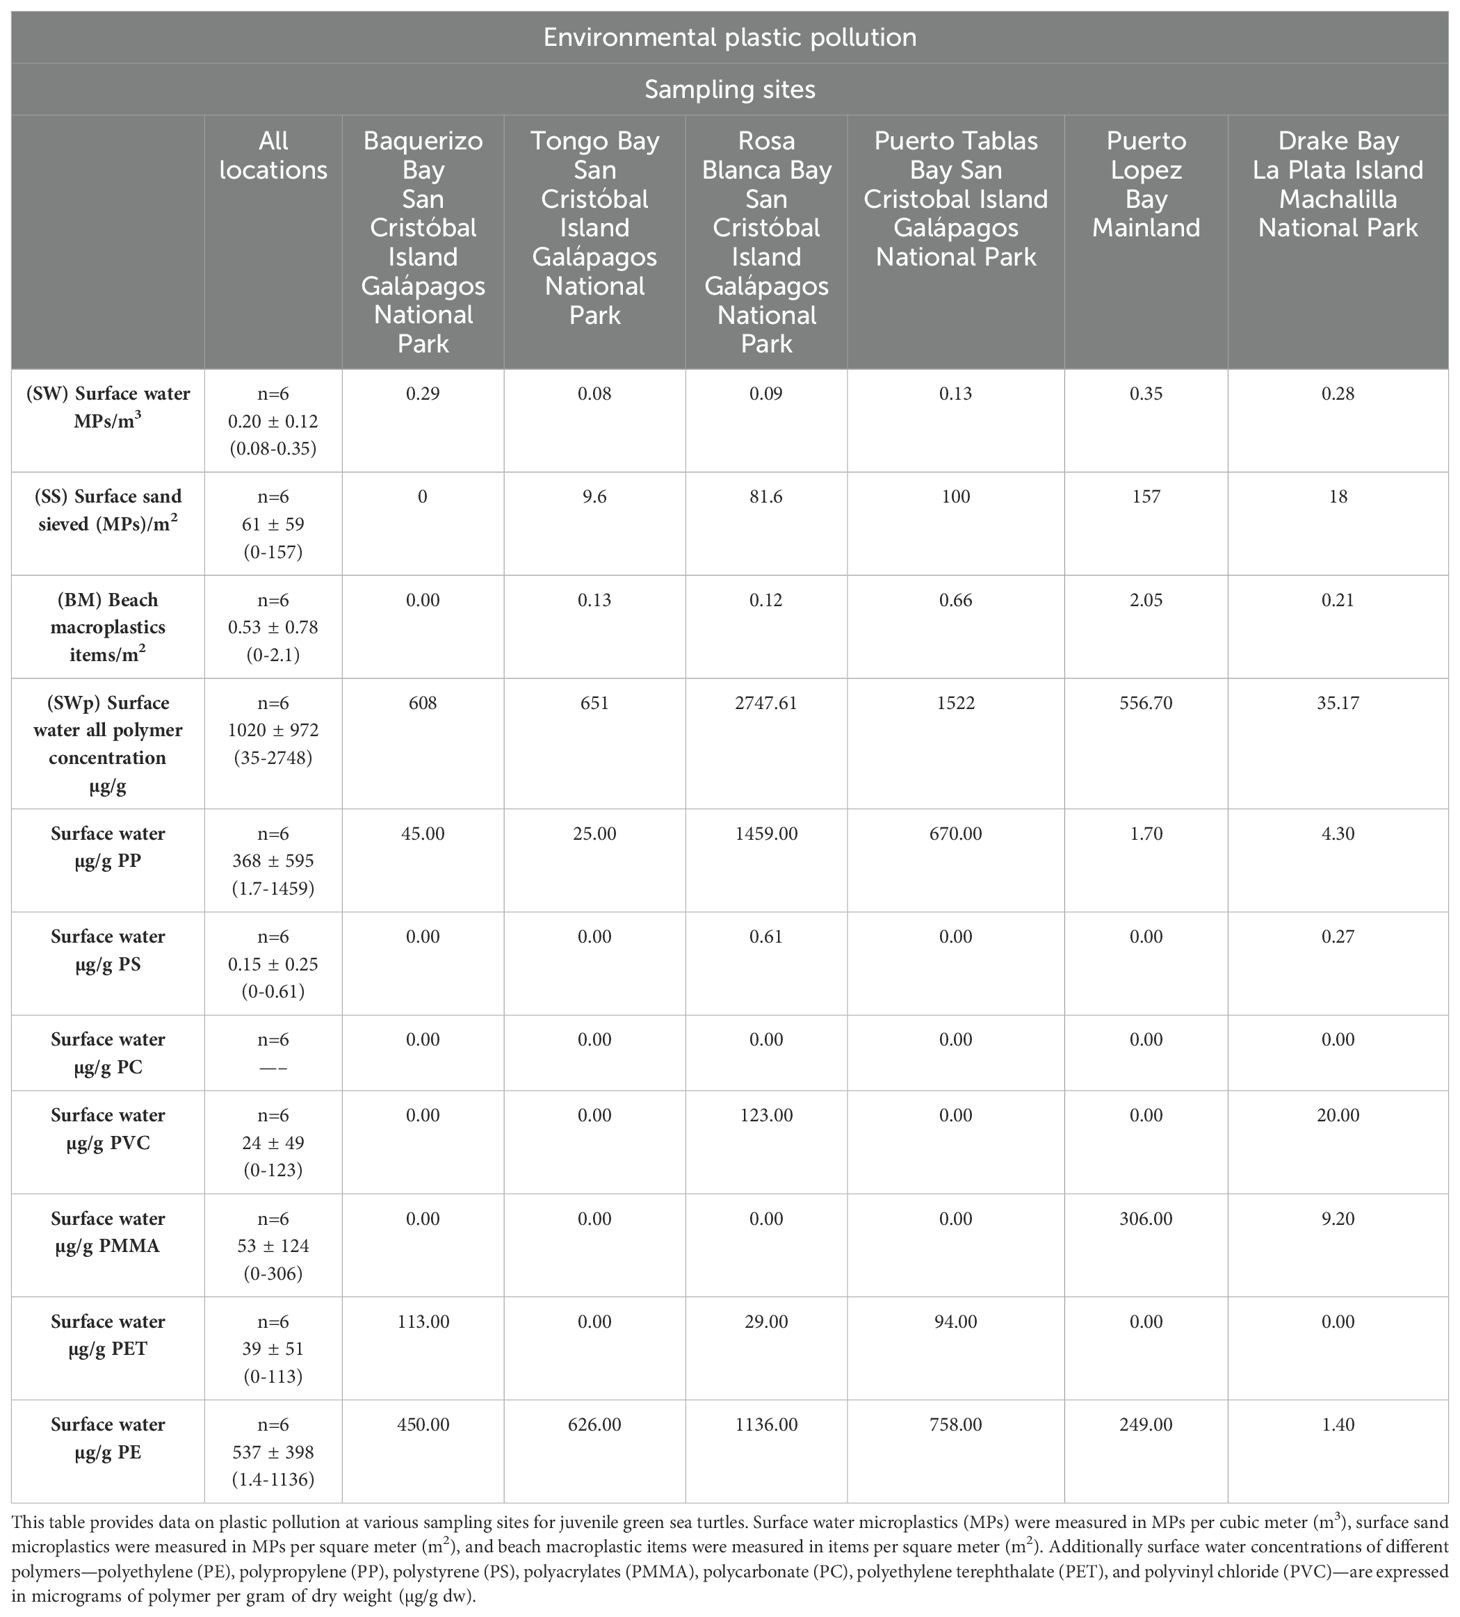
Table 2. Environmental plastic pollution at juvenile green sea turtle sampling sites.
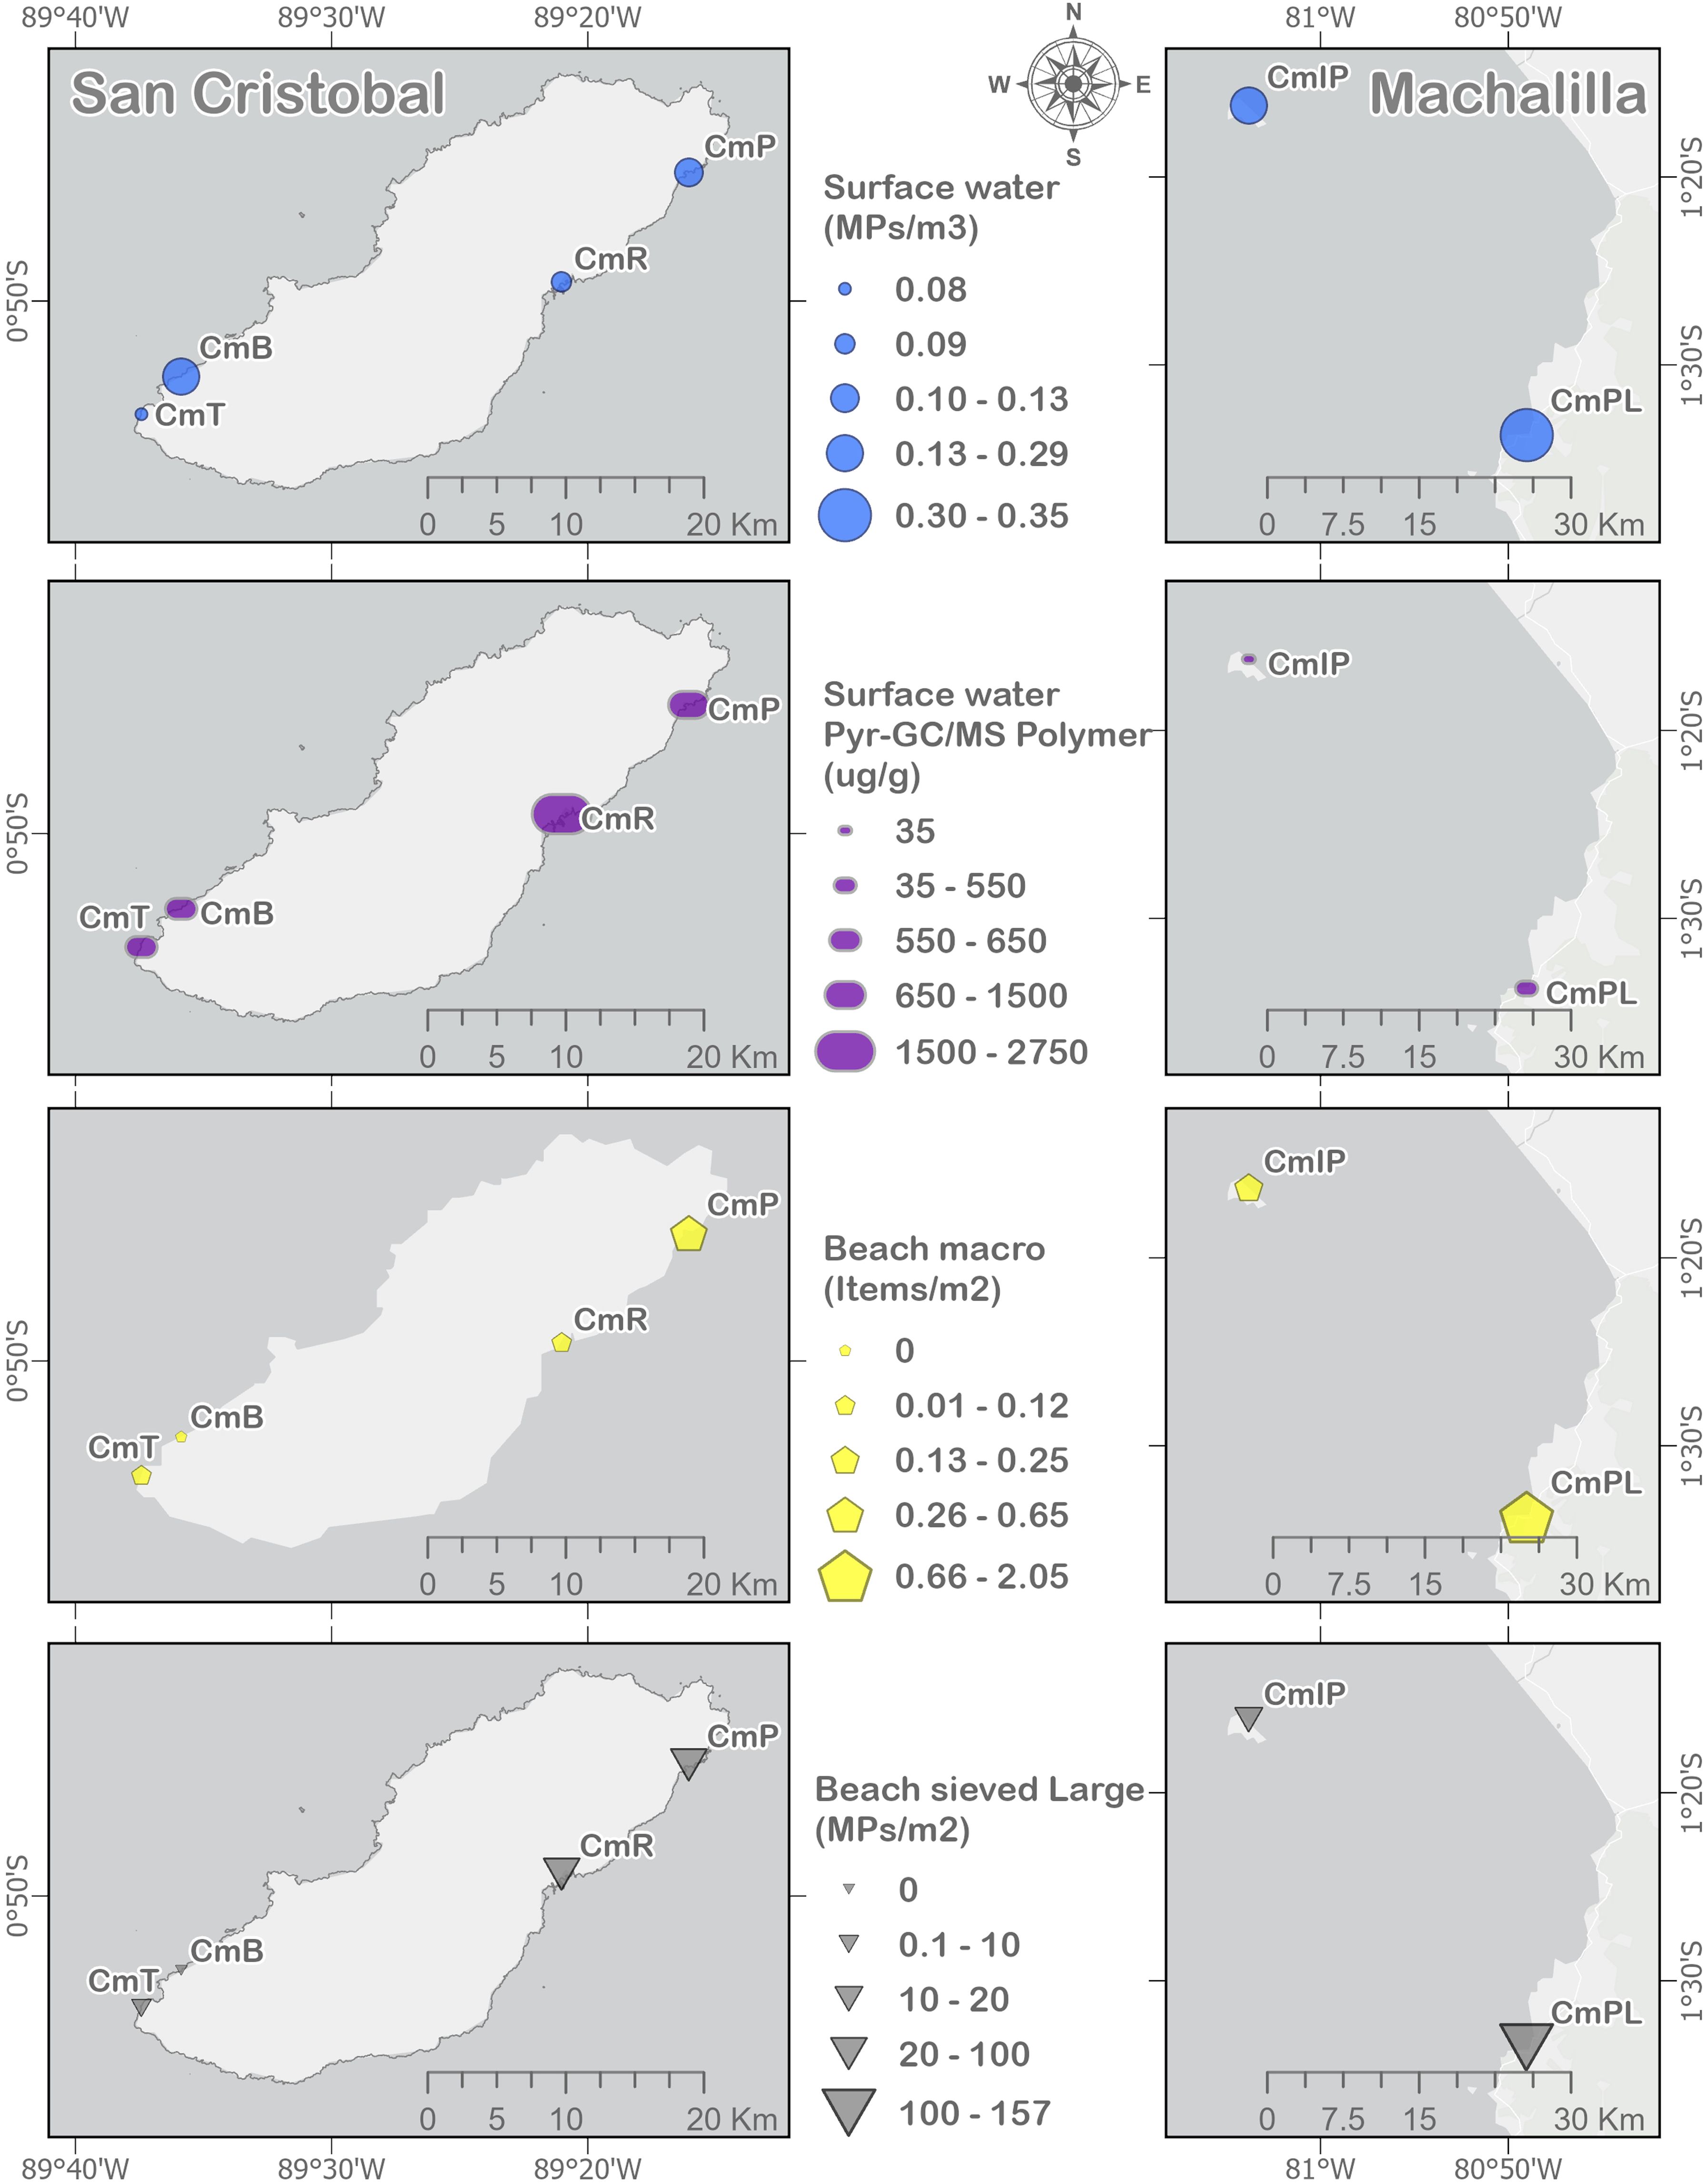
Figure 3. Sampling sites and environmental data on plastic pollution in juvenile green sea turtle (Chelonia mydas) habitats. The data includes measurements of plastic pollution in surface waters, beaches, and sand. Surface water microplastics (MPs) are reported in MPs per cubic meter (m3), surface water polymer concentration in µg/g, beach macroplastic items per square meter (m2), and surface sand samples large MPs (1–5 mm) expressed as MPs per m2. The sampling sites are: Baquerizo Bay, San Cristóbal Island (CmB); Tongo Bay, San Cristóbal Island (CmT); Rosa Blanca Bay, San Cristóbal Island (CmR); Puerto Tablas Bay, San Cristóbal Island (CmP); Puerto López Bay (CmPL); and Drake Bay, La Plata Island (CmIP).
3.2 Juvenile green sea turtle (Chelonia mydas): sampling methodologies and health assessment metrics
Table 3 presents a comparison of the health metrics (blood analytes) of the sampled juvenile green sea turtles with the health metrics presented in Aguirre and Balazs (2000), Lewbart et al. (2014), Reséndiz and Lara-Uc (2018), De Mello and Alvarez (2020), and Joseph et al. (2023). Significant differences (P < 0.05) were found in potassium (K) mmol/L, calcium ionized (iCa) mmol/L, lactate mg/dL, total protein (TP) g/dL, hematocrit (Hct) % PCV, heterophils %, and eosinophils % when these values were compared with previously established health metric baselines for wild juvenile green sea turtles. Nevertheless, these health metrics were within the clinically normal range for wild juvenile green sea turtles according to (EclinPath Cornell, 2013; Abbott Point of Care Inc., 2020; Carpenter and Harms, 2023). Additionally, the following health metrics, TCO2 mmol/L and anion gap mmol/L, were first reported in the current research on wild juvenile green sea turtles.
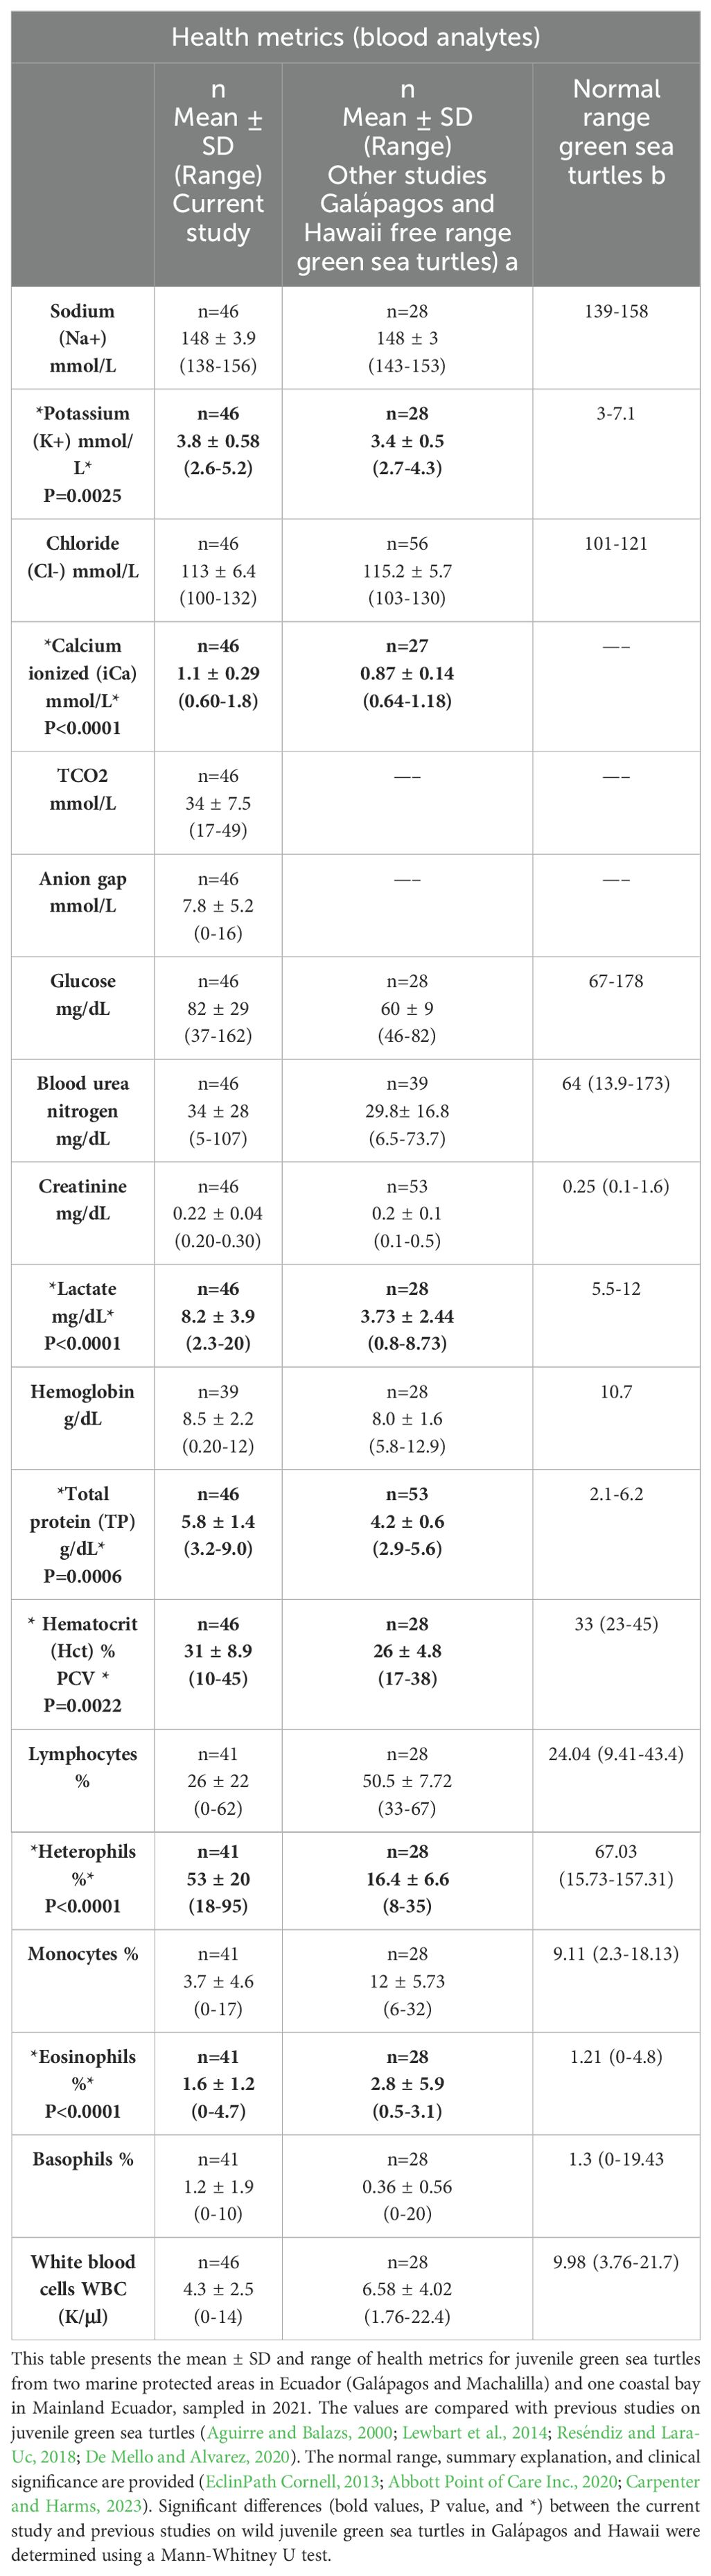
Table 3. Comparison of health metrics (blood analytes) for sampled juvenile green sea turtles (Chelonia mydas).
Table 4 displays the morphometric measurements, vital signs, and blood analytes of the sampled juvenile green sea turtles. Significant differences (P < 0.05) were found in the following blood analytes between some study locations (please refer to Figure 4): chloride (Cl) mmol/L, ionized calcium (iCa) mmol/L, TCO2 mmol/L, anion gap mmol/L, glucose mg/dL, blood urea nitrogen (BUN) mg/dL, total protein g/dL, hematocrit (Hct) % PCV, lymphocyte %, heterophil %, and eosinophil %. However, all health metrics were within the clinically normal range for juvenile green sea turtles according to (EclinPath Cornell, 2013; Abbott Point of Care Inc., 2020; Carpenter and Harms, 2023).
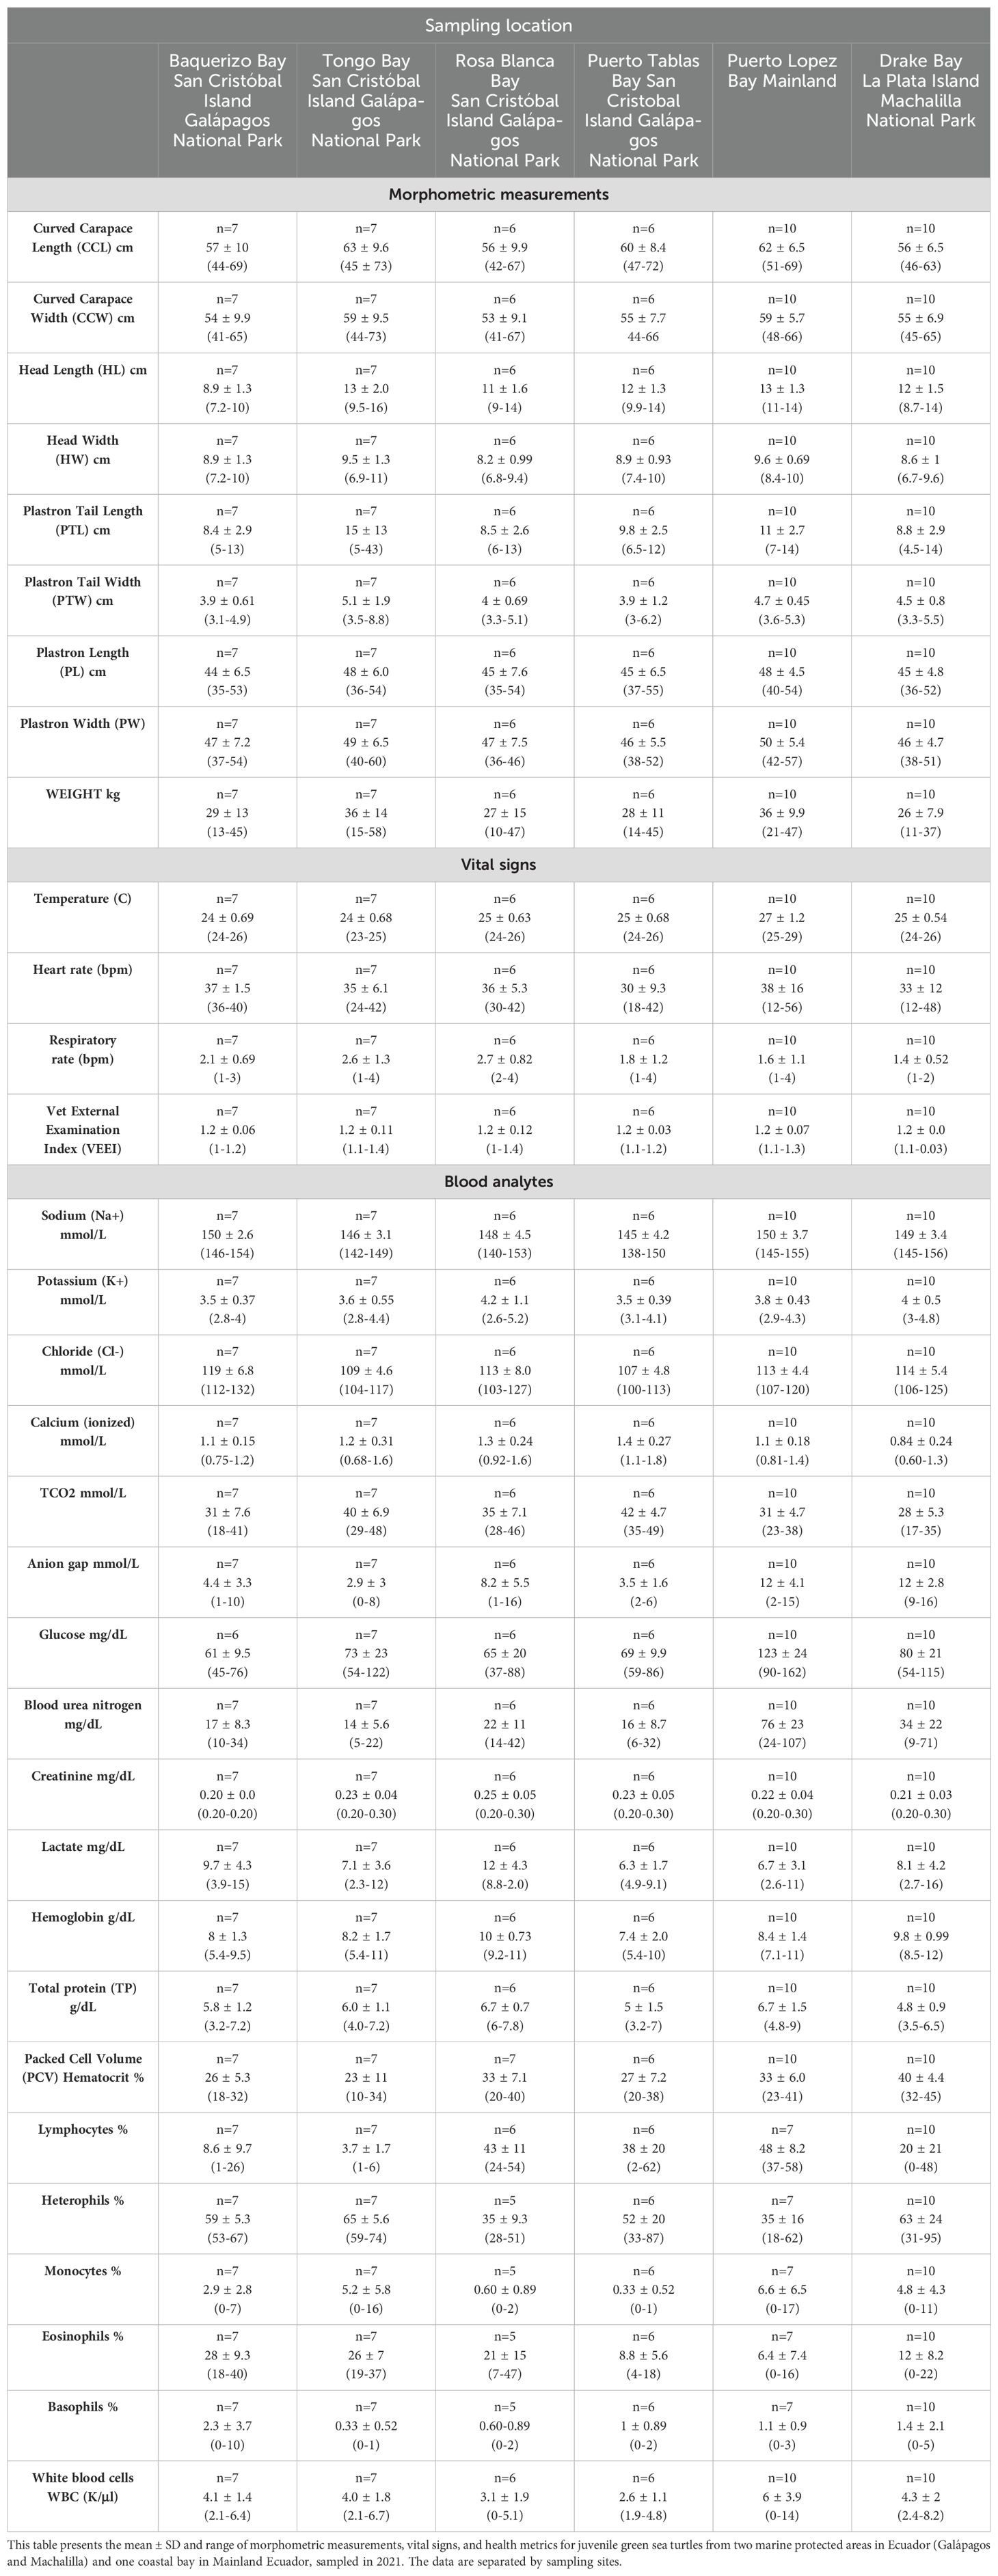
Table 4. Morphometric measurements, vital signs, and health metrics (blood analytes) for sampled juvenile green sea turtles (Chelonia mydas).
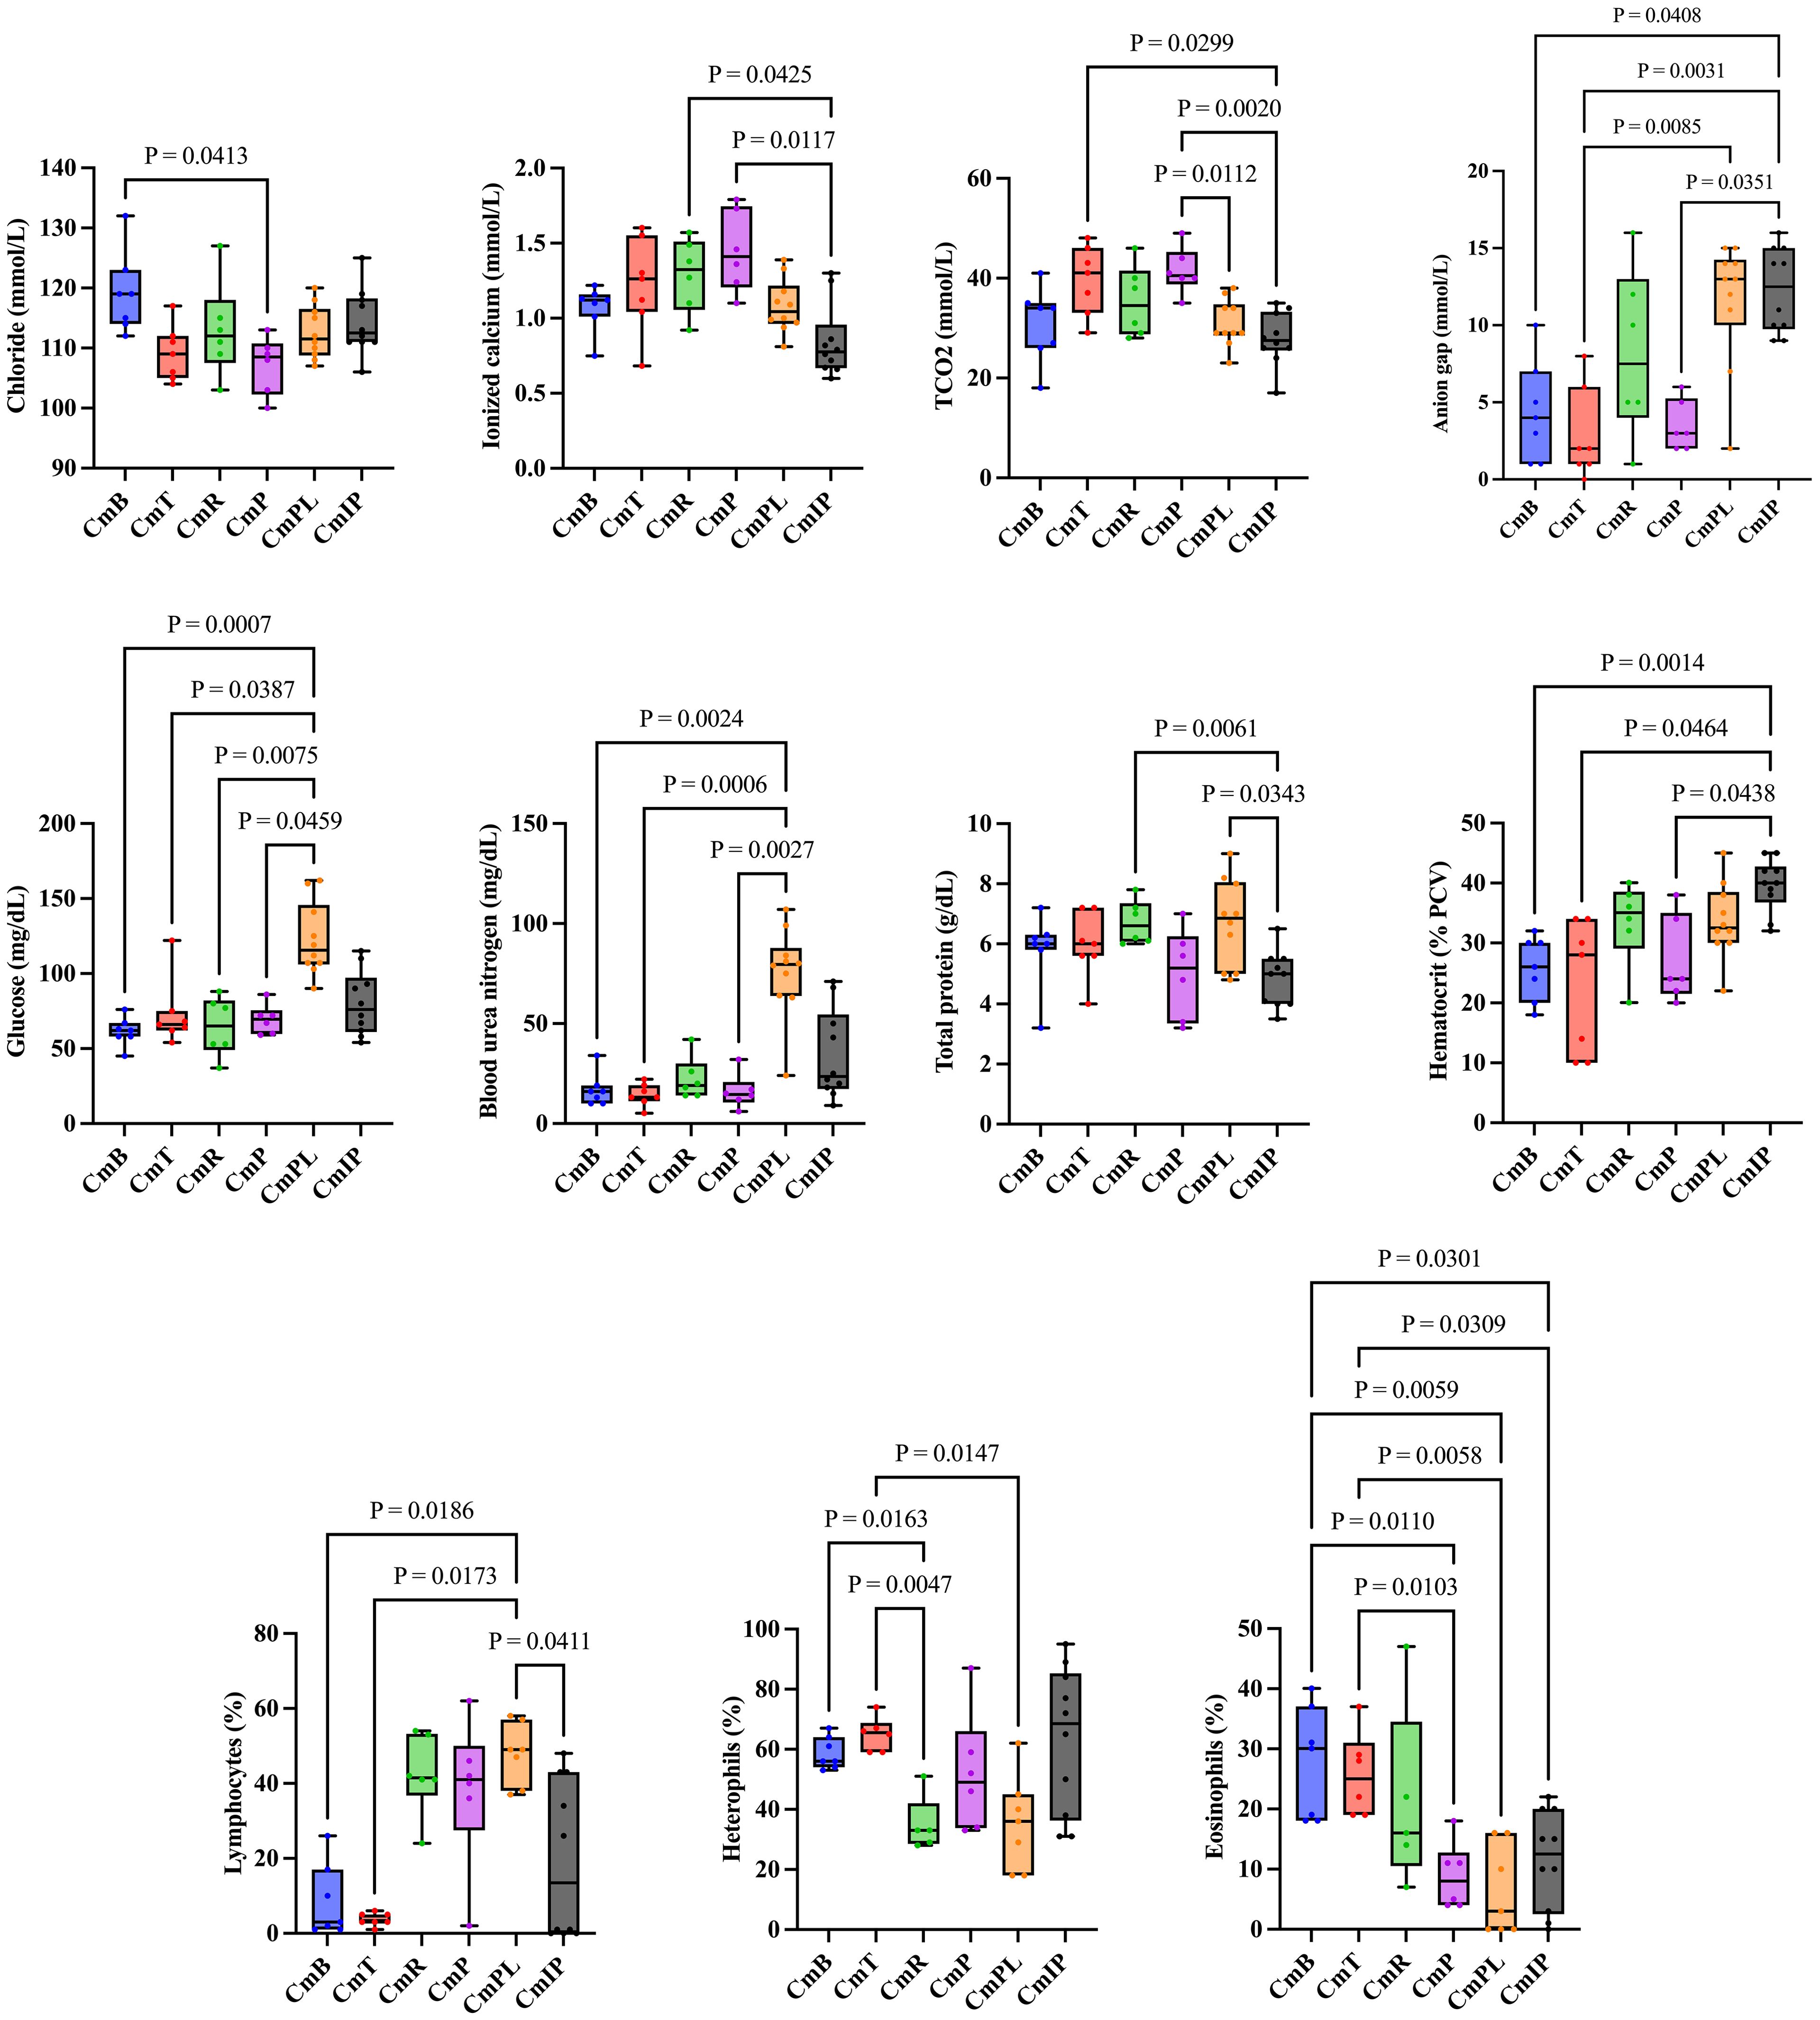
Figure 4. Comparisons of health metrics (blood analytes) between the sampled juvenile green sea turtle (Chelonia mydas) populations. Only the blood analytes that exhibited significant differences between sub-populations (P<0.05) are included. The mean and range for each blood analyte are plotted for each population. Each chart specifies the units of measurement, and the types of metrics analyzed. The sampling sites are: Baquerizo Bay, San Cristóbal Island (CmB); Tongo Bay, San Cristóbal Island (CmT); Rosa Blanca Bay, San Cristóbal Island (CmR); Puerto Tablas Bay, San Cristóbal Island (CmP); Puerto López Bay (CmPL); and Drake Bay, La Plata Island (CmIP).
3.3 Digestion, identification, and quantification of microplastics in sea turtle fecal samples using Fourier-transform infrared spectroscopy
As previously stated, due to the utilization of 8 µm filters, MPs greater than 8 µm in size were identified and measured using FT-IR. The mean (x̄) MPs/g dry weight (dw) in sea turtle feces (STF) samples was x̄=4.4 ± 5.2 (range: 0-19) MPs/g. A Kruskal-Wallis test revealed statistically significant differences (P=0.0092) in x̄ (MPs)/g among the sampled sea turtle populations. STF samples from Rosa Blanca Bay, San Cristóbal Island (CmR) had the highest number, with x̄=12 ± 7.1(range: 0-19) MPs/g.
Fibers were the most prevalent form of MPs identified in STF samples x̄=3.8 ± 4.5 (range: 0-16) MPs/g, followed by fragments x̄=0.38 ± 0.9 (range: 0-5) MPs/g, and then films x̄=0.23 ± 0.93 (range: 0-5.7) MPs/g. Table 5 and Figures 5A, B provide additional statistics regarding the shapes of the MPs found among the STF samples in the examined sea turtle populations.
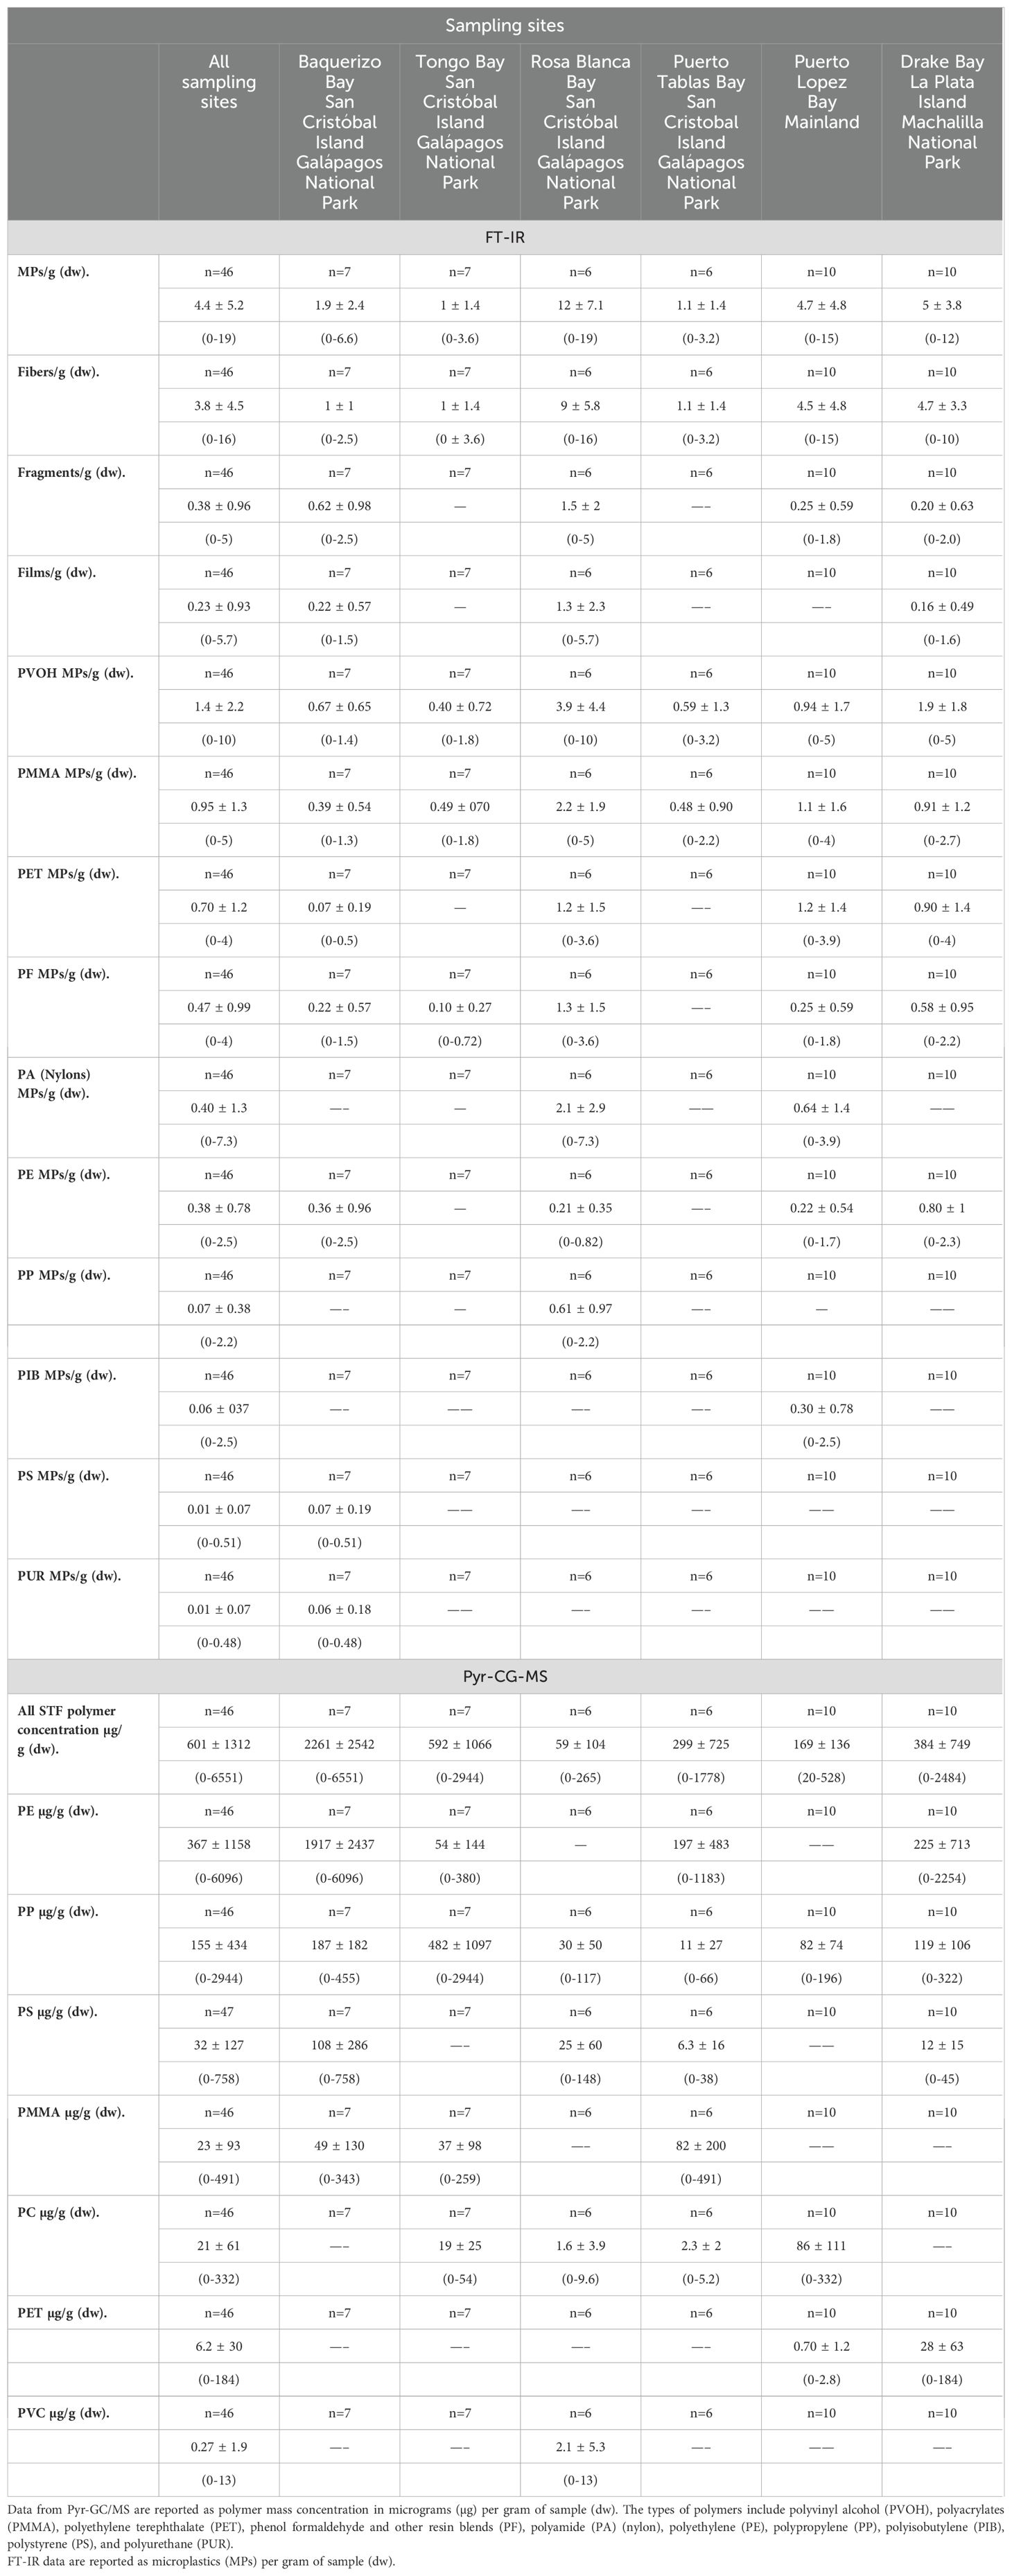
Table 5. Plastic pollution in sea turtle feces (STF) samples analyzed using Fourier transform infrared spectroscopy (FT-IR) imaging system and pressurized liquid extraction (PLE) combined with double-shot pyrolysis-mass spectrometry gas chromatography (Pyr-GC/MS).
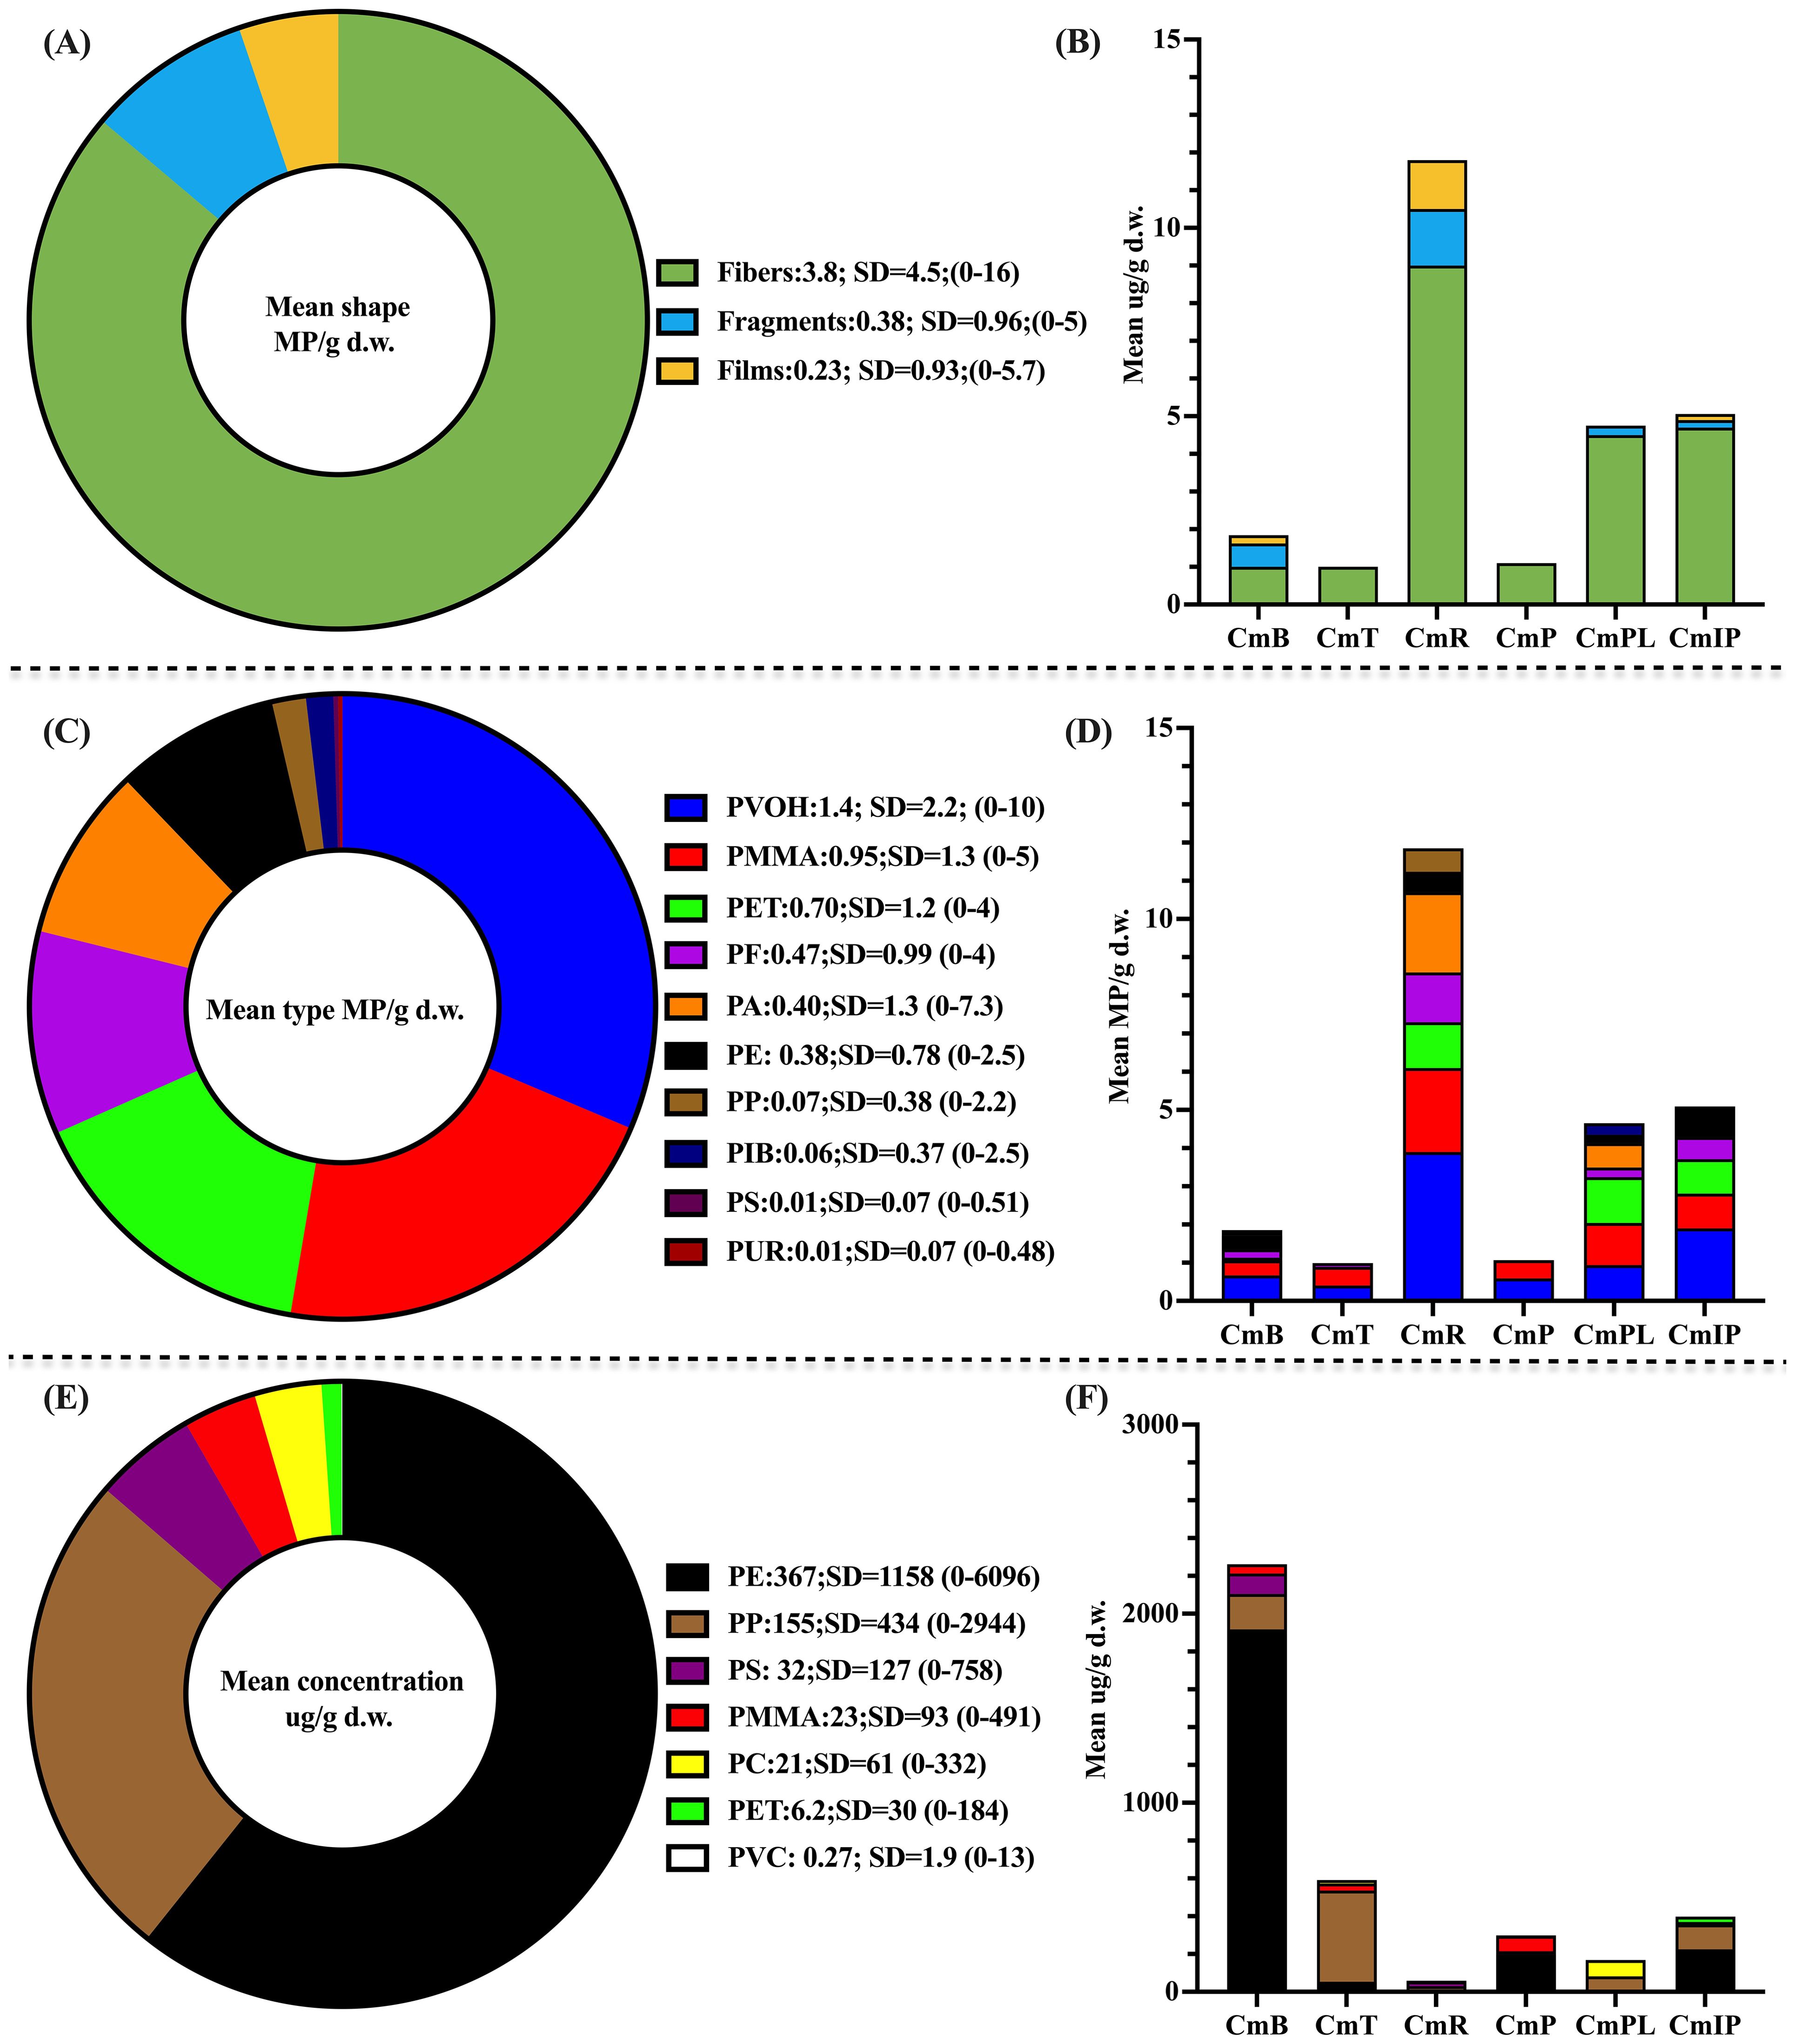
Figure 5. Shape, type, and concentration of plastic pollution in juvenile green sea turtle (Chelonia mydas) fecal samples (STF). (A) Mean and standard deviation (SD) of shapes of microplastics (MPs) per gram (fibers, films, and fragments) dry weight (dw) for all study sites/populations. (B) Mean shape of MPs per gram (dw) for each study site/population. (C) Mean and SD of chemical characterization by Fourier-transform infrared spectroscopy (FT-IR) of MPs found in STF at all study sites/populations. (D) Mean chemical characterization by FT-IR of MPs encountered in STF for each study site/population. (E) Mean and SD of mass concentrations of plastics in STF determined using pyrolysis gas chromatography/mass spectrometry (Pyr-GC/MS) for all study sites/populations. (F) Mean mass concentrations of plastics in STF determined using Pyr-GC/MS for each study site/population. The sampling sites were Baquerizo Bay, San Cristóbal Island (CmB); Tongo Bay, San Cristóbal Island (CmT); Rosa Blanca Bay, San Cristóbal Island (CmR); Puerto Tablas Bay, San Cristóbal Island (CmP); Puerto López Bay (CmPL); and Drake Bay, La Plata Island (CmIP). Types of polymers identified and measured: polyvinyl alcohol (PVOH), polyacrylates (PMMA), polyethylene terephthalate (PET), phenol formaldehyde and other resin blends (PF), polyamide (nylon) (PA), polyethylene (PE), polypropylene (PP), polyisobutylene (PIB), polystyrene (PS), and polyurethane (PUR).
The MPs polymers detected by FT-IR were as follows: polyvinyl alcohol (PVOH), polyacrylates (PMMA), polyethylene terephthalate (PET), phenol formaldehyde and other resin blends (PF), polyamide or nylon (PA), polyethylene (PE), polypropylene (PP), polyisobutylene (PIB), polystyrene (PS), and polyurethane (PUR). A Kruskal-Wallis test revealed a statistically significant variation in the mean (MPs)/g (dw) chemical composition among the study sites (P=0.0005). Among the aforementioned study sites, polyvinyl alcohol (PVOH) exhibited the highest quantity of MPs/g, with a x̄=1.4 ± 2.2 (range: 0-10) MPs/g, followed closely by polyacrylates (PMMA), x̄=0.95 ± 1.3(range: 0-5) MPs/g.
Table 5 and Figures 5C, D offer further information into the quantification and chemical characterization of MPs found in the studied sea turtle populations using FT-IR. The quantity of PVOH MPs/g were higher in Rosa Blanca Bay, San Cristóbal Island (CmR), with a x̄=3.9 ± 4.4 (range: 0-10) MPs/g, and at Drake Bay, La Plata Island (CmIP), which had a x̄=1.9 ± 1.8 (range: 0-5) MPs/g. Additionally, the quantity of PMMA MPs/g were higher in Rosa Blanca Bay, San Cristóbal Island (CmR), with a x̄=2.2 ± 1.9 (range: 0-5) MPs/g, followed by Puerto Lopez Bay (CmPL), which had a x̄=1.1 ± 1.6 (range: 0-4) MPs/g.
3.4 Mass concentration of plastic polymers in sea turtle fecal samples: analysis via pressurized liquid extraction combined with double-shot pyrolysis-gas chromatography/mass spectrometry
The mass concentrations of seven polymers were quantified in the STF samples: polyethylene (PE), polypropylene (PP), polystyrene (PS), polyacrylates (PMMA), polycarbonate (PC), polyethylene terephthalate (PET), and polyvinyl chloride (PVC). The mean (x̄) mass concentrations within the sea turtle feces (STF) samples exhibited statistically significant differences across the study sites, as determined by the Kruskal-Wallis test (P=0.0164). The highest mean polymer mass concentration (dw) was observed for polyethylene (PE), with a x̄= 367 ± 1158 (range: 0-6096) µg/g. This was followed by polypropylene (PP) with a x̄= 155 ± 434 (range: 0-2944) µg/g. Please refer to Table 5 and Figures 5E, F for additional information. Polyethylene (PE) was highest in Baquerizo Bay, San Cristóbal Island (CmB), with a x̄=1917(range: 0-6096) µg/g. Polypropylene (PP) was highest in the STF of Tongo Bay, San Cristóbal Island (CmT), with a x̄=482 ± 1097(range: 0-2944) µg/g, and Baquerizo Bay, San Cristóbal Island (CmB), with a x̄=187 ± 182 (range: 0-455) µg/g.
3.5 Quantifying daily ingestion and excretion rates of microplastics in sampled green sea turtle populations
Table 6 presents the estimated daily intake and excretion rates of MPs for the sampled green sea turtles, using the calculated ingestion and excretion rates per day for the sampled turtles. The daily intake of MPs by the sampled green sea turtle populations varied, with a minimum x̄=312 ± 409(range: 0-1898) MPs/day and a maximum x̄=430 ± 563(range: 0-2610) MPs/day. Based on our calculations, animals from Rosa Blanca Bay, San Cristóbal Island (CmR), had the highest MPs/day consumption rates.
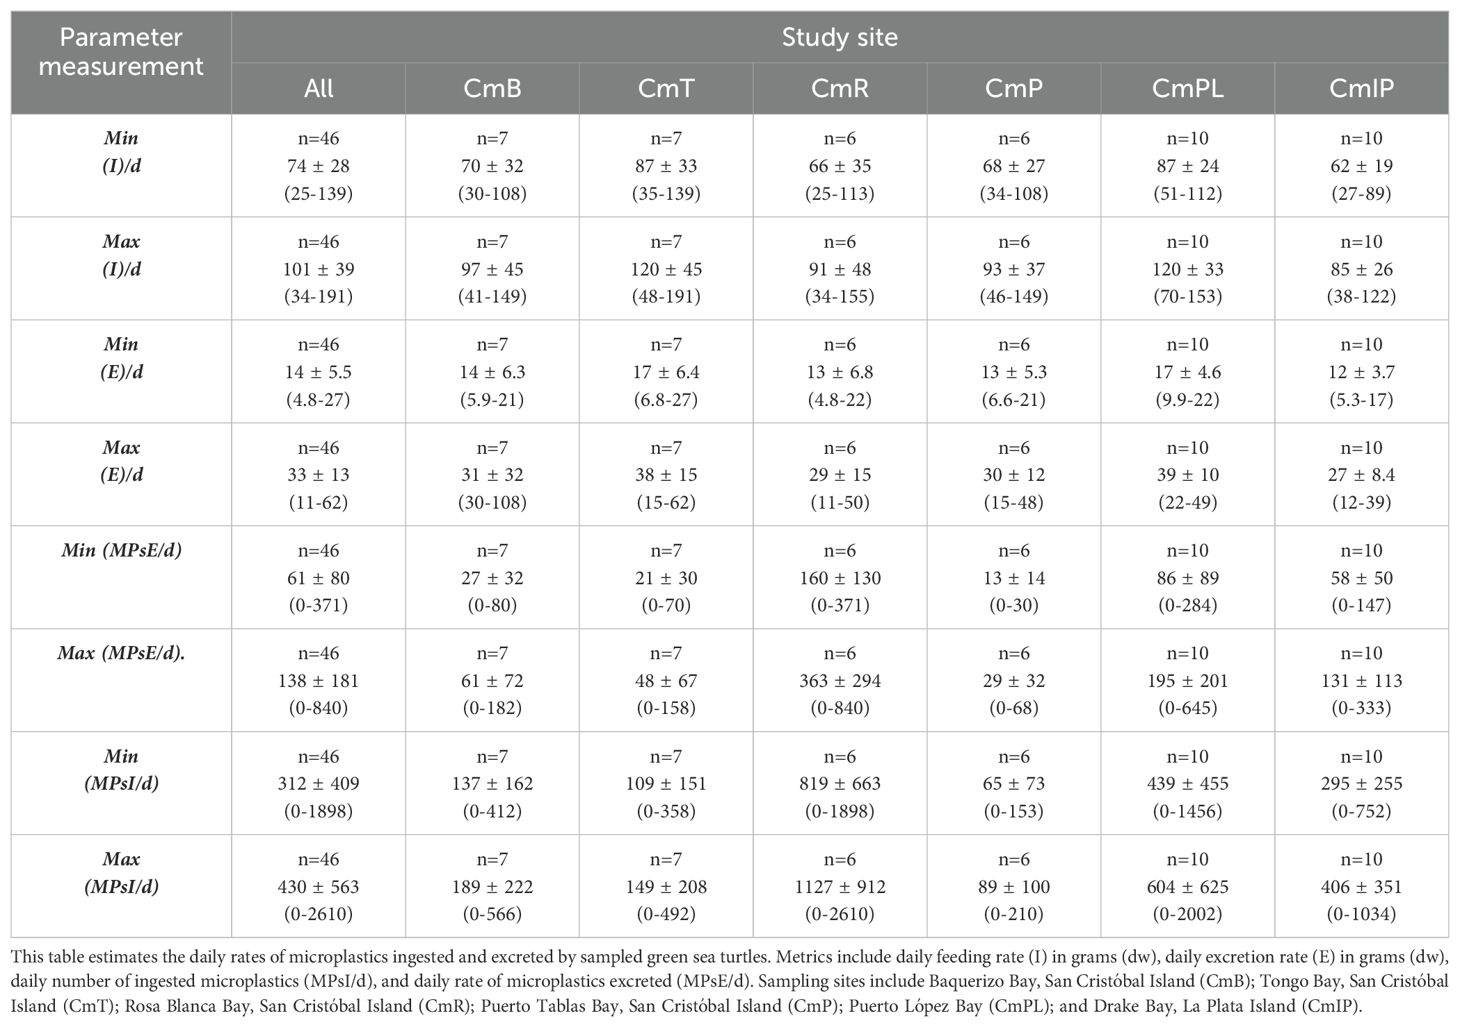
Table 6. Daily ingestion and excretion rates of microplastics in sampled green sea turtle populations.
3.6 Identification of high-risk locations for plastic pollution in sea turtles based on environmental and fecal analysis
Table 7 presents the scoring matrix results used to evaluate the extent and risk of plastic pollution in sampled juvenile green sea turtles. The x̄= total score (TS) for all sampled juvenile green sea turtles was x̄=1056.67 ± 918.57. Based on this mean, the locations at the lowest risk were Baquerizo Bay, San Cristóbal Island (CmB) with a TS of 144, and Tongo Bay, San Cristóbal Island (CmT) with a TS of 256. Moderate risk was observed for Puerto Tablas, San Cristóbal Island (CmP) and Drake Bay, La Plata Island (CmIP), both with a TS of 864. High-risk locations included Rosa Blanca Bay, San Cristóbal Island (CmR) with a TS of 1296, and Puerto López Bay with a TS of 2916.
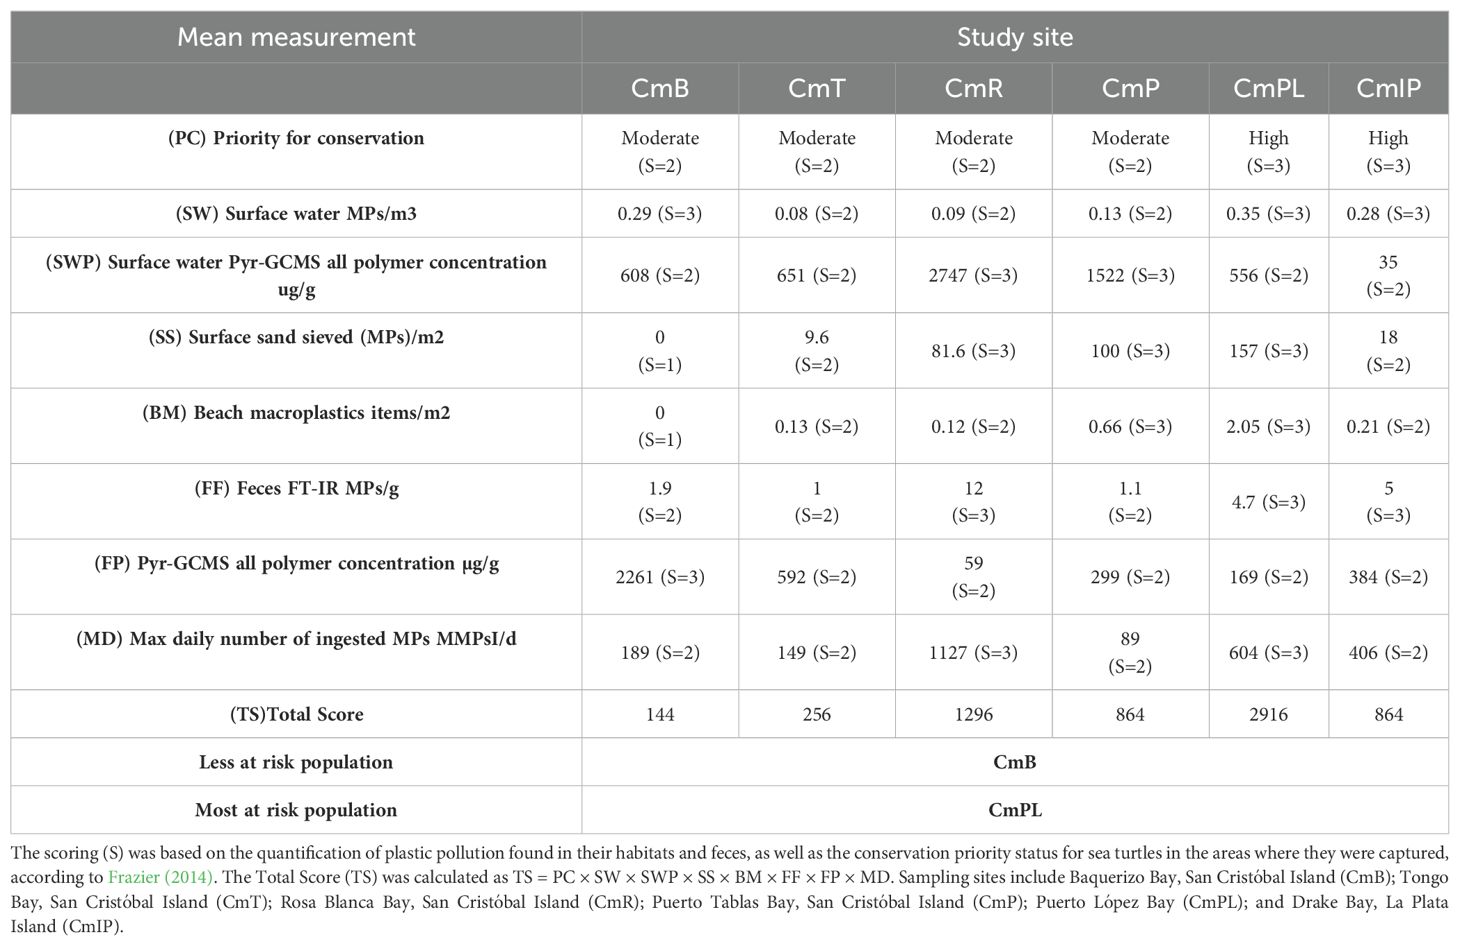
Table 7. Results from the scoring criteria matrix used to evaluate the extent and risk of plastic pollution in sampled sea turtles.
3.7 Investigating the relationship between plastic pollution and health metrics in sampled juvenile green sea turtles
Based on the results of the risk evaluation outlined in Section 3.6, which identified the green sea turtle populations most at risk for plastic pollution based on the presence and absence of plastic pollution in feces samples and the environment, juvenile green sea turtles from Puerto López Bay (CmPL) (n=10) on mainland Ecuador were identified as the most at-risk population for plastic pollution. Conversely, juvenile green sea turtles from Baquerizo Bay, San Cristóbal Island (CmB) (n=7) were identified as the least at-risk population for plastic pollution.
Following this finding, 19 distinct health metrics from these independent juvenile green sea turtle populations were statistically compared. Eleven health metrics showed statistically significant differences (Mann-Whitney U test, P<0.05) between the two groups, as indicated in Figure 6. Lymphocyte %, monocyte %, hematocrit (Hct) % PCV, total protein (g/dL), blood urea nitrogen (BUN) mg/dL, glucose (mg/dL), and anion gap (mmol/L) were significantly higher in green sea turtles categorized as being more at risk of plastic pollution. Conversely, ionized calcium (iCa) mmol/L, heterophil %, and eosinophil % were significantly lower in green sea turtles that were more at risk of being affected by plastic pollution (Figure 6).
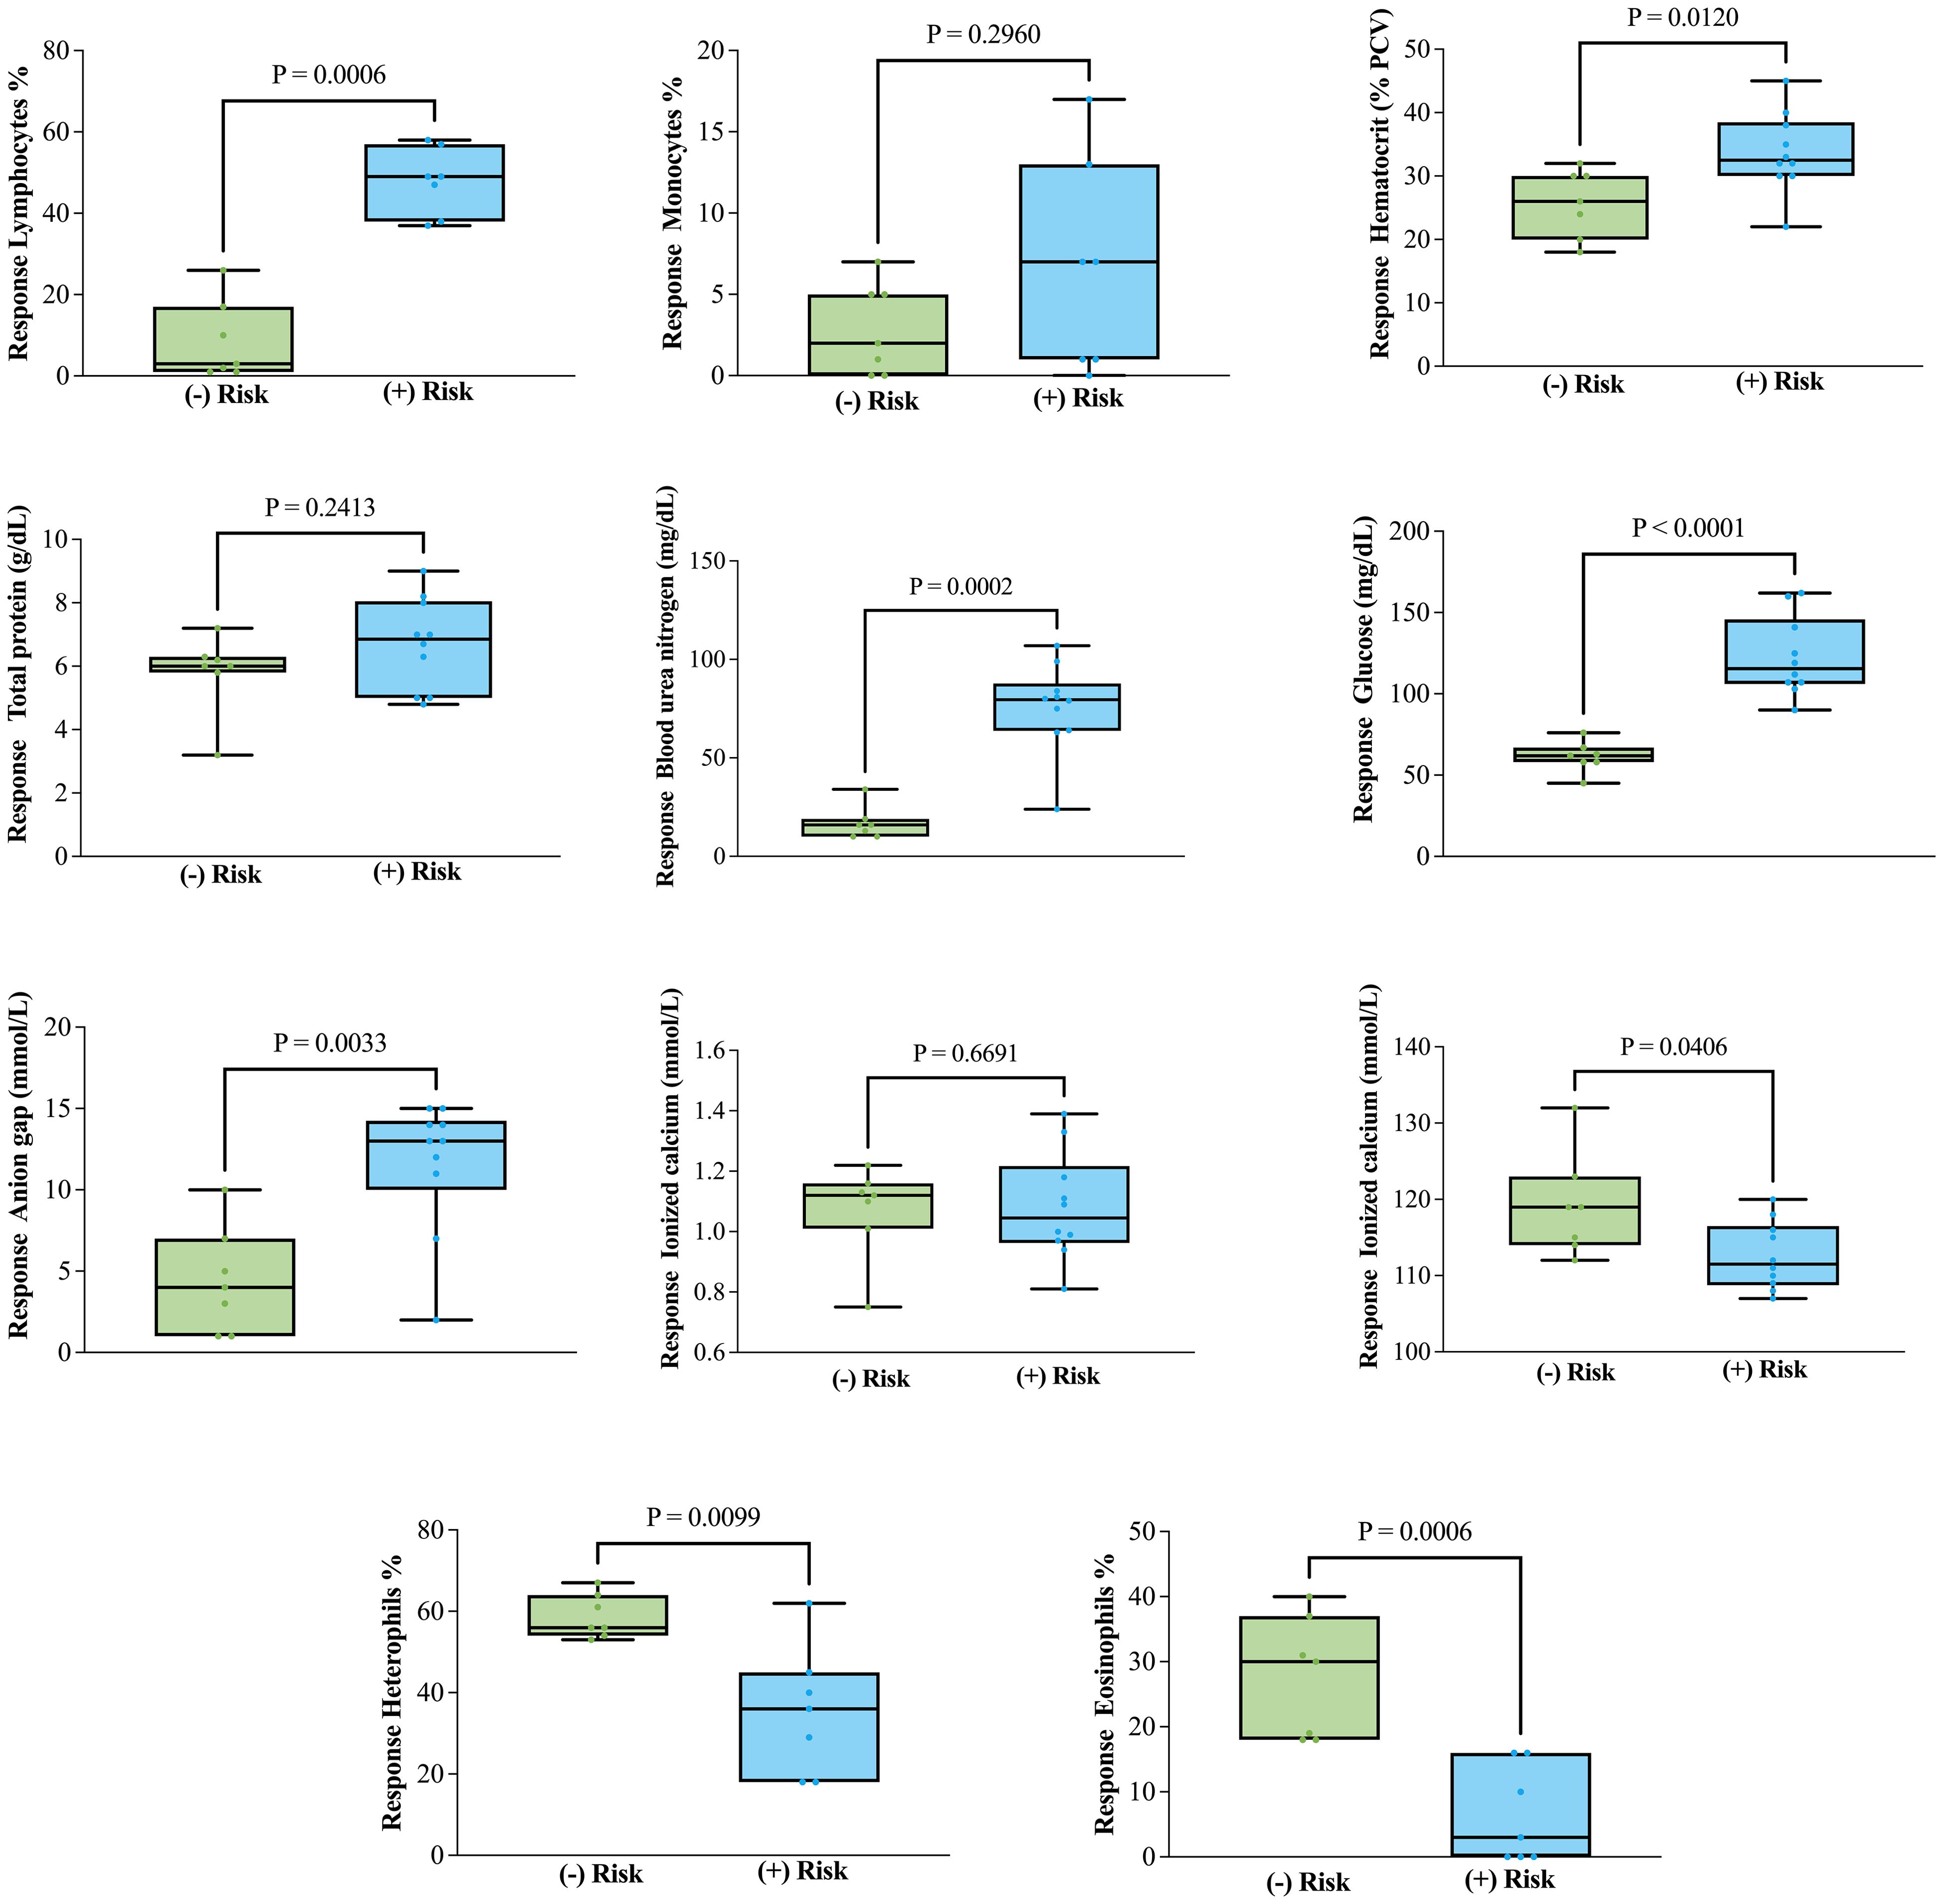
Figure 6. Comparison of health metrics between juvenile green sea turtles (Chelonia mydas) ranked less at risk and more at risk of being affected by plastic pollution. The less at risk population was from Baquerizo Bay, San Cristóbal Island (CmB), and the more at risk population was from Puerto López Bay, Mainland (CmPL). Eleven health metrics showed statistically significant differences (P<0.05) between the two groups. Health metrics that were significantly higher in green sea turtles categorized as more at risk include: Lymphocyte %, Monocyte %, Hematocrit (Hct) % PCV, Total protein (g/dL), Blood urea nitrogen (BUN) (mg/dL), Glucose (mg/dL), and Anion gap (mmol/L). Health metrics that were significantly lower in green sea turtles categorized as more at risk include: Ionized calcium (iCa) (mmol/L), Heterophil %, and Eosinophil %.
3.8 Mitigating external plastic pollution in field and laboratory detection of plastic pollution in sea turtle fecal samples
The mean (x̄) number of microplastics (MPs) per filter in all the field and laboratory inspected blank filters by FT-IR was x̄ = 0.55 ± 1.1 (range: 0-2.7) MPs/filter. Fibers were the most prevalent shape of MPs in blanks, with a mean of x̄ = 0.31 ± 0.75 (range: 0-2.7) MPs/filter, followed by films (x̄ = 0.21 ± 0.26, range: 0-0.8 MPs/filter) and fragments (x̄ = 0.031 ± 0.072, range: 0-0.20 MPs/g). The polymers detected in the procedural and blank MPs/filters by FT-IR included cellulose anthropogenic (CEL), polyvinyl alcohol (PVOH), polyethylene terephthalate (PET), phenol formaldehyde, and other resin blends (PF). CEL exhibited the highest MPs/filter, with a mean of x̄ = 0.31 ± 0.56 (range: 0-2) MPs/filter, followed by PVOH with a mean of x̄ = 0.03 ± 0.08 (range: 0-0.25) MPs/g. Supplementary Table 1 provides additional data regarding the shapes and types of MPs polymers found in field and laboratory filter blanks among the sea turtle sampled locations. All procedural and blank MPs/filters identified were excluded from the final results in sea turtle fecal samples.
The mass concentrations of polymers were examined in all the field and laboratory blank filters deployed in the STF and water collection and analysis process. The highest mean polymer mass concentration per filter was observed for polypropylene (PP), with a mean of x̄ = 0.047 ± 0.16 µg/filter (range: 0-0.78 µg/filter), followed by polyethylene (PE), with a mean of x̄ = 0.0038 ± 0.018 µg/filter (range: 0-0.090 µg/filter). Supplementary Table 2 provides additional data regarding the mass concentrations of polymers found in all the field and laboratory blank filters deployed in the STF and water collection and analysis process among the sea turtle sampled locations. All procedural and blank µg/filter results were excluded from the final results in sea turtle fecal and water samples.
4 Discussion
This research represents a pioneering effort to quantify the exposure and ingestion of plastics in wild juvenile green sea turtles (C. mydas) while simultaneously evaluating their health. In this study, Fourier transform infrared spectroscopy (FT-IR) and pressurized liquid extraction with double-shot pyrolysis-mass spectrometry gas chromatography (Pyr-GC/MS) were both employed to quantify plastics in sea turtle feces. Among the 46 fecal samples obtained from the tested sea turtles, 98% had detectable levels of plastic pollution in their feces. Specifically, FT-IR detected plastics in 70% of the samples, while Pyr-GC/MS detected plastics in 83% of the samples.
Using FT-IR spectroscopy, the most common shape of MPs found in turtle feces were fibers made of polyvinyl alcohol (PVOH) and polyacrylates (PMMA). The Pyr-GC/MS method detected polyethylene (PE) and polypropylene (PP) as the most abundant polymer concentration µg/g. The analysis also showed that the levels of plastics detected varied by location, with the most polluted fecal samples located in the Galápagos National Park, though not in the same areas identified by FT-IR. Both methods are reliable, they yielded slightly different results owing to methodological variations. Nonetheless, both techniques indicate that the animals in Galápagos were more polluted.
Health metrics showed that the sampled animals were clinically normal based on the compared blood analytes. However, the animals in the two protected areas were more polluted, raising concerns about their future health. Finally, the correlation among the detection of plastics in fecal samples, environmental abundance, and human population density was not necessarily direct.
4.1 Location and plastic presence in sea turtle fecal samples
The findings of our study, as confirmed through the FT-IR process, indicated that the most prevalent form of MPs present in the STF samples was fibers. This result is consistent with previous research on the detection of plastic pollution in marine wildlife and ecosystems (Dris et al., 2016, 2017; Comnea-Stancu et al., 2017; Salvador Cesa et al., 2017; Susanti et al., 2020; Bajt, 2021). These findings illustrate the pervasive nature of MPs fiber contamination across all marine ecosystems and the diverse range of marine species and environments that interact with plastic debris (Gall and Thompson, 2015; Claro et al., 2019; Fagiano et al., 2023), including juvenile green sea turtles in Ecuador. Our research found that the samples from Rosa Blanca Bay, San Cristóbal Island (CmR), had the highest concentration of fibers per gram compared to the other locations.
There is a potential relationship between the number of fibers found in green sea turtles within Rosa Blanca Bay and the accumulation of oceanic debris in remote, windward areas with no permanent human inhabitants in the Galápagos, as reported by Muñoz-Pérez et al. (2023) and Deakin et al. (2024). Additionally, the popularity of the bay as a tourist destination may have contributed to this occurrence. Further investigation is required to verify this association. Similarly, in mainland Ecuador, Drake Bay on La Plata Island, a protected national park island with high levels of tourist boat traffic, showed a comparable trend. However, similar quantities were found in the feces of turtles in Puerto Lopez Bay, a coastal town in Ecuador.
Conversely, through Pyr-GC/MS, the STF samples obtained from Baquerizo Bay on San Cristóbal Island (CmB) exhibited the highest concentration of polymer mass (µg/g). According to the research conducted by Jones et al. (2021, 2022), there is a correlation between the proximity of population centers in the Galápagos and MPs abundance. This research revealed a higher concentration of MPs in urban areas than in more isolated sites, even within the national park. Puerto Baquerizo Moreno is the capital city of the Galápagos Islands, located on San Cristóbal Island, and is home to a population of approximately 8,000 residents. In 2022, the province of Galápagos experienced a significant influx of tourists, with 267,686 visitors. Of these visitors, 30% (80,305) arrived at San Cristóbal Island (INEC, 2016; Galápagos Tourism Observatory, 2023).
Despite the apparent contradiction, Schuyler et al. (2016) discovered that there is not always a direct correlation between the proportion of marine debris found in a particular area and the human population density of that region. Oceanographic and weather-based factors can influence the distribution of debris. In our study, the examined animals from Rosa Blanca Bay located on San Cristóbal Island (CmR), a remote tourist destination, were observed to have the highest levels of plastic pollution in their feces and environment. At the same time, the examined animals from Baquerizo Bay, which is located on San Cristóbal Island, a beach that is very close to the urban areas in the Galápagos, were found to be the second most polluted but only in their feces. This could be explained by the observation that the sources of plastic pollution in the Galápagos are related to oceanic floating debris, tourism, and urbanization (Van Sebille et al., 2019; Jones, 2021; Jones et al., 2021, 2022; Muñoz-Pérez et al., 2023; Deakin et al., 2024). Nevertheless, further research and long-term data collection are required to gain a more comprehensive understanding of the issue of plastic pollution in marine protected areas in Ecuador.
4.2 Detection of plastic pollution in sea turtle fecal samples: comparing Fourier-transform infrared spectroscopy and pyrolysis-gas chromatography/mass spectrometry
Although the analysis conducted on subsamples of the same STF revealed discrepancies in the most prevalent types of polymers detected by FT-IR and Pyr-GC/MS, similar differences in polymer compositions have been reported by Primpke et al. (2020) and Ribeiro et al. (2021). In our study, polyvinyl alcohol (PVOH), polyacrylates (PMMA), and polyethylene terephthalate (PET) were the most common MPs, as confirmed by FT-IR spectroscopy. Conversely, polyethylene (PE) and polypropylene (PP) were found to have the highest mass concentrations (µg/g), as detected and quantified by Pyr-GC/MS.
Pyr-GC/MS is a highly sensitive and size-independent analytical technique that can be used in conjunction with spectroscopic methods for the detection and quantification of plastic pollution. Using these two techniques, we were able to detect and quantify plastic pollution in 45 of 46 assessed green sea turtles (98%) within our sample population. Polyvinyl alcohol (PVOH), phenol-formaldehyde (PF), polyamide (nylon) (PA), polyisobutylene (PIB), and polyurethane (PUR) were successfully distinguished using FT-IR spectroscopy. However, Pyr-GC/MS analysis produced no positive results for the aforementioned compounds. These results may be attributed to the inherent subjectivity associated with the FT-IR process.
Fourier transform infrared (FT-IR) spectroscopy is a widely used analytical technique for plastic pollution. However, interpreting the results obtained from FT-IR spectroscopy can be subjective and may lead to variations in the identified MPs. This subjectivity arises because of the complex nature of the FT-IR process and the involvement of various parameters, such as multiple manual cleaning steps, visual identification, instrumental settings, sample preparation, polymer computer libraries, and operator expertise. Additionally, FT-IR is limited by the filter’s retention capabilities, which in our case was an 8 µm pore size. Consequently, smaller MPs may have escaped analysis. Nevertheless, FT-IR spectroscopy is widely utilized as the primary analytical technique for examining MPs (Woodall et al., 2015).
Conversely, the Pyr-GC/MS method enables the detection of plastic pollution in smaller size ranges, as the technique is independent of particle size, color, shape, or particle number, and allows for more accurate reporting of plastic concentrations beyond visual identification techniques (Okoffo et al., 2020, 2022). Pyr-GC/MS is a straightforward method that combines sample extraction and quantitative analysis in one step, giving less room for contamination. This technique is relatively less complicated to implement and removes observer bias during the FT-IR procedures. However, this method is destructive and cannot reveal the color, shape, or size of the MPs. Pyr-GC/MS can be used alongside spectroscopic techniques to increase the sensitivity of plastic pollution detection and quantification (Ribeiro et al., 2020).
Overall, the accuracy of both techniques can be affected by the operator’s expertise, as well as the instrument settings (e.g., loaded polymer library) and procedures used to accurately report plastic polymer concentrations. FT-IR techniques facilitate the identification of the chemical composition of synthetic particles that have been isolated from the analyzed feces samples and quantified, although there may be some bias due to the detection of particles at their lower dimensional limit. Conversely, Pyr-GC/MS techniques enable a qualitative assessment of the presence of polymers without considering the physical properties of plastic particles, which may significantly influence the impacts and effects on turtles upon ingestion. Therefore, we propose both techniques are complementary and should be conducted in conjunction.
4.3 Quantifying daily ingestion and excretion rates of microplastics in sampled green sea turtle populations
Green sea turtles (C. mydas) are known for their specialized diet, primarily consisting of sea grasses and algae, as documented by Bjorndal (1980, 1985), Thayer et al. (1982), and Seminoff et al. (2002). In the Galápagos, their diet mainly includes the algae species Ulva lactuca, along with occasional gelatinous prey (Carrión-Cortez et al., 2010). However, these turtles have been observed to mistake drifting synthetic debris for food (Muñoz-Pérez et al., 2023). The aquatic nature of the life history of this species and the challenges associated with obtaining a significant quantity of fecal samples directly from the animals (Amorocho and Reina, 2008) have hindered previous studies examining synthetic particle ingestion and defecation in green sea turtles.
Nonetheless, Fukuoka et al. (2016) revealed that green turtles have a higher ingestion encounter ratio of artificial debris compared to loggerhead turtles. To feed, juvenile green sea turtles open their mouths and graze on the seafloor or consume drifting algae, consequently, MPs may become attached to their food source or turtles may directly ingest plastic, which they perceive as food (Fukuoka et al., 2016; Duncan et al., 2019b).
Our study is the first to report likely daily rates of MPs ingested and excreted by juvenile wild green sea turtles. These rates varied from a minimum x̄= 312 ± 409 (range: 0-1898) MPs/day) to a maximum x̄ =430 ± 563 (range: 0-2610) MPs/day. Despite the potential for adjustments influenced by the aforementioned variables and calculations, gastrointestinal transit times in juvenile green turtles studied in controlled environments, such as laboratory pools (González-Paredes et al., 2021). Our extrapolation from the number of synthetic particles detected in the fecal samples to the potential particles ingested and defecated daily by the sampled sea turtles provides the first estimate of the quantity of microplastics (MPs) ingested daily by juvenile wild green sea turtles in Ecuador.
4.4 Health metrics (blood analytes) and plastic pollution
Polyvinyl alcohol (PVOH) was identified as the most abundant MPs polymer in STF samples using FT-IR spectroscopy. PVOH it is a synthetic plastic polymer that is soluble in water and is often utilized as a “decomposable plastic.” However, no conclusive evidence supports the claim that PVOH is biodegradable (Rolsky and Kelkar, 2021). PVOH is widely used in various products, including personal care items, household items such as dishwashers and laundry pods, molding compounds, surface coatings, films that resist gasoline, textiles, artificial sponges, fuel hoses, water-soluble films, and sheeting (Rossatto et al., 2023). Sources of MPs and/or routes are likely wastewater (Rossatto et al., 2023).
In previous research, the effects of PVOH on freshwater organisms have been studied, and toxicity has been evaluated using behavioral and neurotoxicity biomarkers. The results indicated that PVOH did not have any significant effects on the exposed organisms (Nigro et al., 2022). Our results indicate that the level of PVOH exposure did not have a direct impact on the health of the sampled juvenile green sea turtles. However, the low biodegradation rates of PVOH polymers in marine environments make them another persistent MPs type with unknown effects on wildlife health (Rolsky and Kelkar, 2021). Despite the lack of significant effects observed in freshwater organisms and green sea turtles, the persistence of PVOH polymers in marine environments raises concerns regarding their potential long-term impact on wildlife health. These findings highlight the importance of additional studies to fully understand their ecological effects.
Polyacrylates, MPs also known as polymethyl methacrylate (PMMA), were found in high quantities in STF through FT-IR spectroscopy. Since their invention in 1950, polyacrylates have played a crucial role in both medicine and dentistry. This material is used in various biomaterial applications including bone cement, lenses, bone substitutes, and drug delivery systems (Manoukian et al., 2019). PMMA, which is transparent and durable, has numerous applications in diverse industries including textiles, fishing gear, and nets (Rossatto et al., 2023). According to Pavičić-Hamer et al. (2022), exposure to polyacrylate MPs causes an immune response in the Mediterranean mussel (Mytilus galloprovincialis). This response includes an increase in the production of pro-inflammatory cytokines and activation of immune cells. This study found that the immune response was dose dependent, indicating that higher concentrations of polyacrylate MPs resulted in a stronger immune response. In our study, all juvenile green sea turtles with PMMA MPs in their feces were clinically normal. However, the scope of clinical health analysis is limited to indicating severe health issues and not minor and specific health implications. Additionally, the effect of PMMA MPs is reportedly dose-dependent, and further research is necessary to thoroughly comprehend the magnitude of these risks and their potential long-term impact on wildlife health.
Pyr/GC-MS analysis revealed that polyethylene (PE) and polypropylene (PP) had the highest concentrations (µg/g) among the polymers detected in sea turtle feces samples. Polyethylene (PE) polymers are commonly used in plastic packaging, plastic bags, and food and beverage containers. PP is used in textiles and fishing nets (Rossatto et al., 2023). Few studies have focused on the isolation and examination of the effects of these polymers on health. G. mellonella caterpillars can ingest and degrade PE and current research has not revealed any adverse effects resulting from this (Cassone et al., 2020). However, exposure of earthworms to PE has led to an elevated accumulation of toxic metals and impaired enzyme function and gene expression (Li et al., 2021). Moreover, it has been demonstrated PE exposure can result in oxidative stress and histopathological damage (Chen et al., 2022). Furthermore, a study conducted by Mazurais et al. (2015) found increased mortality rates in fish that had ingested PE, as well as slight effects on gene expression.
Although our understanding of the hazards and effects of plastic ingestion on wildlife health is limited, plastic consumption can result in the transfer of toxic compounds, leading to hepatic stress, neurological effects, metabolic-nutritional deficiencies, and impaired kidney function in certain species (Stamper et al., 2009; Rochman et al., 2013; Lavers et al., 2019; Cook and Halden, 2020; Roman et al., 2020). Plastic ingestion has also been shown to contribute to a decline in reproductive success (Bucci et al., 2020) and to elevate mortality rates in various species (Senko et al., 2020). In addition, a lack of monocytes and heterophils can be indicative of various conditions, such as infection, inflammation, specific types of cancer, or stress, and research has demonstrated that a decrease in these analytes may result in a weakened immune system, bone marrow suppression, and an increased susceptibility to viral infections (EclinPath Cornell, 2013; Thrall et al., 2022).
While it has been observed that 98% of tested juvenile green sea turtles were exposed to plastic pollution, their vital signs, morphometry, and blood analytes were comparable to those reported in previous studies on green sea turtles, indicating a clinically normal population (Aguirre and Balazs, 2000; Lewbart et al., 2014; Reséndiz and Lara-Uc, 2018; De Mello and Alvarez, 2020; Carpenter and Harms, 2023; Joseph et al., 2023). It is possible that the reported health impacts may not be directly related to the presence of plastics in feces; however, this does not necessarily imply the absence of other contributing factors. Certain thresholds must be considered when analyzing the presence of plastics in feces in relation to the gut tract. Furthermore, it is important to note that our study only included live wild turtles. It is essential to additionally monitor the health metrics of stranded sea turtles affected by plastic pollution at rescue facilities.
The notion of whether marine turtles can function as sentinels remains a subject of considerable debate contingent upon the specific interpretation of the term “sentinel” and the scale at which change is being detected. Given the highly restricted nature of capture and sampling, they are unlikely to serve as pollution indicators. However, sea turtles are often used as sentinel species in biomonitoring the health of the ocean because they are long-lived and share a trophic chain and habitat with humans. Moreover, the finding that the concentrations of MPs in both the gastrointestinal tract and feces of sea turtles and humans are similar regarding their size, color, shape, and polymer type implies that they are subject to similar microplastic profiles (Hazen et al., 2019; Meaza et al., 2021).
Although the sampled sea turtles were assessed as clinically normal, this does not mean that the presence of these polymers had no long-term effects. Our study found that animals identified as being more at risk for plastic pollution had significantly different health metrics compared to those classified as less at risk. This finding opens the door for further investigations into the long-term impacts of plastic pollution on sea turtle health. The significant differences in health metrics among more at-risk animals suggest that chronic exposure to plastic pollution may have subtle but important physiological effects that merit continued research and monitoring.
5 Conclusions
The present study highlights the pervasive nature of plastic pollution in marine environments and its potential implications for both wildlife and human health. While this research has successfully established a baseline for health metrics and plastic pollution levels in wild juvenile green sea turtles across two Ecuadorian national park islands and a coastal bay in mainland Ecuador, it also highlights critical gaps in our understanding, particularly regarding plastic-related mortality rates. The study’s focus on live wild juvenile green sea turtles means that the full extent of plastic-related mortality remains unclear, which is a notable limitation.
Our study has set a foundational baseline for assessing the health of juvenile green sea turtles, examining vital signs, morphometry, and blood values, which were found to be within clinically normal ranges. This baseline can serve as a valuable reference for future research and comparisons. However, the detection of plastic contamination in 98% of the studied green sea turtle populations, including those from protected areas, is alarming. This high prevalence of plastic pollution in such protected pristine environments underscores the urgent need for continued monitoring and research.
The detection of plastic contamination in all sampled environments (water, and beaches) and nearly all sea turtle fecal samples suggests that plastic pollution is a widespread problem, even in remote and protected areas. This finding is concerning, considering the ecological importance of these regions and their role in conserving biodiversity. The presence of plastic pollution in these areas poses a significant threat to the health and long-term survival of marine species, including green sea turtles.
While the general health of the sampled sea turtles appeared normal, the significant differences in health metrics between turtles identified as more at risk for plastic pollution and those less at risk indicate potential long-term effects of chronic plastic exposure. These findings open new paths for investigating the subtle yet potentially critical impacts of plastic pollution on marine wildlife. Understanding these effects is crucial for developing effective conservation strategies and mitigating the broader ecological impacts of plastic pollution.
The study’s findings highlight the need for more comprehensive research to fully understand the impact of plastic pollution on marine ecosystems. Future studies should include larger sample sizes of non-polluted individuals to better investigate the relationships between pollution and health parameters. Additionally, research should focus on understanding the long-term health effects of chronic plastic exposure on marine species, particularly in relation to survival and reproductive success.
The insights gained from this study are vital for informing global and local conservation efforts. The presence of plastic pollution in Ecuador’s marine-protected areas, which are home to a diverse array of species, underscores the global nature of this issue and the interconnection of marine ecosystems. By continuing to monitor plastic pollution and health, we can develop more effective strategies to mitigate its impact, protect vulnerable marine species, and preserve the health of our oceans for future generations. This ongoing research is crucial for addressing one of the most significant environmental challenges of our time and ensuring the resilience and sustainability of marine ecosystems worldwide.
Data availability statement
The original contributions presented in the study are included in the article/Supplementary Material. Further inquiries can be directed to the corresponding author.
Ethics statement
This study was conducted as part of a plastic pollution research program permitted by the Galápagos National Park Service (permits PC-23-19, PC-81-20, and PC-32-21 to JM-P) and approved by Universidad San Francisco de Quito (USFQ), North Carolina State University (NC State), and University of the Sunshine Coast (UniSC) ANS2178 ethics and animal handling protocols. All handling and sampling procedures adhered to standard protocols for vertebrate and veterinary practices. The study was conducted in accordance with the local legislation and institutional requirements.
Author contributions
JM: Conceptualization, Data curation, Formal analysis, Funding acquisition, Investigation, Methodology, Project administration, Resources, Software, Supervision, Validation, Visualization, Writing – original draft, Writing – review & editing. GL: Conceptualization, Formal analysis, Funding acquisition, Investigation, Methodology, Resources, Supervision, Validation, Writing – review & editing. TT: Formal analysis, Investigation, Methodology, Validation, Writing – review & editing. HC: Formal analysis, Investigation, Methodology, Validation, Writing – review & editing. EO: Formal analysis, Investigation, Methodology, Validation, Writing – review & editing. DA: Conceptualization, Formal analysis, Investigation, Methodology, Project administration, Validation, Writing – review & editing. LZ: Formal analysis, Visualization, Writing – review & editing. JJ: Conceptualization, Funding acquisition, Investigation, Writing – review & editing. FC: Investigation, Writing – review & editing. AM: Investigation, Writing – review & editing. CV: Investigation, Writing – review & editing. CM: Investigation, Writing – review & editing. FV: Investigation, Writing – review & editing. EH: Investigation, Writing – review & editing. RA: Investigation, Writing – review & editing. KE: Investigation, Writing – review & editing. AS: Investigation, Writing – review & editing. JC: Investigation, Writing – review & editing. PS: Investigation, Methodology, Writing – review & editing. SV: Investigation, Methodology, Writing – review & editing. CL: Funding acquisition, Investigation, Methodology, Resources, Writing – review & editing. TG: Funding acquisition, Investigation, Methodology, Resources, Writing – review & editing. BW: Conceptualization, Investigation, Methodology, Validation, Writing – review & editing. BG: Investigation, Methodology, Validation, Writing – review & editing, Conceptualization, Resources. MC: Investigation, Resources, Writing – review & editing. PL: Investigation, Resources, Writing – review & editing. KT: Investigation, Methodology, Resources, Writing – review & editing. DP: Investigation, Methodology, Supervision, Writing – review & editing. CV: Conceptualization, Investigation, Methodology, Resources, Supervision, Validation, Writing – review & editing. KT: Conceptualization, Funding acquisition, Investigation, Methodology, Resources, Supervision, Validation, Writing – review & editing.
Funding
The author(s) declare financial support was received for the research, authorship, and/or publication of this article. This research was principally supported by the Australian Government Research Training Program (RTP) International Stipend Scholarship. We also extend our gratitude to the following institutions for their invaluable assistance and funding contributions: The UK Global Challenges Research Fund (GCRF) (Ref. NE/V005448/1), which facilitated international collaboration as part of the Pacific Plastics: Science to Solutions (PPSS) project. The Plastic Science to Solutions (PPSS) program, led by the University of Exeter and funded by the UK Natural Environment Research Council Grant NE/5003975/1. Galapagos Conservation Trust (GCT), WILDAID, Colegio de Ciencias Biológicas y Ambientales (COCIBA), Universidad San Francisco de Quito (USFQ), and the Galápagos Science Center (GSC).
Acknowledgments
We would like to extend my sincere gratitude to the following individuals and organizations for their invaluable support and cooperation: GSC staff, especially Carlos Mena, Stephen Walsh, Philip Page, Sofia Tacle, Sylvia Sotamba, Ana Carrión, Jessenia Sotamba, Diego Páez-Rosas. The Commonwealth Scientific and Industrial Research Organization (CSIRO) staff, Britta Denise Hardesty. Andy Donelly from Galapagos Conservation Trust (GCT). Roddy Macias from WILDAID. Galápagos National Park Directorate (DPNG) staff: Harry Reyes, Eduardo Espinoza, Jenifer Suárez-Moncada, Andrea Loyola, Jimmy Bolańos, and Maryuri Yépez. In addition, we thank DPNG for the request and trust granted for sampling, and for providing research permits for conducting this study. GSC for logistic support during the study. Special gratitude to the technical support staff at the University of the Sunshine Coast in Australia, especially Professor Ross Young Deputy Vice-Chancellor (Research and Innovation) and the Australian Government Research Training Program Scholarship. Special thanks to the USFQ-Galápagos students: Esteban Cobos, Jonathan Guillen, Kevin Cabrera and Henry Vivanco. Special thanks to the NCState-GSC IslaVet 2021 program and all the students who helped with the project. Special thanks to Captain Yuri Revelo, Manuel Yépez, and the research vessel Yualka II crew.
Conflict of interest
Author BW was employed by the company Ecolibrium, Inc.
The remaining authors declare that the research was conducted in the absence of any commercial or financial relationships that could be construed as a potential conflict of interest.
Publisher’s note
All claims expressed in this article are solely those of the authors and do not necessarily represent those of their affiliated organizations, or those of the publisher, the editors and the reviewers. Any product that may be evaluated in this article, or claim that may be made by its manufacturer, is not guaranteed or endorsed by the publisher.
Supplementary material
The Supplementary Material for this article can be found online at: https://www.frontiersin.org/articles/10.3389/famrs.2024.1439512/full#supplementary-material
Supplementary Material 1 | All morphometric measurements, vital signs, and health metrics in a clearly labeled spreadsheet including all blank data (CSV Format).
Abbreviations
GNP, Galápagos National Park; MNP, Machalilla National Park; MPs, Microplastics/MP, microplastic; STF, Sea turtle feces; USFQ, Universidad San Francisco de Quito; NC State, North Carolina State University; UniSC, University of the Sunshine Coast; CmB, Baquerizo Bay San Cristóbal Island; CmT, Tongo Bay San Cristóbal Island; CmR, Rosa Blanca Bay San Cristóbal Island; CmP, Puerto Tablas Bay San Cristóbal Island; CmPL, Puerto Lopez Bay; CmIP, Drake Bay in La Plata Island; MPs/kg, Microplastics per kilogram; WBC, White blood cell; rpm, Respirations per minute; bpm, Beats per minute; PVC, Polyvinyl chloride; TP, Total protein; dw, Dry weight; Pyr-GC/MS, Pyrolysis-mass spectrometry gas chromatography; PVOH, Polyvinyl alcohol; PMMA, Polyacrylates; PET, Polyethylene terephthalate; PF, Phenol formaldehyde and other resin blends; PA, Polyamide; PE, Polyethylene; PP, Polypropylene; PIB, Polyisobutylene; PS, Polystyrene; PUR, Polyurethane; PC, Polycarbonate; FT-IR, Fourier transform infrared spectroscopy; PLE, Pressurized liquid extraction.
References
Abbott Point of Care Inc (2020). Procedure Manual for the i-STAT® System and i-STAT CHEM8+ Cartridge Manual. Available online at: https://co.grand.co.us/DocumentCenter/View/680/i-STAT-System-Operating-Instructions (Accessed March 26, 2020).
Aguirre A. A., Balazs G. H. (2000). Blood biochemistry values of green turtles, Chelonia mydas, with and without fibropapillomatosis. Comp. Haematol Int. 10, 132–137. doi: 10.1007/s005800070004
Amorocho D. F., Reina R. D. (2008). Intake passage time, digesta composition and digestibility in East Pacific green turtles (Chelonia mydas agassizii) at Gorgona National Park, Colombian Pacific. J. Exp. Mar. Biol. Ecol. 360, 117–124. doi: 10.1016/j.jembe.2008.04.009
Bajt O. (2021). From plastics to microplastics and organisms. FEBS Open Bio 11, 954–966. doi: 10.1002/2211-5463.13120
Bjorndal K. A. (1980). Nutrition and grazing behavior of the green turtle Chelonia mydas. Mar. Biol. 56, 147–154. doi: 10.1007/BF00397131
Botterell Z. L. R., Ribeiro F., Alarcón-Ruales D., Alfaro E., Alfaro-Shigueto J., Allan N., et al. (2024). Plastic pollution transcends marine protected area boundaries in the eastern tropical and south-eastern Pacific. Mar. pollut. Bull. 201, 116271. doi: 10.1016/j.marpolbul.2024.116271
Bucci K., Tulio M., Rochman C. M. (2020). What is known and unknown about the effects of plastic pollution: A meta-analysis and systematic review. Ecol. Appl. 30, 25. doi: 10.1002/eap.2044
Caron A. G. M., Thomas C. R., Berry K. L. E., Motti C. A., Ariel E., Brodie J. E. (2018). Ingestion of microplastic debris by green sea turtles (Chelonia mydas) in the Great Barrier Reef: Validation of a sequential extraction protocol. Mar. pollut. Bull. 127, 743–751. doi: 10.1016/j.marpolbul.2017.12.062
Carpenter J. W., Harms C. A. (Eds.) (2023). Carpenter’s Exotic Animal Formulary. Sixth edition (St. Louis, Missouri: Elsevier).
Carpentier A. S., Jean C., Barret M., Chassagneux A., Ciccione S. (2016). Stability of facial scale patterns on green sea turtles Chelonia mydas over time: A validation for the use of a photo-identification method. J. Exp. Mar. Biol. Ecol. 476, 15–21. doi: 10.1016/j.jembe.2015.12.003
Carr A. (1987). New perspectives on the pelagic stage of sea turtle development. Conserv. Biol. 1, 103–121. doi: 10.1111/j.1523-1739.1987.tb00020.x
Carrión-Cortez J. A., Zárate P., Seminoff J. A. (2010). Feeding ecology of the green sea turtle ( Chelonia mydas) in the Galapagos Islands. J. Mar. Biol. Ass. 90, 1005–1013. doi: 10.1017/S0025315410000226
Casale P., Freggi D., Paduano V., Oliverio M. (2016). Biases and best approaches for assessing debris ingestion in sea turtles, with a case study in the Mediterranean. Mar. pollut. Bull. 110, 238–249. doi: 10.1016/j.marpolbul.2016.06.057
Cassone B. J., Grove H. C., Elebute O., Villanueva S. M. P., LeMoine C. M. R. (2020). Role of the intestinal microbiome in low-density polyethylene degradation by caterpillar larvae of the greater wax moth, Galleria mellonella. Proc. R. Soc B. 287, 20200112. doi: 10.1098/rspb.2020.0112
Chen Y.-T., Ding D.-S., Lim Y. C., Singhania R. R., Hsieh S., Chen C.-W., et al. (2022). Impact of polyethylene microplastics on coral Goniopora columna causing oxidative stress and histopathology damages. Sci. Total Environ. 828, 154234. doi: 10.1016/j.scitotenv.2022.154234
Claro F., Fossi M. C., Ioakeimidis C., Baini M., Lusher A. L., Mc Fee W., et al. (2019). Tools and constraints in monitoring interactions between marine litter and megafauna: Insights from case studies around the world. Mar. pollut. Bull. 141, 147–160. doi: 10.1016/j.marpolbul.2019.01.018
Clukey K. E., Lepczyk C. A., Balazs G. H., Work T. M., Lynch J. M. (2017). Investigation of plastic debris ingestion by four species of sea turtles collected as bycatch in pelagic Pacific longline fisheries. Mar. pollut. Bull. 120, 117–125. doi: 10.1016/j.marpolbul.2017.04.064
Comnea-Stancu I. R., Wieland K., Ramer G., Schwaighofer A., Lendl B. (2017). On the identification of Rayon/Viscose as a major fraction of microplastics in the marine environment: Discrimination between natural and manmade cellulosic fibers using Fourier transform infrared spectroscopy. Appl. Spectrosc 71, 939–950. doi: 10.1177/0003702816660725
Cook C. R., Halden R. U. (2020). “Ecological and health issues of plastic waste,” in Plastic Waste and Recycling (Elsevier), 513–527. doi: 10.1016/B978-0-12-817880-5.00020-7
Darmon G., Schulz M., Matiddi M., Loza A. L., Tomás J., Camedda A., et al. (2022). Drivers of litter ingestion by sea turtles: Three decades of empirical data collected in Atlantic Europe and the Mediterranean. Mar. pollut. Bull. 185, 114364. doi: 10.1016/j.marpolbul.2022.114364
Deakin K., Savage G., Jones J. S., Porter A., Muñoz-Pérez J. P., Santillo D., et al. (2024). Sea surface microplastics in the Galapagos: Grab samples reveal high concentrations of particles <200 μm in size. Sci. Total Environ. 923, 171428. doi: 10.1016/j.scitotenv.2024.171428
De Mello D. M. D., Alvarez M. C. L. (2020). Health assessment of juvenile green turtles in southern São Paulo State, Brazil: a hematologic approach. J. Vet. Diagn. Invest. 32, 25–35. doi: 10.1177/1040638719891972
Dris R., Gasperi J., Mirande C., Mandin C., Guerrouache M., Langlois V., et al. (2017). A first overview of textile fibers, including microplastics, in indoor and outdoor environments. Environ. pollut. 221, 453–458. doi: 10.1016/j.envpol.2016.12.013
Dris R., Gasperi J., Saad M., Mirande C., Tassin B. (2016). Synthetic fibers in atmospheric fallout: A source of microplastics in the environment? Mar. pollut. Bull. 104, 290–293. doi: 10.1016/j.marpolbul.2016.01.006
Duncan E. M., Arrowsmith J. A., Bain C. E., Bowdery H., Broderick A. C., Chalmers T., et al. (2019a). Diet-related selectivity of macroplastic ingestion in green turtles (Chelonia mydas) in the eastern Mediterranean. Sci. Rep. 9, 11581. doi: 10.1038/s41598-019-48086-4
Duncan E., Botterell Z., Broderick A., Galloway T., Lindeque P., Nuno A., et al. (2017). A global review of marine turtle entanglement in anthropogenic debris: a baseline for further action. Endang. Species. Res. 34, 431–448. doi: 10.3354/esr00865
Duncan E. M., Broderick A. C., Fuller W. J., Galloway T. S., Godfrey M. H., Hamann M., et al. (2019b). Microplastic ingestion ubiquitous in marine turtles. Glob Change Biol. 25, 744–752. doi: 10.1111/gcb.14519
EclinPath Cornell (2013). EclinPath Cornell University College of Veterinary Medicine. Available online at: https://eclinpath.com/chemistry/ (Accessed June 25, 2023).
Eriksen M., Lebreton L. C. M., Carson H. S., Thiel M., Moore C. J., Borerro J. C., et al. (2014). Plastic pollution in the world’s oceans: More than 5 trillion plastic pieces weighing over 250,000 tons afloat at sea. PloS One 9, e111913. doi: 10.1371/journal.pone.0111913
Fagiano V., Compa M., Alomar C., Rios-Fuster B., Morató M., Capó X., et al. (2023). Breaking the paradigm: Marine sediments hold two-fold microplastics than sea surface waters and are dominated by fibers. Sci. Total Environ. 858, 159722. doi: 10.1016/j.scitotenv.2022.159722
Frazier J. (2014). La Situación Regional de las Tortugas Marinas en el Pacífico Sudeste. Comisión Permanente del Pacífico Sur – CPPS. Available at: https://cpps-int.org/index.php/tortugas-docs/reg-tortugas-marinas. (Accessed July 11, 2024).
Frias J. P. G. L., Nash R. (2019). Microplastics: Finding a consensus on the definition. Mar. pollut. Bull. 138, 145–147. doi: 10.1016/j.marpolbul.2018.11.022
Fukuoka T., Yamane M., Kinoshita C., Narazaki T., Marshall G. J., Abernathy K. J., et al. (2016). The feeding habit of sea turtles influences their reaction to artificial marine debris. Sci. Rep. 6, 28015. doi: 10.1038/srep28015
Gaibor N., Condo-Espinel V., Cornejo-Rodríguez M. H., Darquea J. J., Pernia B., Domínguez G. A., et al. (2020). Composition, abundance and sources of anthropogenic marine debris on the beaches from Ecuador – A volunteer-supported study. Mar. pollut. Bull. 154, 111068. doi: 10.1016/j.marpolbul.2020.111068
Galápagos Tourism Observatory (2023). Galapagos Tourism Observatory. Available online at: https://www.observatoriogalapagos.gob.ec/arribos-anuales (Accessed October 9, 2023).
Gall S. C., Thompson R. C. (2015). The impact of debris on marine life. Mar. pollut. Bull. 92, 170–179. doi: 10.1016/j.marpolbul.2014.12.041
Galloway T. S., Cole M., Lewis C. (2017). Interactions of microplastic debris throughout the marine ecosystem. Nat. Ecol. Evol. 1, 116. doi: 10.1038/s41559-017-0116
Garcia-Garin O., Aguilar A., Vighi M., Víkingsson G. A., Chosson V., Borrell A. (2021). Ingestion of synthetic particles by fin whales feeding off western Iceland in summer. Chemosphere 279, 130564. doi: 10.1016/j.chemosphere.2021.130564
González-Paredes D., Ariel E., David M. F., Ferrando V., Marsh H., Hamann M. (2021). Gastrointestinal transit times in juvenile green turtles: An approach for assessing digestive motility disorders. J. Exp. Mar. Biol. Ecol. 544, 151616. doi: 10.1016/j.jembe.2021.151616
Gregory M. R. (2009). Environmental implications of plastic debris in marine settings—entanglement, ingestion, smothering, hangers-on, hitch-hiking and alien invasions. Phil. Trans. R. Soc B 364, 2013–2025. doi: 10.1098/rstb.2008.0265
Hardesty B. D., Holdsworth D., Revill A. T., Wilcox C. (2015). A biochemical approach for identifying plastics exposure in live wildlife. Methods Ecol. Evol. 6, 92–98. doi: 10.1111/2041-210X.12277
Hazen E. L., Abrahms B., Brodie S., Carroll G., Jacox M. G., Savoca M. S., et al. (2019). Marine top predators as climate and ecosystem sentinels. Front. Ecol. Environ. 17, 565–574. doi: 10.1002/fee.2125
Hoarau L., Ainley L., Jean C., Ciccione S. (2014). Ingestion and defecation of marine debris by loggerhead sea turtles, Caretta caretta, from by-catches in the South-West Indian Ocean. Mar. pollut. Bull. 84, 90–96. doi: 10.1016/j.marpolbul.2014.05.031
Hunt K. E., Innis C. J., Merigo C., Rolland R. M. (2016). Endocrine responses to diverse stressors of capture, entanglement and stranding in leatherback turtles (Dermochelys coriacea). Conserv. Physiol. 4, cow022. doi: 10.1093/conphys/cow022
INEC (2016).Galápagos tiene 25.244 habitantes según censo 2015. In: Ecuadorencifras. Available online at: https://www.Ecuadorencifras.gob.ec/galapagos-tiene-25-244-habitantes-segun-censo-2015/ (Accessed October 14, 2022).
Jambeck J. R., Geyer R., Wilcox C., Siegler T. R., Perryman M., Andrady A., et al. (2015). Plastic waste inputs from land into the ocean. Science 347, 768–771. doi: 10.1126/science.1260352
Jones J. (2021). Investigating the Exposure and Potential Impacts of Microplastics in the Galápagos Marine Food Web (England: University of Exeter (United Kingdom). Available at: https://www.proquest.com/dissertations-theses/investigating-exposure-potential-impacts/docview/2625629502/se-2?accountid=28745.
Jones J. S., Guézou A., Medor S., Nickson C., Savage G., Alarcón-Ruales D., et al. (2022). Microplastic distribution and composition on two Galápagos island beaches, Ecuador: Verifying the use of citizen science derived data in long-term monitoring. Environ. pollut. 311, 120011. doi: 10.1016/j.envpol.2022.120011
Jones J. S., Porter A., Muñoz-Pérez J. P., Alarcón-Ruales D., Galloway T. S., Godley B. J., et al. (2021). Plastic contamination of a Galapagos Island (Ecuador) and the relative risks to native marine species. Sci. Total Environ. 789, 147704. doi: 10.1016/j.scitotenv.2021.147704
Joseph J., Nishizawa H., Jalimin S. N., Othman R., Jaaman S. A., Bali J., et al. (2023). Health status and genetic compositions of green turtles (Chelonia mydas) foraging in Brunei Bay. PloS One 18, e0293979. doi: 10.1371/journal.pone.0293979
Jung M. R., Balazs G. H., Work T. M., Jones T. T., Orski S. V., Rodriguez C. V., et al. (2018a). Polymer identification of plastic debris ingested by pelagic-phase sea turtles in the Central Pacific. Environ. Sci. Technol. 52, acs.est.8b03118. doi: 10.1021/acs.est.8b03118
Jung M. R., Horgen F. D., Orski S. V., Rodriguez C. V., Beers K. L., Balazs G. H., et al. (2018b). Validation of ATR FT-IR to identify polymers of plastic marine debris, including those ingested by marine organisms. Mar. pollut. Bull. 127, 704–716. doi: 10.1016/j.marpolbul.2017.12.061
Kaleel K. L., Secoura P. L., Muñoz-Pérez J. P., Alarcón-Ruales D., Miranda C., Lewbart G. A., et al. (2023). Endoscopy and rectal enema for fecal collection in wild sea turtles (Chelonia mydas, Eretmochelys imbricata) in a field setting. Zoo Biol. 21805. doi: 10.1002/zoo.21805
Kane I. A., Clare M. A., Miramontes E., Wogelius R., Rothwell J. J., Garreau P., et al. (2020). Seafloor microplastic hotspots controlled by deep-sea circulation. Science 368, eaba5899. doi: 10.1126/science.aba5899
Laist D. W. (1997). “Impacts of marine debris: entanglement of marine life in marine debris including a comprehensive list of species with entanglement and ingestion records,” in Marine Debris. Eds. Coe J. M., Rogers D. B. (Springer New York, New York, NY), 99–139. doi: 10.1007/978-1-4613-8486-1_10
Lavers J. L., Hutton I., Bond A. L. (2019). Clinical pathology of plastic ingestion in marine birds and relationships with blood chemistry. Environ. Sci. Technol. 53, 9224–9231. doi: 10.1021/acs.est.9b02098
Lewbart G. A., Hirschfeld M., Denkinger J., Vasco K., Guevara N., García J., et al. (2014). Blood gases, biochemistry, and hematology of Galapagos green turtles (Chelonia mydas). PloS One 9, e96487. doi: 10.1371/journal.pone.0096487
Li M., Liu Y., Xu G., Wang Y., Yu Y. (2021). Impacts of polyethylene microplastics on bioavailability and toxicity of metals in soil. Sci. Total Environ. 760, 144037. doi: 10.1016/j.scitotenv.2020.144037
Li W. C., Tse H. F., Fok L. (2016). Plastic waste in the marine environment: A review of sources, occurrence and effects. Sci. Total Environ. 566–567, 333–349. doi: 10.1016/j.scitotenv.2016.05.084
Lusher A. L., Bråte I. L. N., Munno K., Hurley R. R., Welden N. A. (2020). Is it or isn’t it: the importance of visual classification in microplastic characterization. Appl. Spectrosc 74, 1139–1153. doi: 10.1177/0003702820930733
MacLeod M., Arp H. P. H., Tekman M. B., Jahnke A. (2021). The global threat from plastic pollution. Science 373, 61–65. doi: 10.1126/science.abg5433
Manire C. A., Norton T. M., Stacy B. A., Innis C. J., Harms C. A. (Eds.) (2017). Sea turtle health & rehabilitation (Plantation, FL: J. Ross Publishing).
Manoukian O. S., Sardashti N., Stedman T., Gailiunas K., Ojha A., Penalosa A., et al. (2019). “Biomaterials for tissue engineering and regenerative medicine,” in Encyclopedia of Biomedical Engineering (Elsevier), 462–482. doi: 10.1016/B978-0-12-801238-3.64098-9
Mazurais D., Ernande B., Quazuguel P., Severe A., Huelvan C., Madec L., et al. (2015). Evaluation of the impact of polyethylene microbeads ingestion in European sea bass (Dicentrarchus labrax) larvae. Mar. Environ. Res. 112, 78–85. doi: 10.1016/j.marenvres.2015.09.009
Meaza I., Toyoda J. H., Wise S. J.P. (2021). Microplastics in sea turtles, marine mammals and humans: A one environmental health perspective. Front. Environ. Sci. 8. doi: 10.3389/fenvs.2020.575614
Muñoz-Pérez J. P., Lewbart G. A., Alarcón-Ruales D., Skehel A., Cobos E., Rivera R., et al. (2023). Galápagos and the plastic problem. Front. Sustain. 4. doi: 10.3389/frsus.2023.1091516
Muñoz-Pérez J. P., Lewbart G. A., Hirschfeld M., Alarcón-Ruales D., Denkinger J., Castañeda J. G., et al. (2017). Blood gases, biochemistry and haematology of Galápagos hawksbill turtles (Eretmochelys imbricata). Conserv. Physiol. 5, 06. doi: 10.1093/conphys/cox028
Nelms S. E., Duncan E. M., Broderick A. C., Galloway T. S., Godfrey M. H., Hamann M., et al. (2016). Plastic and marine turtles: a review and call for research. ICES J. Mar. Sci. 73, 165–181. doi: 10.1093/icesjms/fsv165
Nelms S. E., Galloway T. S., Godley B. J., Jarvis D. S., Lindeque P. K. (2018). Investigating microplastic trophic transfer in marine top predators. Environ. pollut. 238, 999–1007. doi: 10.1016/j.envpol.2018.02.016
Nelms S. E., Parry H. E., Bennett K. A., Galloway T. S., Godley B. J., Santillo D., et al. (2019). What goes in, must come out: Combining scat-based molecular diet analysis and quantification of ingested microplastics in a marine top predator. Methods Ecol. Evol. 10, 1712–1722. doi: 10.1111/2041-210X.13271
Nguyen B., Claveau-Mallet D., Hernandez L. M., Xu E. G., Farner J. M., Tufenkji N. (2019). Separation and analysis of microplastics and nanoplastics in complex environmental samples. Acc. Chem. Res. 52, 858–866. doi: 10.1021/acs.accounts.8b00602
Nicolau L., Marçalo A., Ferreira M., Sá S., Vingada J., Eira C. (2016). Ingestion of marine litter by loggerhead sea turtles, Caretta caretta, in Portuguese continental waters. Mar. pollut. Bull. 103, 179–185. doi: 10.1016/j.marpolbul.2015.12.021
Nigro L., Magni S., Ortenzi M. A., Gazzotti S., Della Torre C., Binelli A. (2022). Are “liquid plastics” a new environmental threat? The case of polyvinyl alcohol. Aquat. Toxicol. 248, 106200. doi: 10.1016/j.aquatox.2022.106200
Okoffo E. D., O’Brien S., O’Brien J. W., Tscharke B. J., Rauert C., Rødland E. S., et al. (2022). Does size matter? Quantification of plastics associated with size fractionated biosolids. Sci. Total Environ. 811, 152382. doi: 10.1016/j.scitotenv.2021.152382
Okoffo E. D., Ribeiro F., O’Brien J. W., O’Brien S., Tscharke B. J., Gallen M., et al. (2020). Identification and quantification of selected plastics in biosolids by pressurized liquid extraction combined with double-shot pyrolysis gas chromatography–mass spectrometry. Sci. Total Environ. 715, 136924. doi: 10.1016/j.scitotenv.2020.136924
Pavičić-Hamer D., Kovačić I., Sović T., Marelja M., Lyons D. M. (2022). Exposure to polymethylmethacrylate microplastics induces a particle size-dependent immune response in Mediterranean mussel Mytilus galloprovincialis. Fishes 7, 307. doi: 10.3390/fishes7060307
Prata J. C., da Costa J. P., Girão A. V., Lopes I., Duarte A. C., Rocha-Santos T. (2019). Identifying a quick and efficient method of removing organic matter without damaging microplastic samples. Sci. Total Environ. 686, 131–139. doi: 10.1016/j.scitotenv.2019.05.456
Primpke S., Fischer M., Lorenz C., Gerdts G., Scholz-Böttcher B. M. (2020). Comparison of pyrolysis gas chromatography/mass spectrometry and hyperspectral FTIR imaging spectroscopy for the analysis of microplastics. Anal. Bioanal Chem. 412, 8283–8298. doi: 10.1007/s00216-020-02979-w
Reisser J., Proietti M., Kinas P., Sazima I. (2008). Photographic identification of sea turtles: method description and validation, with an estimation of tag loss. Endang. Species. Res. 5, 73–82. doi: 10.3354/esr00113
Reséndiz E., Lara-Uc M. M. (2018). “Health assessments in free-ranging sea turtles: perspective of animal welfare in wildlife,” in Animal Welfare. Eds. Abubakar M., Manzoor S. (InTech). doi: 10.5772/intechopen.76111
Ribeiro F., Okoffo E. D., O’Brien J. W., Fraissinet-Tachet S., O’Brien S., Gallen M., et al. (2020). Quantitative analysis of selected plastics in high-commercial-value Australian seafood by pyrolysis gas chromatography mass spectrometry. Environ. Sci. Technol. 54, 9408–9417. doi: 10.1021/acs.est.0c02337
Ribeiro F., Okoffo E. D., O’Brien J. W., O’Brien S., Harris J. M., Samanipour S., et al. (2021). Out of sight but not out of mind: Size fractionation of plastics bioaccumulated by field deployed oysters. J. Hazardous Materials Lett. 2, 100021. doi: 10.1016/j.hazl.2021.100021
Rizzi M., Rodrigues F. L., Medeiros L., Ortega I., Rodrigues L., Monteiro D. S., et al. (2019). Ingestion of plastic marine litter by sea turtles in southern Brazil: abundance, characteristics and potential selectivity. Mar. pollut. Bull. 140, 536–548. doi: 10.1016/j.marpolbul.2019.01.054
Rochman C. M., Hoh E., Kurobe T., Teh S. J. (2013). Ingested plastic transfers hazardous chemicals to fish and induces hepatic stress. Sci. Rep. 3, 3263. doi: 10.1038/srep03263
Rodríguez Y., Vandeperre F., Santos M. R., Herrera L., Parra H., Deshpande A., et al. (2022). Litter ingestion and entanglement in green turtles: An analysis of two decades of stranding events in the NE Atlantic. Environ. pollut. 298, 118796. doi: 10.1016/j.envpol.2022.118796
Rolsky C., Kelkar V. (2021). Degradation of polyvinyl alcohol in US wastewater treatment plants and subsequent nationwide emission estimate. IJERPH 18, 6027. doi: 10.3390/ijerph18116027
Roman L., Kastury F., Petit S., Aleman R., Wilcox C., Hardesty B. D., et al. (2020). Plastic, nutrition and pollution; relationships between ingested plastic and metal concentrations in the livers of two Pachyptila seabirds. Sci. Rep. 10, 18023. doi: 10.1038/s41598-020-75024-6
Roman L., Hardesty B. D., Schuyler Q. (2022). A systematic review and risk matrix of plastic litter impacts on aquatic wildlife: A case study of the Mekong and Ganges River Basins. Sci. Total Environ. 843, 156858. doi: 10.1016/j.scitotenv.2022.156858
Rossatto A., Arlindo M. Z. F., De Morais M. S., De Souza T. D., Ogrodowski C. S. (2023). Microplastics in aquatic systems: A review of occurrence, monitoring and potential environmental risks. Environ. Adv. 13, 100396. doi: 10.1016/j.envadv.2023.100396
Salvador Cesa F., Turra A., Baruque-Ramos J. (2017). Synthetic fibers as microplastics in the marine environment: A review from textile perspective with a focus on domestic washings. Sci. Total Environ. 598, 1116–1129. doi: 10.1016/j.scitotenv.2017.04.172
Santos R. G., Martins A. S., Farias J. D. N., Horta P. A., Pinheiro H. T., Torezani E., et al. (2011). Coastal habitat degradation and green sea turtle diets in Southeastern Brazil. Mar. pollut. Bull. 62, 1297–1302. doi: 10.1016/j.marpolbul.2011.03.004
Savage G., Porter A., Simpson S. D. (2022). Uptake of microplastics by the snakelocks anemone (Anemonia viridis) is commonplace across environmental conditions. Sci. Total Environ. 836, 155144. doi: 10.1016/j.scitotenv.2022.155144
Schofield G., Katselidis K. A., Dimopoulos P., Pantis J. D. (2008). Investigating the viability of photo-identification as an objective tool to study endangered sea turtle populations. J. Exp. Mar. Biol. Ecol. 360, 103–108. doi: 10.1016/j.jembe.2008.04.005
Schuyler Q., Hardesty B. D., Wilcox C., Townsend K. (2012). To eat or not to eat? Debris selectivity by marine turtles. PloS One 7, e40884. doi: 10.1371/journal.pone.0040884
Schuyler Q. A., Wilcox C., Townsend K. A., Wedemeyer-Strombel K. R., Balazs G., Van Sebille E., et al. (2016). Risk analysis reveals global hotspots for marine debris ingestion by sea turtles. Glob Change Biol. 22, 567–576. doi: 10.1111/gcb.13078
Seminoff J. A., Resendiz A., Nichols W. J. (2002). Diet of East Pacific green turtles (Chelonia mydas) in the Central Gulf of California, México. J. Herpetology 36, 447–453. doi: 10.1670/0022-1511(2002)036[0447:DOEPGT]2.0.CO;2
Senko J., Nelms S., Reavis J., Witherington B., Godley B., Wallace B. (2020). Understanding individual and population-level effects of plastic pollution on marine megafauna. Endang. Species. Res. 43, 234–252. doi: 10.3354/esr01064
Stamper M. A., Spicer C. W., Neiffer D. L., Mathews K. S., Fleming G. J. (2009). Morbidity in a juvenile green sea turtle (Chelonia mydas) due to ocean-borne plastic. J. Zoo Wildlife Med. 40, 196–198. doi: 10.1638/2007-0101.1
Susanti N. K. Y., Mardiastuti A., Wardiatno Y. (2020). Microplastics and the impact of plastic on wildlife: A literature review. IOP Conf. Ser.: Earth Environ. Sci. 528, 12013. doi: 10.1088/1755-1315/528/1/012013
Taylor M. L., Gwinnett C., Robinson L. F., Woodall L. C. (2016). Plastic microfibre ingestion by deep-sea organisms. Sci. Rep. 6, 33997. doi: 10.1038/srep33997
Thayer G. W., Engel D. W., XXXA. Bjorndal K. (1982). Evidence for short-circuiting of the detritus cycle of seagrass beds by the green turtle, Chelonia mydas L. J. Exp. Mar. Biol. Ecol. 62, 173–183. doi: 10.1016/0022-0981(82)90090-9
Thompson R. C. (2015). “Microplastics in the marine environment: sources, consequences and solutions,” in Marine Anthropogenic Litter. Eds. Bergmann M., Gutow L., Klages M. (Springer International Publishing, Cham), 185–200. doi: 10.1007/978-3-319-16510-3_7
Thrall M. A., Weiser G., Allison R. W., Campbell T. W. (Eds.) (2022). Veterinary Hematology, Clinical Chemistry and Cytology. 3rd ed. (Hoboken: Wiley Blackwell).
Tourinho P. S., Ivar Do Sul J. A., Fillmann G. (2010). Is marine debris ingestion still a problem for the coastal marine biota of southern Brazil? Mar. pollut. Bull. 60, 396–401. doi: 10.1016/j.marpolbul.2009.10.013
Valle C. A., Grijalva C. J., Calle P. P., Muñoz-Pérez J. P., Quezada G., Vera C. A., et al. (2019). Methods of body temperature assessment in Conolophus subcristatus, Conolophus pallidus (Galápagos land iguanas), and Amblyrhynchus cristatus X C. subcristatus hybrid. PeerJ 7, e6291. doi: 10.7717/peerj.6291
Van Sebille E., Delandmeter P., Schofield J., Hardesty B. D., Jones J., Donnelly A. (2019). Basin-scale sources and pathways of microplastic that ends up in the Galápagos archipelago. Ocean Sci. 15, 1341–1349. doi: 10.5194/os-15-1341-2019
Van Sebille E., Wilcox C., Lebreton L., Maximenko N., Hardesty B. D., Van Franeker J. A., et al. (2015). A global inventory of small floating plastic debris. Environ. Res. Lett. 10, 124006. doi: 10.1088/1748-9326/10/12/124006
Vélez-Rubio G. M., Teryda N., Asaroff P. E., Estrades A., Rodriguez D., Tomás J. (2018). Differential impact of marine debris ingestion during ontogenetic dietary shift of green turtles in Uruguayan waters. Mar. pollut. Bull. 127, 603–611. doi: 10.1016/j.marpolbul.2017.12.053
Wesch C., Elert A. M., Wörner M., Braun U., Klein R., Paulus M. (2017). Assuring quality in microplastic monitoring: About the value of clean-air devices as essentials for verified data. Sci. Rep. 7, 5424. doi: 10.1038/s41598-017-05838-4
Wilcox C., Puckridge M., Schuyler Q. A., Townsend K., Hardesty B. D. (2018). A quantitative analysis linking sea turtle mortality and plastic debris ingestion. Sci. Rep. 8, 12536. doi: 10.1038/s41598-018-30038-z
Woodall L. C., Gwinnett C., Packer M., Thompson R. C., Robinson L. F., Paterson G. L. J. (2015). Using a forensic science approach to minimize environmental contamination and to identify microfibres in marine sediments. Mar. pollut. Bull. 95, 40–46. doi: 10.1016/j.marpolbul.2015.04.044
Keywords: juvenile green sea turtle, wildlife, plastic pollution, health, pyr-GC/MS, FT-IR, marine protected areas, Ecuador
Citation: Muñoz-Pérez JP, Lewbart GA, Toapanta T, Chadwick H, Okoffo ED, Alarcón-Ruales D, Zurita-Arthos L, Jones JS, Cisneros F, Moreira-Mendieta A, Vintimilla-Palacios C, Miranda C, Vallejo F, Houck E, Alemán R, Escobar-Flores K, Skehel A, Castañeda J, Secoura P, Vaden S, Lewis C, Galloway T, Wallace B, Godley BJ, Cole M, Lindeque P, Thomas KV, Potvin DA, Valle CA and Townsend KA (2024) Plastic pollution and health metrics in wild juvenile green sea turtles (Chelonia mydas) from two Ecuadorian national parks: Galápagos and Machalilla. Front. Amphib. Reptile Sci. 2:1439512. doi: 10.3389/famrs.2024.1439512
Received: 28 May 2024; Accepted: 30 July 2024;
Published: 04 September 2024.
Edited by:
Hector Barrios-Garrido, University of Zulia, VenezuelaCopyright © 2024 Muñoz-Pérez, Lewbart, Toapanta, Chadwick, Okoffo, Alarcón-Ruales, Zurita-Arthos, Jones, Cisneros, Moreira-Mendieta, Vintimilla-Palacios, Miranda, Vallejo, Houck, Alemán, Escobar-Flores, Skehel, Castañeda, Secoura, Vaden, Lewis, Galloway, Wallace, Godley, Cole, Lindeque, Thomas, Potvin, Valle and Townsend. This is an open-access article distributed under the terms of the Creative Commons Attribution License (CC BY). The use, distribution or reproduction in other forums is permitted, provided the original author(s) and the copyright owner(s) are credited and that the original publication in this journal is cited, in accordance with accepted academic practice. No use, distribution or reproduction is permitted which does not comply with these terms.
*Correspondence: Juan Pablo Muñoz-Pérez, am11bm96cEB1c2ZxLmVkdS5lYw==