
94% of researchers rate our articles as excellent or good
Learn more about the work of our research integrity team to safeguard the quality of each article we publish.
Find out more
ORIGINAL RESEARCH article
Front. Agron. , 08 November 2024
Sec. Weed Management
Volume 6 - 2024 | https://doi.org/10.3389/fagro.2024.1493799
This article is part of the Research Topic Innovative Technology and Techniques for Effective Weed Control View all 6 articles
Remotely piloted aerial application systems (RPAAS) are exponentially increasing globally for pesticide applications. Evaluations of spray coverage, deposits, and droplet size, when implementing various application parameters, are needed to optimize these applications. A RPAAS at 46.8 L ha-1 provided similar or greater coverage and deposits to ground equipment at 93.5 L ha-1 across nozzle types evaluated excluding the XR. The RPAAS at 18.7 L ha-1 had reduced coverage (<9% total coverage) and deposits (<350 total deposits cm-2) regardless of nozzle type evaluated compared to the other two application setups. The top and back WSP locations had considerably greater coverage and deposits than the front WSP location likely due to wind speed and direction being more important drivers for spray dynamics than direction of sprayer travel. Generally, nozzle selection was less critical for coverage and deposits from RPAAS at 18.7 L ha-1. The AITTJ60, AIXR, and TADF nozzle types may be optimum options for RPAAS, particularly at 46.8 L ha-1, as they improved coverage, deposits, and estimated recovery rate while producing the greatest droplet size, thereby reducing spray drift potential. Results of this research demonstrated coverage, deposits, and droplet size from RPAAS at 46.8 L ha-1 can be equivalent to ground spray equipment at 93.5 L ha-1 across a range of nozzle types and therefore, may be viable for effective pesticide applications. Applications using RPAAS at 18.7 L ha-1 resulted in considerably less coverage and deposits across nozzle types evaluated, and would be at risk for reduced pesticide efficacy.
Effective pest management is vital for maintaining agricultural productivity, enhancing human health, and minimizing economic losses. Severe negative consequences on agricultural production and human health have been observed from insects (Belluco et al., 2023), plant pathogens (e.g., fungi) (Kim et al., 2020; Ristaino et al., 2021), and weeds (Pimentel et al., 2005; Weed Science Society of America (WSSA), 2016). Additionally, the annual cost to the United States agricultural economy due to crop losses and herbicide costs from introduced weeds was estimated at approximately USD 26 billion (Pimentel, 2009) with global crop losses estimated at 34% and an annual cost (revenue loss plus herbicide cost) of over USD 125 billion (Oerke, 2006; Gharde et al., 2018). This value does not account for the estimated 4.5% increase in the cost of food for every 1% decrease in crop yield, nor does it account for approximately USD 11 billion in environmental and public health impacts. As a result, the need for pesticides is unsurprising with the global agricultural pesticide use totaling 1.70, 0.82, and 0.76 million tonnes in 2021 for herbicides, fungicides, and insecticides, respectively (FAOSTAT, 2021). The demand to apply these pesticides economically and environmentally-consciously requires each application procedure to be thoroughly understood and optimized.
One of the primary philosophies to optimize pesticide applications is to more accurately and precisely deposit sprays onto the target (Matthews et al., 2014). The methods to achieve this goal can vary widely depending on the specific application and numerous parameters that affect coverage and spray deposits. Previous research illustrated spray droplet size and coverage was affected by nozzle type and herbicide active ingredient which subsequently resulted in mixed impacts on weed groundcover (Priess et al., 2021). An increase in sprayer speed reduced coverage from a non-rate-controlled sprayer (Sapkota et al., 2023). Although a rate-controlled sprayer buffered coverage fluctuations across a range of sprayer speeds, it resulted in increased spray droplet size variability. An increase in spray volume subsequently increased target coverage, particularly when needing to penetrate the crop canopy (Legleiter and Johnson, 2016). Even further, increased application pressures and asymmetrical dual-fan nozzle types with alternating arrangements increased droplet densities on targets (Ferguson et al., 2016). Although coverage and spray deposits have not always been directly tied to biological efficacy, previous research exploring nozzle selection impacts on barnyardgrass (Echinochloa crus-galli P. Beauv) control revealed similar numerical trends with increased spray deposits resulting in reduced weed seed production (Reed et al., 2024). Overall, there are numerous complexities in improving overall spray coverage and deposits due to the three-dimensional architecture of plants, and that a possible solution to improve deposition is to deploy a suitable airflow or increase turbulence within a crop canopy (Matthews et al., 2014). One such application method that may aid in this attribute is through the use of remotely piloted aerial application systems (RPAAS).
Unmanned aerial systems (UAS), both imaging and spray-based, have exponentially expanded over the past five years. For instance, it was estimated there were 4,000 crop protection RPAAS in China in 2016; by 2021, this number grew to more than 120,000 RPAAS treating over 71 million hectares of crop land (Ozkan, 2024). Currently in the United States, the Federal Aviation Administration (FAA) has more than 375,000 UAS registered commercially with nearly 5,700 additional aircraft specifically registered as RPAAS (FAA, 2024). The agricultural UAS global market was estimated to be worth approximately USD 1.4 billion in 2021 with forecasts predicting a total market size of USD 11.9 billion by 2028 (Research and Markets, 2023). In addition, United States farmers employing UAS operations have indicated returns on investment of USD 30 ha-1 for corn (Zea mays L.) and USD 5 to 7 ha-1 for soybean [Glycine max (L.) Merr.] and wheat (Triticum aestivum L.). The use of both remote sensing UAS and RPAAS has been expanded to include all facets of crop protection including plant disease (Vitória et al., 2023), insects (Iost Filho et al., 2020), and weeds (Hunter et al., 2020b). However, the airflow and spray transport dynamics of RPAAS, particularly from rotary-wing quad-, hex-, and octo-copters, are each unique compared to ground driven sprayers, fixed-wing aircraft, and single rotary-wing manned aircraft.
These unique application dynamics can be compared to a top-down, vertically oriented air-assisted sprayer. Air-assisted sprayers use an airflow field to assist in the transport and distribution of pesticides to and within crop canopies, previously having been demonstrated to increase canopy penetration and reduce downwind drift (Matthews et al., 2014). Research with RPAAS demonstrated the downwash generated from the rotor increased spray droplet velocities, narrowed the spray plume distribution, improved droplet distribution uniformity, and increased spray deposition and penetration, thereby creating a more concentrated deposition area with less off-target movement risk than a standard application without airflow downwash (Zhan et al., 2022; Feng et al., 2024; Fritz and Butts, 2024).
Several RPAAS studies have evaluated application parameter optimization for spray deposition and pest control. To summarize the overall trends across research trials, it was generally identified that RPAAS spray optimization occurred at a flight height between 1.5 and 2 m with a flight speed from 3 to 5 m s-1 (Qin et al., 2016; Liao et al., 2019; Meng et al., 2019; Hunter et al., 2020a; Huang et al., 2023). Additionally, RPAAS equipped with nozzles producing a coarser spray droplet size, increased spray deposition and reduced drift potential compared to those equipped with nozzles producing finer sprays (Wang et al., 2019; Hunter et al., 2020a; Huang et al., 2023). These application parameters not only optimized spray deposition, but also maintained or improved pesticidal activity (insecticides, fungicides, herbicides, and defoliants) compared to more conventional application methods (Qin et al., 2016; Liao et al., 2019; Meng et al., 2019; Wang et al., 2019; Huang et al., 2023). Spray volume was the most variable factor for RPAAS spray deposition optimization with recommended volumes ranging from 15 to 48 L ha-1 (Liao et al., 2019; Meng et al., 2019; Wang et al., 2019; Delavarpour et al., 2023; Huang et al., 2023). Overall, RPAAS have the potential to be an alternative, effective pesticide application tool; however, they require specific parametrization to obtain complete effectiveness.
As RPAAS continue to grow in popularity, a more thorough evaluation of the impact application setups and nozzle selection have on resulting spray dynamics is critical, particularly to optimize biological efficacy of pesticides applied. However, there is minimal to no present research providing information on spray coverage, deposits, and droplet size resulting from the use of a diverse nozzle set on a RPAAS to generate more robust nozzle recommendations (Delavarpour et al., 2023). Therefore, the objective of this research was to assess holistic spray coverage, deposits, and droplet size from a RPAAS compared to a ground-based sprayer across various application parameters such as nozzle selection and spray volume.
A laboratory experiment was conducted in the fall of 2023 to measure droplet size distributions from nozzle types used in the field experiment described in the subsequent section. The six nozzle types evaluated and their respective manufacturer information can be found in Table 1. Nozzle treatments were selected based on commercial popularity, the ability to provide a range of spray classifications, and to evaluate various nozzle designs (i.e., single-fan straight flow path, single-fan angled exit orifice, and dual-fan). Water alone was used as the spray solution for testing.
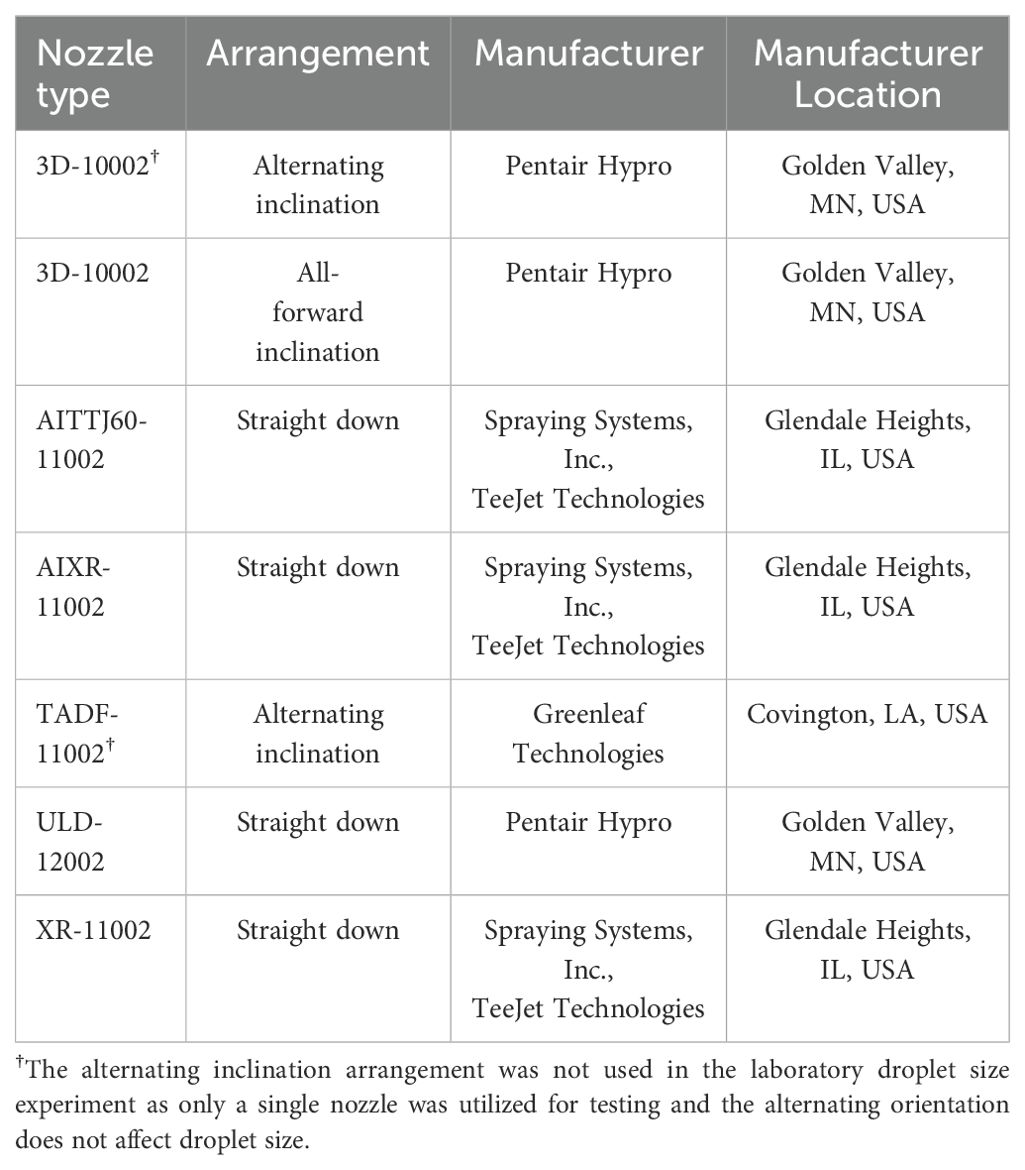
Table 1. Nozzle type, arrangement, and manufacturer information for the nozzle treatments evaluated in the laboratory droplet size experiment and the water sensitive paper field experiment.
Droplet size analysis procedures and infrastructure at the United States Department of Agriculture, Agricultural Research Service Aerial Application Technology laboratory was outlined in detail in previous research (Fritz et al., 2014b). In brief, the low wind speed tunnel located in College Station, Texas, USA is 1.2 × 1.2 m and 9.8 m long operated at an air velocity of 24 km hr-1. The outlet section of the tunnel was funneled through a forced impaction scrubber system that uses an assisted suction fan to maintain air velocity through the filter. The nozzle was positioned to spray horizontally, parallel to the airflow with the spray fan perpendicular to the laser beam (Butts et al., 2019). The nozzle body was traversed vertically allowing for sampling from the full spray plume. A pressure regulator was used to maintain application pressure at 103 kPa to match operating conditions as a part of the field experiment described later. The pressure was measured using an electronic pressure transducer (Model PX409-100GUSB, Omega Engineering, Inc., Stamford, CT) positioned 20 cm upstream from the nozzle outlet.
A Sympatec HELOS laser diffraction system was used for the droplet size analysis. The R7 lens, which has a dynamic sizing range of 18–3500 µm divided across 32 size bins, was used. Measurement distance between nozzle outlet and laser beam was set at 30.5 cm. Each measurement replication consisted of one full vertical traverse of the spray plume. Sufficient replications were made to ensure that the standard deviations of Dv0.1, Dv0.5, and Dv0.9, droplet diameters in which 10, 50, and 90% of the spray volume was contained in droplets with smaller diameter, respectively, were all within ±5% of the means with a minimum of three replications being made. Data collected consisted of the aforementioned Dv0.1, Dv0.5, and Dv0.9, the relative span (RS) which is a dimensionless parameter that provides an estimate of the variance of the droplet sizes within a spray, and the percent of spray volume contained in droplets with diameters less than 200-µm (%<200). Additionally, spray classifications were determined in accordance with the ASABE S572.3 standard (ANSI/ASABE, 2020). Droplet size data were statistically analyzed with analysis of variance using SAS v9.4 (SAS Institute, Cary, NC, USA) and the GLIMMIX procedure. Nozzle type was considered a fixed effect for Dv0.1, Dv0.5, Dv0.9, RS, and %<200. A gamma distribution was utilized for the Dv0.1, Dv0.5, Dv0.9, and RS as data were bound between 0 and positive infinity, and %<200 was analyzed using a beta distribution as data were bound between 0 and 1 (Gbur et al., 2012; Stroup, 2012). Means were separated using Tukey’s Honestly Significant Difference at α=0.05.
A field experiment was conducted near Newport, Arkansas, USA (35.5756, -91.2521) in the spring of 2023 to measure the spray deposition characteristics from applications involving a RPAAS (DJI AGRAS T30, SZ DJI Technology Co., Nanshan District, Shenzhen, China) and ground spray equipment (Bowman MudMaster, Bowman Manufacturing Co., Inc., Newport, Arkansas, USA). The experiment was a completely randomized design with five replications. Treatments consisted of three application setups (RPAAS at 18.7 L ha-1, RPAAS at 46.8 L ha-1, and ground equipment at 93.5 L ha-1), three water sensitive paper (WSP) collection locations (top, front, and back), and seven nozzle types/arrangements. The nozzle types, arrangements, and manufacturer information are in Table 1. Treatments were selected based on common current commercial applications and to assess holistic coverage as if simulating an entire plant structure. Additional nozzles including the Guardian Air Twin (GAT, Pentair Hypro, Golden Valley, MN, USA), Turbo TeeJet Induction (TTI, Spraying Systems, Inc., TeeJet Technologies, Glendale Heights, IL, USA), and Mid-Range Combo-Jet (MR, Wilger Inc., Lexington, TN, USA) were initially outlined for testing; however, due to nozzle and O-ring designs, these nozzles could not be properly attached to the RPAAS.
The RPAAS was flown using Manual Plus mode which fixed the aircraft’s heading directly over top of collection stations while allowing for manual control of the spray operation. The aircraft speed was input into the controller prior to the application to hold the application speed constant. Across spray volumes, the RPAAS was operated at a 2.4 m flight height with a theoretical (controller input) swath width of 5.5 m and included 12 of 16 nozzles spraying at one time. Additionally, a calculated total flow rate of 4.81 L min-1 was used for both spray volume treatments which led to a theoretical pressure calculation of approximately 103 kPa at the nozzle. This pressure fell below the minimum nozzle manufacturer recommended pressures; however, these orifice sizes were commercially popular at the time the research was conducted and was the preference of the RPAAS pilot applicator aiding in the research. Therefore, the decision was made to continue with the low pressures to provide an assessment of common RPAAS application settings used commercially. To create the spray volume treatments, the RPAAS flight speed was manipulated which consisted of 7.0 and 2.8 m s-1 for the 18.7 and 46.8 L ha-1 spray volumes, respectively.
The ground spray equipment was operated with a boom height of 0.7 m and traveled at 5 km hr-1. It had a six-nozzle, front mounted boom with nozzles spaced 51-cm apart equating to a 3 m wide spray pass. The ground sprayer, pressurized using compressed air, was calibrated to deliver the appropriate spray volume (94 L ha-1) with 103 kPa at the nozzle to match the calculated theoretical nozzle pressure from the RPAAS. On the day of testing, weather conditions consisted of an average air temperature of 8.5C, 57% relative humidity, and a 6.9 km hr-1 average wind speed (gusts up to 14.5 km hr-1) from 77° (WatchDog 3550 Wireless ET Station, Spectrum Technologies, Aurora, IL USA).Both the RPAAS and ground spray equipment were flown or driven directly in-wind for all data collection.
Data collection consisted of spray coverage (%), deposits (# cm-2), Dv0.5 (µm), and estimated recovery rate (deposition as a % of intended application rate) measured using water sensitive paper (WSP) placed on collection stands placed along the flight and drive path and located at the center of the equipment’s spray swath (Figure 1). It should be noted that estimated recovery rate was only determined for the top, horizontal WSP as it is a function of the intended application rate and is measured as the amount of material settling across a horizontal plane and area. Three WSP (Spraying Systems, Inc., TeeJet Technologies, Glendale Heights, IL, USA) were placed on each collection stand and five separate collection stands were utilized. The three WSP comprised a horizontal paper placed 15-cm from ground level at the top of the collection stand (top), a vertical paper placed immediately below the top paper facing the oncoming sprayer (front), and a vertical paper placed immediately below the top paper facing away from the oncoming sprayer (back) (Figure 1). Following each application, WSP were immediately collected, placed in labeled plastic bags, and stored in a climate-controlled area until analysis.
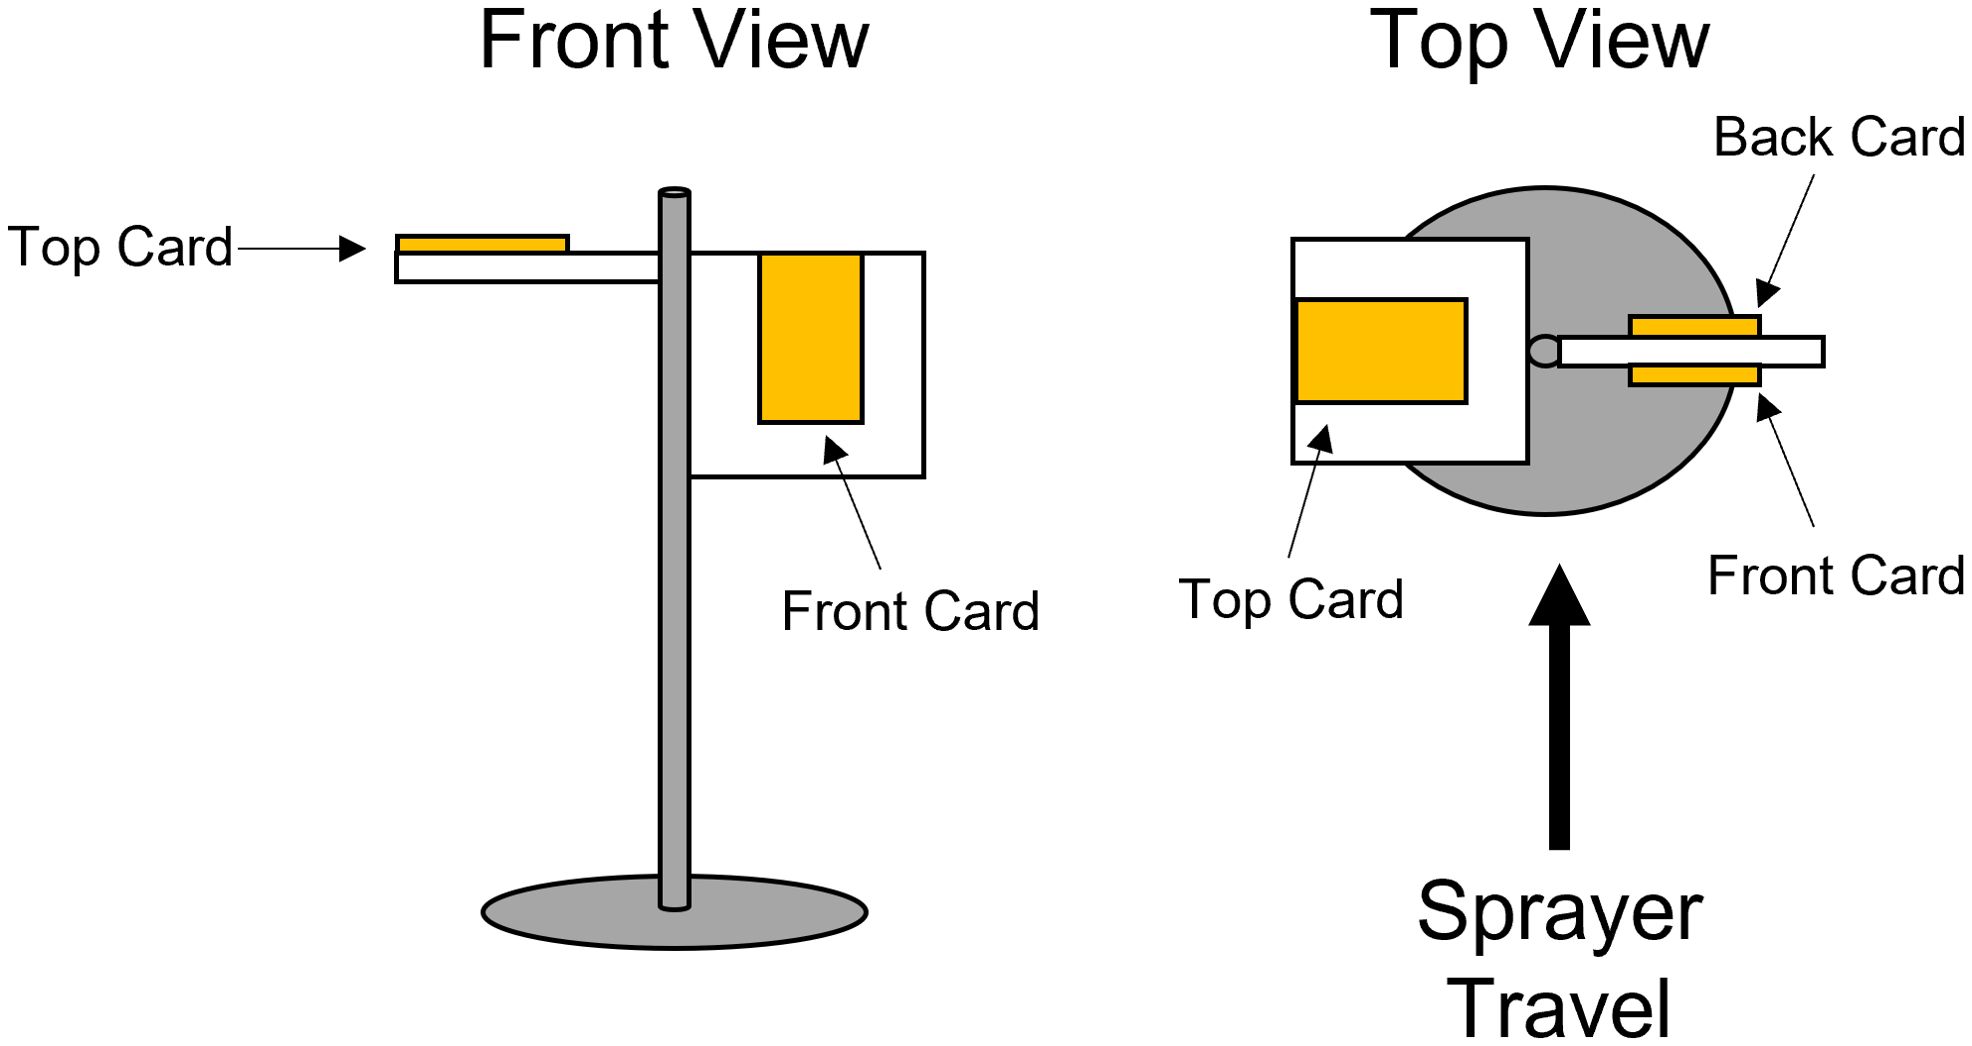
Figure 1. Diagram illustrating the collection stands and water-sensitive paper orientation for spray coverage data collection.
The WSP were subsequently analyzed using DepositScan (USDA-ARS, Application Technology Research Unit, Wooster, OH, USA) for the aforementioned response variables (Zhu et al., 2011). DepositScan analyzes the images of the scanned WSP and determines the number of individual spots along with their areas from a selected area within the image. The cumulative droplet distribution required to determine Dv0.5 and amount of spray deposits per unit area is calculated from the droplet diameters associated with each individual spot using a pre-determined spread factor specific to water and WSP. While the validity of spray volume deposits determined from WSP can be questioned due to the reliability of the spread factor method used, as water alone was the spray solution and all WSP across treatments were processed using the same spread factor, comparisons between the relative deposits are valid (Hoffmann and Hewitt, 2005). In addition to assessing the coverage and deposits individually at each WSP location, the three papers from each collection stand were summed to provide one holistic, three-dimensional measurement with five replications. These response variables were termed total coverage and total deposits.
Once extracted from DepositScan, data were statistically analyzed with analysis of variance using SAS v9.4 (SAS Institute, Cary, NC, USA) and the GLIMMIX procedure. Application setup, nozzle type, and WSP location were considered fixed effects for spray coverage, deposits, and Dv0.5. Application setup and nozzle type were considered fixed effects for total coverage, total deposits, and estimated recovery rate. Spray coverage, total coverage, and estimated recovery rate were analyzed using a beta distribution as data were bound between 0 and 1 (prior to conversion to a percentage for presentation) (Gbur et al., 2012; Stroup, 2012). Deposits, total deposits, and Dv0.5 were analyzed using a gamma distribution as data were bound between 0 and positive infinity. Means were separated using Tukey’s Honestly Significant Difference at α=0.10.
Droplet size data from both laboratory and WSP analyses were further compared using linear regressions. The WSP Dv0.5 was divided by the laboratory measured Dv0.5 for each nozzle type to provide a percentage WSP deposited Dv0.5. This value was then regressed over the WSP Dv0.5 to identify relationships between the sprayed droplet distribution and the distribution that deposited on WSP. Linear models were established using Microsoft Excel version 2108 (Microsoft Office LTSC Professional Plus 2021, Microsoft Corporation, Redmond, WA, USA).
All droplet distribution response variables, Dv0.1, Dv0.5, Dv0.9, RS, and %<200, were affected by nozzle type (P<0.0001, Table 2). The Dv0.1 response variable increased as a result of nozzle type in the order of: XR < 3D < ULD < AIXR < TADF < AITTJ60. Additionally, the %<200 variable resulted in the exact inverse relationship. Nozzle type influenced the Dv0.5 in a similar trend as the Dv0.1, except the TADF resulted in a greater diameter than the AITTJ60. The Dv0.9 followed a similar trend as the Dv0.5 except the ULD and AIXR switched order, and the XR and 3D produced similar Dv0.9. The RS variable increased in the order of: AITTJ60 ≤ AIXR ≤ TADF = 3D < XR < ULD. This indicates that the AITTJ60 produced the most homogenous droplet distribution of the nozzles evaluated, while the ULD produced the most heterogenous droplet distribution. Overall, the measured droplet size distributions resulted in spray classifications ranging from a Fine (XR) up to an Extremely Coarse (AITTJ60 and TADF).
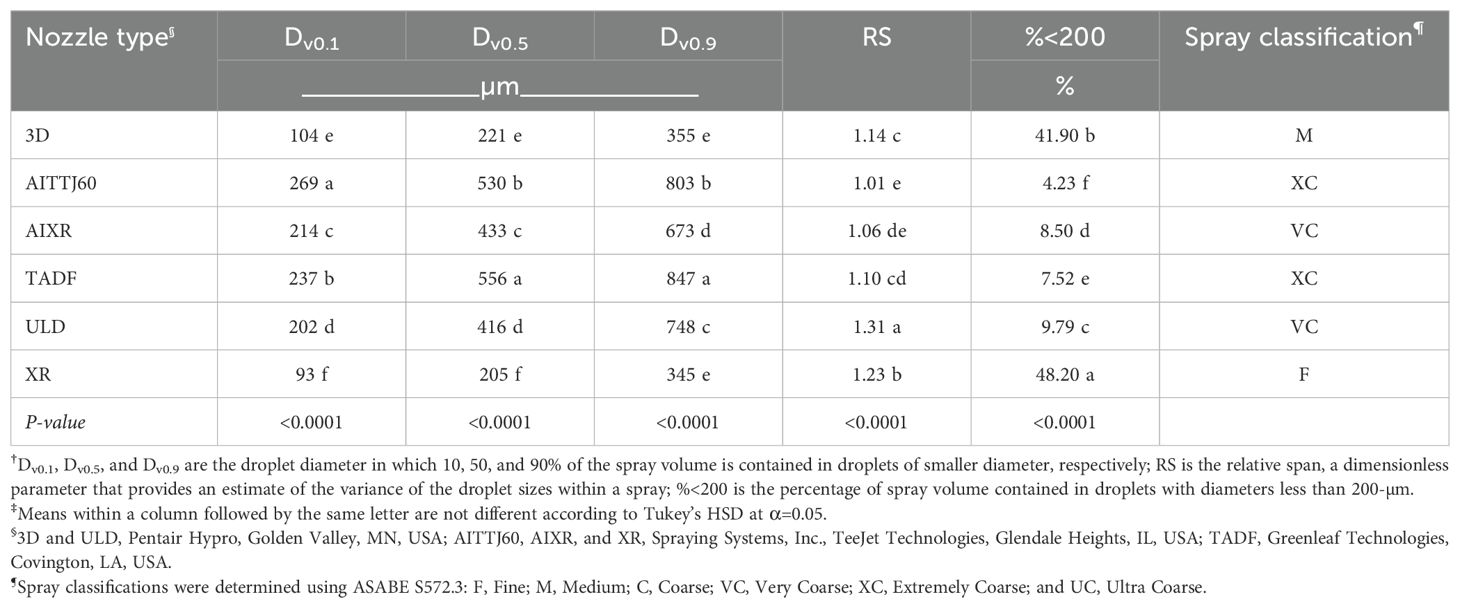
Table 2. Spray droplet size results from laboratory wind tunnel testing of six nozzle types using water alone†‡.
These results demonstrate the range of nozzle types evaluated in this research provided a wide magnitude of droplet sizes, spray classifications, spray dynamics, and drift potential. As previous literature has discussed the impact of droplet size on pesticide coverage (Knoche, 1994; Matthews et al., 2014), the wide range of droplet characteristics emitted from the tested nozzle types provided an effective, diverse evaluation of spray characteristics on RPAAS spray coverage. Additionally, previous research determined that spray formulation influences atomization (Miller and Butler Ellis, 2000); however, herbicide active ingredient was identified as having less of an effect on overall spray droplet size than nozzle type and operating pressure (Creech et al., 2015). Although the addition of a herbicide to the spray solution here would have likely altered the exact droplet size results, the relative comparisons between treatments expressed in this research would still be viable.
It should be noted, however, that the presented, laboratory-measured droplet size data may not fully represent true droplet sizes emitted from a RPAAS system that includes rotor and airwash effects (Fritz and Butts, 2024), and as such, should only be considered an estimate of each nozzle type’s general influence on droplet size distributions from an RPAAS. Further research is needed to specifically characterize the RPAAS dynamics and rotor wash effects on resulting droplet size distributions.
A significant three-way interaction between application setup, nozzle type, and WSP location occurred for spray coverage (P=0.0009), deposits (P<0.0001), and Dv0.5 (P=0.0002). However, due to the complexity of presenting and discussing this three-way interaction to provide meaningful takeaways, data were reanalyzed within WSP locations. This analysis resulted in a significant (α=0.1) two-way interaction between application setup and nozzle type for spray coverage, deposits, Dv0.5, and estimated recovery rate (top WSP only) across all WSP locations excluding the Dv0.5 measured on the front WSP (Table 3).

Table 3. P-values from the analysis of variance conducted within water sensitive paper (WSP) locations for spray coverage, deposits, and Dv0.5†.
On the top, horizontally oriented WSP, the greatest coverage (20.5%) was obtained from an application with the ground equipment at 93.5 L ha-1 using an XR nozzle (Table 4). This is likely due to a combination of the smallest droplet size of the nozzles tested (Tables 2, 4), greatest spray volume, and close proximity to the target of the spray when emitted from the ground sprayer. However, several treatments were statistically equivalent including three of the seven RPAAS at 46.8 L ha-1 treatments (3D-Forward, AITTJ60, and AIXR nozzles) (Table 4). Additionally, across all nozzles tested excluding the XR, coverage from the RPAAS at 46.8 L ha-1 was similar to that of the ground equipment applied using 93.5 L ha-1. Despite a few instances of similar coverage obtained from the RPAAS at 18.7 L ha-1 with the ground spray equipment, coverage was never greater than 4.5% regardless of nozzle used. Overall, for the ground spray equipment, coverage was greatest numerically from nozzle types in the order of XR > 3D-alternating > 3D-forward > AITTJ60 > TADF > ULD > AIXR, while coverage from nozzles equipped on the RPAAS equipment was generally greatest numerically in the order of AIXR > AITTJ60 > 3D-forward > 3D-alternating > TADF > XR > ULD. This result illustrates that spray dynamics are vastly different between RPAAS and ground spray systems, and subsequent nozzle selection decisions will require specific testing with RPAAS as recommendations from ground equipment may not be applicable.
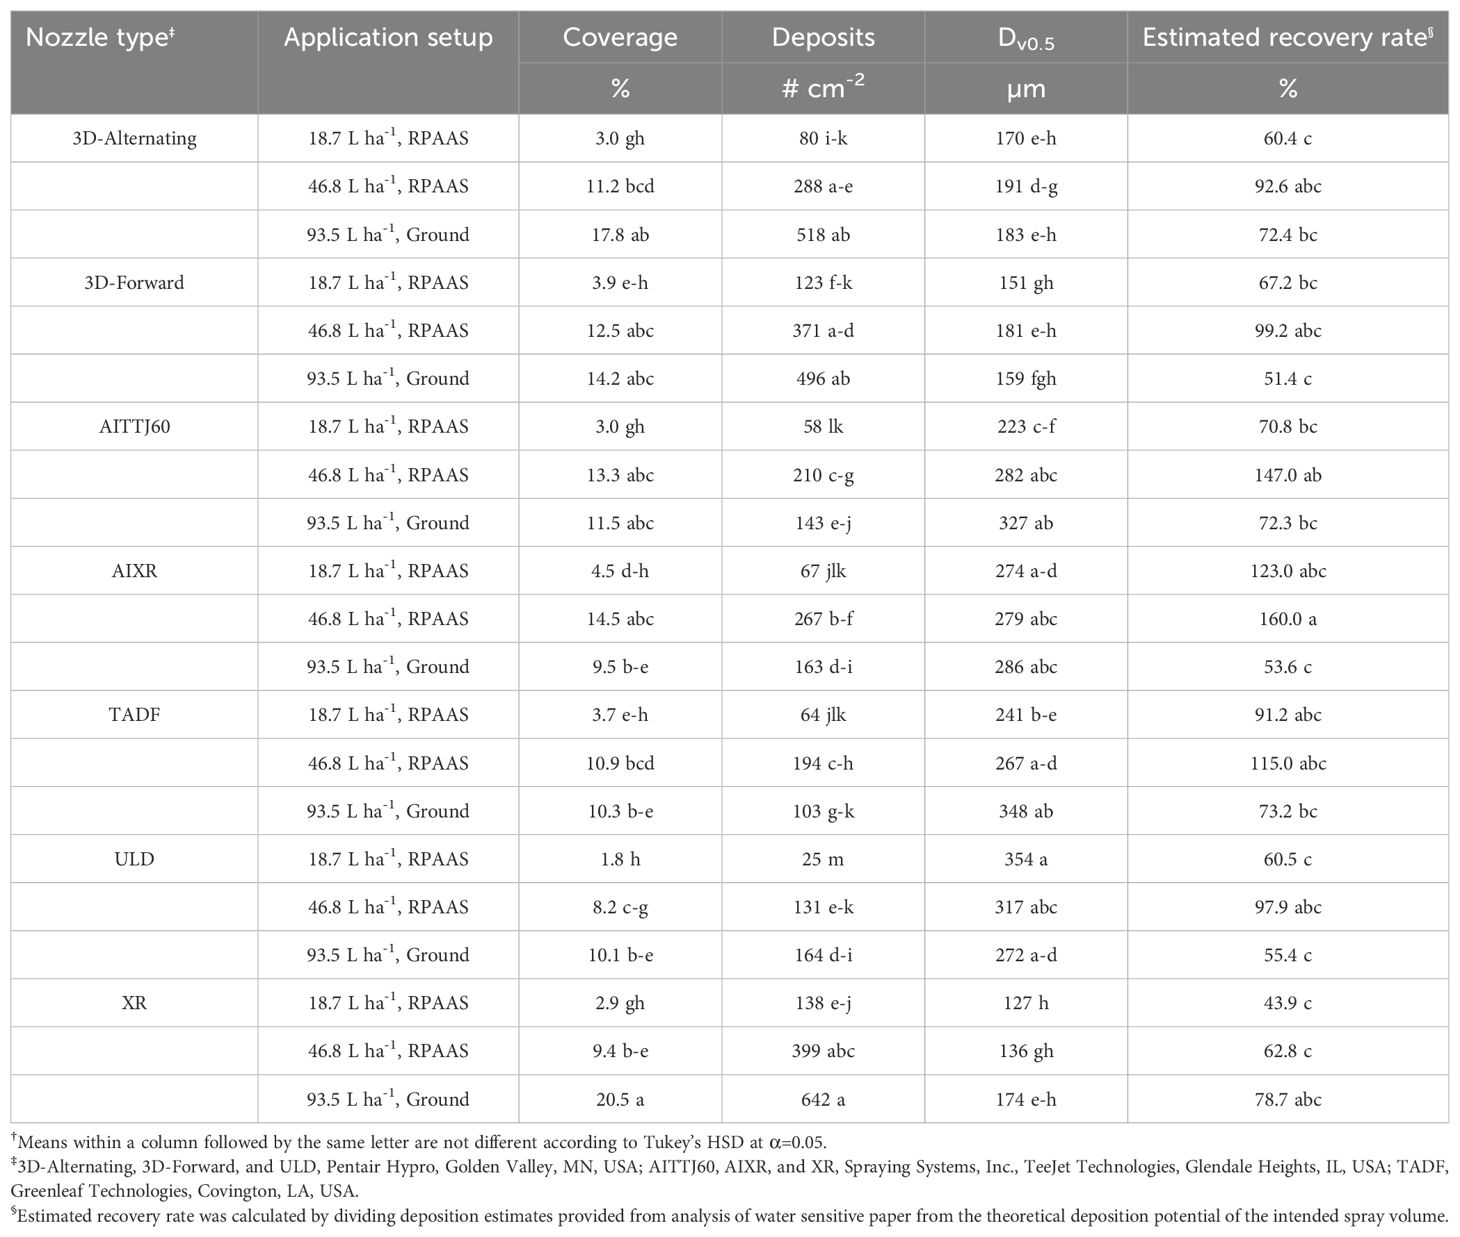
Table 4. Spray coverage (%), deposits (# cm-2), and Dv0.5 (µm) measured on the top (horizontal) water sensitive paper from applications occurring by a remotely piloted aerial application system (RPAAS) at 18.7 and 46.8 L ha-1, and ground spray equipment at 93.5 L ha-1 across seven nozzle types or arrangements†.
Deposits measured from the top WSP followed a similar trend across treatments to that of the measured coverage with the greatest number of deposits cm-2 (642) observed on WSP from the ground equipment at 93.5 L ha-1 using the XR nozzle (Table 4). However, the RPAAS at 46.8 L ha-1 resulted in equivalent deposits on the top WSP as the ground equipment at 93.5 L ha-1 across all nozzles tested. The RPAAS at 18.7 L ha-1 again lagged behind the other application setups with five of the seven nozzle types tested resulting in less than or equal to 80 deposits cm-2. Despite a similar trend emerging for deposits and coverage from a result of application setups, no clear trend emerged for nozzle selection between coverage and deposits. For the ground spray equipment, nozzle type generally resulted in the greatest deposits numerically on WSP in the order of the XR > 3D-alternating > 3D-forward > ULD > AIXR > AITTJ60 > TADF. The three top nozzles (XR, 3D-alternating, and 3D-forward) remained consistent between coverage and deposits response variables; however, the other nozzles did not remain in the same order. As a result, coverage and deposits from ground equipment was likely more a result of droplet size (Tables 2, 4) than other nozzle selection criteria such as dual-fan versus single-fan. In contrast, nozzle types equipped on RPAAS generally resulted in the greatest deposits numerically in the order of XR > 3D-forward > 3D-alternating > AIXR > AITTJ60 > TADF > ULD. There was minimal overlap between coverage and deposits regarding the order of nozzle types indicating spray coverage and droplet deposition dynamics from RPAAS are much more complex than standard ground applications (again highlighting the complexity of nozzle selection for RPAAS operators).
In addition to coverage and deposits on the top card, estimated recovery rate (% deposition determined from WSP divided by the theoretical, intended application rate) was calculated to provide a measure of spray deposition efficiency (Table 4). Overall, the lowest estimated recovery rate (43.9%) occurred from the XR nozzle equipped on the RPAAS operated at 18.7 L ha-1. However, the three greatest estimated recovery rate amounts occurred from the RPAAS operated at 46.8 L ha-1 with the AIXR (160%), AITTJ60 (147%), and TADF (115%) nozzle types. Excluding the XR nozzle, the RPAAS at 46.8 L ha-1 resulted in greater estimated recovery rate than the ground spray equipment for each nozzle type evaluated indicating this application setup was highly efficient at depositing spray on the target directly beneath the RPAAS flight line. Furthermore, for the 3D-forward, AIXR, and TADF nozzles, the RPAAS at 18.7 L ha-1 provided at least 15 percentage points greater estimated recovery rate amounts numerically than the ground spray equipment. This increased deposition efficiency may help to explain why previous research has observed positive pesticide efficacy in low spray volumes with RPAAS systems (Qin et al., 2016; Meng et al., 2019; Delavarpour et al., 2023; Huang et al., 2023). However, it should be noted that this may be due to a “funneling” effect in the spray swath pattern observed with RPAAS depositing greater spray directly under the flight line in an in-wind flight path (Yallapa et al., 2023). Further research is needed to evaluate resulting spray swath widths across nozzle types as well as the influence that ambient wind speed and direction has on this deposition efficiency across an entire spray swath (Bonds et al., 2023).
Similar patterns emerged for coverage and deposits on the back (Table 5) and front (Table 6) WSP as the previously discussed top WSP. The RPAAS at 18.7 L ha-1 again resulted in reduced coverage and deposits across the nozzle types evaluated compared to the other application setups. Coverage from the RPAAS at 18.7 L ha-1 treatment never exceeded 4.4 and 1.1% on the back and front WSP, respectively, and deposits never exceeded 198 and 22 cm-2, respectively (Tables 5, 6). The RPAAS at 46.8 L ha-1 provided similar or greater coverage as the ground equipment at 93.5 L ha-1 on the back WSP across six of the seven nozzle types evaluated (Table 5), but only two of the seven nozzle types evaluated on the front WSP (Table 6). For deposits, the RPAAS at 46.8 L ha-1 maintained or increased the number of droplets deposited compared to the ground equipment at 93.5 L ha-1 on the back WSP across all seven nozzle types evaluated (Table 5), and six of the seven nozzle types evaluated on the front WSP (Table 6). Furthermore, minimal consistencies emerged once again regarding an optimum nozzle selection for the RPAAS that maximized both coverage and deposition across the spray volumes utilized, while the XR and 3D-alternating nozzle selections were the consensus leaders for optimizing coverage and deposits from the ground spray equipment. Future research should evaluate pesticidal efficacy from these various nozzle types equipped on an RPAAS to better determine an optimum nozzle selection recommendation. Additionally, further research should explore any connections between spray coverage and deposits on the additional WSP locations (front and back) with the resulting pesticidal efficacy to determine if there is an additional benefit to understanding the holistic spray deposition dynamics.
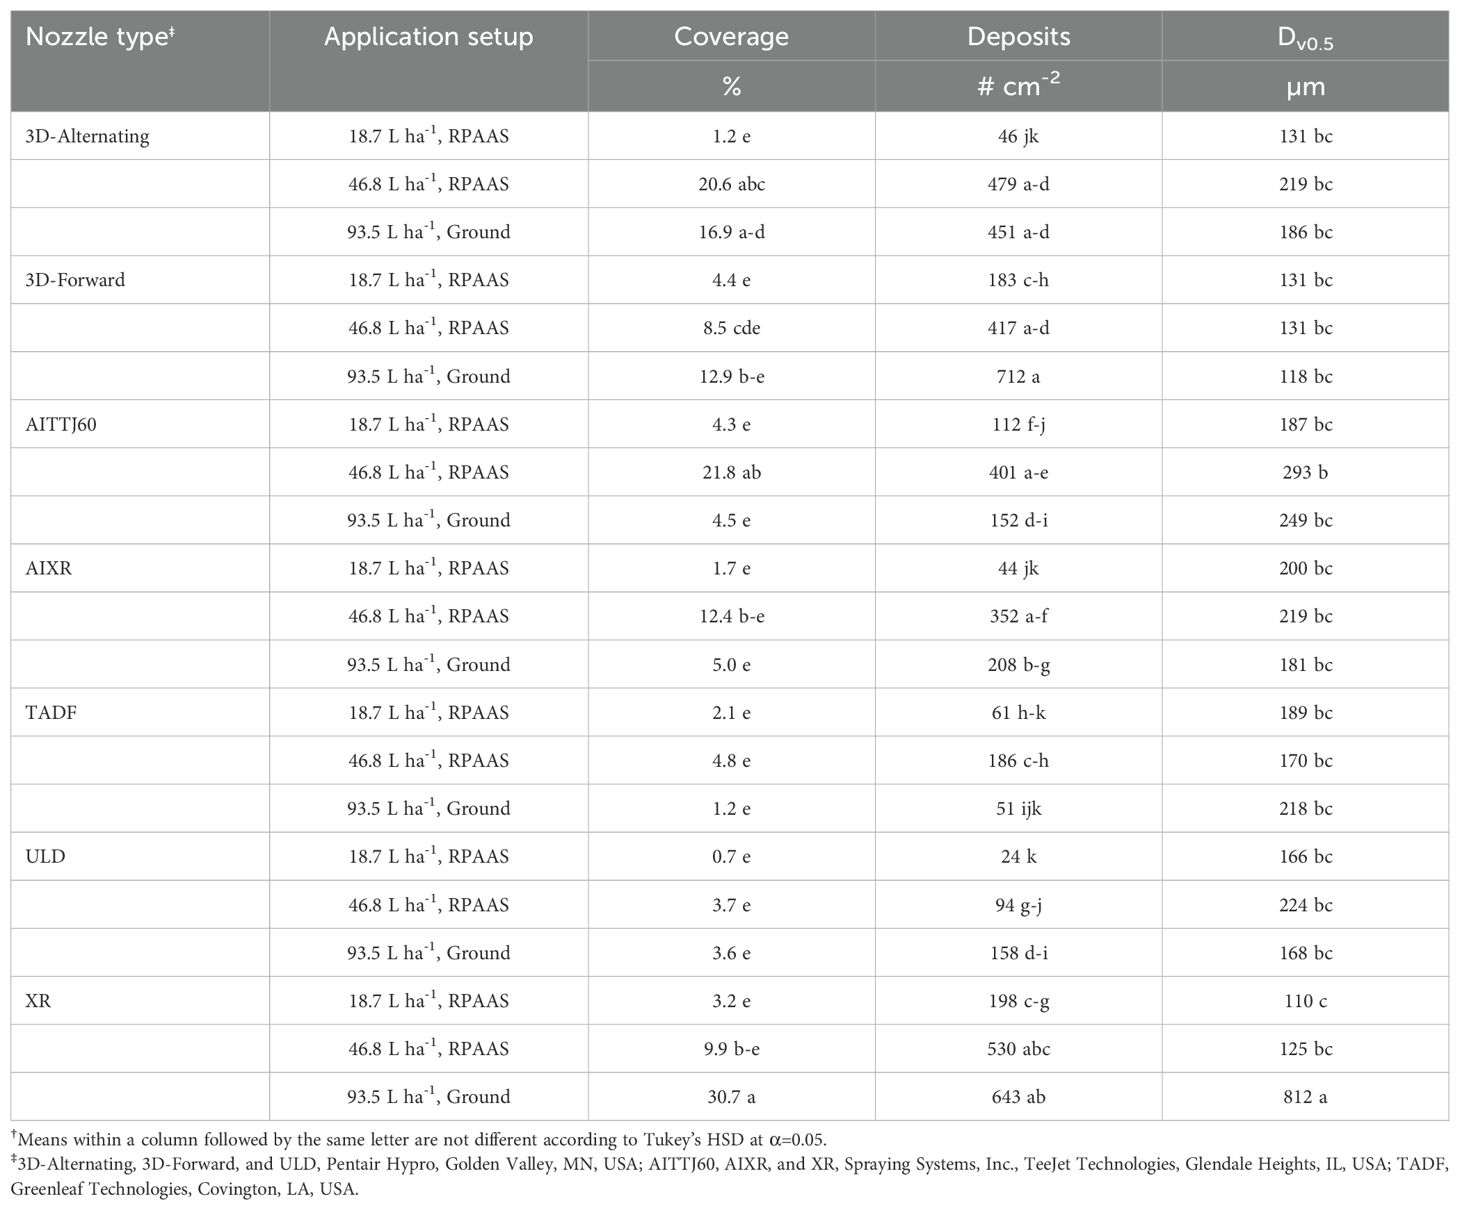
Table 5. Spray coverage (%), deposits (# cm-2), and Dv0.5 (µm) measured on the back (vertical) water sensitive paper from applications occurring by a remotely piloted aerial application system (RPAAS) at 18.7 and 46.8 L ha-1, and ground spray equipment at 93.5 L ha-1 across seven nozzle types or arrangements†.
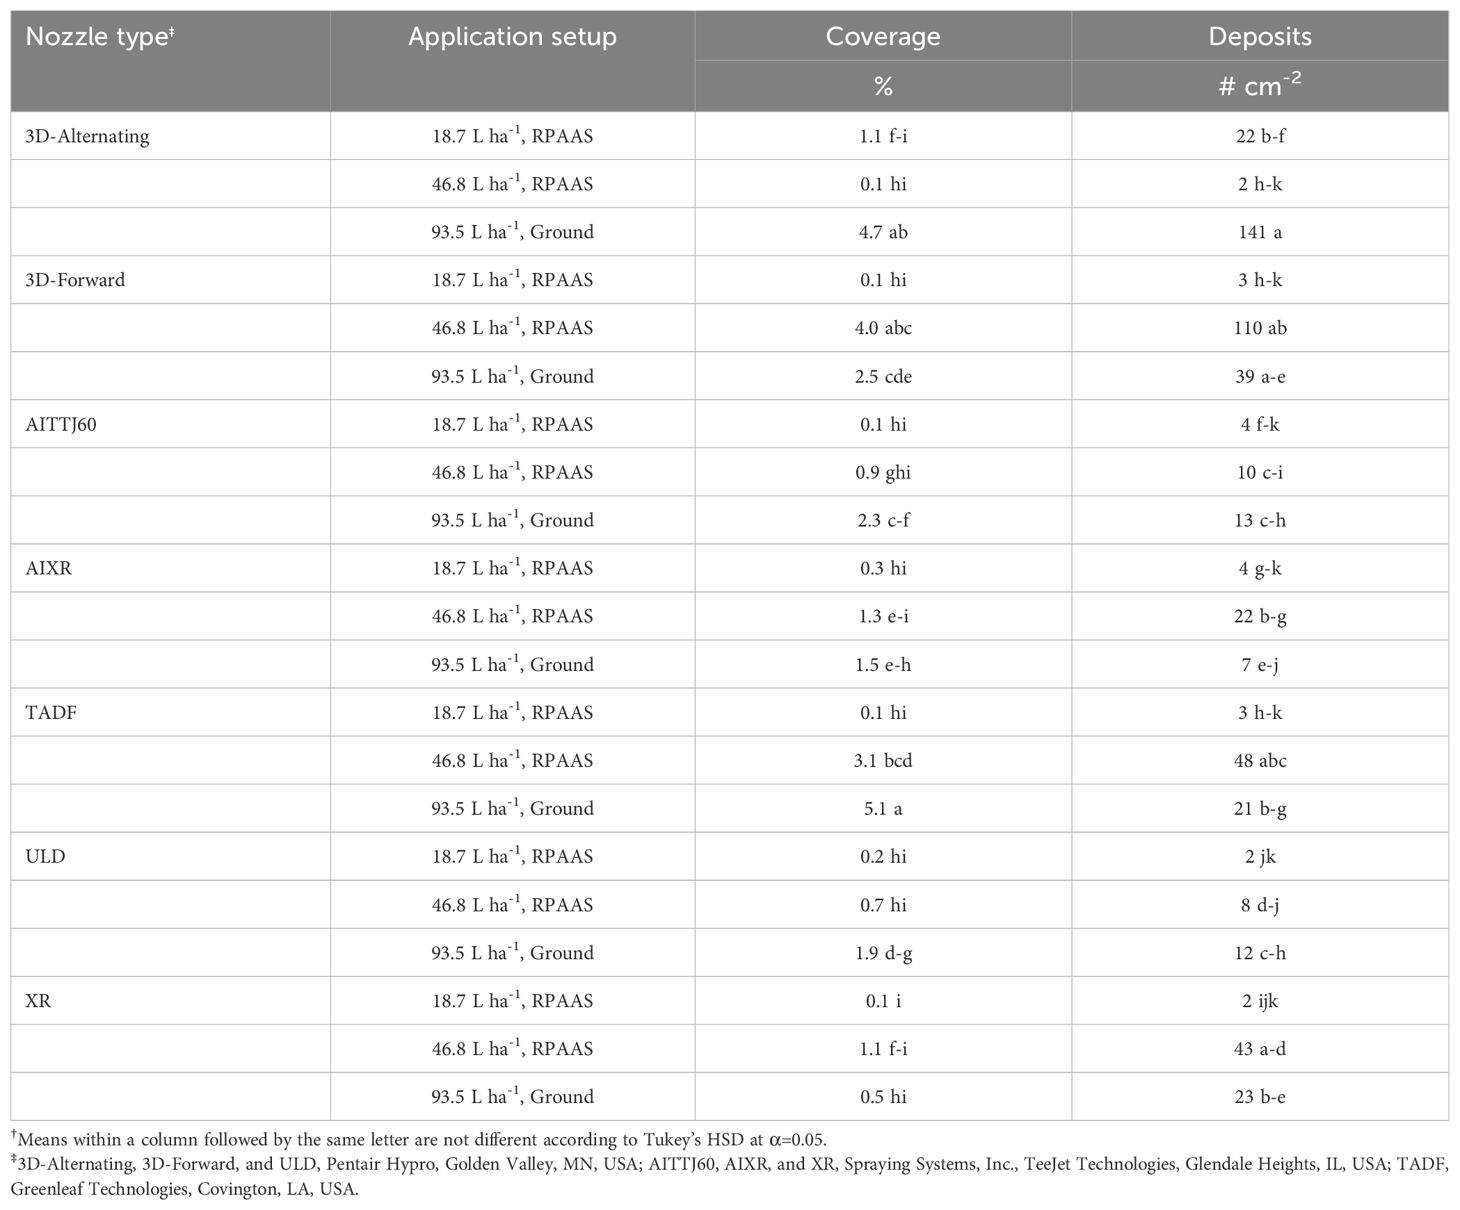
Table 6. Spray coverage (%) and deposits (# cm-2) measured on the front (vertical) water sensitive paper from applications occurring by a remotely piloted aerial application system (RPAAS) at 18.7 and 46.8 L ha-1, and ground spray equipment at 93.5 L ha-1 across seven nozzle types or arrangements†.
Although WSP locations were not compared statistically, a brief discussion regarding coverage and deposits across their respective collection locations should occur. Generally, coverage was greatest across treatment factors in the order of the top, back, and front WSP, respectively, while deposits were greatest in the order of the back, top, and front WSP, respectively (Tables 4–6). Previous research has indicated that greater droplet retention can occur, particularly with smaller droplets, on vertical surfaces compared to horizontal surfaces aiding in explaining greater deposits on the back WSP compared to the top WSP (Lake, 1977). However, larger droplets with increased spreading potential, and thereby the ability to enhance coverage measurements, are more apt to deposit on horizontal surfaces (Lake, 1977; Thacker and Hall, 1991). A particularly interesting note for both response variables was that the back WSP (facing away from the direction of the sprayer) resulted in increased coverage and deposits compared to the front WSP (facing towards the direction of the sprayer). Only 1 of 21 nozzle type and application setup combinations had increased coverage on the front WSP compared to the back WSP, while 0 of 21 combinations resulted in increased deposits. Although the downwash from the RPAAS rotors may partially aid in the explanation of this result (Zhan et al., 2022; Delavarpour et al., 2023), since the result was also observed for nearly all of the ground equipment treatments, this may be more of an indication of the influence environmental factors, e.g. wind speed and direction, play in resulting spray dynamics. All applications for this research were made in one direction, heading directly into a 12 km hr-1 average wind speed. It is hypothesized the force of the wind was a more influential factor on the emitted droplets than the effect of the forward travel of sprayers which resulted in more accumulation on the back WSP.
The Dv0.5 measured from WSP provides an estimate of the average droplet size depositing onto the target in contrast to the measured entire droplet size distribution that was characterized using the laboratory laser diffraction techniques. Overall, the WSP Dv0.5 was smaller for each nozzle type and application setup combination compared to the laser diffraction measured Dv0.5 excluding two TADF treatments on the top WSP and one XR treatment on the back WSP (Tables 2, 4, 5). However, the XR Dv0.5 on the back WSP was likely a false result due to overspreading and overlapping of droplets as coverage exceeded 30%. Previous research has indicated WSP validity and accuracy decreases in excess of 17% coverage (Cunha et al., 2012).
On the top WSP, the Dv0.5 was relatively unaffected by the application setup with the only difference occurring when using the AITTJ60 nozzle on the RPAAS at 18.7 L ha-1 (223 µm) compared to the ground equipment at 93.5 L ha-1 (327 µm) (Table 4). Generally, the deposited Dv0.5 increased across nozzle types in the order of XR < 3D-forward < 3D-alternating < AITTJ60 < AIXR < TADF < ULD. The deposited Dv0.5 on the back WSP was completely unaffected across nozzle type and application setup combinations except for the aforementioned XR nozzle difference which was likely the result of WSP software measurement limitations. This result also supports the aforementioned hypothesis that wind speed and direction impacted droplet deposition to a greater extent than direction of sprayer travel. As the constant 12 km hr-1 wind speed and direction would move similar sized droplets regardless of application setup and nozzle type combination, it is logical that similar droplet sizes would land and be measured on the back WSP.
The Dv0.5 on the front WSP was unaffected by the application setup and nozzle type interaction, but the main effects of nozzle type (P<0.0001) and application setup (P=0.0004) were significant (Table 3). The AIXR and ULD nozzles resulted in a greater Dv0.5 of droplets depositing on the front WSP compared to the 3D-alternating and XR nozzles when pooled over application setup (Table 7). Additionally, the TADF nozzle had a greater Dv0.5 of droplets that deposited on the front WSP compared to the XR nozzle. When pooled over nozzle type, the deposited Dv0.5 on the front WSP was greater for the ground equipment at 93.5 L ha-1 compared to either RPAAS application setup. Reduced droplet sizes from RPAAS may be expected due to the rotor downwash creating a potential wind shear effect that results in smaller droplet size distributions (Fritz et al., 2014a); however, this effect may be more complex than originally estimated as some initial attempts at measuring droplet size with an upstream operational rotor resulted in an increase in spray droplet size compared to no operational rotor (Fritz and Butts, 2024). Regardless, more research is needed to fully characterize and understand droplet size distribution formation from RPAAS.
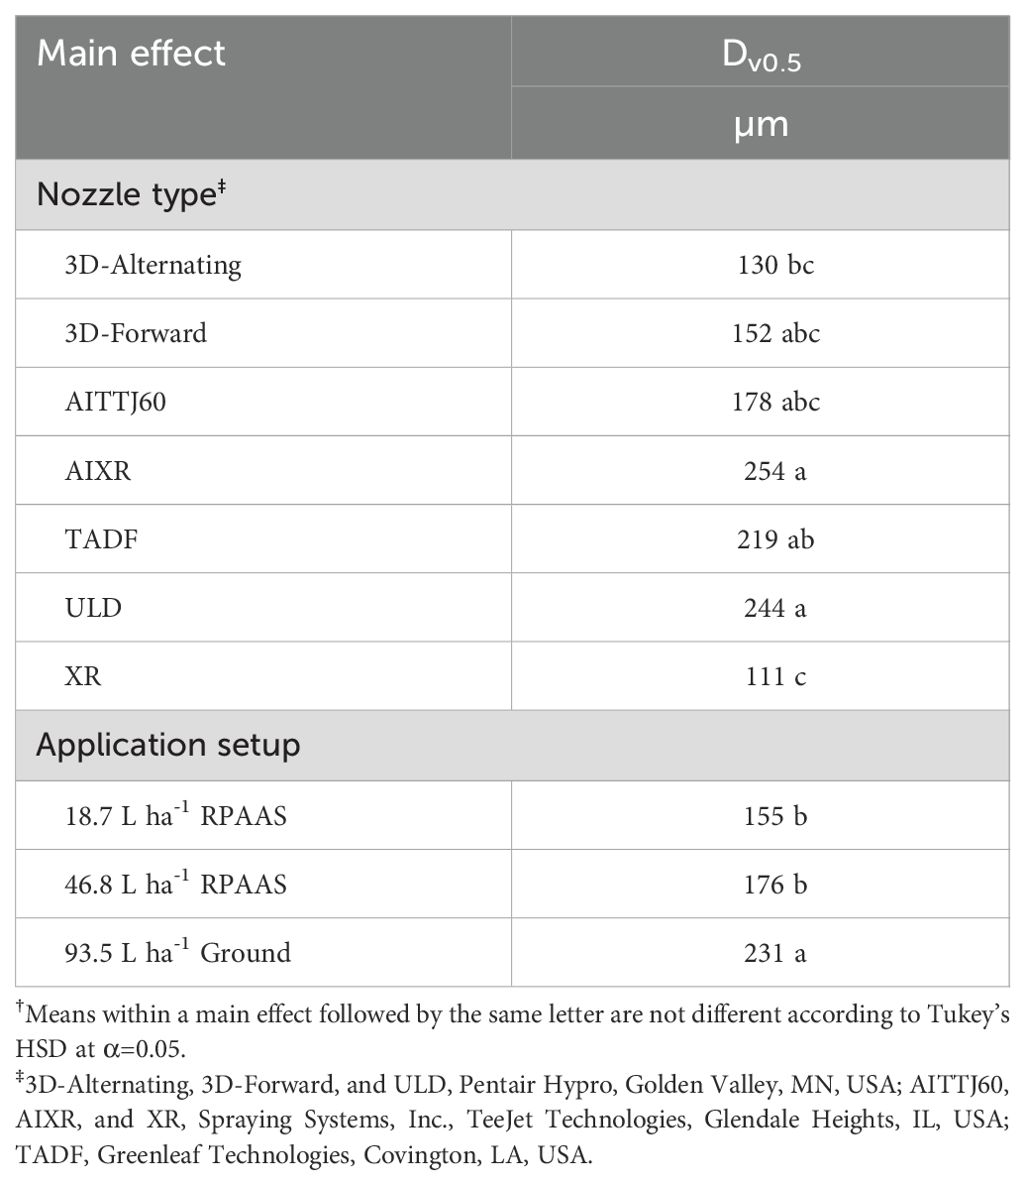
Table 7. Dv0.5 (µm) measured on the front (vertical) water sensitive paper as affected by the main effects of application setup [remotely piloted aerial application system (RPAAS) at 18.7 and 46.8 L ha-1, and ground spray equipment at 93.5 L ha-1] and nozzle type or arrangements†.
In addition to determining and understanding the Dv0.5 of deposited droplets on WSP, a relationship was evaluated between the measured WSP Dv0.5 and the standardized percentage of the WSP Dv0.5 divided by the laboratory measured Dv0.5 (Figure 2; Table 8). Results indicated best fit models for three distinct nozzle groupings: non-venturi (3D-alternating, 3D-forward, and XR), single-fan venturi (AIXR and ULD), and dual-fan venturi (AITTJ60 and TADF) with correlation coefficient values of 0.96, 0.99, and 0.99, respectively (Table 8). For all nozzle types and application setups evaluated, the WSP measured Dv0.5 was smaller than the laboratory measured Dv0.5 (Figure 2). The measured Dv0.5 as a percentage of the laboratory measurements ranged from approximately 60% to 85% for both non-venturi and single-fan venturi nozzle groupings, while for dual-fan venturi nozzles it ranged from approximately 40% to 65%. It is unclear where the larger droplets may have deposited that resulted in reduced Dv0.5 diameters on the WSP. As the trends were consistent within nozzle type groupings across application setups, it would indicate the influence of RPAAS versus ground application equipment did not play a role in which droplet diameters deposited on the cards. It may be an indication that the larger droplet diameters were not deposited directly in the center of the flight or drive path and instead were deposited on the outer margins of the nozzle spray patterns. Further research is needed with multiple sampling points across the spray swath to validate this hypothesis. Overall, these comparative Dv0.5 results provide a predictable relationship between WSP measured and laser diffraction laboratory measured Dv0.5 as a function of nozzle type design. This can be useful in future research projects to make predictions between laboratory and field measurements if only one data source is available to the researchers.
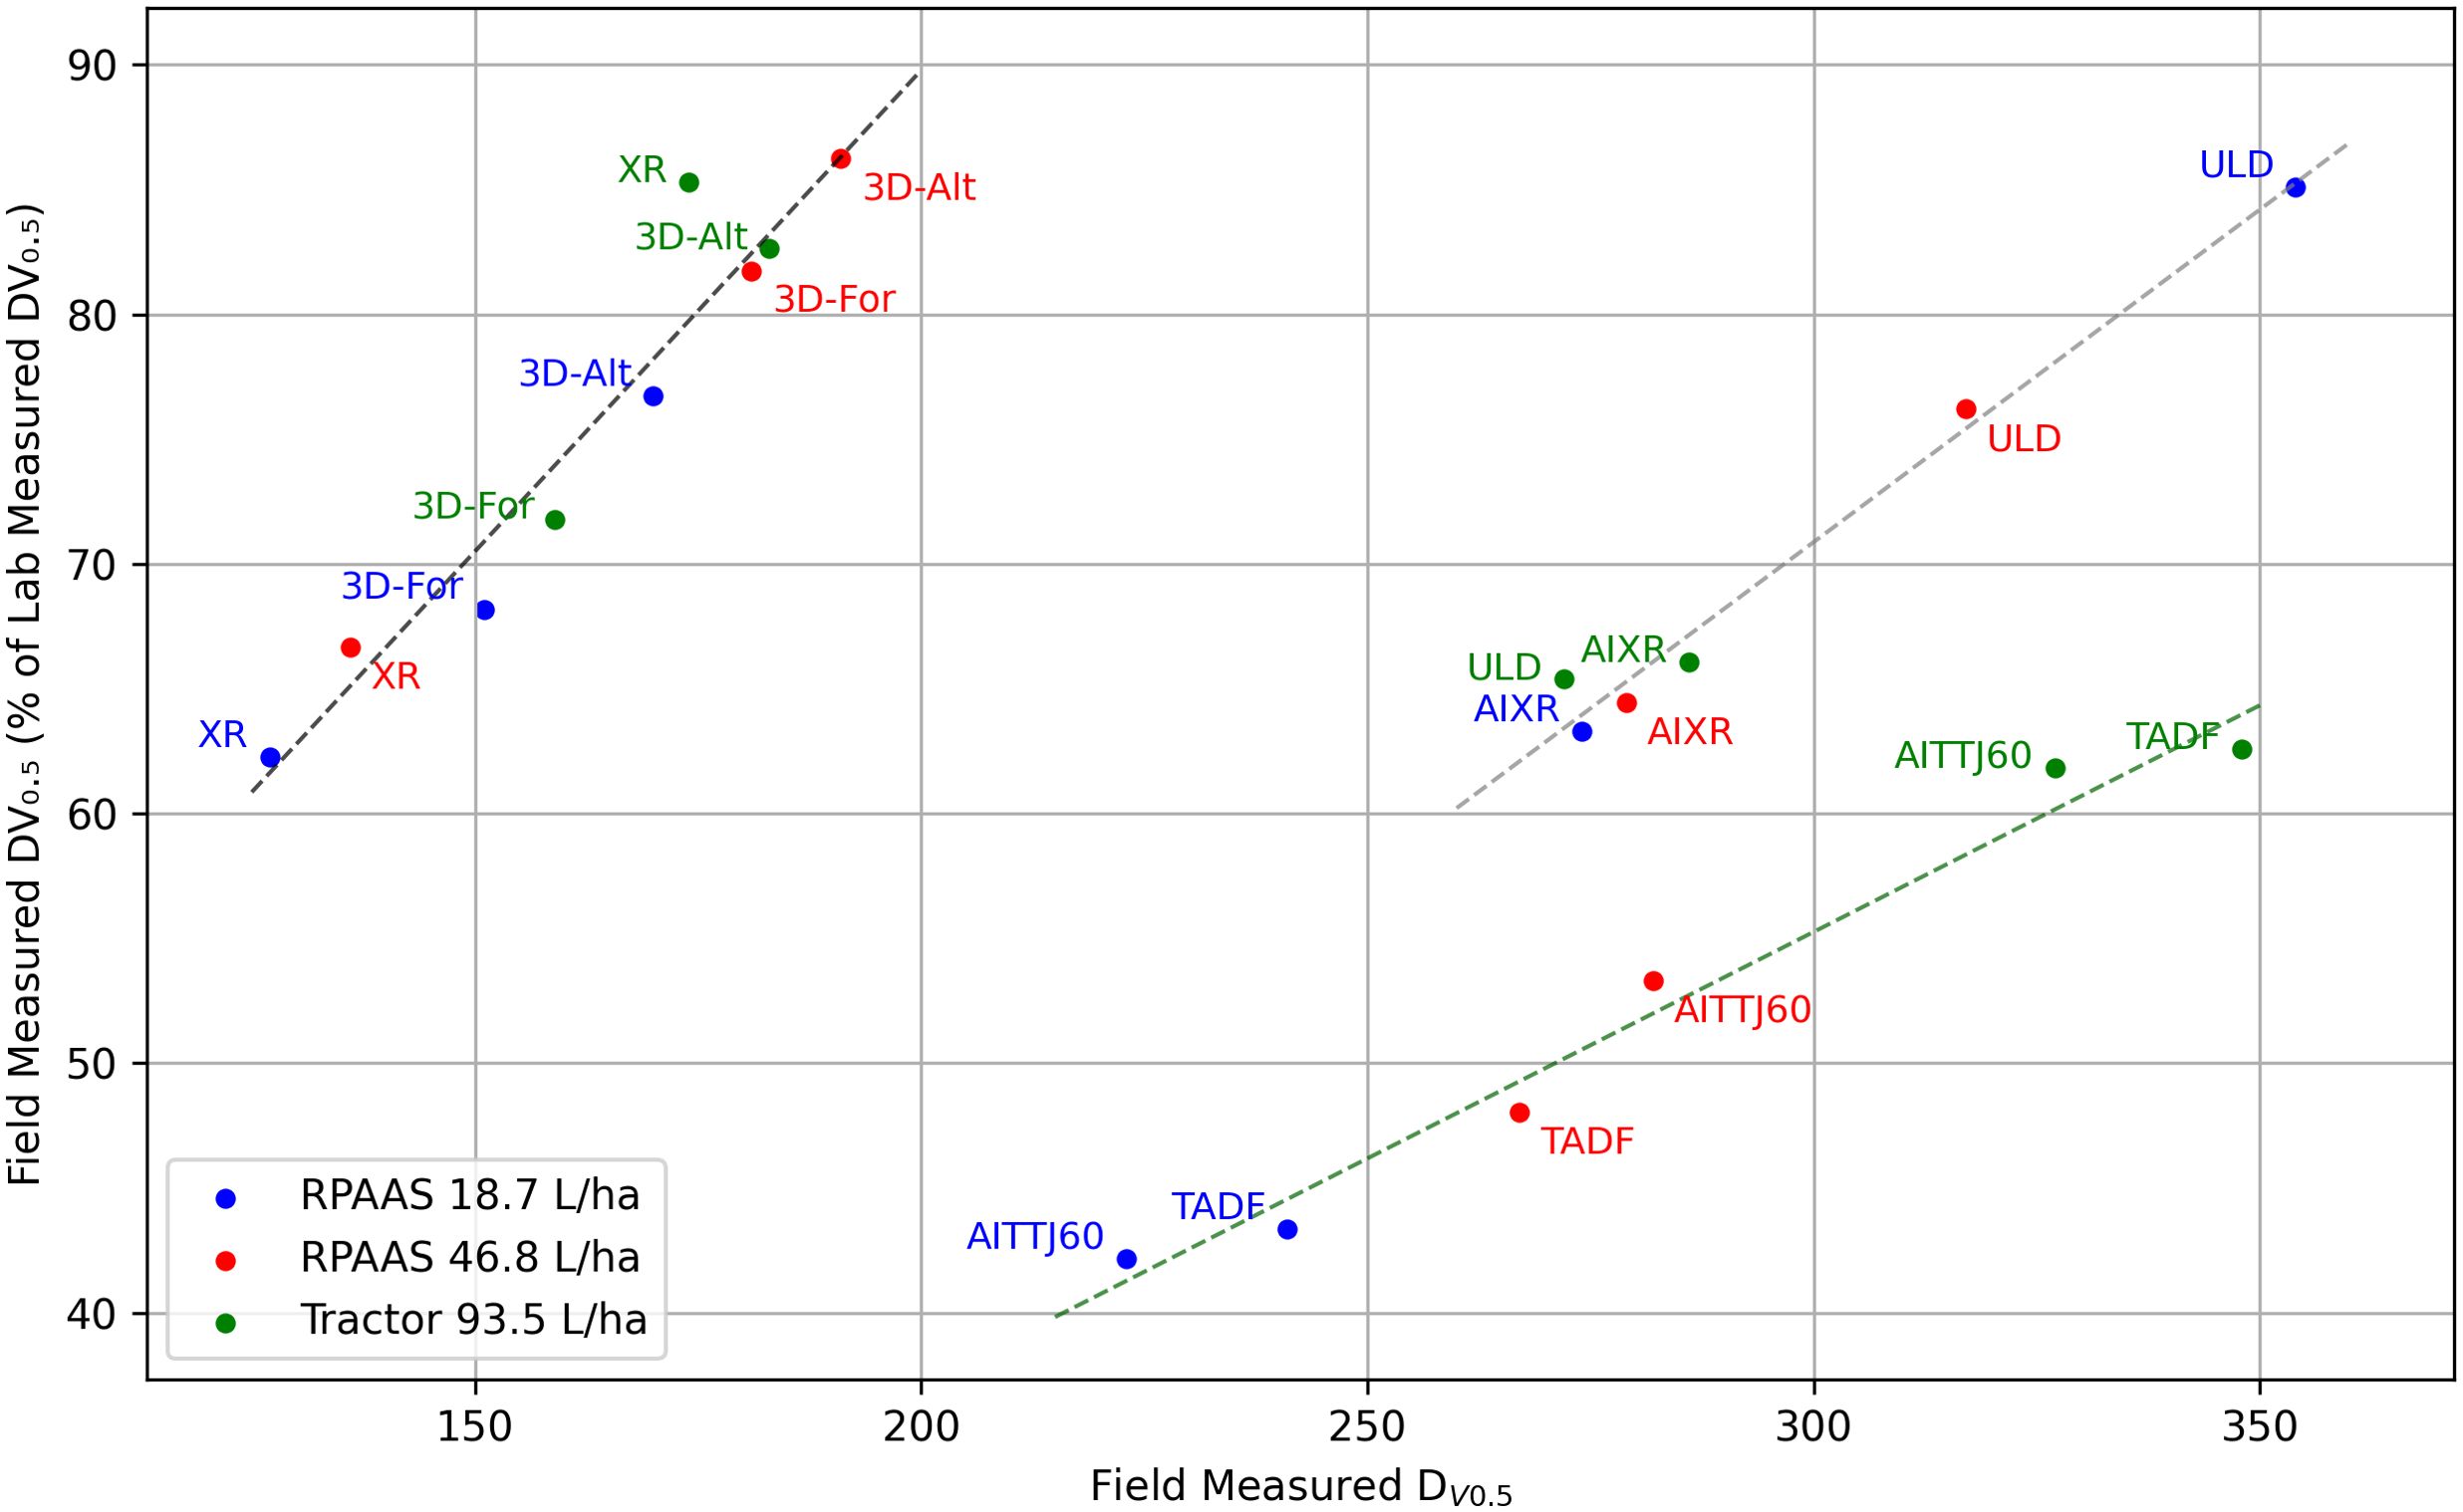
Figure 2. Relationship between Dv0.5 measured on the top water sensitive paper (WSP) and the WSP Dv0.5 expressed as a percentage of the laboratory measured Dv0.5. Linear regressions were fit for three nozzle groupings [Non-venturi (3D-Alternating, 3D-Forward, and XR; black dashed line), Single-fan venturi (AIXR and ULD; gray dashed line), and Dual-fan venturi (AITTJ60 and TADF; green dashed line)] across application setups.

Table 8. Linear regression coefficients (y=mx+b), correlation coefficients (r), and R2 values for the relationship between Dv0.5 measured on the top water sensitive paper (WSP) and the WSP Dv0.5 expressed as a percentage of the laboratory measured Dv0.5 averaged across application setups.
Following the summation of results from the three WSP locations to provide a measurement of holistic spray coverage and deposits, a significant application setup by nozzle type interaction occurred for both total coverage (P<0.0001) and total deposits (P<0.0001) (Figures 2, 3).
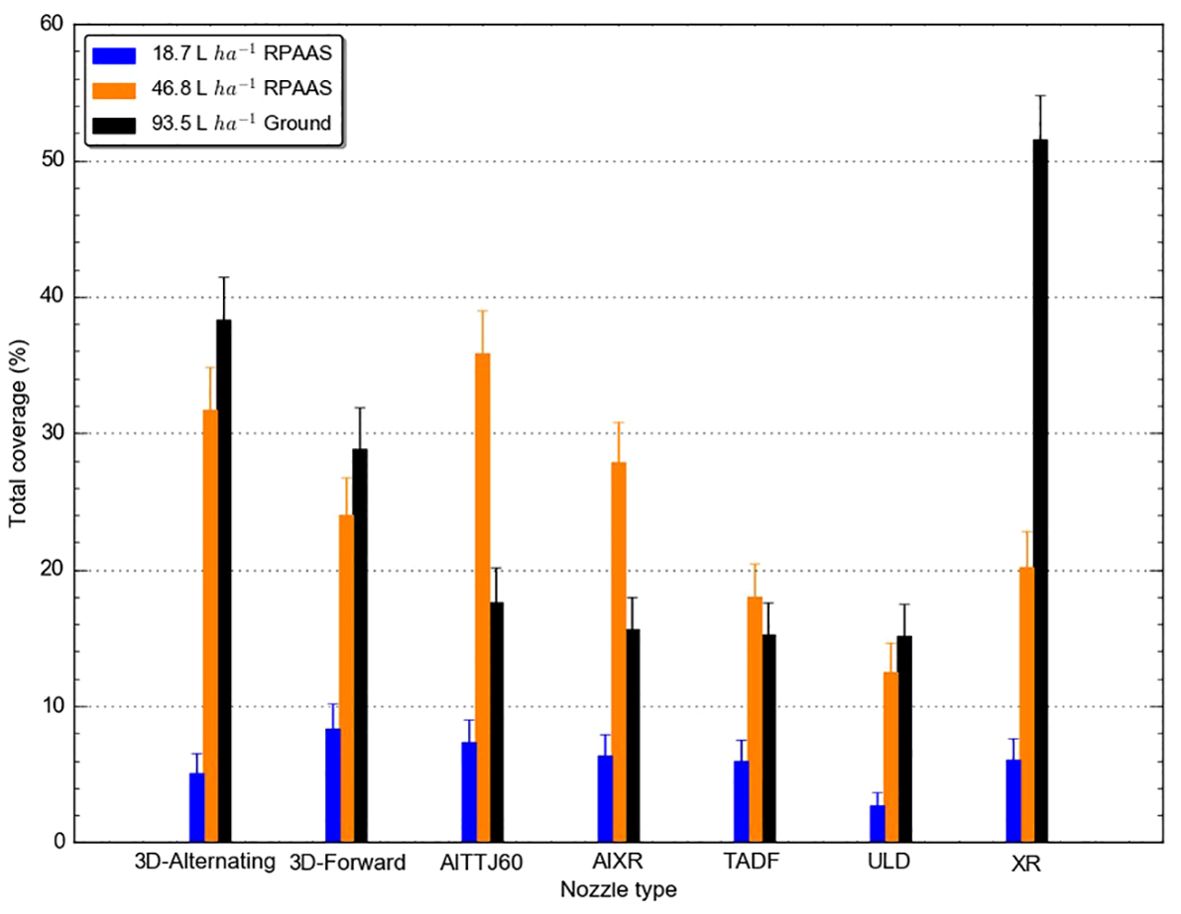
Figure 3. Total spray coverage (%) determined from water sensitive paper as impacted by seven nozzle types or arrangements across three application setups [remotely piloted aerial application systems (RPAAS) at 18.7 and 46.8 L ha-1, and ground spray equipment at 93.5 L ha-1].
The greatest total coverage (>50%) occurred from the ground equipment at 93.5 L ha-1 using an XR nozzle (Figure 3). However, 5 of the 8 nozzle type and application setup combinations that achieved at least 20% total coverage occurred from the RPAAS at 46.8 L ha-1. None of the nozzles equipped on the RPAAS applied using 18.7 L ha-1 provided greater than 8% total coverage. The total coverage results would indicate the XR, 3D-alternating, or 3D-forward nozzle types and the AITTJ60, 3D-alternating, or AIXR nozzle types would enhance total holistic coverage from the ground and RPAAS (46.8 L ha-1) equipment, respectively. When RPAAS was operated at 18.7 L ha-1, the nozzle effect on total coverage was greatly minimized, and any nozzle evaluated, excluding the ULD, could be used, albeit with reduced total coverage potential compared to the other application setups. This result is similar to previous RPAAS research that indicated droplet size had a greater impact on spray coverage when spray volume increased (Shan et al., 2021).
The greatest total deposits (nearly 1,400 cm-2) also occurred from the ground equipment at 93.5 L ha-1 using an XR nozzle (Figure 4). But similarly to the total coverage, 5 of the 8 treatments that provided the greatest total deposits (>600 cm-2) occurred from the RPAAS at 46.8 L ha-1. The RPAAS using 18.7 L ha-1 equipped with the 3D-forward, XR, and AITTJ60 nozzles was more effective for total deposits than total coverage as they provided equivalent or greater total deposits than the AITTJ60, ULD, and TADF equipped on the ground equipment at 93.5 L ha-1. Based on total deposits, the same nozzles (XR, 3D-forward, and 3D-alternating) from the aforementioned total coverage results would be recommended for use on ground spray equipment. However, the XR, 3D-forward, and 3D-alternating provided the greatest total deposits when operated on the RPAAS at 46.8 L ha-1. As a result, it may be advisable to use the 3D-forward nozzle type and arrangement on an RPAAS as it was a top 3 option for maximizing both total coverage and total deposits for both spray volumes. Additionally, the AITTJ60, AIXR, and TADF nozzles may be recommendable options for use on RPAAS systems, particularly at 46.8 L ha-1, as they improved both total coverage and total deposits compared to ground spray equipment at 93.5 L ha-1. Even further, these nozzle types may be optimum options for RPAAS use across different scenarios as they produced the greatest droplet sizes and spray classifications (Extremely Coarse, Very Coarse, and Extremely Coarse respectively) (Table 2), and as a result would reduce spray drift potential (Hunter et al., 2020a; Bonds et al., 2023; Martin et al., 2024).
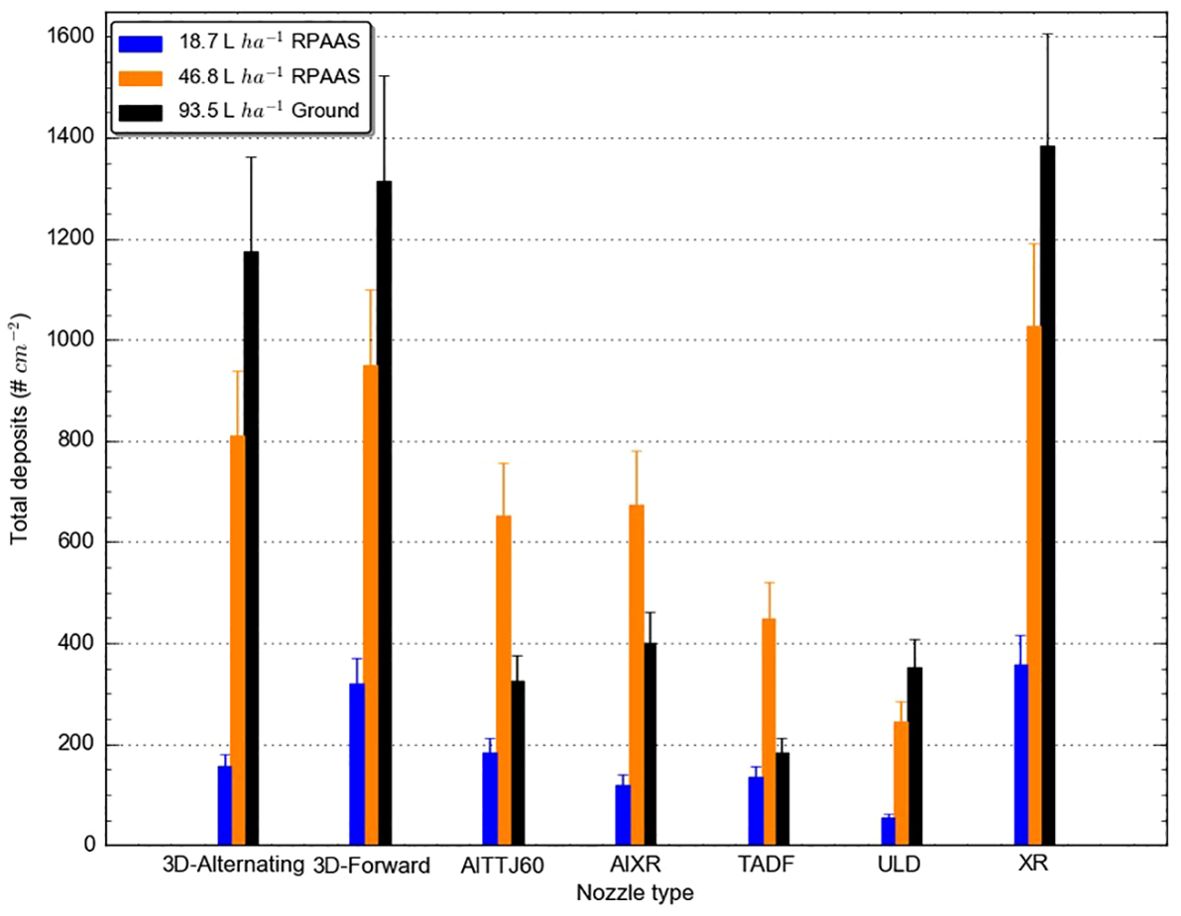
Figure 4. Total spray deposits (# cm-2) determined from water sensitive paper as impacted by seven nozzle types or arrangements across three application setups [remotely piloted aerial application systems (RPAAS) at 18.7 and 46.8 L ha-1, and ground spray equipment at 93.5 L ha-1].
The summation of these results indicates that there is a high potential for RPAAS applications, particularly at 46.8 L ha-1, to be successful as they consistently provided equivalent coverage and deposits compared to ground equipment at 93.5 L ha-1 across multiple tested nozzle types. The results of this current research corroborate previous RPAAS research that indicated greater spray volumes paired with coarser droplet producing nozzles enhanced deposition and pest control (Wang et al., 2019). Although promising results were obtained with a RPAAS at 46.8 L ha-1, the reduced coverage and deposits observed from a RPAAS at 18.7 L ha-1 is troubling as many commercial RPAAS operators are currently applying pesticides using 9.4 to 28.1 L ha-1 (T.R. Butts, personal observation). Additionally, this reduced spray volume of 18.7 L ha-1 is often below pesticide label mandated spray volumes resulting in illegal applications. This research did not evaluate pesticide efficacy; however, other research has identified that RPAAS with similar levels of deposition and coverage have been successful at managing insects (Qin et al., 2016; Huang et al., 2023), weeds (Hunter et al., 2020b), diseases (Wang et al., 2019; Delavarpour et al., 2023), and crop desiccation (Liao et al., 2019). Despite this, further research is required to determine subsequent pesticide efficacy from a RPAAS across a range of application parameters like active ingredients, flight speeds, flight heights, and nozzle selection in conjunction with the ultra-low spray volumes to aid in applicator decision-making and provide a basis for potential amendments to future pesticide labels.
A RPAAS at 46.8 L ha-1 provided similar or greater coverage and deposits to the ground equipment at 93.5 L ha-1 across all nozzle types evaluated, excluding the XR nozzle. The RPAAS at 18.7 L ha-1 generally resulted in reduced coverage (<9% total coverage) and deposits (<350 total deposits cm-2) regardless of nozzle type evaluated compared to the other two application setups. Deposited Dv0.5 measured using WSP was generally smaller than the entire droplet distribution measurements from laser diffraction techniques, and minimal differences across application setups within a nozzle type were detected. It may be an indication that the larger droplet diameters were not deposited directly in the center of the flight or drive path and instead were deposited on the outer margins of the nozzle spray patterns, particularly with dual-fan nozzles. Overall, these comparative Dv0.5 results can be useful in future research projects to make predictions between laboratory and field measurements if only one data source is available to the researchers.
Overall, nozzles that produced smaller droplet sizes (XR, 3D-alternating, and 3D-forward) would be recommended for use to enhance coverage and deposition from ground spray equipment; however, spray drift concerns may alter these recommendations. Generally, the 3D-forward nozzle type and arrangement would be recommended on an RPAAS regardless of spray volume when spray drift is less concerning to maximize coverage and deposits. The AITTJ60, AIXR, and TADF nozzle types may be optimum options for RPAAS use though, particularly at 46.8 L ha-1, as they improved total coverage, total deposits, and estimated recovery rate compared to ground spray equipment at 93.5 L ha-1, and produced the greatest droplet sizes which would reduce spray drift potential.
Results of this research demonstrated coverage, deposits, and droplet size obtained in the center of the spray pass from RPAAS at 46.8 L ha-1 can be equivalent to ground spray equipment at 93.5 L ha-1 across a range of nozzle types and therefore may be a viable option for effective pesticide applications. Applications using RPAAS at 18.7 L ha-1 resulted in considerably less coverage and deposits across nozzle types evaluated, and would be at risk for reduced pesticide efficacy. Further research is required to evaluate whether these coverage and deposit amounts from RPAAS at ultra-low volumes would be sufficient to maintain pesticidal efficacy across active ingredients and a wide range of application parameters.
The raw data supporting the conclusions of this article will be made available by the authors, without undue reservation.
TB: Conceptualization, Formal analysis, Funding acquisition, Investigation, Methodology, Writing – original draft, Writing – review & editing. BF: Formal analysis, Investigation, Writing – review & editing. JD: Conceptualization, Investigation, Writing – review & editing. TS: Conceptualization, Investigation, Writing – review & editing.
The author(s) declare financial support was received for the research, authorship, and/or publication of this article. Funding for this research was provided by Checkoff funds distributed through the Arkansas Rice Research and Promotion Board and Arkansas Soybean Promotion Board, as well as publication funding provided by Purdue University. Additional funding was provided by the USDA-ARS, Aerial Application Technology Unit under award number 58-3091-1-015.
The authors wish to thank Mr. Jeff Dickens for contributing time, resources, and expertise to aid in conducting this research with the RPAAS. The authors would also like to thank the numerous research associates and postdoctoral researchers that aided in this project.
The authors declare that the research was conducted in the absence of any commercial or financial relationships that could be construed as a potential conflict of interest.
All claims expressed in this article are solely those of the authors and do not necessarily represent those of their affiliated organizations, or those of the publisher, the editors and the reviewers. Any product that may be evaluated in this article, or claim that may be made by its manufacturer, is not guaranteed or endorsed by the publisher.
ANSI/ASABE. (2020). Spray nozzle classification by droplet spectra (USA: American Society of Agricultural and Biological Engineers). 1–5, S572.3.
Belluco S., Bertola M., Montarsi F., Martino G. D., Granato A., Stella R., et al. (2023). Insects and public health: an overview. Insects 14, 240. doi: 10.3390/insects14030240
Bonds J. A. S., Fritz B., Thistle H. W. (2023). Calculation of swath width and swath displacement for uncrewed aerial spray systems. J. ASABE 66, 523–532. doi: 10.13031/ja.15400
Butts T. R., Butts L. E., Luck J. D., Fritz B. K., Hoffmann W. C., Kruger G. R. (2019). Droplet size and nozzle tip pressure from a pulse-width modulation sprayer. Biosyst. Eng. 178, 52–69. doi: 10.1016/j.biosystemseng.2018.11.004
Creech C. F., Henry R. S., Fritz B. K., Kruger G. R. (2015). Influence of herbicide active ingredient, nozzle type, orifice size, spray pressure, and carrier volume rate on spray droplet size characteristics. Weed Technol. 29, 298–310. doi: 10.1614/WT-D-14-00049.1
Cunha M., Carvalho C., Marcal A. R. S. (2012). Assessing the ability of image processing software to analyse spray quality on water-sensitive papers used as artificial targets. Biosyst. Eng. 111, 11–23. doi: 10.1016/j.biosystemseng.2011.10.002
Delavarpour N., Koparan C., Zhang Y., Steele D. D., Betitame K., Bajwa S. G., et al. (2023). A review of the current unmanned aerial vehicle sprayer applications in precision agriculture. J. ASABE 66, 703–721. doi: 10.13031/ja.15128
FAA. (2024). Drones by the numbers. Available online at: https://www.faa.gov/node/54496 (Accessed April 29, 2024).
FAOSTAT. (2021). Pesticide use database. Available online at: https://www.fao.org/faostat/en/data/RP (Accessed April 29, 2024).
Feng H., Xu P., Yang S., Zheng Y., Li W., Liu W., et al. (2024). Back pressure generated by downwash and crosswind on spatial atomization characteristics during UAV spraying: CFD analysis and verification. Pest Manage. Sci. 80, 1348–1360. doi: 10.1002/ps.7865
Ferguson J. C., Hewitt A. J., O’Donnell C. C. (2016). Pressure, droplet size classification, and nozzle arrangement effects on coverage and droplet number density using air-inclusion dual fan nozzles for pesticide applications. Crop Prot 89, 231–238. doi: 10.1016/j.cropro.2016.07.032
Fritz B. K., Butts T. R. (2024). “Influence of UAV rotor wash on spray droplet atomization: Implications for pesticide application and environmental risk,” in STP1652: 43rd Symposium on Pesticide Formulation and Delivery Systems: Creating Certainty in an Uncertain World. Eds. Dye E., Green T. (PA, USA: ASTM International). In press.
Fritz B. K., Hoffmann W. C., Bagley W. E., Kruger G. R., Czaczyk Z., Henry R. S. (2014a). Measuring droplet size of agricultural spray nozzles - measurement distance and airspeed effects. Atomization Spray 24, 747–760. doi: 10.1615/AtomizSpr.2014008424
Fritz B. K., Hoffmann W. C., Kruger G. R., Henry R. S., Hewitt A. J., Czaczyk Z. (2014b). Comparison of drop size data from ground and aerial application nozzles at three testing laboratories. Atomization Spray 24, 181–192. doi: 10.1615/AtomizSpr.2013009668
Gbur E. E., Stroup W. W., McCarter K. S., Durham S., Young L. J., Christman M., et al. (2012). Analysis of generalized linear mixed models in the agricultural and natural resources sciences (Madison, WI 53711: American Society of Agronomy, Crop Science Society of America, Soil Science Society of America). doi: 10.2134/2012.generalized-linear-mixed-models
Gharde Y., Singh P. K., Dubey R. P., Gupta P. K. (2018). Assessment of yield and economic losses in agriculture due to weeds in India. Crop Prot. 107, 12–18. doi: 10.1016/j.cropro.2018.01.007
Hoffmann W. C., Hewitt A. J. (2005). Comparison of three imaging systems for water-sensitive papers. Appl. Eng. Agric. 21, 961–964. doi: 10.13031/2013.20026
Huang Z., Wang C., Wongsuk S., Qi P., Liu L., Qiao B., et al. (2023). Field evaluation of a six-rotor unmanned agricultural aerial sprayer: effects of application parameters on spray deposition and control efficacy against rice planthopper. Pest Manage. Sci. 79, 4664–4678. doi: 10.1002/ps.7666
Hunter J. E., Gannon T. W., Richardson R. J., Yelverton F. H., Leon R. G. (2020a). Coverage and drift potential associated with nozzle and speed selection for herbicide applications using an unmanned aerial sprayer. Weed Technol. 34, 235–240. doi: 10.1017/wet.2019.101
Hunter J. E., Gannon T. W., Richardson R. J., Yelverton F. H., Leon R. G. (2020b). Integration of remote-weed mapping and an autonomous spraying unmanned aerial vehicle for site-specific weed management. Pest Manage. Sci. 76, 1386–1392. doi: 10.1002/ps.5651
Iost Filho F. H., Heldens W. B., Kong Z., de Lange E. S. (2020). Drones: innovative technology for use in precision pest management. J. Economic Entomology 113, 1–25. doi: 10.1093/jee/toz268
Kim J.-S., Yoon S.-J., Park Y.-J., Kim S.-Y., Ryu C.-M. (2020). Crossing the kingdom border: Human diseases caused by plant pathogens. Environ. Microbiol. 22, 2485–2495. doi: 10.1111/1462-2920.15028
Knoche M. (1994). Effect of droplet size and carrier volume on performance of foliage-applied herbicides. Crop Prot 13, 163–178. doi: 10.1016/0261-2194(94)90075-2
Lake J. R. (1977). The effect of drop size and velocity on the performance of agricultural sprays. Pestic Sci. 8, 515–520. doi: 10.1002/ps.2780080514
Legleiter T. R., Johnson W. G. (2016). Herbicide coverage in narrow row soybean as influenced by spray nozzle design and carrier volume. Crop Prot 83, 1–8. doi: 10.1016/j.cropro.2016.01.009
Liao J., Zang Y., Luo X., Zhou Z., Lan Y., Zang Y., et al. (2019). Optimization of variables for maximizing efficacy and efficiency in aerial spray application to cotton using unmanned aerial systems. Int. J. Agric. Biol. Eng. 12, 10–17. doi: 10.25165/j.ijabe.20191202.4288
Martin D. E., Tang J., Yang Y., Latheef M. A., Fritz B. K., Kruger G. R., et al. (2024). Spray drift characterization of a remotely piloted aerial application system. Appl. Eng. Agric. 40, 385–399. doi: 10.13031/aea.15605
Matthews G., Bateman R., Miller P. (2014). Pesticide Application Methods. 4th Edition (UK: Wiley-Blackwell).
Meng Y., Song J., Lan Y., Mei G., Liang Z., Han Y. (2019). Harvest aids efficacy applied by unmanned aerial vehicles on cotton crop. Ind. Crops Products 140, 111645. doi: 10.1016/j.indcrop.2019.111645
Miller P. C. H., Butler Ellis M. C. (2000). Effects of formulation on spray nozzle performance for applications from ground-based boom sprayers. Crop Prot 19, 609–615. doi: 10.1016/S0261-2194(00)00080-6
Ozkan E. (2024). Drones for spraying pesticides - Opportunities and challenges (The Ohio State University). Available online at: https://ohioline.osu.edu/factsheet/fabe-540 (Accessed April 29, 2024).
Pimentel D. (2009). “Invasive plants: their role in species extinctions and economic losses to agriculture in the USA,” in Management of Invasive Weeds. Ed. Inderjit (Dordrecht, Netherlands: Springer Dordrecht), 1–7. doi: 10.1007/978-1-4020-9202-2_1
Pimentel D., Zuniga R., Morrison D. (2005). Update on the environmental and economic costs associated with alien-invasive species in the United States. Ecol. Economics 52, 273–288. doi: 10.1016/j.ecolecon.2004.10.002
Priess G. L., Norsworthy J. K., Farr R. B., Mauromoustakos A., Butts T. R., Roberts T. L. (2021). Impact of auxin herbicides on Palmer amaranth (Amaranthus palmeri) groundcover. Weed Technol. 35, 768–778. doi: 10.1017/wet.2021.74
Qin W.-C., Qiu B.-J., Xue X.-Y., Chen C., Xu Z.-F., Zhou Q.-Q. (2016). Droplet deposition and control effect of insecticides sprayed with an unmanned aerial vehicle against plant hoppers. Crop Prot. 85, 79–88. doi: 10.1016/j.cropro.2016.03.018
Reed N. H., Butts T. R., Norsworthy J. K., Hardke J. T., Barber L. T., Bond J. A., et al. (2024). Evaluation of row width and nozzle selection on spray coverage and weed control in flooded rice. Weed Technol. 38, e40. doi: 10.1017/wet.2024.25
Research and Markets. (2023). Crop spraying drones market - Forecasts from 2023-2028 (Knowledge Sourcing Intelligence LLP). Available online at: https://www.researchandmarkets.com/report/crop-spraying-drone?utm_source=GNE&utm_medium=PressRelease&utm_code=53t667&utm_campaign=1929771+-+Crop+Spraying+Drones+Market+Forecast+Report+2023-2028%3a+Focus+on+Fixed+Wing+Drones%2c+Rotary+Blade+Drones+%26+Hybrid+Drones&utm_exec=carimspi (Accessed April 29, 2024).
Ristaino J. B., Anderson P. K., Bebber D. P., Brauman K. A., Cunniffe N. J., Fedoroff N. V., et al. (2021). The persistent threat of emerging plant disease pandemics to global food security. Proc. Natl. Acad. Sci. U.S.A. 118, e2022239118. doi: 10.1073/pnas.2022239118
Sapkota M., Virk S., Rains G. (2023). Spray Deposition and Quality Assessment at Varying Ground Speeds for an Agricultural Sprayer with and without a Rate Controller. AgriEngineering 5, 506–519. doi: 10.3390/agriengineering5010033
Shan C., Wang G., Wang H., Xie Y., Wang H., Wang S., et al. (2021). Effects of droplet size and spray volume parameters on droplet deposition of wheat herbicide application by using UAV. Int. J. Agric. Biol. Eng. 14, 74–81. doi: 10.25165/j.ijabe.20211401.6129
Stroup W. W. (2012). Generalized Linear Mixed Models: Modern Concepts, Methods and Applications (Boca Raton, FL, USA: CRC Press, Taylor & Francis Group).
Thacker J. R. M., Hall F. R. (1991). The effects of drop size and formulation upon the spread of pesticide droplets impacting on water-sensitive papers. J. Environ. Sci. Health Part B: Pesticides Food Contaminants Agric. Wastes 26, 631–651. doi: 10.1080/03601239109372760
Vitória E. L., Krohling C. A., Borges F. R. P., Ribeiro L. F. O., Ribeiro M. E. A., Chen P., et al. (2023). Efficiency of Fungicide Application an Using an Unmanned Aerial Vehicle and Pneumatic Sprayer for Control of Hemileia vastatrix and Cercospora coffeicola in Mountain Coffee Crops. Agronomy 13, 340. doi: 10.3390/agronomy13020340
Wang G., Lan Y., Qi H., Chen P., Hewitt A., Han Y. (2019). Field evaluation of an unmanned aerial vehicle (UAV) sprayer: Effect of spray volume on deposition and the control of pests and disease in wheat. Pest Manage. Sci. 75, 1546–1555. doi: 10.1002/ps.5321
Weed Science Society of America (WSSA). (2016). Facts about weeds. 3 (Westminster, CO, USA: Weed Science Society of America (WSSA)).
Yallapa D., Kavitha R., Surendrakumar A., Suthakar B., Kumar A. P. M., Kannan B., et al. (2023). Influence of the downwash airflow in Hexacopter Drone on the spray distribution pattern of boom sprayer. J. Appl. Natural Sci. 15, 391–400. doi: 10.31018/jans.v15i1.4346
Zhan Y., Chen P., Xu W., Chen S., Han Y., Lan Y., et al. (2022). Influence of the downwash airflow distribution characteristics of a plant protection UAV on spray deposit distribution. Biosyst. Eng. 216, 32–45. doi: 10.1016/j.biosystemseng.2022.01.016
Keywords: application technology, carrier volume, droplet size, spray drone, pesticide applications
Citation: Butts TR, Fritz BK, Davis JA and Spurlock TN (2024) Spray coverage and deposits from a remotely piloted aerial application system using various nozzle types. Front. Agron. 6:1493799. doi: 10.3389/fagro.2024.1493799
Received: 09 September 2024; Accepted: 14 October 2024;
Published: 08 November 2024.
Edited by:
Ricardo Alcántara-de la Cruz, Universidade Federal de Viçosa, BrazilReviewed by:
Milan Brankov, Maize research Institute Zemun Polje, SerbiaCopyright © 2024 Butts, Fritz, Davis and Spurlock. This is an open-access article distributed under the terms of the Creative Commons Attribution License (CC BY). The use, distribution or reproduction in other forums is permitted, provided the original author(s) and the copyright owner(s) are credited and that the original publication in this journal is cited, in accordance with accepted academic practice. No use, distribution or reproduction is permitted which does not comply with these terms.
*Correspondence: Thomas R. Butts, YnV0dHN0QHB1cmR1ZS5lZHU=
Disclaimer: All claims expressed in this article are solely those of the authors and do not necessarily represent those of their affiliated organizations, or those of the publisher, the editors and the reviewers. Any product that may be evaluated in this article or claim that may be made by its manufacturer is not guaranteed or endorsed by the publisher.
Research integrity at Frontiers

Learn more about the work of our research integrity team to safeguard the quality of each article we publish.